

Introduction
Age is becoming increasingly important in European politics. By 2100, the over‐65s will account for 31% of Europe's population, compared to 20% today and 10% in the mid‐1980s.Footnote 1 Large age gaps have opened up for voting in countries such as Spain and the United Kingdom, alongside stark differences in turnout across the continent (Blais & Rubenson, Reference Blais and Rubenson2013; Orriols & Cordero, Reference Orriols and Cordero2016; Sloam et al., Reference Sloam, Ehsan and Henn2018; Smets, Reference Smets2012). Here I look beyond demographic change, voting and turnout to investigate a fourth potential source of age divides: ideological polarisation. As I detail below, some sociologists and political scientists argue that ideological age gaps should be growing too, with young people's economic precarity pushing them leftwards on economics at the same time as older voters are moving rightwards on social issues and immigration.
How true are such claims? Existing evidence is incomplete at best, covering only short periods, a handful of countries, or a narrow set of issues. Instead, I use a dataset of over 100 survey questions from all major pan‐European surveys from 1981 to 2018, aggregating them into dimension‐specific ideological scales for age groups. I report three key empirical findings. First, there is ideological polarisation by age on non‐economic issues, but it has not risen since the 1980s. Second, on tax and spending an age gap opened up in the last 20 years, but the young are actually more conservative than the old; they are relatively libertarian rather than more socialist. Third, cohort and period effects are the principal source of evolving age gaps, making polarisation volatile over time rather than permanent.
Ideological polarisation by age: Theory and existing evidence
Compared to older generations, young Europeans face higher unemployment, more insecure labour markets, lower wealth as well as inferior pensions and access to housing. These patterns emerged strongly over the past two decades (Bell & Gardiner, Reference Bell and Gardiner2019; Häusermann et al., Reference Häusermann, Kurer and Schwander2015; Hüttle et al., Reference Hüttle, Wilson and Wolff2015; Lennartz et al., Reference Lennartz, Arundel and Ronald2016; Seeleib‐Kaiser & Spreckelsen, Reference Seeleib‐Kaiser, Spreckelsen, Halvovsen and Hvinde2018). Moreover, many came of age during the financial crisis and its aftermath, an experience that typically leaves cohorts more left‐wing throughout their lives (Giuliano & Spilimbergo, Reference Giuliano and Spilimbergo2014). As a result, some sociologists of youth have predicted growing polarisation over economic issues between age groups, with the ‘proletarianisation’ of youth causing more left‐wing demands for redistribution and government intervention (Bessant et al., Reference Bessant, Farthing and Watts2017; Côté, Reference Côté2014; Furlong & Cartmel, Reference Furlong and Cartmel2007).
Other scholars predict growing age divides over non‐economic issues, exemplified by the Brexit referendum where 66% of the over‐65s voted to leave the European Union and 69% of 18–30s voted to remain (Ehsan & Sloam, Reference Ehsan and Sloam2020). The ‘silent revolution’ theory argues that older people are more socially conservative because younger generations were socialised in a more affluent and liberal era when social equality and post‐material values were more salient, and they are better‐educated and clustered in diverse urban areas. If younger cohorts are outpacing liberalisation amongst older people, this leads to growing polarisation (Grasso et al., Reference Grasso, Farrall, Gray, Hay and Jennings2019; Inglehart, Reference Inglehart2008; Norris & Inglehart, Reference Norris and Inglehart2019). Ross (Reference Ross2018) also finds that growing up amidst European integration and increasingly multiracial societies has eroded nationalism and opposition to immigration amongst the European young, further dividing them from their elders. Norris and Inglehart (Reference Norris and Inglehart2019) argue that a backlash against these progressive social changes has begun to occur amongst older voters, who are turning further against immigration and other social issues, exacerbating polarisation.
Recent elections in countries such as Germany, Great Britain, Ireland and Spain seem to support the view that generational ideological polarisation is growing, featuring strong age differences in party support (Orriols & Cordero, Reference Orriols and Cordero2016; Sloam et al., Reference Sloam, Ehsan and Henn2018). Indeed, journalists often take voting patterns as prima facie evidence of greater ideological polarisation. In the late 2010s, The Independent claimed that “politics is being taken over by children with a pipe dream of returning to the socialism I know doesn't work”Footnote 2, whilst The Economist fretted about a rise in “millennial socialists”, who “suffer from naivety about budgets, bureaucracies and businesses”Footnote 3. On non‐economic issues, culture wars are also said to divide increasingly ‘woke’ young people from the elderly.
However, alternative theoretical perspectives, emphasising positions in the life cycle rather than cohort effects, do not predict growing ideological polarisation by age. In theory, the elderly always have a stronger interest in higher government spending on pensions and healthcare and decreased spending on education (Mulligan & Sala‐i Martin, Reference Mulligan and Martin1999; Poterba, Reference Poterba1997). Some social psychologists also argue that social conservatism rises with age due to natural changes in personality and cognition. Ageing may lead to lower openness to new ideas as well as an increased preference for certainty over ambiguity, traits that are strongly related to social conservatism (Cornelis et al., Reference Cornelis, Van Hiel, Roets and Kossowska2009). Whether due to self‐interest or differences in cognition, these theories suggest that the young and old always hold different views but there is no reason for polarisation to change over time. Consistent with this, a re‐analysis of Norris and Inglehart (Reference Norris and Inglehart2019)'s data by Schäfer (Reference Schäfer2022) finds no evidence of growing generational polarisation for authoritarian values.
Existing empirical work has focused mainly on explaining why mass opinion has changed or why age gaps exist: age, period or cohort effects? Studies of postmaterial and social issues typically report a society‐wide liberalisation of attitudes – period effects – alongside very substantial cohort effects causing the young to be more socially liberal than the old (Andor et al., Reference Andor, Schmidt and Sommer2018; Inglehart, Reference Inglehart2008; Norris & Inglehart, Reference Norris and Inglehart2019; Peterson et al., Reference Peterson, Smith and Hibbing2020). On economic issues, small age divides exist over spending on pensions and healthcare, with somewhat greater divisions over education (Busemeyer et al., Reference Busemeyer, Goerres and Weschle2009; Cattaneo & Wolter, Reference Cattaneo and Wolter2009; Hess et al., Reference Hess, Nauman and Steinkopf2017; Sorensen, Reference Sorensen2013). However, almost none of these studies focus on whether age‐based polarisation in Europe is rising or falling, or why this is. Many also cover only a single country, a single year or a very limited set of political issues. For example, both Norris and Inglehart (Reference Norris and Inglehart2019) and Schäfer (Reference Schäfer2022) rely on European Social Survey data from 2002 to 2014 only, and Busemeyer et al. (Reference Busemeyer, Goerres and Weschle2009) examine four survey questions from 1996. A key reason for this spotty coverage is that existing cross‐national survey data is sparsely and unevenly available, often forcing scholars to rely on only a handful of survey items from a single survey. Data are missing for a lot of countries, years and issues. Even repeated cross‐national surveys appear only occasionally over time. This makes it impossible to assess long‐term change in ideological polarisation by age group using survey questions alone.
The debate about age‐based ideological polarisation is, therefore, far from settled, and we know very little about its long‐term evolution. This article takes an exploratory and descriptive approach, measuring age differences across multiple issue dimensions and many countries from 1981 to 2018. My main aims are to ask (1) whether ideological polarisation by age is increasing, (2) for which, if any, issue dimensions this is true and (3) what explains changes in age‐based polarisation over time.
Data and methods
I do this using a new method developed by Caughey et al. (Reference Caughey, O'Grady and Warshaw2019) and implemented via the dgo package in R (Dunham et al., Reference Dunham, Caughey and Warshaw2017), which converts sets of survey questions into multidimensional scaled ideological positions for subgroups within multiple European countries. It allows many different surveys, covering various time periods, countries and issues, to be aggregated together into scales that have much wider geographic and temporal coverage than is possible using individual survey questions alone. Their approach begins by estimating item response theory (IRT) models using survey questions but differs from previous IRT models in two respects. First, it estimates ideological positions for age groups within each country, rather than individual survey respondents. This facilitates estimating scales for age‐country groups even with just a handful of survey questions when a standard IRT model for individuals would fail due to lack of data. Second, it smooths the estimated ideological positions using a hierarchical model so that country‐years with little or no survey data borrow information from other periods and places. This allows the model to produce estimates in country‐years when survey data are sparse, or unavailable altogether. These features surmount the problem of sparse and unevenly available survey data that have prevented previous studies from examining long‐term changes in ideological polarisation by age group. The model used in this paper is virtually identical to Caughey et al. (Reference Caughey, O'Grady and Warshaw2019), which includes extensive information on its estimation and validation, including the scales’ internal consistency. The Supplementary Information for this contains a more substantial verbal description of the modelling approach.
Underlying the estimated scales are over 100 individual survey questions across a wide range of issues. They are taken from every existing cross‐national European survey, including the European Social Survey, Eurobarometer, International Social Survey Program (ISSP) modules, Pew Global Attitudes Survey and the World Values Survey from 1981 to 2018. These all collect high‐quality random probability samples of the relevant national populations, with survey weights. Twenty‐seven European countries are included.Footnote 4 I follow Caughey et al. (Reference Caughey, O'Grady and Warshaw2019) in estimating scales for four ideological dimensions, each one estimated from a different set of survey questions. These questions are identical to theirs, with the addition of two new years of survey data in 2017 and 2018 and a small number of additional items. The Supplementary Information fully details all survey questions used.
The first scale is labelled social and refers to social and post‐material issues such as the environment, abortion, gender equality and Lesbian, Gay, Bisexual and Transgender (LGBT) rights. The second is immigration and includes questions on immigration and nationalism. The third is labelled relative economic issues and is akin to ‘mood’ (Stimson, Reference Stimson1991), using questions about the economic policy status quo, primarily levels of taxation and government spending. The fourth is absolute economic issues, using questions that ask about economic policy principles, such as the desirability of redistribution in theory. The differential policy status quo across countries means that citizens’ positions on the relative scale, but not the absolute scale, may reflect existing levels of taxation and government spending as much as ideological beliefs, making it vital to separate the two concepts. A country could, over time, desire greater government spending because spending has fallen rather than due to changing views on the desirability of spending in theory, which is captured by the absolute measure. This distinction is also justified by the empirical results of both this paper and Caughey et al. (Reference Caughey, O'Grady and Warshaw2019), which show that the two series are not correlated.
To maximise the availability of survey data for each observation, the scales are estimated for 2‐year periods. They therefore show how left‐wing or right‐wing different age groups have been every 2 years since the 1980s, across four issue dimensions and 27 European countries. With around one million individual survey items each and many parameters, there is a trade‐off between computational complexity and the number of age categories for whom one can estimate ideological positions. I therefore estimated ideological positions for six age categories of 10 years each: those aged 18–27, 28–37, 38–47, 48–57, 58–67 and 68–77. The old are cut off at 77 so as to create groups of equal sizes. This is crucial in allowing a comparison of cohorts over time, as shown below, and, in practice, there are few survey respondents over 77. The estimates start in 1981–1982 for social and absolute economic issues, and in 1985–1986 and 1989–1990, respectively, for relative economic issues and immigration, as these are the first periods in which any survey data are available.
Ideological polarisation over time
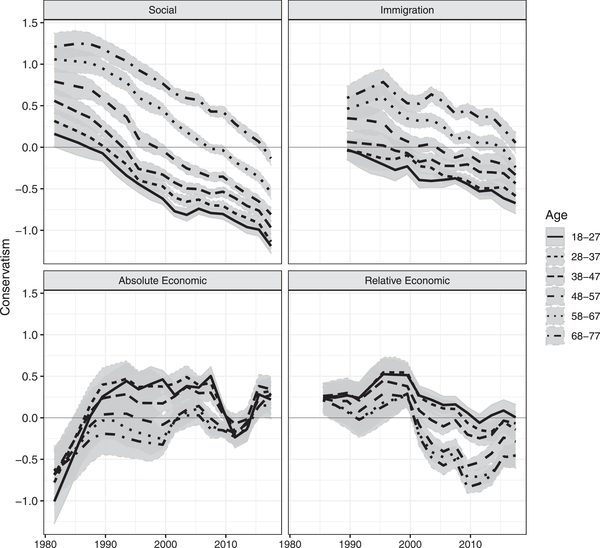
Figure 1 shows how average ideological positions have evolved since 1981 for the six age groups across all 27 countries.Footnote 5 Higher scores on the ideological dimensions always represent greater conservatism, for example, opposition to redistribution, tax and spending, gender equality or immigration. The scales are each identified by setting ideology to have a mean of zero and variance of one across groups and periods.

Figure 1. Trends in average conservatism over time by age group and issue domain across European Countries, 1981–1982 to 2017–2018 [lines = posterior means, shading = 95% credible intervals, higher values = more conservative].
Clear age differences on social issues are evident, alongside a broad liberalisation of opinion for all age groups. Scores should be interpreted as standard deviations from the overall mean of zero. Changes in social conservatism have been substantively large over time: about 1.3 standard deviations for 68–77 year‐olds from the early 1980s to the late 2010s. This is almost identical to the model‐estimated difference between the average 68–77 year‐olds in 2017–2018 in Hungary – one of the most socially conservative countries – and socially liberal Germany. In the 2018 European Social Survey (ESS), which is in the scale, 30% of 68–77 year‐olds in Hungary strongly disagreed with the statement ‘gay men and lesbians should be free to live their life as they wish’, whereas just 2% did so in Germany.
However, my main interest here is in differences between age groups: polarisation. In the average European country, the ideological gap between the youngest and oldest age groups on social issues has barely changed over time, remaining relatively constant at around 1 standard deviation. Hungary again serves as a useful illustration, where in 2017–2018 the model‐estimated difference between the youngest and oldest age groups was close to the overall average of 1 (see Figure 2). In the 2018 ESS, 48% of Hungarian 68–77 year‐olds either disagreed or strongly disagreed with the same statement about LGBT rights above, compared to 26% of 18–27 year‐olds. This shows that although age differences are unchanged, Europeans have liberalised so much that a majority of all age groups in one of the most conservative countries is not opposed to freedom for LGBT people, a point also made by Schäfer (Reference Schäfer2022). Polarisation certainly exists but is not overwhelmingly large. Figure 1 also shows that the youngest four age groups have become less distinguishable over time; the main difference today is between the oldest citizens and all others. On immigration, a slightly smaller age gradient has persisted as European countries slowly became more pro‐immigration. Here too, age differences have scarcely changed over time. Overall, ideological differences by age on social issues and immigration are no larger today than they were in the 1980s.

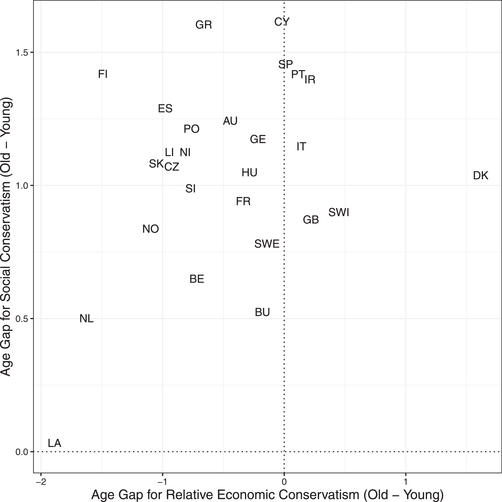
Figure 2. Age differences in conservatism (old minus young) by country for social issues and relative economic issues, 2017–2018 [difference in posterior means between 68–77 year‐olds and 18–27 year‐olds, by country. Positive = old people more conservative than young people].
Until recently, young Europeans were somewhat more conservative than the old in absolute terms, but age gaps have narrowed over the past decade, becoming very modest. For relative economic conservatism, age gaps widened from the late 1990s as the young became more opposed to taxing and spending than the elderly. Although it narrowed a little over the 2010s, at the end of the 2010s the age gradient in opinion on relative economic issues remained almost as large as for immigration but in the opposite direction. Millennials and their younger counterparts would be better described as relatively libertarian rather than relatively socialist: more socially liberal than older people, but also favouring smaller government. This finding may be surprising.Footnote 6 In the Supplementary Information, I show that this aggregate measure faithfully reflects trends in the individual survey questions that comprise it; disaggregating by spending area does not alter these conclusions. Only on education spending young Europeans are less conservative, but the gap has narrowed since the 1990s. And as with social issues, there is substantial generational agreement: majorities of both the young and old support higher pension spending, for instance.
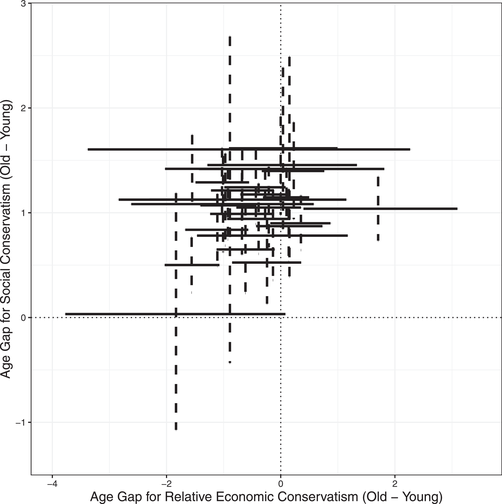
To examine possible cross‐country differences, Figure 2 plots estimates of the age gap between the youngest and oldest groups for social issues and relative economic issues in 2017–2018, and Figure 3 plots 95% credible intervals around them. Variation across countries is mostly modest. In terms of mean differences, 20 of the 27 countries occupy the upper left libertarian quadrant, where the young are more liberal on social issues but more conservative on tax and spending. Young people in Eastern European countries are uniformly more libertarian, with generational differences on relative economic issues smaller in Western and Southern Europe. Figure 3 shows that in only two countries can the youngest and oldest not be distinguished statistically in their ideology on social issues, but in several places they are not statistically different in terms of relative economic conservatism. No country except Denmark, however, shows any evidence that the young prefer higher tax and spending than the old. Figures S5 and S6 in the Supplementary Information show Figure 1 separately for Eastern and Western European countries. Although all age groups in Eastern Europe have liberalised more slowly on non‐economic issues – consistent with a later arrival of the silent revolution there (Walczak et al., Reference Walczak, Van der Brug and de Vries2012) – age polarisation has evolved almost identically in all regions across all dimensions. Whether one looks at Europe as a whole, at individual countries or at European regions, the conclusions about polarisation are the same.

Figure 3. 95% credible intervals for age differences in conservatism (old minus young) by country for social issues and relative economic issues, 2017–2018 [dashed = social issues, lines = relative economic issues].
Cohort patterns
Why has age‐based polarisation not grown over time? To answer this question, I convert the results for age groups into birth cohorts, using the fact that by looking 10 years apart, we observe the same cohort on multiple occasions. For example, those aged 18–27 in 1987–1988 will be 38–47 in 2007–2008.Footnote 7
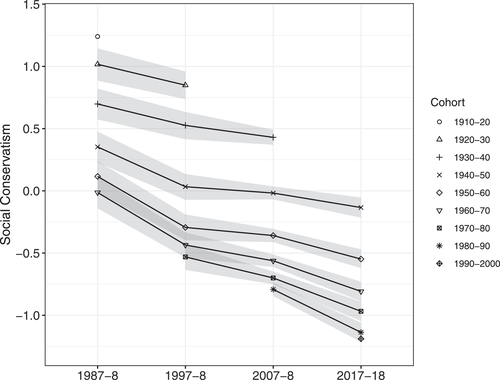
I start with social issues, where age differences are largest. The evolution of each cohort's ideological position from 1987–1988 to 2017–2018 (mean positions and 95% credible intervals) is shown in Figure 4. Some intra‐cohort liberalisation is clear for all cohorts. However, within‐cohort change did not keep pace with overall change. The three generations for which we have complete data liberalised by substantially less than the total change for age groups in Europe over the period. On the other hand, diagonal comparisons across periods and cohorts show different cohorts at the same ages. The 1960–1970 cohort was aged 18–27 in 1987–1988 with an estimated ideology of −0.014, compared to the 1970–1980 cohort who were 18–27 in 1997–1998 with an estimated ideology of −0.53. This shows that in addition to within‐cohort change there have been large cohort replacement effects. Each cohort began its political life more liberal than its predecessor and maintained this distinctiveness over time.

Figure 4. Social conservatism by birth cohort in Europe, 1987–1988 to 2017–2018 [higher values = more conservative, grey shading = 95% credible intervals].
Thus age gaps in ideology on social issues have persisted (Figure 1) because despite all cohorts liberalising over time, each new cohort has also been persistently more socially liberal than its predecessor. The combination of within‐cohort and cohort replacement effects left polarisation between different age groups roughly unchanged. There is some evidence that these cohort effects are slowing down. Younger cohorts are more homogenous than older ones, beginning their political lives closer to the middle‐aged than in the past. This helps explain why, in Figure 1, the greatest age difference is observed between the oldest citizens, and the middle‐aged and below.
Figure 4 unambiguously demonstrates large cohort effects, but aggregate data on cohorts cannot separate out age and period effects as explanations for within‐cohort change. Theoretically, period effects are the more likely explanation. Existing theories of ageing predict greater conservatism as a natural feature of ageing, and that age effects should primarily kick in as people go past middle age. Yet Figure 2 shows that all cohorts became more left‐wing on social issues, and that this continued when cohorts became elderly. It was not the case that the elderly turned more conservative while the young became more liberal. Period effects, as the prevailing social climate became more socially liberal, are a much more plausible explanation for why all cohorts liberalised throughout their lives.
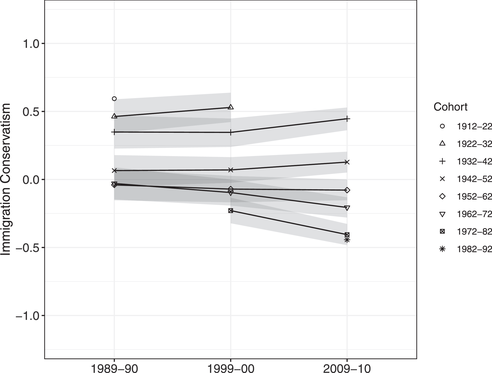
Figures 5 and 6 do the same exercise for immigration and relative economic issues for 1989–1989 to 2009–2010 and 1987–1988 to 2017–2018, respectively, because the immigration data do not start until 1989–1990. For immigration, within‐cohort changes were mostly negligible, although since 2000 there was some increased conservatism amongst older cohorts, consistent with a backlash against Europe's prevailing liberal consensus on the issue (Norris & Inglehart, Reference Norris and Inglehart2019). As with social issues, cohort replacement effects were large and consequential, with new cohorts more pro‐immigration than their predecessors at equivalent ages.

Figure 5. Immigration conservatism by birth cohort in Europe, 1989–1990 to 2009–2010 [higher values = more conservative, grey shading = 95% credible intervals].

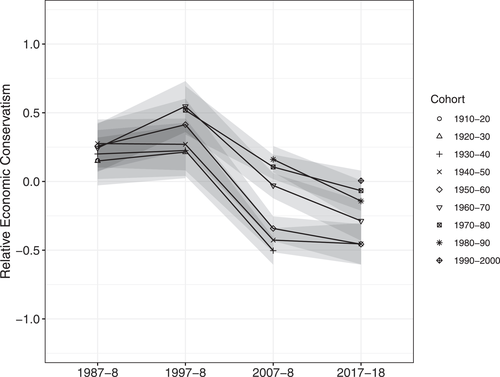
Figure 6. Relative economic conservatism by birth cohort in Europe, 1987–1988 to 2017–2018 [higher values = more conservative, grey shading = 95% credible intervals].
For relative economic issues, within‐cohort changes were larger than for either immigration or social issues, and their direction also fluctuated over time. Cohorts tended to change together over time, but behaved differently at equivalent ages. The 1950–1960 cohort became more conservative over the 1987/1988 to 1997/1998 period as they aged from 28–37 to 38–47 whilst between the same ages, the 1970–1980 cohort became more left‐wing from 2007/2008 to 2017/2018. In other words, period effects operating on all cohorts at once were dominant. Effects of ageing, on the other hand, would imply that at equivalent ages cohorts changed in the same way. This is intuitive: changes in the size of governments as well as economic booms and busts occur more often and more rapidly than the kinds of social change that influence social conservatism. Since the mid‐1990s, new cohorts such as Millennials did in fact begin their political lives more left‐wing than previous cohorts were at an equivalent age: compare the 1970–1980 cohort at ages 18–27 (in 1997–1998) to the 1980–1990 cohort at the same age (in 2007–2008). But within‐cohort change has outpaced the impact of these cohort replacement effects. Older cohorts became so much more left‐wing over the financial crisis and its aftermath that at a given time, older age groups were more left‐wing. Period effects – but amongst groups older than millennials – have been the predominant influence.
Conclusion
This paper carried out a comprehensive examination of age differences in ideologies in Europe since the 1980s, addressing unresolved theoretical and empirical debates. Some sociologists and political scientists such as Côté (Reference Côté2014) and Norris and Inglehart (Reference Norris and Inglehart2019) have predicted widening generational gaps on both economic and social issues, with the media depicting young Europeans as increasingly socialist and ‘woke’ in the wake of widening age gaps in terms of vote choice. Other scholars have cast doubt on this, whether taking issue with previous empirical analyses (Schäfer, Reference Schäfer2022) or arguing that age rather than cohort effects dominate (e.g., Mulligan & Sala‐i Martin (Reference Mulligan and Martin1999)). My analysis helped resolve these debates by extending the analysis of age polarisation over a much longer time period, more issue dimensions and more countries than any previous study.
I found no evidence that the young and old are becoming increasingly ideologically opposed. Nor is it true that young Europeans today are much more socialist than the elderly, or that age divisions over ‘woke’ issues are wider than in the past. In most places, the young are more opposed to tax and government spending than the elderly. Today's age divides over social issues and immigration are similar in size to the 1980s and if anything are starting to fall, as the young and middle‐aged become more similar. And despite these age gaps, on issues such as LGBT rights and pension spending, majorities of the young and old support the same policies. However, age effects do not explain why polarisation over non‐economic issues has remained fairly constant: there is little evidence that ageing naturally leads to greater conservatism. Today's age divides have arisen from a sometimes complex interaction of cohort and period effects, with cohort effects especially important for social issues and immigration. Hence age‐based polarisation need not be a permanent or natural feature of European politics but depends on changing social, political and economic climates. If cohort replacement effects for social issues continue to slow down, age divides will fall.
If ideological age gaps are largely unchanged, why have age gaps for voting widened recently? A likely explanation is that the emergence of new parties with more extreme positions on social issues and immigration over the past 30 years – and more emphatic communication of these stances – has helped the young and old to better express their long‐standing non‐economic differences when voting. Age divides might appear to have grown due to the actions of parties, but in reality young and old voters in Europe are not more polarised than in the past.
Online Appendix
Additional supporting information may be found in the Online Appendix section at the end of the article:
Data S1
Table S1: Datasets Used
Table S2: Variables included in the Absolute Economic Scale
Table S3: Variables included in the Relative Economic Scale
Table S4: Variables included in the Social and Postmaterial Issues Model
Table S5: Variables included in the Immigration Model
Figure S1: Differences in mean preference between old and young for higher government spending in four policy areas (ISSP Role of Government Surveys), and associated 95% confidence intervals [positive = old people more conservative]
Figure S2: Differences in mean preference between old and young on inequality, benefits spending and progressive taxation (ISSP Inequaity Surveys), and associated 95% confidence intervals [positive = old people more conservative]
Figure S3: Differences in mean preference between old and young for higher government spending in four policy areas (ISSP Role of Government Surveys), and associated 95% confidence intervals, by country and year
Figure S4: Differences in mean preference between old and young on inequality, benefits spending and progressive taxation (ISSP Inequality Surveys), and associated 95% confidence intervals, by country and year
Figure S5: Trends in conservatism over time by age group and issue domain in Western Europe, 1981‐82 to 2017‐18.
Figure S6: Trends in conservatism over time by age group and issue domain in Eastern Europe, 1981‐82 to 2017‐18.


 Open access