


Introduction
Development in midlife and older adulthood is characterised by heterogeneity, and it is not uncommon for people of similar ages to experience vastly different outcomes in terms of health and quality of life. Among the many factors that contribute to ageing well, a continuing involvement in meaningful activities and the maintenance of social connections have consistently been identified by researchers (Courtin and Knapp Reference Courtin and Knapp2017; Depp and Jeste Reference Depp and Jeste2006) and older adults alike (Jopp et al. Reference Jopp, Wozniak, Damarin, De Feo, Jung and Jeswani2015), including across cultures (Reich et al. Reference Reich, Claunch, Verdeja, Dungan, Anderson, Clayton, Goates and Thacker2020). In the present study, we add to the emerging research evidence concerning ageism and wellbeing that has to date primarily focused on mental health (for a review, see Kang and Kim Reference Kang and Kim2022), by focusing on links between ageism and engagement. Specifically, we examined associations of (1) biologically based risk factors (poor functional health and cognitive ability) and (2) self-reported experiences of ageism and stereotypes related to ageing, with measures of engagement with life (number of close social connections and the degree to which activities provide a sense of meaning) in a community sample of older adults. In addition to considering main effects of ageism, we also considered possible moderating effects. Of key interest was whether associations of poorer health and worse cognitive performance with lower engagement with life would be less evident among older adults who reported less frequent experience of ageism, and who displayed more positive stereotypes about ageing.
Potential barriers to engagement for older adults
While many older adults maintain engagement with life, research suggests that those in poorer health report overall lower levels of engagement. For example, studies have found that decreases in functional ability act as a barrier to social and leisure activity participation (Duppen et al. Reference Duppen, Lambotte, Dury, Smetcoren, Pan, De Donder, Smetcoren, Dury, De Donder and De Witte2019; Galenkamp et al. Reference Galenkamp, Gagliardi, Principi, Golinowska, Moreira, Schmidt, Winkelmann, Sowa, van der Pas and Deeg2016; Sabbath et al. Reference Sabbath, Matz-Costa, Rowe, Leclerc, Zins, Goldberg and Berkman2016; Strain et al. Reference Strain, Grabusic, Searle and Dunn2002), religious activity (Sowa et al. Reference Sowa, Golinowska, Deeg, Principi, Casanova, Schulmann, Ilinca, Rodrigues, Moreira and Gelenkamp2016) and volunteering (Principi et al. Reference Principi, Galenkamp, Papa, Socci, Suanet, Schmidt, Schulmann, Golinowska, Sowa and Moreira2016). Zimmer et al. (Reference Zimmer, Hickey and Searle1997) found that older adults with arthritis were more likely than those without arthritis to cease leisure activities. Severity of physical impairment was a strong predictor for withdrawal from various aspects of daily life such as leisure activity participation, although those with access to social and other resources were generally able to replace discontinued activities with new, less physically demanding ones (Principi et al. Reference Principi, Galenkamp, Papa, Socci, Suanet, Schmidt, Schulmann, Golinowska, Sowa and Moreira2016; Sabbath et al. Reference Sabbath, Matz-Costa, Rowe, Leclerc, Zins, Goldberg and Berkman2016; Zimmer et al. Reference Zimmer, Hickey and Searle1997).
There is also considerable evidence linking cognitive impairment with lower engagement in social and leisure activities (Evans et al. Reference Evans, Martyr, Collins, Brayne and Clare2019; Krueger et al. Reference Krueger, Wilson, Kamenetsky, Barnes, Bienias and Bennett2009; Leung et al. Reference Leung, Fung, Tam, Lui, Chiu, Chan and Lam2010; Mast Reference Mast2005), although the direction of causality is less clear. Engagement in cognitively enriching activities could potentially slow cognitive decline (Fratiglioni et al. Reference Fratiglioni, Wang, Ericsson, Maytan and Winblad2000; Wang et al. Reference Wang, Karp, Winblad and Fratiglioni2002; Windsor et al. Reference Windsor, Ghisletta and Gerstorf2020) through mechanisms such as enhancing cognitive reserve (Scarmeas and Stern Reference Scarmeas and Stern2003). Further, a meta-analysis indicated that low social engagement is related to more rapid cognitive decline (Kuiper et al. Reference Kuiper, Zuidersma, Zuidema, Burgerhof, Stolk, Oude Voshaar and Smidt2016). However, Kuiper et al. (Reference Kuiper, Zuidersma, Zuidema, Burgerhof, Stolk, Oude Voshaar and Smidt2016) also noted the difficulty of excluding the possible effects of reverse causality. Some longitudinal research points to cognitive decline being associated with subsequent declines in social engagement (Aartsen et al. Reference Aartsen, Van Tilburg, Smits and Knipscheer2004; Evans et al. Reference Evans, Martyr, Collins, Brayne and Clare2019), and contemporary theoretical perspectives suggest that declining cognitive resources are likely to restrict social engagement (Hess Reference Hess2014; Huxhold et al. Reference Huxhold, Fiori and Windsor2022). In the present cross-sectional analysis, we treat poorer performance on a category fluency task (a measure of cognitive flexibility, self-monitoring ability and verbal knowledge) as a risk factor for lower levels of engagement, though we also acknowledge that low engagement may contribute to poorer cognitive ability.
Effects of ageism and age-related stereotypes on engagement with life
In addition to examining biologically based risk factors, we also considered how two aspects of ageism – specifically (1) age-related stereotypes and (2) frequency of perceived discrimination based on age – relate to engagement with life. Ageism has been defined as ‘any prejudice or discrimination against or in favour of an age group’ (Redman and Snape Reference Redman and Snape2002: 357). Prejudice refers to a negative stereotype about or attitude towards that group, and discrimination refers to inappropriate, generally negative treatment of that group (Palmore Reference Palmore1999). Age-based attitudes can be positive or negative; however, the greater research focus on negative forms of ageism reflects its generally detrimental impact on individuals and societies (Levy and Macdonald Reference Levy and Macdonald2016). Ageism is ubiquitous in Western society and manifests in individual perceptions and behaviours, organisational rules and regulations, and cultural values (Ayalon and Tesch-Römer Reference Ayalon, Tesch-Römer, Ayalon and C2018). The influence of ageism on individuals is complex and evolves over the lifespan. For example, an awareness of negative age-related stereotypes can lead to positive self-perceptions among older adults who do not perceive those stereotypes as self-relevant (via processes of downward social comparison; Stewart et al. Reference Stewart, Chipperfield, Ruthig and Heckhausen2013). However, with advancing age, awareness of negative stereotypes about age and ageing increasingly poses a threat to self-image (Pinquart Reference Pinquart2002). Stereotype embodiment occurs when negative beliefs about ageing are assimilated from the surrounding culture and become internalised and self-relevant, potentially resulting in poorer health (Levy, Slade and Gill Reference Levy, Slade and Gill2006; Levy, Slade, May and Caracciolo Reference Levy, Slade, May and Caracciolo2006), cognitive performance (Lamont et al. Reference Lamont, Swift and Abrams2015) and psychosocial outcomes (Emile et al. Reference Emile, d’Arripe-Longueville, Cheval, Amato and Chalabaev2014). Research suggests that more negative views of growing older are likely to result in reduced engagement (Diehl et al. Reference Diehl, Wahl, Barrett, Brothers, Miche, Montepare, Westerhof and Wurm2014), and a recent study showed that older adults who perceived more ageing-related losses also reported less engagement with life compared with those who perceived fewer losses (Windsor et al. Reference Windsor, Abbott, Cations, Howard and Wilton-Harding2022).
Older adults often report being the target of ageism (Giasson et al. Reference Giasson, Queen, Larkina and Smith2017; Jackson et al. Reference Jackson, Hackett and Steptoe2019) and ageism and intergenerational tensions may have recently increased as a result of the negative public discourse devaluing the lives and societal contributions of older adults during the Covid-19 pandemic (Ayalon Reference Ayalon2020; Swift and Chasteen Reference Swift and Chasteen2021). Like negative embodied stereotypes, perceived ageism can also have negative effects on older adults’ general wellbeing and may result in reduced participation in activities or social relationships (Swift et al. Reference Swift, Abrams, Lamont and Drury2017). The perception that others hold negative views of ageing can lead to negative outcomes such as disengagement from activities (Swift et al. Reference Swift, Abrams, Lamont and Drury2017; von Hippel et al. Reference von Hippel, Kalokerinos and Henry2013). Shiovitz-Ezra et al. (Reference Shiovitz-Ezra, Shemesh, McDonnell-Naughton, Ayalon and C2018) suggested that age discrimination likely leads some older adults to withdraw socially to avoid further rejection.
The present study
In the present study we sought to move beyond a consideration of the main effects of ageism, to considering how experiences of ageism may interact with other known age-related vulnerabilities in their combined relationship with engagement with life and number of close social connections. Specifically, we examine age-related stereotypes and frequency of perceived ageism as possible moderators of the associations between biologically based risk factors (physical health and cognition) and indices of engagement with life. Such moderating effects could arise from the role of embodied stereotypes and perceived ageism in influencing processes of adaptation and self-regulation in response to losses in physical and cognitive resources (e.g., Boerner and Jopp Reference Boerner and Jopp2007; Brandtstadter and Rothermund Reference Brandtstadter and Rothermund2002).
In broad terms, lifespan theories of self-regulation focus on the ways in which individuals select, manage, engage with and disengage from goals as they navigate developmental opportunities and constraints. Central to adaptative potential is the ability to flexibly disengage from blocked goals where appropriate (e.g., retiring from a demanding sport owing to recurrent injuries) and to re-engage with new valued goals (e.g., taking up a new and less taxing leisure pursuit; Brandtstadter and Rothermund Reference Brandtstadter and Rothermund2002). According to Levy’s (Reference Levy2009) stereotype embodiment theory, negative beliefs about ageing can thwart developmental potential by creating negative expectations about the future that act as self-fulfilling prophecies. Moreover, those who expect to be in poor health as they age may be less likely to participate in healthy behaviours as they see poor health outcomes as inevitable.
It is plausible that those with more negative views of ageing are less likely to proactively engage in the processes of goal re-engagment needed to optimise developmental potential in the context of ageing-related resource losses (including physical and cognitive decline). Instead, for those with negative embodied stereotypes, such losses and concomitant declines in opportunities for engagement may be viewed as a ‘normal’ part of ageing. Thus, we expected that associations of poorer physical health and category fluency with lower levels of engagement with life would be stronger among those exhibiting more negative, as opposed to more positive, beliefs about ageing. We also expected frequency of perceived ageism to show a similar moderating role. Perceived ageism may make negative stereotypes about ageing more salient (e.g., Nelson Reference Nelson2016) and older adults experiencing ageism may also be actively socially excluded, and less likely to seek social engagement with others (Swift et al. Reference Swift, Abrams, Lamont and Drury2017). Thus, a combination of biological resource losses and perceived ageism may be particularly detrimental to remaining engaged in later life.
The first aim of the study was to examine whether age-related stereotypes and frequency of perceived ageism have direct associations with engagement with life. Meaningful activity engagement was assessed using the Life Engagement Test (Scheier et al. Reference Scheier, Wrosch, Baum, Cohen, Martire, Matthews, Schulz and Zdaniuk2006). This measure captures the perceived meaning associated with daily activities (akin to sense of purpose) rather than activity engagement per se, allowing for the potential of participants to derive meaning from varying types and levels of activity in accordance with their personal values and goals. Number of close social connections was assessed as a proxy for social engagement, consistent with previous studies (Krueger et al. Reference Krueger, Wilson, Kamenetsky, Barnes, Bienias and Bennett2009; Sharifian et al. Reference Sharifian, Manly, Brickman and Zahodne2019). The second aim was to clarify whether age-related stereotypes and frequency of perceived ageism moderate associations of biologically based risk factors (physical health, and cognitive health assessed using a measure of category fluency) with engagement. To that end, we hypothesised the following:
Hypothesis 1: More positive age-related stereotypes will be associated with greater engagement with life and more ‘close’ social connections.
Hypothesis 2: More frequent perceived ageism will be associated with lower engagement with life and fewer close social connections.
Hypothesis 3: Negative associations of biologically based risk factors (poor health and cognition) with relevant outcomes (life engagement and number of close social connections) will be stronger among those who express more negative age-related stereotypes.
Hypothesis 4: Negative associations of biologically based risk factors (poor health and cognition) with relevant outcomes (life engagement and number of close social connections) will be stronger among those who report more frequent perceived ageism.
Method
Study design and participants
The current study involved a cross-sectional quantitative telephone survey. Predictor variables included self-rated health, cognitive function, age-related stereotypes and perceived ageism. Outcome variables included engagement with life and total number of close relationships. Covariates included age, sex, partner status and education.
Following approval from the Flinders University Human Research Ethics Committee (approval number 8172), a community-based sample of 431 Australian adults was recruited in 2019. Residents living in the Onkaparinga council area of South Australia were randomly sampled from listed landline telephone numbers and invited to participate in a cross-sectional survey. Once verbal informed consent was obtained, participants completed a 25-minute (M = 25.03, range = 19–37 minutes) telephone survey, which included questions related to social connections, quality of life and engagement (only measures used in the current analysis are detailed in this article). Recruitment and data collection were conducted by a social research company. A standardised survey protocol was developed to ensure consistency between interviewers. Call-backs were arranged when requested.
The final sample of 287 included in this study consisted of those who completed verbal fluency testing. Participants were aged 65–103 years (M = 76.41, SD = 7.13; 54.4 per cent female). Most of the sample spoke English as their first language (97.9 per cent) and were no longer in the workforce (95.4 per cent). The sample on average completed 12.6 years (SD = 2.64) of education, and 64.8 per cent of participants were married or in de facto relationships. Our sample was comparable to the general population aged 65+ within the same council area (Australian Bureau of Statistics 2021) in terms of sex (sample % female = 54.4, population % female = 53.8) and marital status (sample % partnered = 64.8, population % partnered = 64.6) but included a higher proportion of retirees (sample % retirees = 95.4, population % retirees = 88.7). Power analysis using Stata’s ‘powerreg’ module indicated that, with α = 0.05, nine predictor variables and, assuming a total R 2 of 0.25, N of 236 would be needed to detect a significant effect of an individual predictor uniquely accounting for 2.5 per cent of the variance with 80 per cent power, suggesting that our sample size was adequate.
Measures
Engagement with life. The Life Engagement Test (LET) was used to measure the extent to which a person engages in activities that they find meaningful and purposeful (Scheier et al. Reference Scheier, Wrosch, Baum, Cohen, Martire, Matthews, Schulz and Zdaniuk2006). The LET includes six items assessed using five-point scale responses asking participants to state the extent of their agreement with each statement (e.g., ‘To me, the things I do are all worthwhile’). Three of the items are reverse-coded. Responses to the six items are summed, producing a total LET score ranging from 5 to 30, with higher scores indicating greater life engagement. The LET has been demonstrated to have good internal consistency (average α = 0.80) and convergent and discriminant predictive validity (Scheier et al. Reference Scheier, Wrosch, Baum, Cohen, Martire, Matthews, Schulz and Zdaniuk2006).
Total number of close relationships. Number of close social connections was used as a proxy measure for social engagement. This was measured using an adaptation of network size questions by Rafnsson et al. (Reference Rafnsson, Shankar and Steptoe2015). Participants were asked how many children, relatives and friends they would say they had a close relationship with. Responses to these questions were summed, giving a total count of close relationships for each participant. There was no upper limit of close relationships the participants could endorse.
Biologically based risk factors
Self-rated health was assessed using a subscale comprising five health-related items from the Older People’s Quality of Life questionnaire (Bowling Reference Bowling2009), per the recommendations in Scott et al. (Reference Scott, Mazzucchelli, Luszcz and Windsor2023), who identified a superior factor structure for the health subscale in the current sample using this item subset (see Scott et al. Reference Scott, Mazzucchelli, Luszcz and Windsor2023 for the relevant items). Participants were asked to state how much they agreed or disagreed with certain statements (e.g., ‘I have a lot of energy’ or ‘pain affects my wellbeing’) on a scale of 1 to 5, with items reverse-scored as appropriate. These responses were then summed to provide an overall subjective health score, with higher scores indicating better health. The revised scale as described in Scott et al. (Reference Scott, Mazzucchelli, Luszcz and Windsor2023) demonstrated measurement invariance across age and sex.
Cognitive performance was measured using a category fluency task. This is widely used as a measure of verbal ability and executive function (higher-order cognitive processes including inhibition, volition, flexibility and goal-directed behaviour) in neuropsychological clinical and research contexts (Lezak et al. Reference Lezak, Howieson, Bigler and Tranel2012). Previous research has shown that over-the-phone administration of this task produces scores stratified by age, sex and education that are comparable to those generated with in-person administration, supporting reliability and validity (Marceaux et al. Reference Marceaux, Prosje, McClure, Kana, Crowe, Kissela, Manly, Howard, Tam, Unverzagt and Wadley2019). Participants are asked to produce as many unique words as possible in a semantic category. In this study participants were asked to produce words over three 60-second trials in the categories of animals, fruits and vegetables. The numbers of correct responses within each trial were totalled to produce an overall category fluency score for each participant (Strauss et al. Reference Strauss, Sherman and Spreen2006). Performance on this task was audio recorded to enable accurate transcription and scoring.
Stereotypes of ageing
Stereotypes of ageing were measured using a single-item open-ended qualitative response format that has been widely used previously (Levy and Langer Reference Levy and Langer1994; Levy, Slade and Gill Reference Levy, Slade and Gill2006, Levy et al. Reference Levy, Slade, Murphy and Gill2012, Reference Levy, Slade, Chung and Gill2014, Reference Levy, Slade and Lampert2019). Participants were asked ‘When you think of older people in general, what are the first five words or phrases that come to mind?’ (common responses included ‘wise’, ‘slow’, ‘lonely’, ‘kind’, ‘frail’, ‘knowledgeable’). Each response was rated for the extent to which it represented a positive or negative view of ageing by three independent raters (two younger adults and one older adult) using a scale ranging from 1 (very negative) to 5 (very positive). As the inter-rater reliability was high (r = 0.93, r = 0.87, r = 0.87 for raters 1 and 2, 2 and 3, and 1 and 3, respectively), a single age-related stereotypes score was calculated for each participant, based on the mean of the three raters’ scores (higher scores indicate more positive age-related stereotypes and lower scores represent more negative age-related stereotypes). Several studies have demonstrated the predictive validity of this method of assessing age-related stereotypes (Levy and Langer Reference Levy and Langer1994; Levy, Slade and Gill Reference Levy, Slade and Gill2006; Levy et al. Reference Levy, Slade, Murphy and Gill2012), and it demonstrates good convergent validity with the Image of Ageing Scale (Levy et al. Reference Levy, Kasl and Gill2004).
Perceived ageism
The perceived ageism measure used three questions taken from the European Social Survey (European Social Survey 2008) that are reported to have good internal consistency, ∝ = 0.85 (Hh-s and Jung Reference Kim and Jung2021). These asked participants about their experiences of age discrimination including being treated unfairly, being shown a lack of respect or insulted or abused (e.g., ‘How often in the past year has anyone treated you badly because of your age, for example by insulting you, abusing you or refusing you services?’). The three items were measured using a five-point scale with possible responses ranging from 0 (never) to 4 (very often). Individual responses were summed creating an overall frequency of perceived ageism score (higher scores indicate more frequent perceived ageism).
Covariates
Age (in years), partner status (0 = not currently partnered, 1 = currently partnered), sex and education were controlled for in the analyses. This is owing to previous research finding associations among these factors, ageism and wellbeing (Hsu and Barrett Reference Hsu and Barrett2020; Krekula et al. Reference Krekula, Nikander, Wilińska, Ayalon and Tesch-Römer2018; Pinquart and Sörensen Reference Pinquart and Sörensen2003; Rippon et al. Reference Rippon, Kneale, de Oliveira, Demakakos and Steptoe2014; Sandfield and Percy Reference Sandfield and Percy2003; Smith and Wesselbaum Reference Smith and Wesselbaum2024; Swift et al. Reference Swift, Vauclair, Abrams, Bratt, Marques and Lima2014). Participants were asked to provide their highest level of education completed and responses were re-coded into a continuous variable representing an estimate of total years of education. Descriptive statistics and bivariate correlations among study variables are reported in Table 1.
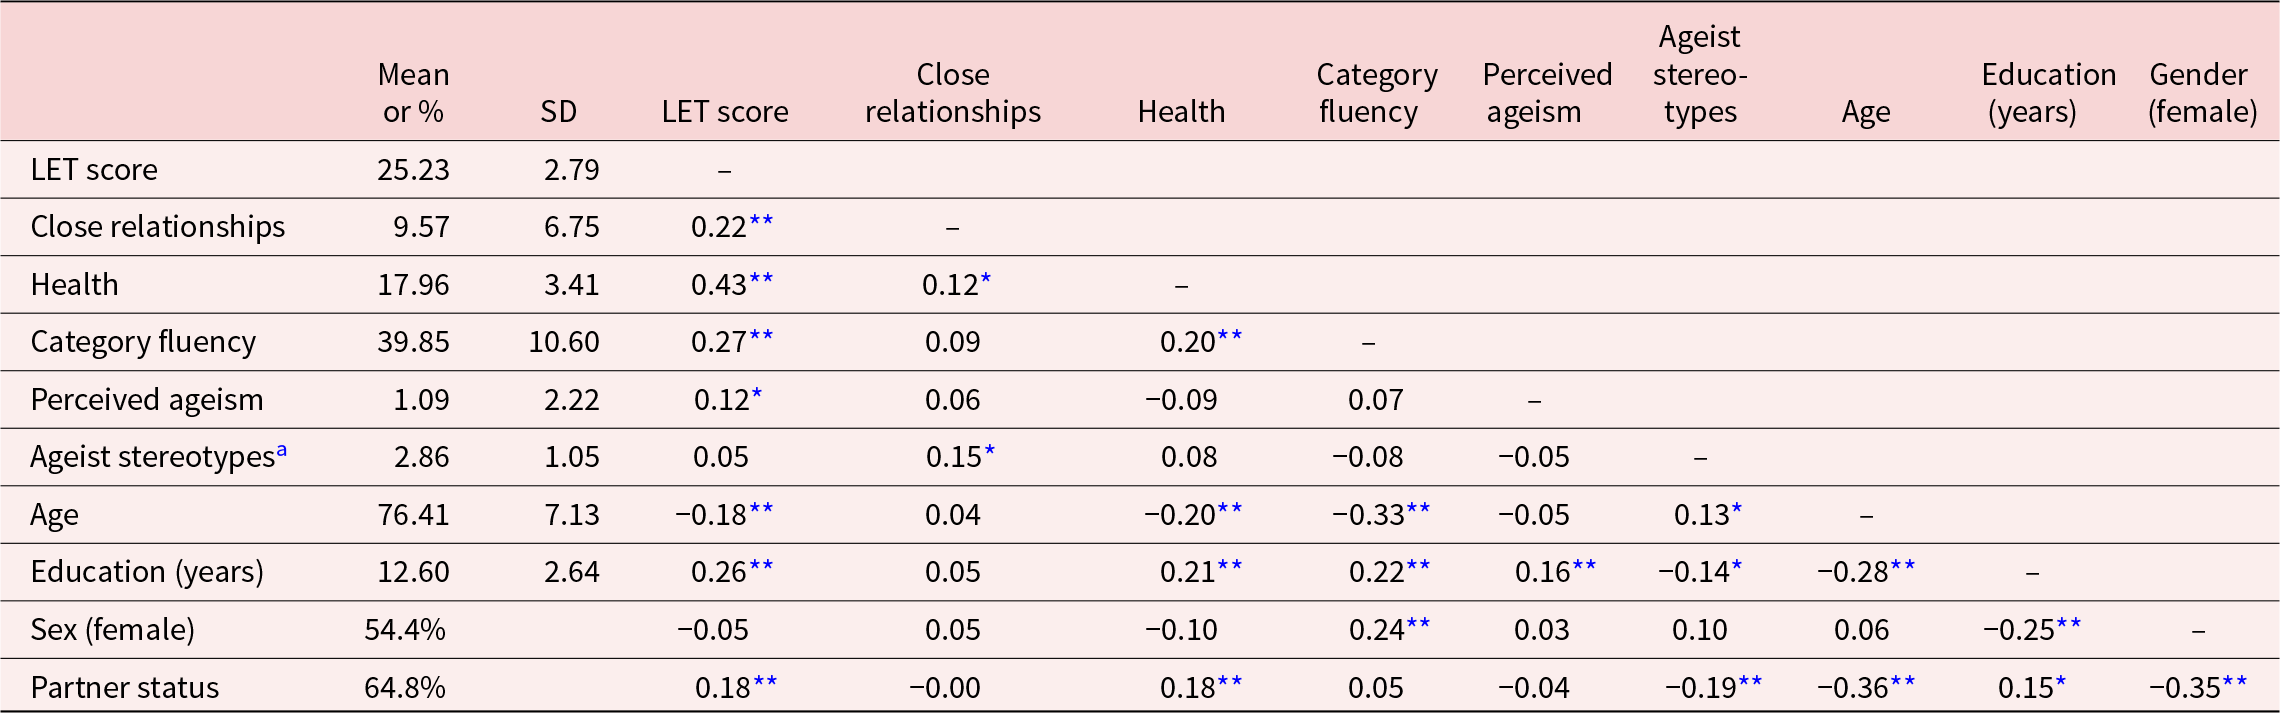
Table 1. Descriptive statistics and bivariate correlations for all study variables

Note: N = 287. Statistical significance is indicated by asterisks:
* p < 0.05, **p < 0.001. LET = Life Engagement Test. Partner status coded 0 (not partnered), 1 (partnered).
a Higher values correspond with more positive stereotypes.
Statistical analyses
We performed hierarchical multiple linear regressions using Stata v15.1. Screening of assumptions revealed some departures from homoscedasticity and normality. Also, a small number of large residuals indicated the possibility of influential outliers. To reduce the potential impact of violated assumptions on significance tests, we used the robust standard errors option (StataCorp 2025). The models included covariates at Step 1 (age, sex, partner status and education) and health, cognitive performance, age-related stereotypes and perceived ageism at Step 2 as predictors of LET score and social connections, respectively. We tested cross-product interaction terms (health x stereotypes, health x ageism, category fluency x stereotypes and category fluency x ageism) with significant interactions reported at Step 3. Descriptive statistics and bivariate correlations among the study variables are presented in Table 1.
Results
Predictors of engagement with life
Results of hierarchical multiple linear regression with life engagement as the dependent variable (Table 2) showed that at Step 1 the covariates contributed significantly to prediction (F[4, 282] = 8.31, p < 0.001) and accounted for 9.8 per cent of the variance. Among the covariates, partner status and education were statistically significant predictors, with being partnered and having higher education associated with greater engagement with life.
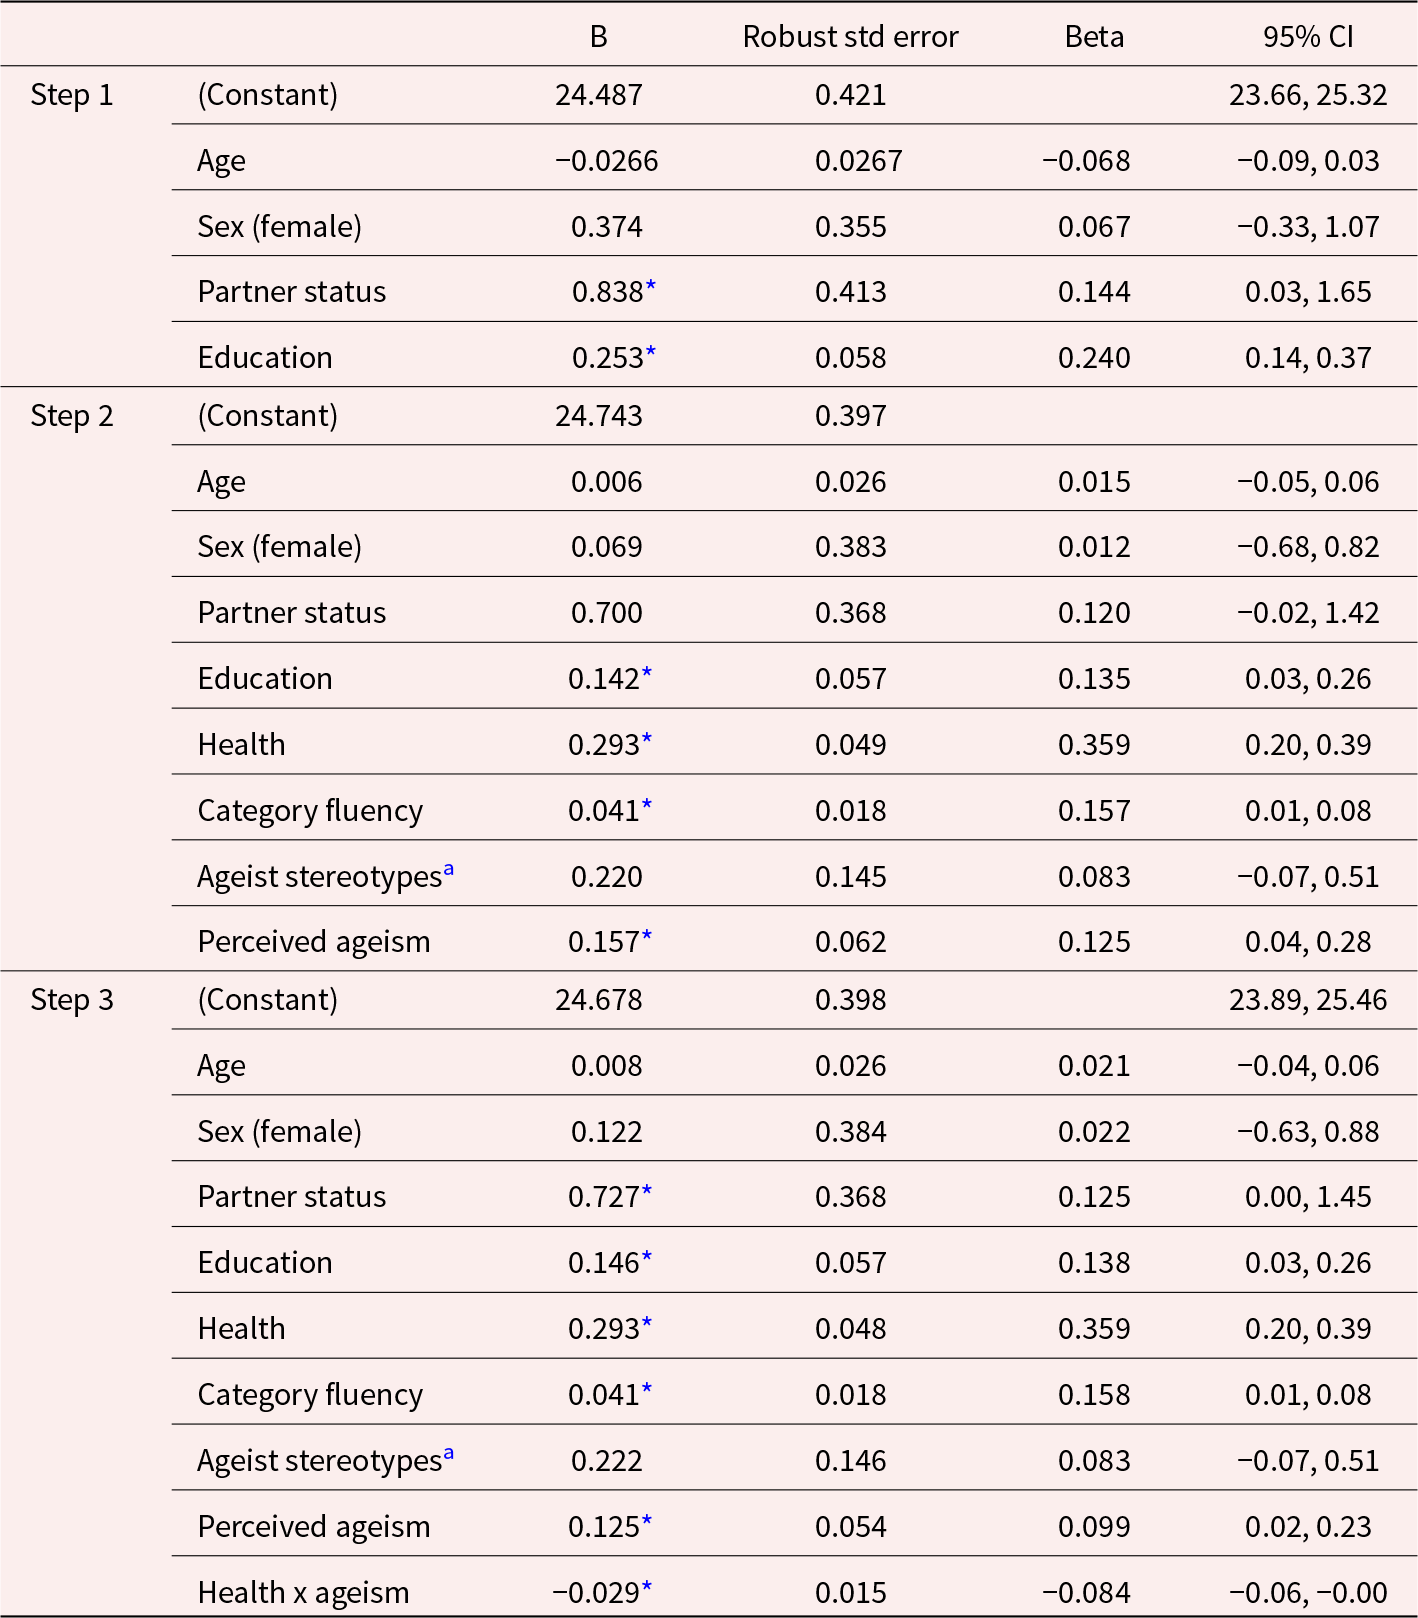
Table 2. Regression model 1 – dependent variable: Life Engagement Test score

Note: Statistical significance is indicated by asterisks:
* p < 0.05. R 2 = 0.098 for Step 1, ΔR2 = 0.171 for Step 2, ΔR2 = 0.006 for Step 3. Partner status coded 0 (not partnered), 1 (partnered).
a Higher values correspond with more positive stereotypes.
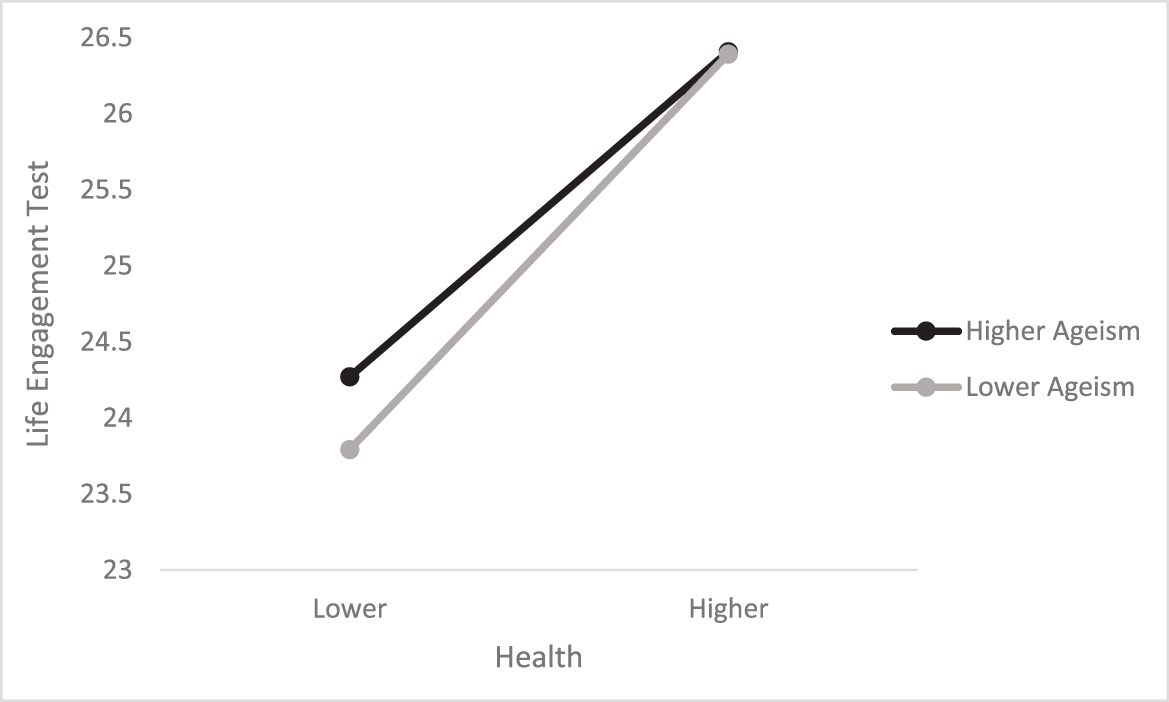
The addition at Step 2 of the predictors of substantive interest explained an additional 17.1 per cent of variance in the model. Results for the biologically based risk factors were consistent with expectations, with better health and better category fluency performance associated with higher engagement with life. The results did not support Hypothesis 1, as age-related stereotype scores were not associated with life engagement. Contrary to expectations, frequency of perceived ageism was associated with higher engagement with life at Step 2; however, this effect was qualified by the presence of a significant health x ageism interaction that accounted for a further 0.6 per cent of variance in the model at Step 3 (F[9, 277] = 12.07, p < 0.001). The nature of the interaction is displayed in Figure 1, which shows predicted values for life engagement for hypothetical individuals scoring at the 16th and 84th percentiles on health and scoring at the minimum and 84th percentiles on ageism. Figure 1 shows that at high levels of health, life engagement also tended to be high irrespective of frequency of perceived ageism. However, at lower levels of health, those who perceived greater ageism also tended to report higher levels of engagement. None of the other interactions tested to assess possible moderating effects of stereotypes and perceived discrimination were statistically reliable.

Figure 1. Predicted scores for hypothetical individuals scoring lower (16th percentile) and higher (84th percentile) on health and scoring lower (minimum) and higher (85th percentile) on ageism. Among participants scoring lower in health, those reporting greater perceived ageism also reported higher engagement relative to those scoring lower in health and lower in ageism.
Predictors of number of close social relationships
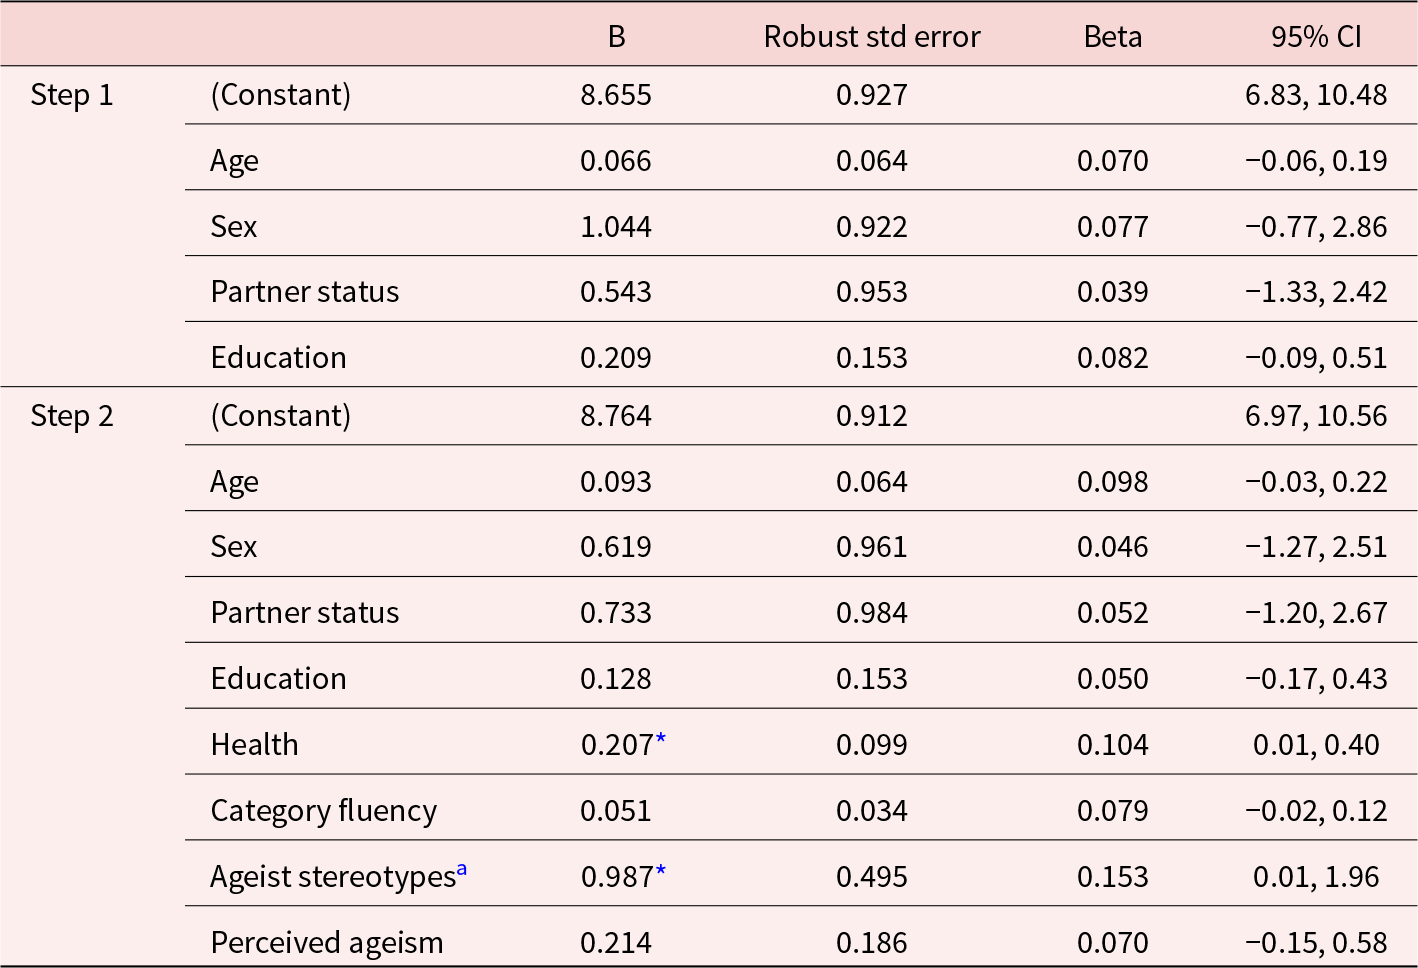
The results of the analysis conducted to examine predictors of number of close social partners (our proxy measure of social engagement) are presented in Table 3. At Step 1, none of the covariates were reliably associated with number of close social relationships. Addition of the main predictors of interest at Step 2 accounted for a significant 4.51 per cent of the variance (F[8, 278] = 2.35, p = 0.019). Here, better health was associated with a larger number of close relationships; however, category fluency was not a statistically reliable predictor. Results provided some support for Hypothesis 1, with more positive stereotypes about ageing associated with more close social connections, but, contrary to Hypothesis 2, frequency of perceived ageism was not associated with number of social connections. None of the interaction terms used to test possible moderating effects of ageing stereotypes on frequency of perceived ageism were significant.
Table 3. Regression model 2 – dependent variable: total number of close social relationships

Note: Statistical significance is indicated by asterisks:
* p < 0.05, R 2 = 0.010 for Step 1 (p = 0.481), ΔR 2 = 0.0451 for Step 2 (p = 0.019). Partner status coded 0 (not partnered), 1 (partnered).
a Higher values correspond with more positive stereotypes.
Discussion
We considered whether self-reported health, category fluency performance, perceptions about ageing and perceived ageism were associated with older adults’ participation in meaningful activities and number of close social connections. We further examined whether perceived ageism and ageist stereotypes moderated associations of the biologically based risk factors with engagement. The results provided only limited support for our hypotheses. Consistent with predictions, more negative age-related stereotypes were associated with lower social connections; however, stereotypes were not associated with meaningful activity engagement. Tests of moderating effects did not reveal that associations of biologically based risk factors with engagement were weaker among those reporting less exposure to ageism, or with more positive perceptions of ageing. Implications of our findings are discussed in the sections that follow.
Direct predictors of life engagement and close social connections
Health and cognitive function were positively associated with life engagement. The influence of health is unsurprising given previous research showing that poorer health and functional impairment act as barriers to social and leisure activities (e.g., Strain et al. Reference Strain, Grabusic, Searle and Dunn2002; Zimmer et al. Reference Zimmer, Hickey and Searle1997). Likewise, cognitive impairment has been associated with social and/or leisure activity withdrawal (Krueger et al. Reference Krueger, Wilson, Kamenetsky, Barnes, Bienias and Bennett2009; Mast Reference Mast2005). Our findings are consistent with cognitive health being an enabler of maintained engagement in personally meaningful activities.
Our findings partially supported Hypothesis 1; more positive age-related stereotypes were associated with more social connections, independent of socio-demographic characteristics, health and category fluency. However, contrary to predictions, age-related stereotypes were not associated with life engagement. One possible explanation for the pattern of findings is that negative views about ageing have more important implications for social connectivity than for meaningful activity engagement. Conceptual perspectives linking negative stereotypes about ageing with reduced engagement have recognised the particular significance of self-presentational concerns. For example, Swift et al. (Reference Swift, Abrams, Lamont and Drury2017) outline how stereotype threat – the risk of having negative stereotypes about one’s social group confirmed – could interfere with older adults’ seeking social contact (e.g., Abrams et al. Reference Abrams, Crisp, Marques, Fagg, Bedford and Provias2008). The idea that older adults would prefer social contact among a more select group of network members who affirm rather than challenge their self-identity also aligns with motivational changes described by socio-emotional perspectives on development (Carstensen Reference Carstensen2006) and it may be that such motivation is stronger among those with more negative embodied age-stereotypes. Menkin et al. (Reference Menkin, Robles, Gruenewald, Tanner and Seeman2017) found that older adults holding more positive social expectations of ageing subsequently reported greater social support and social engagement (e.g., social network size and diversity, frequency of contact) when compared to those holding more negative social expectations. They suggested that positive stereotypes of ageing may promote greater optimism or positive affect, which may encourage formation of new friendships. Although it is possible only to speculate, it may be that more general meaningful activity engagement as captured using the Life Engagement Test is relatively less subject to the influence of self-presentational concerns, as such activities could be solitary (e.g., Ost Mor et al. Reference Ost Mor, Palgi and Segel-Karpas2021) or undertaken with close others who do not threaten self-image.
Another possibility is that stereotypes related to ageing among our sample were not sufficiently negative to enable detection of associations with life engagement. Overall, stereotype scores were relatively neutral (mean rating: 2.8 on a scale of 1–5, where 1 = negative and 5 = positive) and it is possible that the demand characteristics of the telephone interview resulted in more positive descriptors being offered than would have been the case had participants responded using a paper-and-pencil format (e.g., Luong et al. Reference Luong, Charles, Rook, Reynolds and Gatz2015). Future studies may benefit from examining positive and negative views of ageing as separate dimensions rather than treating them as a single unipolar dimension. Zhang et al. (Reference Zhang, Nancy Xiaonan, Zhang and Zhou2018) showed that positive and negative stereotypes have separate effects that may interact to influence older adults’ wellbeing and life satisfaction.
Regarding perceived ageism, the findings did not support our hypotheses. Frequency of perceived ageism was unrelated to number of close social connections. This may have been in part owing to low levels of perceived ageism reported in our sample. Using the same measure, adults aged 55 and older in the European Social Survey scored 0.54 on average (based on a mean of the three items ranging from 0 to 4 (Kim and Jung Reference Kim and Jung2021). Converting our sum of the three items to a similar metric suggested a mean of 1.09/3 = 0.36 in our sample. The lower ageism scores may reflect lower levels of exposure to ageism in the specific community surveyed; in the European Social Survey, means across 29 countries ranged from 0.24 to 1.1 (Kim and Jung Reference Kim and Jung2021).
Ageism is generally recognised as a pervasive and institutionalised form of discrimination (Nelson Reference Nelson2016). Given the relatively low frequency of ageism reported by our respondents, it may be the case that more sensitive measures of the experiences of ageism are needed to adequately study its associations with aspects of health and social behaviour. For example, another study of Australians aged 60 and older that used Palmore’s (Reference Palmore2001) more comprehensive ageism survey found more robust associations of perceived ageism with aspects of mental health and wellbeing (rs ranged from 0.2 to 0.3; Lyons et al. Reference Lyons, Alba, Heywood, Fileborn, Minichiello, Barrett, Hinchliff, Malta and Dow2018). Furthermore, a recent systematic review has highlighted the lack of valid and reliable measures of experienced ageism (Ayalon et al. Reference Ayalon, Dolberg, Mikulionienė, Perek-Białas, Rapolienė, Stypinska, Willińska and de la Fuente-Núñez2019). However, the World Health Organization has recently released a new measure which captures perceptions of both more subtle and more extreme instances of age-based discrimination (Murray and de la Fuente-Núñez Reference Murray and de la Fuente-Núñez2023). As more nuanced measures of ageism are developed, researchers in the field will be better placed to systematically examine the implications of age discrimination for late life engagement.
The items used in the European Social Survey and in the present study capture relatively overt experiences of ageism from being treated unfairly to being ignored, patronised, abused or being refused services. However, ageism can take more subtle forms including social exclusion and even benevolent acts that are motivated out of a desire to help but at the same time can undermine older adults’ autonomy (Swift et al. Reference Swift, Abrams, Lamont and Drury2017). Measures that adequately capture subtle experiences of ageism as well as both ‘hostile’ and ‘benevolent’ ageism may be needed to adequately examine its role as a potential barrier to the maintenance of social networks into later life.
Furthermore, the retrospective nature of the measure tapping experiences of ageism in the past year could introduce recall bias. It may be the case that everyday ageism has more of an impact on life engagement than the more significant instances of discrimination captured in the measure used in the current study. This is in line with research demonstrating that daily stressors (such as everyday ageism) may accumulate over time to impact stress responses and wellbeing to a greater extent than some major life events (Almeida Reference Almeida2005). Instances of significant discrimination might be distressing in the short term, but might also produce greater determination among individuals to pursue valued goals. However, it might be the more subtle forms of discrimination experienced more frequently that ultimately wear people down and impact their goal striving.
In the case of engagement with life, the association with perceived ageism was in the opposite direction to predictions, with a health x perceived ageism interaction indicating that, among those in poorer health, more frequent perceived ageism was related to greater engagement with life. We think that this unexpected finding most likely reflects processes of reverse causality. Specifically, for older adults in poor health, their age-related limitations may be more salient to those with whom they interact. When older adults with health limitations remain highly engaged, they may in turn be at a higher risk of encountering ageist attitudes from others who see them as less capable, relative to older adults in better health. We also note that the interaction of perceived ageism x self-reported health was of a small magnitude in terms of its effect size. Figure 1 shows clearly that engagement with life is much more strongly associated with self-reported health than with frequency of perceived ageism.
Finally, we note that the effect sizes for associations between perceived age-based discrimination and our chosen outcome measures were small in the current study, and that there are other established factors already known to affect engagement with life such as cognitive impairment, disability, depression (Oh et al. Reference Oh, Gan, Boscardin, Allison, Barnes, Covinsky and Smith2021), functional status (Dombrowsky Reference Dombrowsky2017) and cultural identities (Thanakwang and Isaramalai Reference Thanakwang and Isaramalai2013). Future research would benefit from increasing precision of measurement by assessing everyday ageism (including through the use of diary methods, see Almeida Reference Almeida2005), as well as examining unique associations of ageism controlling for the range of relevant factors known to affect engagement with life.
Moderating effects of ageist stereotypes and perceived ageism
Except for the interaction between self-reported health and perceived ageism that ran counter to expectations, we did not find evidence for age-related stereotypes or frequency of perceived ageism moderating associations of health or category fluency with the two indices of engagement. Many older adults remain engaged with life despite age-related losses (Etezadi and Pushkar Reference Etezadi and Pushkar2013), and continued engagement depends on effective processes of self-regulation (e.g., Boerner and Jopp Reference Boerner and Jopp2007). We surmised that those expressing fewer negative stereotypes about ageing and perceiving less ageism would be better placed to flexibly re-engage with new developmental goals in response to biological resource losses, thereby maintaining engagement. However, it may be the case that ageism and stereotype-related beliefs are less consequential for self-regulatory efforts than other biopsychosocial factors, for example poor health and sensory impairment (e.g., Wettstein et al. Reference Wettstein, Wahl and Heyl2019), subjective ageing (Wilton-Harding and Windsor Reference Wilton-Harding and Windsor2022), cognitive monitoring (Hertzog and Dunlosky Reference Hertzog and Dunlosky2011) and personality traits (Hooker et al. Reference Hooker, Choun, Mejía, Pham and Metoyer2013). Future studies should assess individual differences in self-regulatory tendencies as well as perceived ageism and age-related stereotypes to better understand the range of possible mechanisms contributing to engagement (or lack of engagement) in older adulthood.
Strengths, limitations and future directions
This study featured several strengths, including a randomly selected community sample of older adults and the objective assessment of category fluency as a marker of cognitive ability in addition to the various self-report measures. Objective cognitive assessments are often not available in survey-based research on older adults, despite cognitive ability being an important determinant of motivation and behaviour (e.g., Hess Reference Hess2014), and our measure of category fluency is sensitive to normal age-related cognitive change (Lezak et al. Reference Lezak, Howieson, Bigler and Tranel2012). An additional strength was the move beyond focusing on main effects of ageism on wellbeing to also considering possible moderating effects (though we found little evidence in support of moderation). Although beyond the scope of the present study, future research may benefit from considering interactions of ageism with additional factors such as age and gender (Levy and Macdonald Reference Levy and Macdonald2016) that have established associations with aspects of wellbeing (Leach et al. Reference Leach, Christensen, Windsor, Butterworth and Mackinnon2008; Windsor et al. Reference Windsor, Burns and Byles2013).
It is also important, however, to acknowledge several study limitations. First, only one measure of cognition was available, and other cognitive abilities for which declines might be more salient to older adults (e.g., memory) could be a stronger predictor of engagement with life. Furthermore, as participants were interviewed over the phone, potential environmental factors or distractions could not be controlled for during the category fluency task. Second, the cross-sectional design meant that causal inferences cannot be made, and, as discussed earlier, it seems likely that our findings indicating higher engagement among those in poorer health with more frequent perceived ageism are a result of reverse causality. Third, although we used the same perceived ageism items employed in the European Social Survey, the measure was relatively short and may not have adequately picked up on both less overt forms of age discrimination and indirect discrimination (Swift et al. Reference Swift, Abrams, Lamont and Drury2017). Furthermore, asking participants to recall general instances or perceptions of age-based discrimination over the past year introduces potential recall bias. Comprehensive ageism scales have been developed recently which include more specific and/or day-to-day instances of potential age-based discrimination (Allen et al. Reference Allen, Solway, Kirch, Singer, Kullgren and Malani2022; Murray and de la Fuente-Núñez Reference Murray and de la Fuente-Núñez2023), which may allow future research to explore the relationship between perceived ageism and wellbeing with greater depth and accuracy.
Additionally, the stereotypes of ageing measure did not capture whether participants believed that the endorsed stereotypes were self-relevant, or the degree to which participants judged their responses as positive or negative in terms of age stereotypes. Despite their chronological age, many individuals do not necessarily identify as ‘older adults’ (Pinquart Reference Pinquart2002). The embodiment of age-related stereotypes is suggested to be an unconscious process (Levy Reference Levy2009). Therefore, the extent to which participants identified as ‘older’, thought that these words or phrases applied to them, or viewed their responses as positive or negative is not known.
Another limitation is that our sample was restricted to English speakers who were recruited from one local government area in South Australia. Therefore, the results do not shed light on potentially relevant cross-cultural factors (e.g., Ayalon and Cohn-Schwartz Reference Ayalon and Cohn-Schwartz2022). In addition, our measure of close social connections was used as a general indicator of both network size and quality of connections. However, future studies may benefit from using more detailed and nuanced approaches to capture social networks. Specifically, researchers may better capture the social dynamics of ageism by using measures of network structure, quality and function. Furthermore, social network measures that distinguish different sources of contact and support (e.g., family versus friends) and neighbourhood characteristics would enable assessment of levels of engagement controlling for differences in existing opportunity structures (e.g., being part of a large family or living in a retirement community) that could affect levels of engagement (see Huxhold et al. Reference Huxhold, Fiori and Windsor2022).
Finally, most effect sizes observed in this study were small according to conventional benchmarks (Cohen Reference Cohen1962, Reference Cohen1988). Small effects are common in social research (Gignac and Szodorai Reference Gignac and Szodorai2016) and are not necessarily reflective of findings being of limited practical significance (Bosco et al. Reference Bosco, Aguinis, Singh, Field and Pierce2015; Funder and Ozer Reference Funder and Ozer2019; Ozer Reference Ozer1985). Nevertheless, we acknowledge that statistical significance and significance in the context of real life do not necessarily go hand in hand. As we noted earlier, better measurement precision in the assessment of ageism (including everyday ageism) is likely to be an important step in establishing the degree to which ageism is of practical importance in limiting older adults’ social and meaningful engagement. In addition, future research could consider potential moderators (e.g., age, gender, education) of the relationship between age-based discrimination and key developmental outcomes to understand more about who is at most risk of adverse outcomes from perceived ageism and whether effects are more pronounced for some population subgroups than others.
Conclusion
Our findings were consistent with those of previous research showing that physical and cognitive health are important correlates of engagement with valued activities in older adulthood (Galenkamp et al. Reference Galenkamp, Gagliardi, Principi, Golinowska, Moreira, Schmidt, Winkelmann, Sowa, van der Pas and Deeg2016; Leung et al. Reference Leung, Fung, Tam, Lui, Chiu, Chan and Lam2010), and we found some limited support for the notion that more positive age-related stereotypes are associated with greater social engagement (but not necessarily engagement in meaningful activities more generally). As outlined earlier, methodological improvements are needed to produce more definitive findings; however, we see the present study as a valuable first step towards better understanding of how age-related stereotypes and age discrimination might relate to late life engagement, particularly as research in this area is sparse (Galenkamp et al. Reference Galenkamp, Gagliardi, Principi, Golinowska, Moreira, Schmidt, Winkelmann, Sowa, van der Pas and Deeg2016). Given that the World Health Organization has declared 2020–2030 to be the Decade of Healthy Ageing (World Health Organization 2020), future longitudinal studies that include comprehensive cognitive assessments and measures that capture subtle forms of both positive and negative ageism will be important for shedding further light on both the antecedents of ageism and the potential for ageism to impact health and wellbeing into later life.
Acknowledgements
This research was supported by the Australian government through the Australian Research Council’s Linkage Projects funding scheme (LP170100461). The research was conducted in partnership with ECH Inc., Onkaparinga City and the South Australian Government Office for Ageing Well. The views expressed herein are those of the authors and are not necessarily those of the Australian government, the Australian Research Council or other partner organisations. Data may be available upon request to the corresponding author.
Author contributions
TE analysed the data and drafted the initial manuscript; JS contributed to the study design, coordinated the data collection and contributed to the drafting and later revision of the manuscript; RW, ML and TM contributed to the study conception and design and revised later versions of the manuscript; BW-H revised later versions of the manuscript; and TW contributed to the study conception and design, analysis of the data, and initial drafting and later revision of the manuscript.
Competing interests
The authors report that there are no competing interests to declare.
Ethical standards
This study protocol was reviewed and approved by the Flinders University Social and Behavioural Research Committee (approval number 8172).

 Open access