


Introduction
The calcioferrite group of minerals has the general formula Ca4A2+B3+ 4(PO4)6(OH)4·12H2O, where A = Mg, Mn2+ and Fe2+ and B = Al and Fe3+ (Grey et al., Reference Grey, Kampf, Smith, Williams and MacRae2019a). Although calcioferrite, with A = Mg and B = Fe3+, was the first member to be characterised (Blum, Reference Blum1858), montgomeryite, with A = Mg and B = Al, was the first member to have the crystal structure determined, in space group C2/c with cell parameters a = 10.023(1), b = 24.121(3), c = 6.243(l) Å and β = 91.55(1)° (Moore and Araki, Reference Moore and Araki1974). The structure is built from [100] zig-zag chains of alternating cis- and trans- corner-shared octahedra that share corners with PO4 tetrahedra along [001] to form heteropolyhedral slabs parallel to (010). The larger Ca and A-site atoms occupy sites at the periphery of, and between, the slabs. Studies on the other members, kingsmountite, with A = Fe2+, B = Al (Dunn et al., Reference Dunn, Peacor, White and Ramik1979), zodacite, A = Mn2+, B = Fe3+ (Dunn et al., Reference Dunn, Grice and Metropolis1988; Lafuente et al., Reference Lafuente, Downs, Yang and Jenkins2014) and fanfaniite, with A = Mn2+, B = Al (Grey et al., Reference Grey, Kampf, Smith, MacRae and Keck2019b) all reported the C-centred monoclinic cell with similar unit-cell parameters as for montgomeryite.
A feature of the monoclinic C2/c structure is disordering of the A site atoms, with pairs of edge-shared A-centred octahedra that are only half-occupied. This aspect was addressed by Fanfani et al. (Reference Fanfani, Nunzi, Zanazzi and Zanzari1976). In their single-crystal diffraction study on montgomeryite, they observed weak reflections that violated the c-glide extinction condition. They noted that the reflection conditions were consistent with space group C2, and that the A site split into two sites in C2, allowing ordering at one of these sites. They were unable to refine the whole structure in C2 because of high correlations between the positional and thermal parameters of related atoms, but a refinement restricted to the A site cation and coordinated H2O resulted in a lowering of the R factor.
A further modification to the structural ordering in calcioferrite minerals was found in a study of a kingsmountite-related member from the Foote mine, North Carolina (Grey et al., Reference Grey, Kampf, Smith, Williams and MacRae2019a). A structure analysis showed it to have a triclinic superstructure of the monoclinic structure, with a doubled am cell parameter. Refinement of the crystal structure showed that the superstructure was due to ordering of the A site cations, as well as ordering of octahedrally-coordinated Mn at one of the Ca sites, giving an ideal formula Ca3Mn2+Fe2+Al4(PO4)6(OH)4·12H2O. A study was then conducted on the type specimen of kingsmountite, which showed that it also had a doubling of the am cell parameter, resulting in a redefinition of the ideal formula and space group for kingsmountite (Grey et al., Reference Grey, Kampf, Smith, Williams and MacRae2019a).
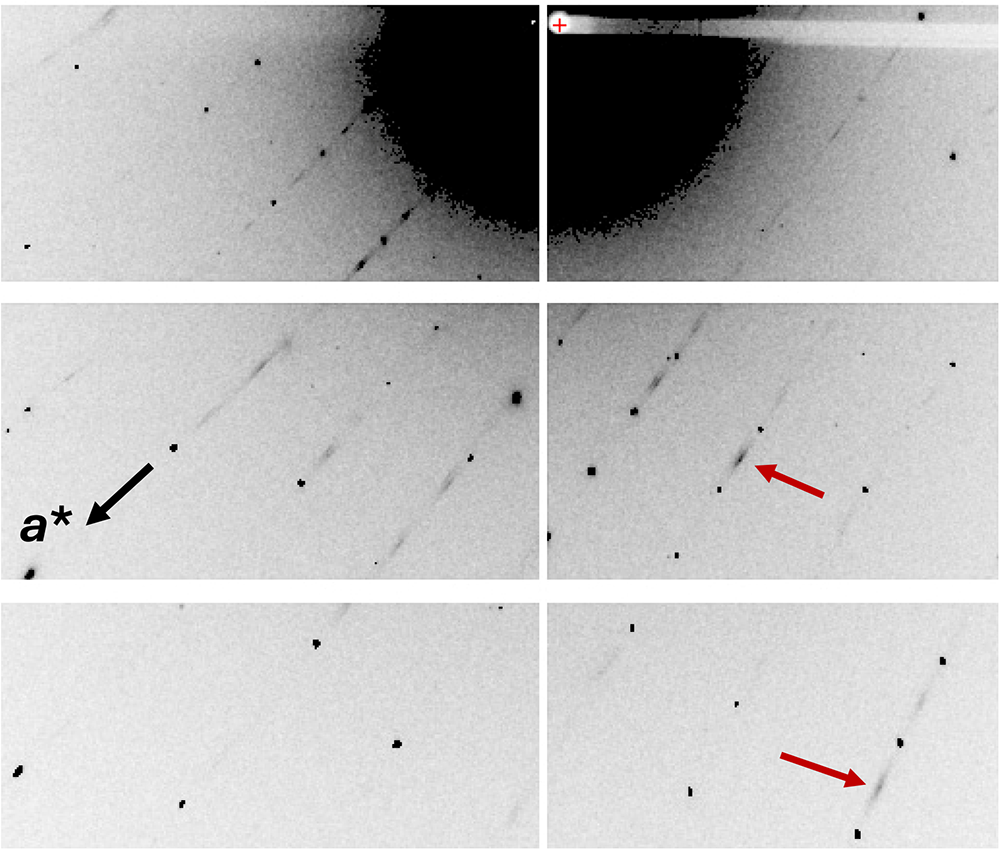
During the course of a study of secondary phosphate minerals from the Hühnerkobel pegmatite mine, Bavaria, we found well developed crystals of a calcioferrite-group mineral that was subsequently analysed as being fanfaniite. A synchrotron single-crystal diffraction data collection on one of the crystals was indexed by the same monoclinic cell as reported for type fanfaniite and a good refinement (R obs = 0.028 for 1989 observed reflections) was obtained in space group C2/c. The data analysis, however, showed the presence of 38 reflections that violated the c-glide condition. Although weak, the reflections had intensities, I, up to 10σ(I), and could not be ignored. In addition, during the data collection, screen-shots of the diffraction frames showed very weak diffuse reflections corresponding to a doubling of the am cell parameter. These reflections, which were streaked parallel to a*, were not picked up by the synchrotron automated indexing routine, but we were able to have them incorporated by reprocessing the frame data with forcing of the superstructure unit cell found for kingsmountite. The data analysis showed that there were more than 600 such reflections with I > 3σ(I) in the reprocessed dataset.
The different datasets collected on the same crystal provided an opportunity to compare the analysis of structural order based on different models, the results of which are reported here.
Specimen description and chemical analysis
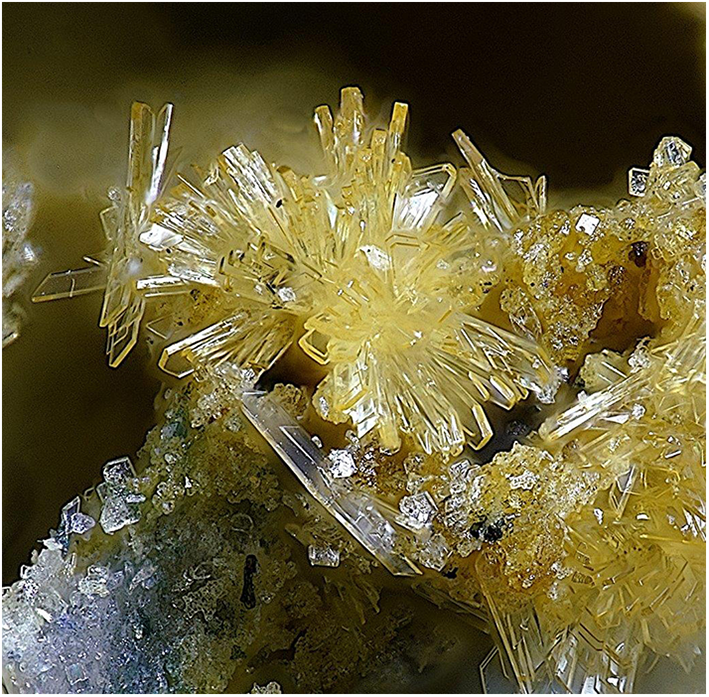
The fanfaniite-containing specimens were collected from the dumps of the Hühnerkobel pegmatite mine, near the town of Zwiesel, Bavaria. The mineral is found in cavities of K-feldspar with traces of apatite, rockbridgeite and mitridatite. Associated minerals are jahnsite-(CaMnFe), kayrobertsonite, and the paulkerrite-group minerals rewitzerite and macraeite. Fanfaniite forms sprays of transparent, light yellow blades, shown in Fig. 1. The blades are up to 120 μm in length and 30 μm wide.

Figure 1. Clusters of pale yellow fanfaniite crystals associated with small colourless platelets of paulkerrite-group mineral. Field of view: 0.6 mm. Image by Christian Rewitzer.
Crystals of fanfaniite, mounted in epoxy blocks and polished, were analysed using wavelength-dispersive spectrometry on a JEOL JXA 8530F Hyperprobe operated at an accelerating voltage of 15 kV and a beam current of 2 nA. The beam was defocused to 2 to 10 μm, depending on the size of the crystal. To minimise dehydration during analysis a cold stage cooled to liquid nitrogen temperature was employed in the microprobe, and the specimen was precooled under dry nitrogen prior to introduction into the microprobe. Analytical results (average of 10 analyses), are given in Table 1. There was insufficient material for direct determination of H2O, so it was based upon the crystal structure, with 14 H2O per 6 P. The calculated H2O content was included in the in-house matrix correction procedure. Bond valence sum (BVS) values calculated from the refined M–O distances were consistent with all iron as Fe3+.
Table 1. Chemical data (wt.%) for fanfaniite from Hühnerkobel

S.D. – standard deviation
The empirical formula, in structural form, scaled to 15 (M+P) is: (Ca3.84Mn2+0.18)(Mn2+0.48Mg0.21Fe3+0.31)(Al3.36Fe3+0.64)(PO4)5.97[(OH)3.56O0.44]·12.15H2O. The ideal formula with dominant cations at each site is Ca4Mn2+Al4(PO4)6(OH)4·12H2O, which corresponds to fanfaniite.
Crystallography
A fanfaniite blade, measuring 0.090 × 0.030 × 0.010 mm, was used for a data collection at the Australian Synchrotron microfocus beamline MX2 (Aragao et al., Reference Aragao, Aishima, Cherukuvada, Clarken, Clift, Cowieson, Ericsson, Gee, Macedo, Mudie, Panjikar, Price, Riboldi-Tunnicliffe, Rostan, Williamson and Caradoc-Davies2018). Intensity data were collected using a Dectris Eiger 16M detector and monochromatic radiation with a wavelength of 0.7107 Å. The crystal was maintained at 100 K in an open-flow nitrogen cryostream during data collection. The diffraction data were collected using a single 36 s sweep of 360° rotation around phi. The resulting dataset consists of 3600 individual images with an approximate phi angle of each image being 0.1 degrees. The raw intensity dataset was processed using CrysAlisPro software (Agilent, 2014) to produce data files that were analysed using SHELXT (Sheldrick, Reference Sheldrick2015) and JANA2006 (Petříček et al., Reference Petříček, Dušek and Palatinus2014). The crystallographic information files are available as Supplementary material (see below).
Average C2/c structure
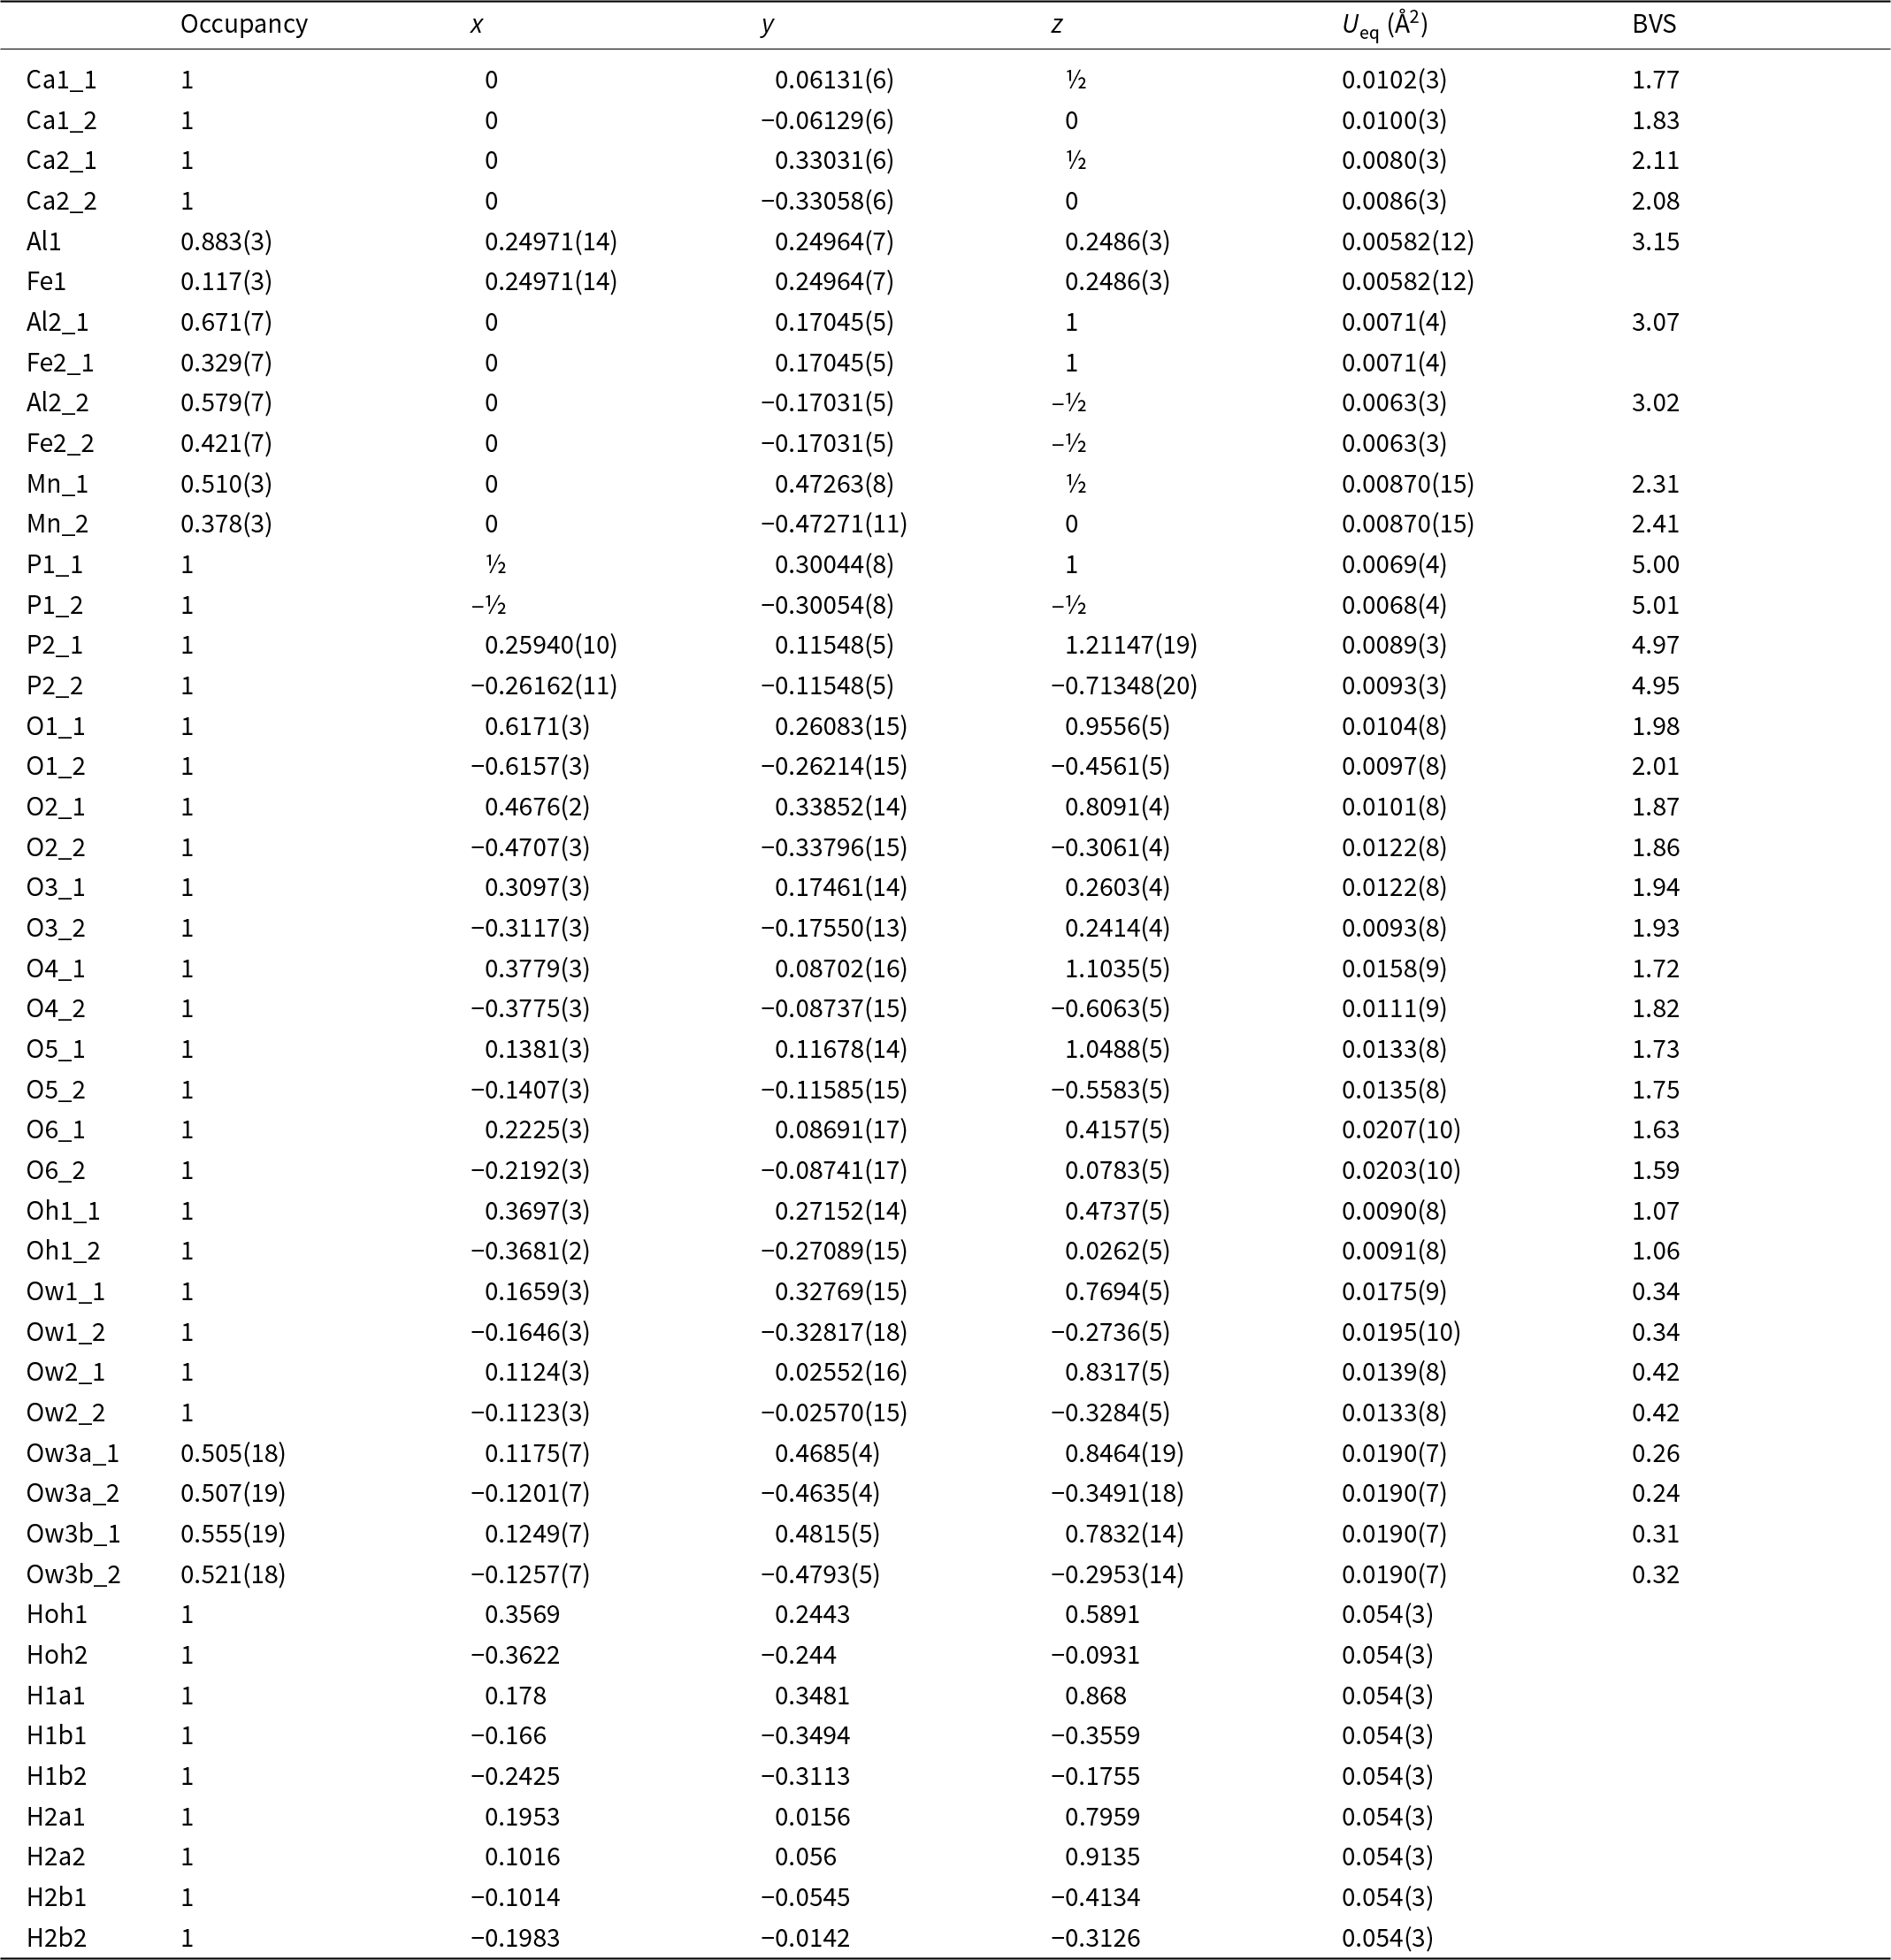
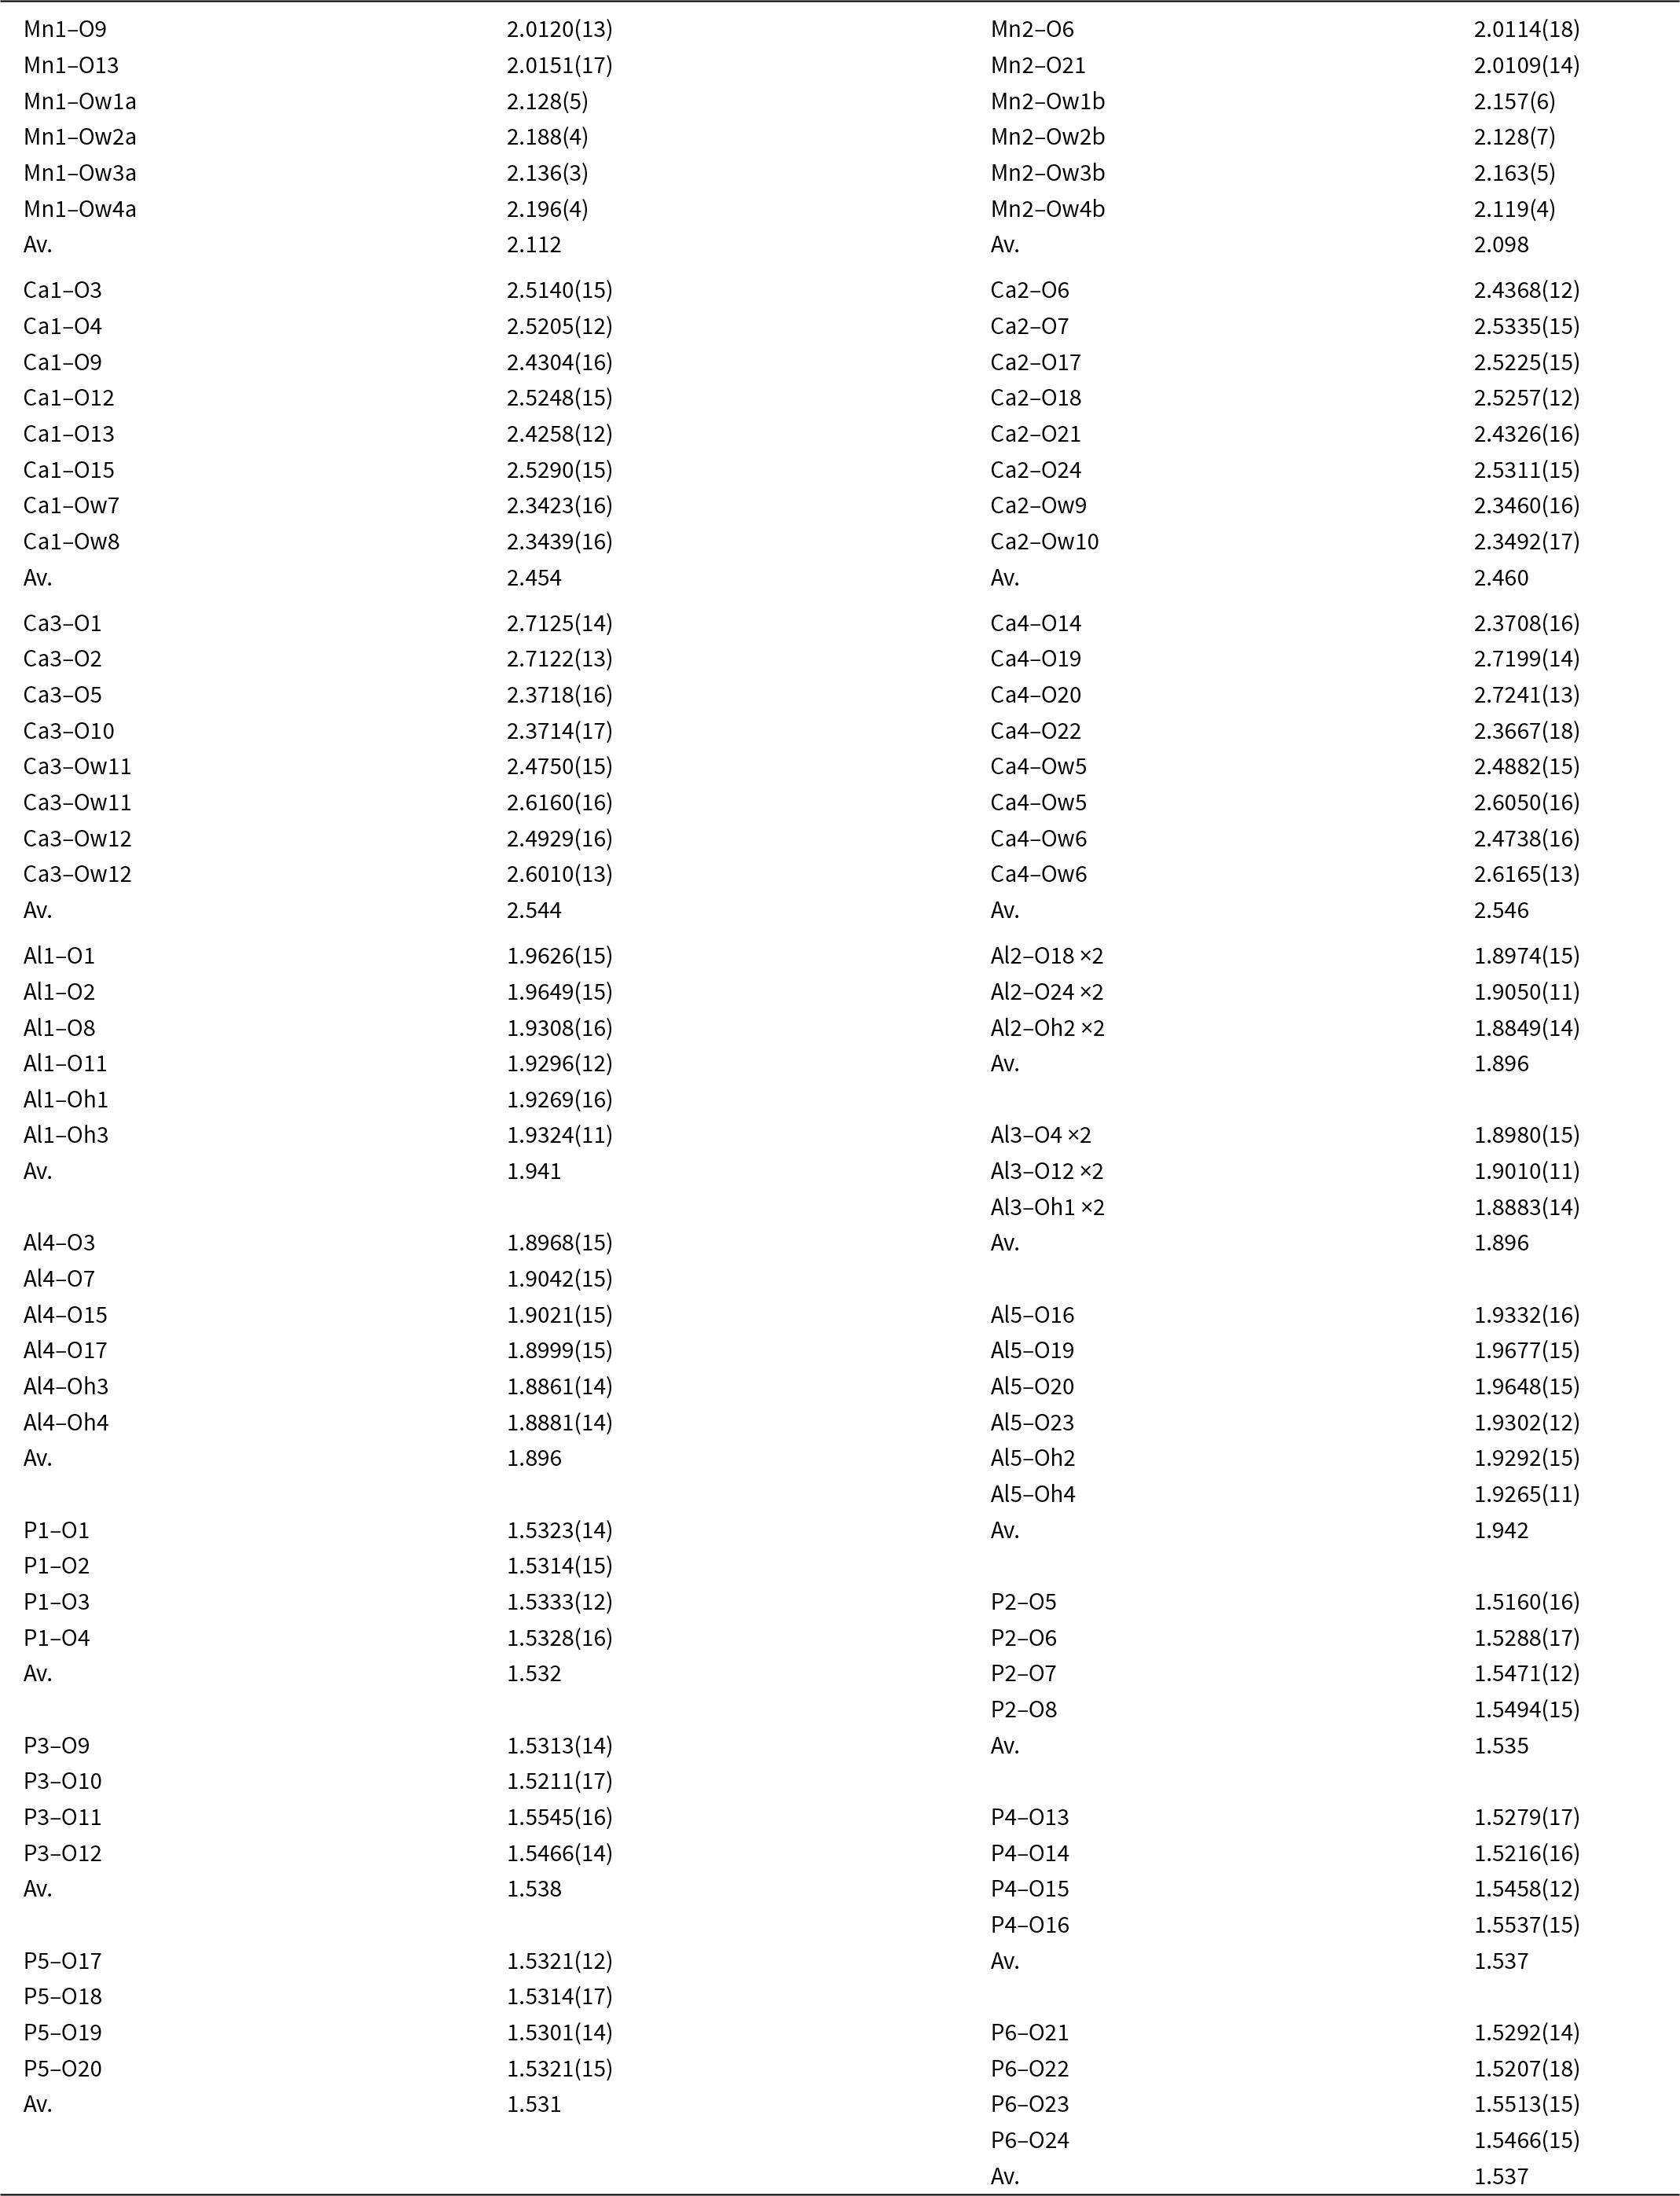
Automatic indexing of the frame diffraction data gave a C-centred monoclinic unit cell with parameters given in Table 2. A structure solution in space group C2/c was obtained using SHELXT. It was found to be the same as that reported for fanfaniite from the Foote mine (Grey et al., Reference Grey, Kampf, Smith, MacRae and Keck2019b). For the refinement, the scattering curve for Mn was used for the A site and the site occupancy was refined, while Fe and Al were assigned to the Al sites and their relative amounts were refined. Refinement in JANA2006 with anisotropic displacement parameters showed that one of the water molecules coordinated to Mn, Ow3, had very large U 22 and U 33 parameters (0.07 Å2), indicating a likely split Ow3, as reported also for montgomeryite (Fanfani et al., Reference Fanfani, Nunzi, Zanazzi and Zanzari1976) and for calcioferrite (Lafuente et al., Reference Lafuente, Downs, Yang and Jenkins2014). Splitting of Ow3 into Ow3a and Ow3b and independent refinement of the atoms at the two sites resulted in sensible anisotropic displacement parameters (ADPs) of ∼0.02 Å2. Difference-Fourier maps showed unambiguous locations for H atoms associated with Ow1, Ow2 and OH. These were included, without refinement of the coordinates and with refinement of a common isotropic ADP. The final refinement, with ADPs for all non-H atoms, converged to Robs = 0.028 for 1989 observed reflections with I > 3σ(I). Other details of the refinement are given in Table 2. The refined coordinates, equivalent ADPs and site occupancies are reported in Table 3, together with BVS obtained using the parameters of Gagné and Hawthorne (Reference Gagné and Hawthorne2015). The BVS for the Mn sites were calculated using the site occupancies in the empirical formula, Mn0.48Al0.21Fe0.31. The resulting value, 2.35, is consistent with all Fe as Fe3+, which gives a formal BVS of 2.31, and suggests that a small amount of Mn may be present as Mn3+.
Table 2. Crystal data and structure refinement results

* w = [σ2(|F o|)+(0.01F o)2]–1
Table 3. Coordinates, site occupancies, equivalent isotropic displacement parameters and bond valence sums (valence units) for C2/c model for fanfaniite

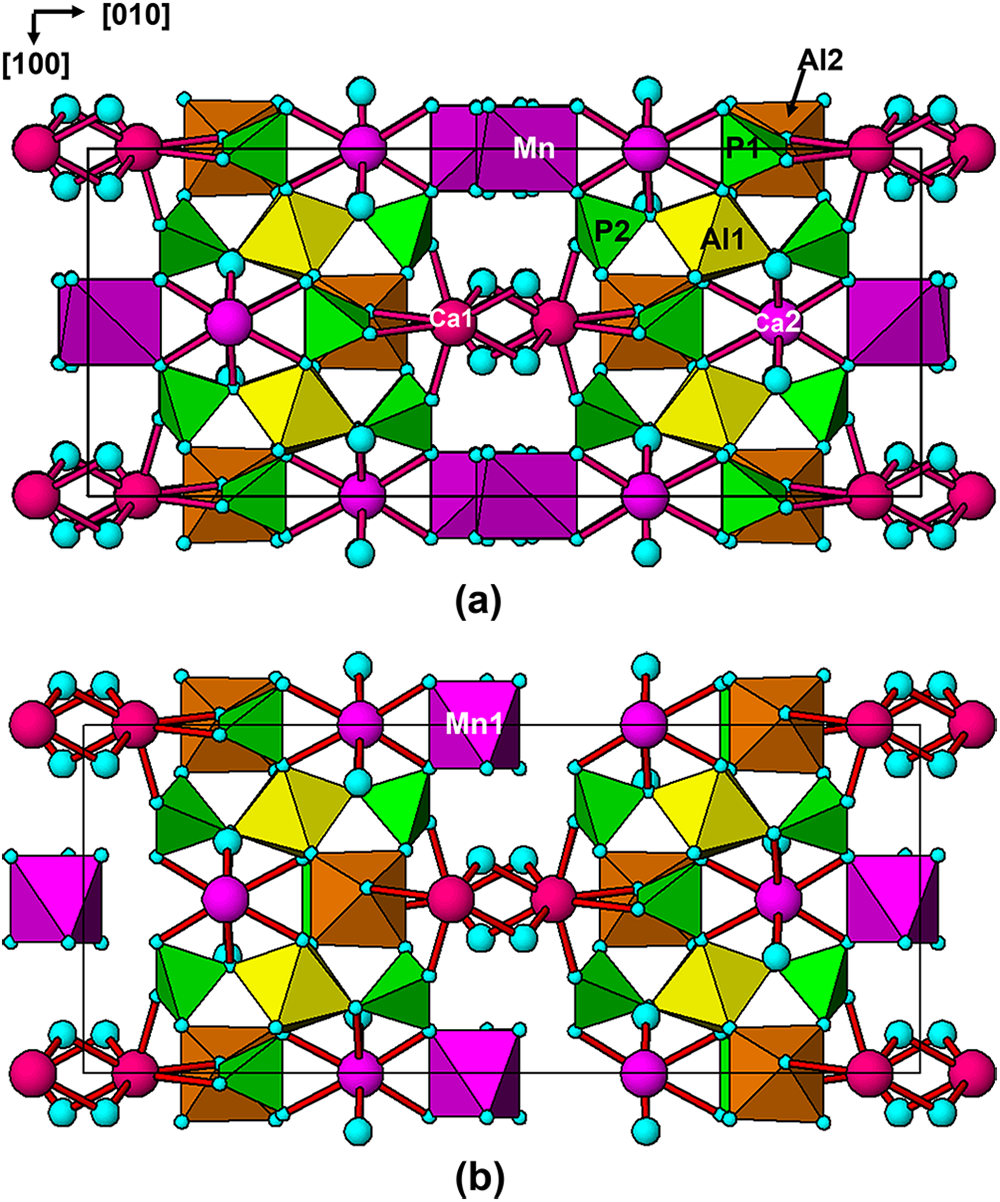
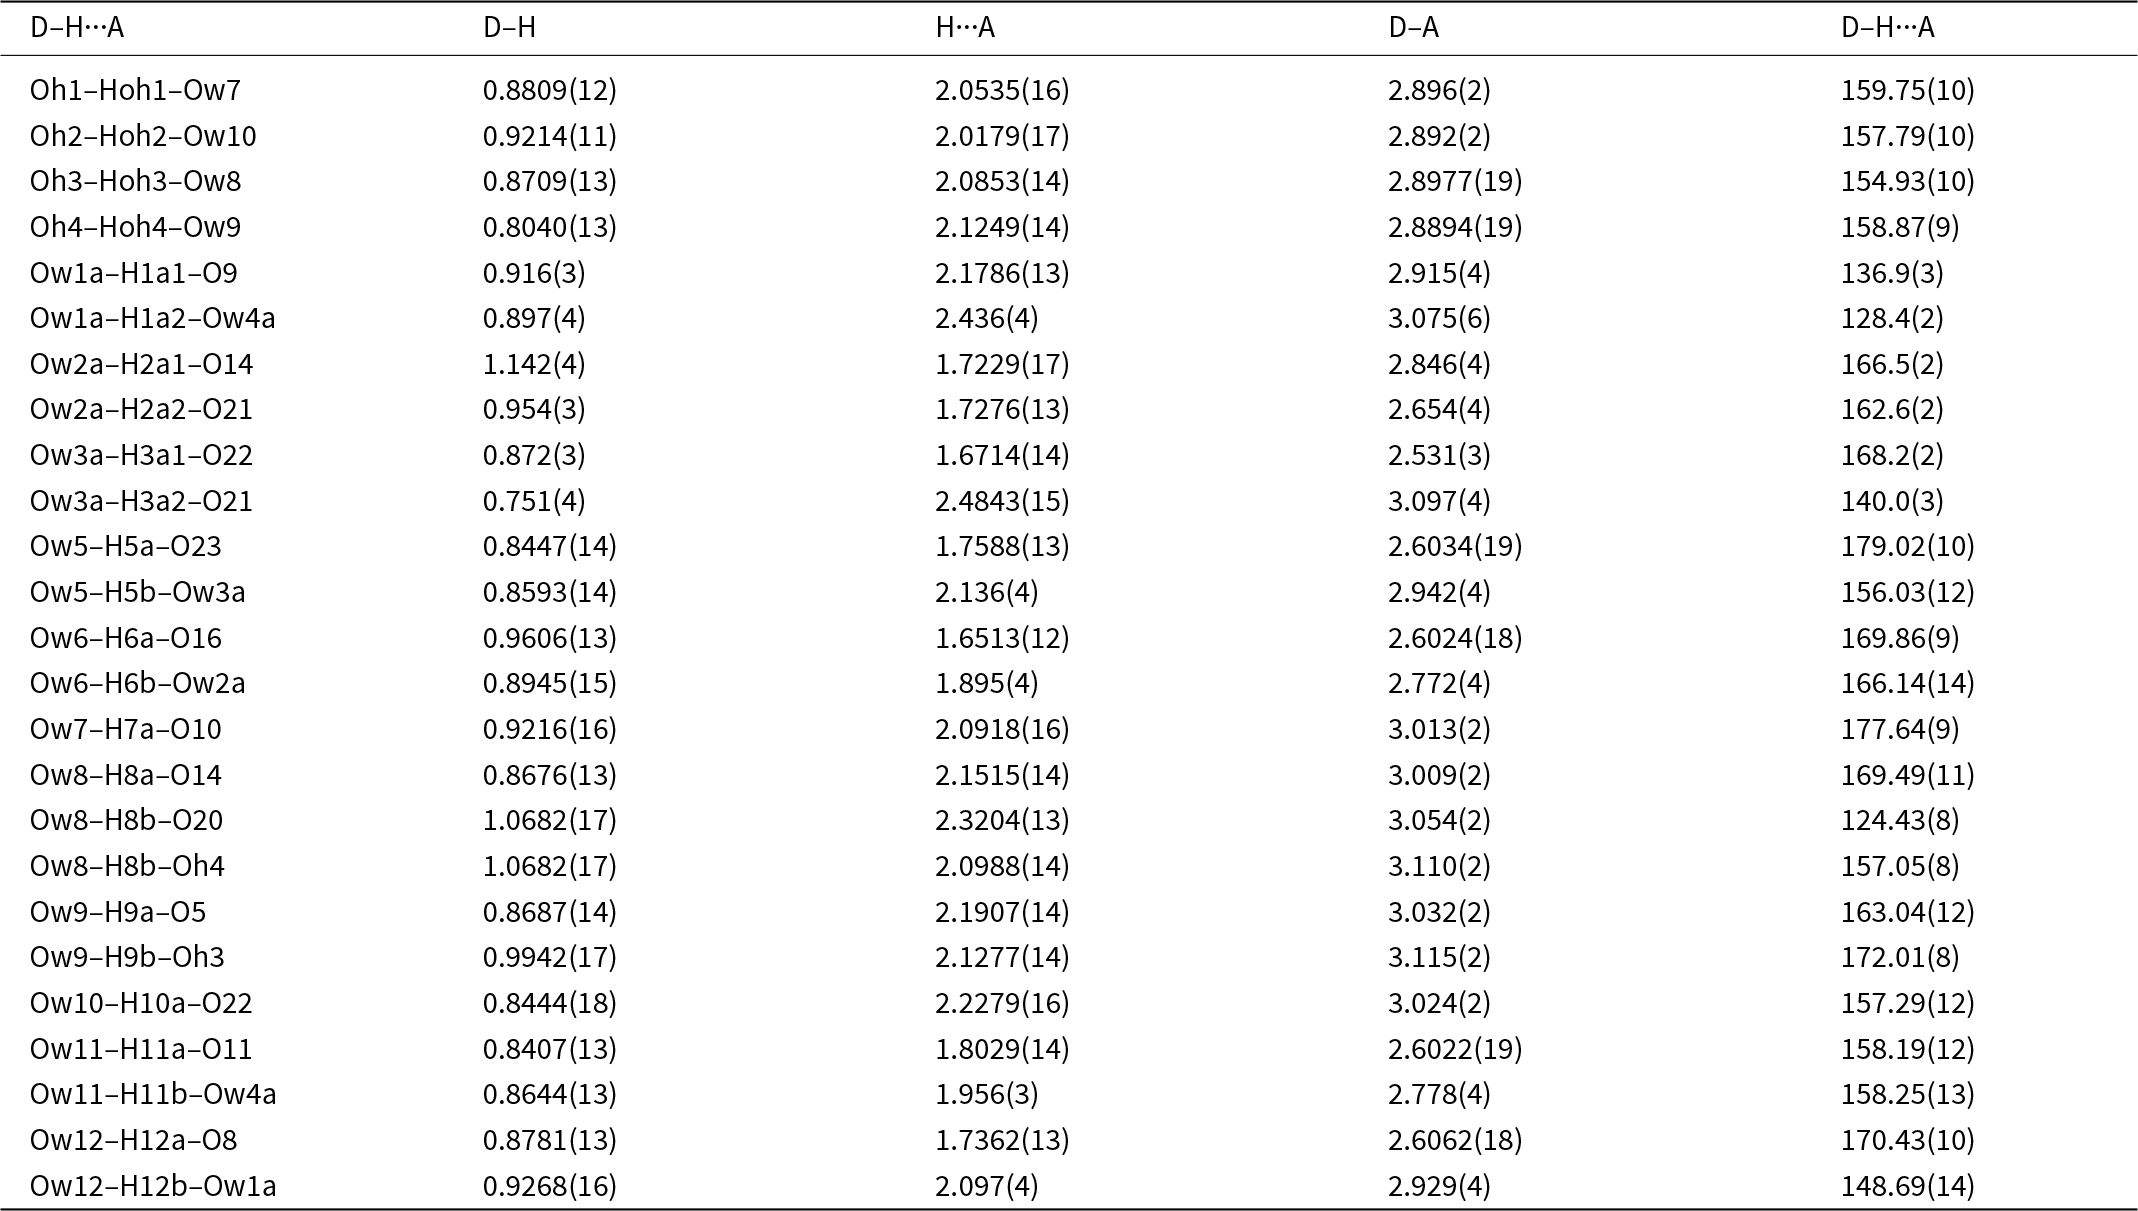
The polyhedral bond distances are reported in Table 4. An interesting result from the refinement is that Fe is preferentially ordered in the Al2 site, which contains 36% Fe compared with only 12% Fe at the Al1 site. As shown in Fig. 2a, the Al1-centred octahedron shares two edges with Ca2O8 polyhedra whereas the Al2 octahedron is involved in only corner-sharing with other polyhedra, and so has more flexibility to accommodate a larger cation.

Figure 2. [001] projections of the (a) C2/c average structure and (b) C2 structure model for fanfaniite from Hühnerkobel, Bavaria. Only the Mn1 site, with the higher site occupancy is shown.
Table 4. Polyhedral distances for C2/c model for fanfaniite

C2 refinement
The processing of the fanfaniite dataset using space group C2/c gave 38 merged reflections that violated the c-glide extinction condition (h0l, l = 2n + 1) of which 15 had I > 3σ(I). Although very weak, the presence of these reflections indicate that fanfaniite from Hühnerkobel has a symmetry lower than C2/c. There are two maximal non-isomorphic subgroups of C2/c. These are C2 and P  $\bar 1$. Only the first of these allows splitting of the A site into two sites with the possibility of ordering of the A site cations in one of the sites. A similar situation of the presence of weak reflections violating the c-glide condition was reported by Fanfani et al. (Reference Fanfani, Nunzi, Zanazzi and Zanzari1976) for montgomeryite. These authors proposed that Mg was ordered into one of the split sites in a C2 modelling of the structure, although they were not able to refine the complete C2 model because of strong correlations between the parameters of the split sites.
The C2/c coordinate and reflection files were transformed into the C2 subgroup using JANA2006. The site occupancies at the split Mn1 and Mn2 sites were first refined, and then the coordinates and ADPS were refined with restrictions to keep equal the ADPs of the split Mn and Ow3 site atoms. H atoms coordinated to oxygen at the OH, Ow1 and Ow2 pairs of sites were located in difference-Fourier maps and included in the refinement with the coordinates fixed and with refinement of a common isotropic displacement parameter. The refinement converged to Robs = 0.028 for 3890 observed reflections with I > 3σ(I). The partial Robs for the 15 observed h0l, l = 2n+1 reflections was 0.089. Other refinement results are given in Table 2. The refined parameters, including calculated BVS are reported in Table 5 and the polyhedral bond distances are given in Table 6. Although there were numerous high correlations between the parameters of split pairs of atoms in the C2 refinement, the crystal chemistry of the refined structure remained sound, as indicated by the normal ranges of bond distances in Table 6 and the BVS very close to those obtained in the C2/c refinement.
Table 5. Coordinates, site occupancies, equivalent isotropic displacement parameters and bond valence sums (valence units) for C2 model for fanfaniite

Table 6. Polyhedral distances for C2 model for fanfaniite

The refined site occupancies at the Mn sites were 0.510(3) for Mn1 and 0.378(3) for Mn2, with the mean value of 0.444 matching the refined Mn site occupancy of 0.445(2) from the C2/c refinement. The C2 model has a small but significant preference of Mn to occupy the Mn1 site. Atoms at the Mn1 site coordinate to Ow3a2 and Ow3b2 (Table 6), and it would be expected that the refined site occupancies at these sites should be higher than for Ow3a1 and Ow3b1 that coordinate to Mn2. The refined occupancies at the Ow3 sites in Table 5 do not support this, although the deviations of the site occupancies from 0.5 for all four Ow3 sites are < 3S.D.
As a check on the contribution of the Mn ordering to the h0l, l = 2n + 1 reflections, the site occupancies for the Mn1 and Mn2 sites from the above refinement were both set to the mean value of 0.444 and fixed. Refinement of the rest of the parameters converged at R obs = 0.029, and the partial R obs factor for the observed h0l, l = 2n + 1 reflections was 0.14. On release of the site occupancies at Mn1 and Mn2, subsequent refinement did not significantly change the R factors or site occupancies. Thus the fitting of the ‘forbidden’ c-glide reflections using the C2 model can be largely achieved without invoking any order at the A sites.
P $\bar {\textit{1}}$ refinement with doubled a cell parameter – kingsmountite model

As mentioned in the Introduction, screen images of the diffraction data obtained during the data collection showed rows of strong sharp spots with very weak, streaked spots halfway between. A screenshot showing the diffuse reflections halfway between sharp spots orientated along a* is shown in Fig. 3. These weak diffuse reflections were not picked up by the synchrotron software in the data indexing routine. By analogy with kingsmountite, the diffuse reflections correspond to a doubling of the a axis. In a transmission electron microscopy study of the holotype kingsmountite mineral (Grey et al., Reference Grey, Kampf, Smith, Williams and MacRae2019a), we observed weak diffuse reflections corresponding to a doubling of the a axis and we obtained a good refinement of the structure for a kingsmountite crystal from the Foote mine using a triclinic unit cell, related to the monoclinic cell by the matrix (2 0 0, –0.5 0.5 0, 0 0 1), with a doubling of a. The refinement confirmed 85% ordering of the A-site cation (Fe2+) in kingsmountite.

Figure 3. Screenshot of diffraction by fanfaniite. Red arrows show diffuse reflections corresponding to a doubling of a.
The synchrotron frame data for fanfaniite was reprocessed by forcing a kingsmountite-type triclinic cell with doubled a parameter. The resulting reflection file contained an additional 3822 reflections with h odd, of which 17% (656 reflections) had I > 3σ(I). The refinement input file for triclinic kingsmountite was used to initiate the refinement in P  $\bar 1$, with Mn replacing Fe at the two A sites and with Ca replacing Mn at the Mn3 site. Mixed Al/Fe occupancy was used for the five independent Al sites. The Ow1 to Ow4 sites, involved in coordination to the A site cations, were each split into pairs, as was done for Ow3 in the C2/c refinement. After cycles of anisotropic displacement parameter refinements, a difference-Fourier map was used to locate 25 of the possible 28 H atoms. These were included and a H group isotropic displacement parameter was refined. The final refinement converged at Robs = 0.025 for 4266 observed reflections with I > 3σ(I). An Robs value of 0.19 was obtained for 656 observed reflections with h = 2n+1. Although this is elevated, it is not unreasonable considering that most of the observed reflections giving the doubled a cell parameter are barely above 3σ(I). The other refinement details are given in Table 2. The refined coordinates, equivalent isotropic displacement parameters, site occupancies and BVS are reported in Table 7 and polyhedral bond distances in Table 8.
Table 7. Coordinates, site occupancies, equivalent isotropic displacement parameters and bond valence sums (valence units) for kingsmountite triclinic model for fanfaniite

Table 8. Polyhedral distances for kingsmountite triclinic model for fanfaniite

The site occupancies for the split A sites, based on using the Mn scattering curve for the mixed Mn0.48Al0.21Fe0.31 occupancy, are 0.497(1) for Mn1 and 0.397(1) for Mn2. Scaling the summed 0.894 occupancy to 1 gives values of 0.556 and 0.444 for the corrected occupancies. It is interesting to note that the refined site occupancies for Ow1a to Ow4a, coordinated to Mn1 are in the ranges 0.56 to 0.61 and those for Ow1b to Ow4b, coordinated to Mn2 are in the range 0.39 to 0.44, which are reasonably consistent with the occupancies of the metal sites. This is in contrast to the C2 refinement where there was no relationship between the Mn site occupancies and the occupancies of the coordinating water molecules.
The H-bonding scheme for the kingsmountite P  $\bar 1$ model of fanfaniite, is given in Table 9. The oxygen atoms that have low BVS in Table 7 (calculated for metal atom contributions only) all feature as acceptor atoms for H bonds in Table 9. Noteworthy are the strong H-bonds, with D–A ≈ 2.60 Å, associated with Ow5, Ow6, Ow11 and Ow12 as donors to oxygens shared between Al and P. The H bond between Ow3a and O22 is associated with a particularly short D–A distance of 1.53 Å. A similar short D–A distance of 1.54 Å involving Ow3 has also been reported for montgomeryite (Fanfaniite et al., Reference Fanfani, Nunzi, Zanazzi and Zanzari1976).
Table 9. H bonding in fanfaniite from Hühnerkobel (Å, °). Kingsmountite triclinic model

Discussion
The C2/c structural model that has been widely reported for calcioferrite-group minerals is an average structure, with disordered, half-occupied A sites and associated coordinated water molecules. Two alternative models have been reported to describe ordering of the A site cations: the C2 model proposed for montgomeryite by Fanfani et al. (Reference Fanfani, Nunzi, Zanazzi and Zanzari1976) and the P  $\bar 1$ model with doubled a cell parameter reported for kingsmountite(Grey et al., Reference Grey, Kampf, Smith, Williams and MacRae2019a).
Although the non-centrosymmetric C2 model gave a satisfactory refinement for fanfaniite, as indicated by the results in Tables 2, 5 and 6, there are some concerns as to its validity. An analysis of the normalised structure factors (E values) for the fanfaniite diffraction data gave a very good fit to the distribution curve for a centrosymmetric model. The mean value of ǀE2–1ǀ of 0.939 compares with values of 0.968 for centrosymmetry and 0.736 for non-centrosymmetry, giving a probability of the structure being centrosymmetric of 90.2%. If the C2 model is valid, it can only be so for extremely small regions, of a size comparable to the unit cell (nanoscale domains). A refinement of the C2 model as a twinned structure with the inversion centre as the twin operator gave exactly 50% for the volumes of the two twin domains. This is another indication that the twin domains must be on a very fine scale. A projection of the C2 model along [001] is shown in Fig. 2b. The octahedron is plotted only for the more-highly occupied A site, Mn1. A comparison with the average structure in Fig. 2a shows that the ordering at the A sites in C2 gives occupied A-centred octahedra on one side only of the heteropolyhedral layers.
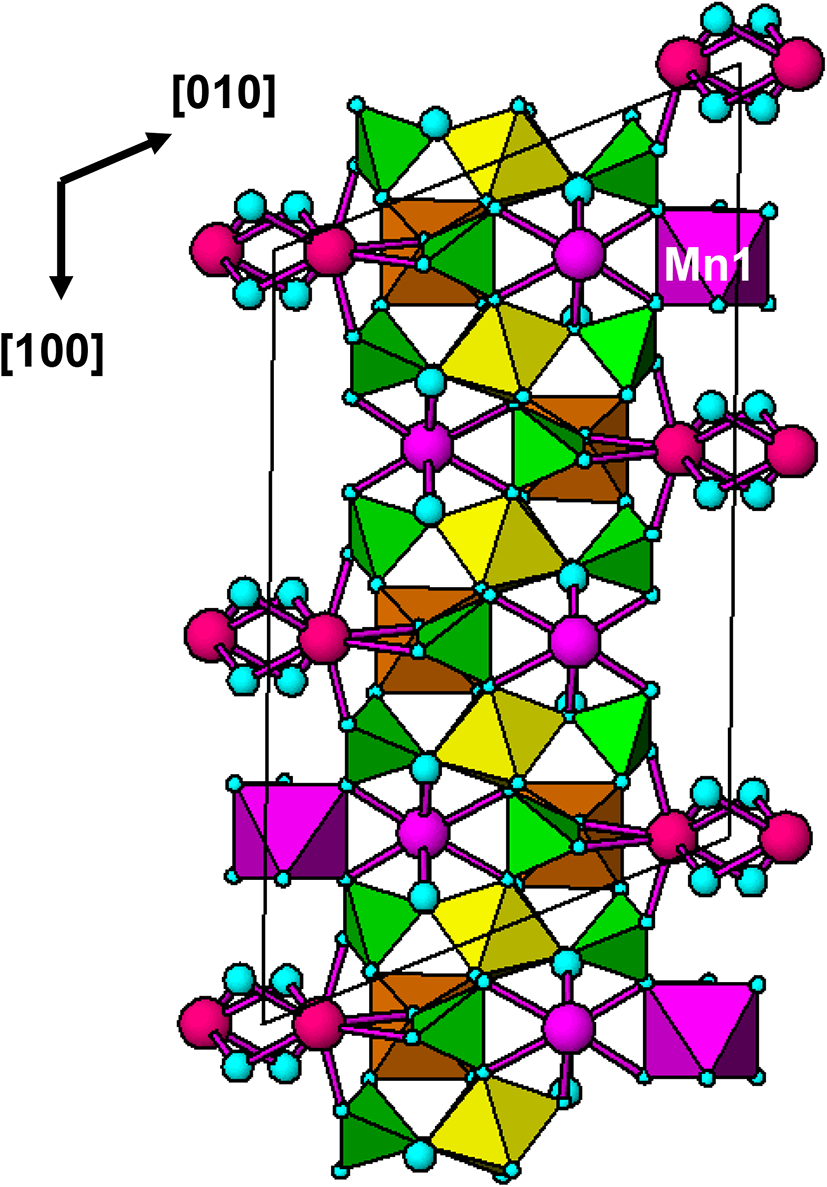
The [001] projection of the kingsmountite-type triclinic model with doubled a cell parameter is shown in Fig. 4. In contrast to the C2 model, the P  $\bar 1$ doubled-a model has ordering of the A-site cations on both sides of the heteropolyhedral layers, and with an alternation of filled and vacant sites (for complete order) along [100]. Whereas for kingsmountite the A-site order was 85%, for fanfaniite from Hühnerkobel the ordering is only 56%. Such a low degree of ordering was manifested in extremely weak and diffuse reflections with h = 2n + 1, that were streaked along a*.

Figure 4. [001] projection of triclinic P  $\bar 1$ model with doubled a parameter, for fanfaniite. Only the Mn1 site, with the higher site occupancy is shown.
In kingsmountite, in addition to the A-site ordering, there is also partial substitution of octahedrally coordinated Mn for 8-coordinated Ca at the Ca3 site (9% Mn at Mn3) and the Ca4 site (82% Mn at Mn4). The Ca site composition for kingsmountite is Ca3.15Mn0.85, corresponding to 21% substitution of Mn. The fanfaniite empirical composition contains only a very minor 4 at.% substitution of Mn at the Ca sites. Difference-Fourier maps from the fanfaniite refinement showed very weak peaks (<0.8 e– A3) displaced by ~0.8 A from Ca3 and Ca4 that corresponded to the Mn3 and Mn4 positions in kingsmountite. Inclusion of these atoms in the refinement gave site occupancies of only 0.01–0.02, so they were not incorporated into the final refinement. Nevertheless, their presence further confirms the validity of the kingsmountite triclinic structure for fanfaniite.
In conclusion, the triclinic structure has been validated for fanfaniite from Hühnerkobel, while there are doubts about the C2 model; if it contributes, then it does so in very small, unit-cell-scale domains. Future studies on new and known calcioferrite-group minerals should examine very closely the diffraction patterns for possible doubling of the a axis relative to the commonly determined C2/c average structure unit cell, to check if the triclinic model ordering is applicable.
Acknowledgements
We thank Cameron Davidson for preparation of specimens for EMP analyses.
Supplementary material
The supplementary material for this article can be found at https://doi.org/10.1180/mgm.2025.10116.
Competing interests
The authors declare none.


 Open access