


Introduction
Urban resilience is the ability of cities to adapt to changes, overcome crises and persist in the face of disturbances (Godschalk Reference Godschalk2003; Meerow et al. Reference Meerow, Newell and Stults2016; Smith Reference Smith2023). Cities offer numerous benefits, including access to resources, institutions and facilities, a high level of connectivity and flow (of people, goods, transport, ideas) and high social diversity and interaction, but their rigid infrastructures and built environments can render them more vulnerable to crises. In urban studies, crises are usually defined as disruptions or instabilities that affect the resilience of urban systems, caused by natural disasters, economic shocks, social unrest or infrastructure failures (e.g. Xu et al. Reference Xu, Li, Tan and Deng2021).
This article explores urban resilience in Northern Mesopotamia, focusing on the Bronze and Iron Age Khabur Valley (Figure 1). Numerous studies have used settlement data to understand settlement and social systems in this region, in particular the rise and fall of early urban centres during the fourth and third millennia BC (see reviews in Ur Reference Ur2010; Wilkinson et al. Reference Wilkinson2014; McMahon Reference McMahon2020). However, a generic framework to link urbanism and resilience based on quantitative data is still missing.

Figure 1. Overview of the study area in the Khabur Valley with hollow ways illustrated in blue (figure by Deborah Priß).
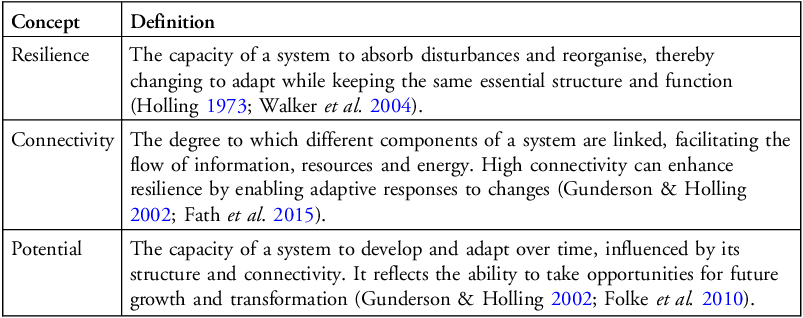
Resilience concerns the ability of a system to cope with significant disturbances and was first defined by Holling (Reference Holling1973) for ecological systems. Different perspectives on resilience emphasise aspects such as robustness, redundancy, adaptability and transformability (e.g. Holling Reference Holling1973; Walker et al. Reference Walker, Holling, Carpenter and Kinzig2004; Folke et al. Reference Folke, Carpenter, Walker, Scheffer, Chapin and Rockström2010; Meerow et al. Reference Meerow, Newell and Stults2016). In the context of archaeology, demonstrating resilience involves linking sociopolitical and environmental changes to observable patterns in the archaeological record; for example, the persistence of settlements or the capacity for innovation and transformation in response to crises (Allcock Reference Allcock2017; Daems & Vandam Reference Daems and Vandam2024).
We use Holling’s adaptive cycle (AC; Holling Reference Holling1973) to describe urban resilience in the Khabur Valley. The AC consists of four phases that an ecological system passes through, and which describe its level of resilience: growth, conservation, release and reorganisation. We employ the AC across six chronological periods, from Early Bronze Age 1 (3000–2500 BC) to Iron Age 2 (900–600 BC) (Table 1). We focus on remnants of an ancient route system—hollow ways—that offer insights into past human movement and connections (Wilkinson Reference Wilkinson1993; Ur Reference Ur, Snead, Erickson and Darling2009). We operate at a single regional scale to maintain sample sizes and data quality; consequently, we do not take advantage of one of the strengths of the AC, the nested approach to cross-scale interaction, ‘panarchy’ (Gunderson & Holling Reference Gunderson and Holling2002).
Table 1. Regional chronology of the study area.

Hollow ways in Northern Mesopotamia are shallow linear depressions that typically radiate from settlements. They are interpreted as traces of ancient route systems, formed by the quotidian movement of people and animals across the landscape (Wilkinson Reference Wilkinson1993; Ur Reference Ur, Snead, Erickson and Darling2009). Negative features such as hollow ways are difficult to date but their association with archaeological sites and evidence from limited excavations suggest they formed from at least the fourth millennium BC (Ur Reference Ur, Snead, Erickson and Darling2009; Wilkinson et al. Reference Wilkinson, French, Ur and Semple2010).
In this article, we use network metrics to investigate resilience by fitting Holling’s AC to concrete expectations around the network behaviours of settlement systems. We use enhanced datasets of hollow ways and settlements (Priß et al. Reference Priß, Wainwright, Lawrence, Turnbull, Prell, Karittevlis and Ioannides2025) from which we created period-specific network graphs (Figure 2). We connected the digitised fragments of hollow ways to reconstruct long-distance routes between settlements, using a hybrid approach that combines manually drawing lines in ArcGIS with a bespoke computational algorithm. Missing settlements were predicted with another algorithm, based on the hollow ways radiating from settlements. From these enhanced datasets, we created network graphs in which dated settlements represent the nodes while reconstructed hollow ways illustrate the edges connecting them. Network metrics were calculated from these graphs using the R package igraph (Csárdi et al. Reference Csárdi2025).

Figure 2. Hollow-way and settlement networks represented as graphs for the individual periods. Colours indicate the survey projects that recorded the settlements. The gaps between the groups of sites (clusters) represent the geographical gaps between surveyed areas (figure by authors).
A common criticism of the AC is that the model is invoked retrospectively to explain a particular dataset, rather than it being transformed into a set of hypotheses that can be confirmed or rejected based on a test against the archaeological data (Riris & de Souza Reference Riris and de Souza2021). In this article, we translate our specifications of resilience theory into relevant network metrics, based on a theoretical understanding of the Khabur Valley and its dynamic developments, instead of predetermining ideas of regional history.
Urban resilience in archaeology
Broadly, there are two approaches to resilience in ecology (Van Meerbeek et al. Reference Van Meerbeek, Jucker and Svenning2021): Pimm (Reference Pimm1984) defines resilience as an empirical property of a phenomenon, while Holling (Reference Holling1973) describes resilience as a dynamic process with the system going through specific phases. Resilience theoretical approaches in archaeology have mainly drawn on the latter (Redman & Kinzig Reference Redman and Kinzig2003; Bradtmöller et al. Reference Bradtmöller, Grimm and Riel-Salvatore2017). Using models developed in one discipline (here ecology) to analyse phenomena from another (here archaeology) generates a need to tailor theories to the empirical affordances of the analysed discipline. We take a step in this direction by using the AC to set expectations for archaeological data.
Urban centres, past or present, are complex systems that involve dynamic physical, social and environmental networks and interactions condensed within a (more or less) clearly defined but restricted space (Godschalk Reference Godschalk2003; Meerow et al. Reference Meerow, Newell and Stults2016). Holling’s AC describes how a system repeatedly undergoes four phases: growth (r phase), conservation (K phase), release (α phase) and reorganisation (Ω phase) (Figure 3) (Gunderson & Holling Reference Gunderson and Holling2002). Each phase is characterised by different levels of connectivity and potential that define how flexible or vulnerable a system is in a non-linear way (see Table 2). High connectivity makes the system more flexible and increases its ability to react to unexpected events, but if the connectivity exceeds a certain level, the system becomes inflexible and therefore vulnerable.

Figure 3. The adaptive cycle as defined by Holling (Reference Holling1973) with the four phases a system goes through repeatedly over time (source: Castell & Schrenk Reference zu Castell and Schrenk2020: fig. 1).
Table 2. Definitions of the three dimensions of Holling’s adaptive cycle.

In archaeology, the AC is usually translated into the resilience of coupled social-ecological settlements to environmental (climate change, soil degradation, disease), social (social hierarchy, depopulation, mobility) or political (warfare, regime shifts) disturbances (see Newton et al. Reference Newton, Coward, Elliott, Jenkins, Linden, Riris and Silva2024; Bradtmöller et al. Reference Bradtmöller, Grimm and Riel-Salvatore2017; Middleton Reference Middleton2017). While resilience studies in other disciplines often cover short timescales of years to centuries, archaeology offers a unique long-term perspective (Redman & Kinzig Reference Redman and Kinzig2003; Silva et al. Reference Silva2022; Riris et al. Reference Riris2024), although archaeological data and their interpretations need to be employed with caution (Stump Reference Stump2010, Reference Stump2013).
Linking network properties to the adaptive cycle
Networks are powerful tools to analyse interactions between entities (Strogatz Reference Strogatz2001; Prell Reference Prell2012; Barabási & Pósfai Reference Barabási and Pósfai2016). AC approaches are amenable to network approaches due to their focus on connectivity. Zu Castell and Schrenk (Reference zu Castell and Schrenk2020) and Schrenk and colleagues (Reference Schrenk, Garcia-Perez, Schreiber and zu Castell2022) demonstrate how to translate real-world complex systems, such as genotypes and European economies, into networks to define properties that correspond to the three systemic variables of the AC (connectivity, potential, resilience), thereby offering a generic method to operationalise the AC and investigate the resilience of a complex system. Although there are qualitative applications of the AC in archaeology (Marsh Reference Marsh2016), a quantitative study like those by zu Castell and Schrenk (Reference zu Castell and Schrenk2020) and Schrenk and colleagues (Reference Schrenk, Garcia-Perez, Schreiber and zu Castell2022) is still missing. We take these studies as inspiration but define our own parameters and variables for connectedness and potential, carefully considering our system and its characteristics.
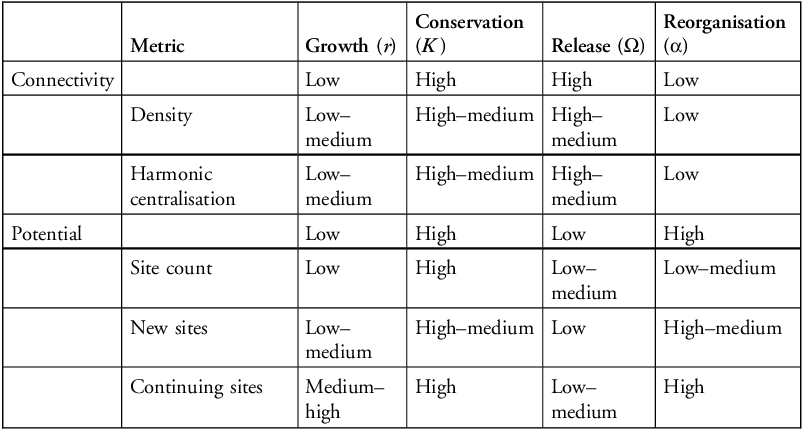
We determine the network metrics harmonic centralisation and density as representations for connectivity. Centralisation illustrates the level of node closeness, whereby higher closeness centralisation would allow flows to move quickly through the network and hence provide the basis for fast development and progress, facilitated by short connections. Density (see e.g. Barabási & Pósfai Reference Barabási and Pósfai2016) captures the proportion of potential edges that exist in a given network. A high-density score would imply a high number of edges in the network and therefore a high connectivity. Such a network property would similarly enable the easy exchange of goods, knowledge and labour and facilitate a certain adaptability to the impact of disturbances by distributing those impacts within the network. However, a high density and a high centralisation make the system more vulnerable to disruptions, which can spread faster and more easily through highly connected environments (Hanneman & Riddle Reference Hanneman and Riddle2005).
We propose that in the Khabur Valley in the Bronze and Iron Ages, potential is positively related to the number of sites. If there are more sites in one period, the potential of people migrating and building new relationships with other settlements, allowing flows of goods, information and people to move faster and more easily and extending the social and economic system, likely increases. More sites also foster social diversity, allow the spread of innovation, provide labour and facilitate progress. Changes in site counts do not capture processes of nucleation and dispersal. These are important in relation to urbanisation, which may assimilate local rural settlement, although as urbanisation is associated with continued rural growth, it is less of an issue in this region (Lawrence & Wilkinson Reference Lawrence and Wilkinson2015). It would be useful to include measures of settlement diversity or specialisation as well, but our dataset precludes this type of analysis.
Where records of site size changes are available from survey or excavation, the different sizes were included in our analysis. Where site size was recorded through remote sensing only, or was not differentiated by fieldwork teams, we utilised the same size throughout. Since many of the larger sites in the region have been surveyed, we do not think unrecorded site-size changes substantially affect our results.
The level of potential and connectivity together determine the phase of the AC (Table 3). In the growth phase, we would expect a low connectivity and a low potential, in other words a low number of sites and a low number of connections among sites. The conservation phase is characterised by high connectivity and high potential. In the release phase, the system may experience a shock, which decreases the potential (site numbers) while connectivity is still high. The reorganisation phase displays low connectivity and high potential, which is predicted to manifest in low values for the relevant network metrics and high site numbers.
Table 3. Level of connectivity and potential of a system in the four phases of the adaptive cycle. Note that those levels are either increasing or decreasing in a specific phase.

Although there might be other network metrics that can be used to represent the three dimensions of the AC (e.g. transitivity for connectivity, degree distribution for potential or communities for resilience), we chose the above metrics after testing a variety of metrics and determining they were the best for assessing change in our networks and data environment.
Network metrics in the Bronze and Iron Age Khabur Valley
Settlements in a specific region and/or period can be defined as entities in networks. The settlement dataset used for this analysis (Priß et al. Reference Priß, Wainwright, Lawrence, Turnbull, Prell, Karittevlis and Ioannides2025) is based on distinct survey and excavation projects, each employing the specific chronologies of the respective region, tied into standard local sequences (Ur Reference Ur2010). Although missing data are an inherent issue in archaeology, we are confident that, with our methods to fill the gaps, we were able to capture enough sites for a representative sample. Small, ephemeral sites might potentially be under-represented because they are more easily eroded or destroyed completely; however, such sites are rarely recovered, even in intensive surveys, suggesting they were not a major feature of settlement systems in this region.
In addition to the documented settlements, the region provides one of the best-preserved ancient route systems in the world, the hollow ways (Wilkinson Reference Wilkinson1993; Ur Reference Ur, Snead, Erickson and Darling2009). These have been mapped from satellite images (Ur Reference Ur2003, Reference Ur2008) and exhibit specific patterns that can help us interpret the landscape. While some hollow ways disappear when they reach the outer boundaries of a settlement’s agricultural area, others are long-distance routes connecting settlements (Wilkinson Reference Wilkinson1993; Ur Reference Ur, Snead, Erickson and Darling2009; Wilkinson et al. Reference Wilkinson, French, Ur and Semple2010). The record of the hollow ways is fragmented, and we connected the fragments to generate a more complete data set (Priß et al. Reference Priß, Wainwright, Lawrence, Turnbull, Prell, Karittevlis and Ioannides2025). We assume that a connecting hollow way is a good proxy for interaction within the network.
We use harmonic centralisation, which was developed specifically for disconnected networks (i.e. networks with missing edges and/or nodes resulting in incomplete connections), an inherent issue in archaeological networks (Rochat Reference Rochat2009). For harmonic centrality, larger networks tend to have lower values because the average shortest path length increases with size (Chen et al. Reference Chen, Jing and Sun2021). If there are hubs (urban sites), they might cause shorter path lengths (higher centrality) because they potentially connect otherwise distant parts of the network. Density is calculated as the ratio of existing edges to all possible edges in a network. Larger networks tend to have a lower density because the number of possible edges increases quadratically with the number of nodes, while the actual number of edges often grows linearly or sub-linearly (Groenhuijzen & Verhagen Reference Groenhuijzen and Verhagen2016). In our case, networks with more nodes (e.g. MBA or IA2) are likely to have lower density compared to the smaller networks (e.g. LBA and IA1). Hence, our results must be seen as a preliminary attempt to define connectivity and potential that should be adapted to the specific networks analysed with it. However, in the context of our study, we consider the size of the networks as being in the same magnitude (i.e. between 136 and 255 nodes).
The overall site count in a specific period indicates not only the capacity of the social system to change, but also its capacity to support life (i.e. population size). An increasing population from one period to the next indicates that the social system has enough resources available to enable the population to grow, and in turn, a growing population can indicate the potential for change, as more people represent more opportunities for new connections. Those connections, moreover, enable the exchange of resources, such as food, knowledge and assistance (Dijkstra Reference Dijkstra, Alhajj and Rokne2018). For example, when connections are clustered together, this can reflect the inherent benefits of belonging to cohesive subgroups (Wellman Reference Wellman1983).
The number of continuing sites, relative to the number of new sites, can be interpreted as a metric of sustainability and resilience (Lawrence et al. Reference Lawrence, Palmisano and de Gruchy2021, Reference Lawrence, de Gruchy, Hinojosa-Baliño and Al-Hamdani2023). Hence, if the number of new sites and the number of continuing sites increase from one period to the next, the settlement system can be assumed to be resilient and adaptive to disturbances. An increase in the number of new sites while the number of continuing sites decreases indicates that there is still potential (i.e. the system is adaptive) but that for some reason, existing sites are less resilient, perhaps due to changes in the political, social, economic or environmental conditions (e.g. unsustainable urbanism leading to the abandonment of centres and the foundation of new rural sites or a reorganisation in settlement initiated by a new political system). Conversely, decreasing numbers of new sites and an increasing proportion of continuing sites could either imply a weaker pull effect of urban sites, leading to a consolidation without growth—which would only be visible at the site level if sufficient data are available—or that existing sites are experiencing a sustainable phase with a potentially growing population and sufficient resources so that new site foundations are not necessary (e.g. a boom of urbanism with a pull effect of large centres or the recovery after a disturbance or reorganisation event).
The number of continuing and new sites is directly related to the overall site count, so that fluctuation in resilience parameters (continuing and new sites) influence fluctuations in potential (overall site count), while potential impacts the connectivity parameters since density and centralisation are inherently dependent on the number of nodes. This cross-correlation illustrates the interdependencies between connectivity, potential and resilience as observed by Holling (Reference Holling2001).
The network properties for the individual periods are shown in Table 4 (for R code and data files see https://zenodo.org/records/14140732 and https://github.com/dpriss/Filling_the_gaps, respectively). The values are evaluated relative to each other (i.e. the high values are high compared to those of the other periods and the low values are the lowest of all the periods) and classified into equal tertiles: low, medium and high. This approach was chosen because the values are often similar and a simple distinction between low and high would not differentiate between them. A comparison of the relative network property values of the individual periods allows for a more precise analysis.
Table 4. Network properties of the individual periods.

Key: Asterisks for network metrics and overall site count indicate a high (***), medium (**) or low (*) value. Asterisks for new sites indicate an increase (***) or decrease (*) of site numbers. Percentage of continuing sites from one period to another is given in brackets. Continuing sites and asterisks represent a high (***) or low (*) level of persistence.
The adaptive cycles of the Khabur Valley
Our interpretation of the developments in the Khabur Valley from the Early Bronze Age to the Iron Age as phases of the AC is shown in Figure 4. The Early Bronze Age 1 (EBA1) is characterised by high connectivity and low potential, which corresponds to the release phase. After the Uruk expansion and the first urban revolution in the Late Chalcolithic (4000–3100 BC), there was a shift towards pastoralism in the region, accompanied by a reduction in tiers in the site hierarchy (de Gruchy Reference de Gruchy2017).

Figure 4. The adaptive cycle of the Khabur Valley from the Early Bronze Age to the Iron Age (figure by authors).
Following this release phase, the Early Bronze Age 2 (EBA2) displays characteristics of the reorganisation phase: low connectivity (i.e. low values of density and centralisation) but medium potential (i.e. a low site count and a high number of continuing sites). This reorganisation is not one phase but rather reflects a period of urban boom-and-bust cycles (Ur Reference Ur2010; Lawrence et al. Reference Lawrence, Palmisano and de Gruchy2021). During boom phases, extensive urbanisation took place, evidenced by an increase of the number and size of large settlements and the emergence of hierarchical structures within the settlement system, with surplus agricultural production at rural sites maintaining elite political, religious and specialist classes based in urban centres (Lawrence & Wilkinson Reference Lawrence and Wilkinson2015). Some settlements quickly grow and gain importance, becoming regional centres and hubs for exchange that attract migration. Boom phases were likely characterised by increased agricultural productivity, trade and the establishment of shared storage systems, which facilitated economic expansion (Pfälzner Reference Pfälzner, Al-Maqdissī, Matoïan and Nicolle2007; Ur Reference Ur2010). However, these dense urban systems exceeded local sustainable resource limits and became more vulnerable to shocks (Lawrence et al. Reference Lawrence, Palmisano and de Gruchy2021), including rapid climate change events (Weiss et al. Reference Weiss, Courty, Wetterstrom, Guichard, Senior, Meadow and Curnow1993). The region entered a bust phase, observable through a decline in settlement numbers and hierarchy and a lower urban density as population decreased or migrated. While the Early Bronze Age 2 consists of several boom-and-bust cycles that contribute to the slower and hierarchically higher cycle of this time, those smaller cycles cannot be distinguished due to the coarse temporal resolution of the data.
In the Middle Bronze Age (MBA), we observe low density and centralisation, while the potential is high. It is therefore plausible that this period represents the end of the reorganisation phase of which the Early Bronze Age 2 marks the beginning. In the first half of the Bronze Age, kingdoms emerged after the reorganisation in the Early Bronze Age 2. However, these kingdoms were unstable, with shifting borders and alliances (Altaweel & Squitieri Reference Altaweel and Squitieri2018). The settlement landscape only stabilised with the rise of centralised empires in the second half of the Middle Bronze Age (Palmisano & Altaweel Reference Palmisano and Altaweel2015), illustrating the transition into the growth phase.
In the Late Bronze Age (LBA), connectivity and potential decreased, entering the growth phase. At the beginning of the Late Bronze Age, the rise of the Mitanni (a regional Empire that ruled parts of northern Syria and southeast Anatolia from c. 1550–1260 BC) brought stability (von Dassow Reference von Dassow, Radner, Moeller and Potts2022), indicating that the region slowly exited the reorganisation phase of the Middle Bronze Age.
Subsequently, the Iron Age 1 (IA1) exhibits low connectivity and low potential, indicating that the settlement system was still in the growth phase but an accumulation of people and resources had already initiated the conservation phase. These results reflect the settlement landscape after the Late Bronze Age: although the Middle Assyrian Empire was not, or at least only marginally, affected by the socioeconomic instability and political transition at the end of the Late Bronze Age, it still entered a period of decline, caused by internal conflicts, and lost territory (Altaweel & Squitieri Reference Altaweel and Squitieri2018), which it began to recover towards the end of Iron Age 1. Hence, the Late Bronze Age and Iron Age 1 together reflect rather turbulent times, with a reorientation of the settlement system combined with steady growth.
The recovery from this significant change in the settlement history is evident in Iron Age 2 (IA2) with a trend that illustrates a landscape of mainly small sites following the reorganisation of the Assyrian Empire (Liverani Reference Liverani, Rowlands, Larsen and Kristiansen1987; Akkermans & Schwartz Reference Akkermans and Schwartz2003; Wilkinson et al. Reference Wilkinson, Ur, Wilkinson and Altaweel2005). The large mounded tell sites were abandoned and instead a dense and evenly distributed network of small sites was established. There is also a high number of sites with more than two connections, indicating that flows were more or less equally distributed between sites. Rather than local hubs accumulating flows, Bronze Age routes were repurposed to funnel resources to imperial Neo-Assyrian capitals such as Assur and Nineveh (Wilkinson et al. Reference Wilkinson, Ur, Wilkinson and Altaweel2005). Levels of connectivity and potential are therefore both high in Iron Age 2, reflecting the newly established exchange routes and an increase in interactions within the centralised empire, thereby mapping this period to the conservation phase. In the Assyrian heartland, we can see a growth phase with a lot of canal-building and a high number of new settlements (Altaweel & Squitieri Reference Altaweel and Squitieri2018; von Dassow Reference von Dassow, Radner, Moeller and Potts2022). Hence, once polities reach the scale and extraction capacities of empires, uneven development can mean that different spatial units occupy different phases of the AC.
Conclusions
We examined urban resilience in the ancient Khabur Valley by employing an innovative network analysis framework grounded in resilience theory. By systematically mapping empirical data onto the AC, we developed theoretically informed hypotheses for how networks of settlements should behave under different AC phases and demonstrated how the settlement system of the Khabur Valley during the Bronze and Iron Ages meets these hypotheses. Our framework can be used across archaeological contexts where there is sufficient evidence to construct formal period-specific networks of settlements.
Our proxies (e.g. site size for population and importance) and our mapping approach make optimal use of a dataset that has an unusual level of completeness. Although the temporal resolution remains a constraint, it is possible to observe an underlying secular trend of increasing polity size, centralisation and hierarchy, moving from weak city states to established empires. The communities in the later phases had a different set of affordances and constraints than those in earlier phases and could therefore adapt in different ways. Early city states were dependent on very localised relations and settlement changes were conservative. Under the Assyrian Empire, technological and social changes meant that settlement systems were much more flexible, due to either top-down decision making, infrastructure or changes in social organisation resulting in higher adaptive capacity.
Future work could add to the analysis by including data at different scales to describe the dynamic process in the context of panarchy. To increase the analytical resolution, data on the site or even household level and higher temporal resolution would be required. Our work on the Iron Age also shows that broadening the scale further to entire empires could also enhance understanding at more local scales. More generally, here we have demonstrated that by combining AC and network science in a historic and prehistoric context, we can contribute to a broader archaeological agenda in understanding the resilience of human societies in general and urban resilience in particular. To do this we need to build rigorous and explicit models which can bridge the gap between empirical data and higher-level theoretical concepts such as the AC.
Data availability statement
The data and analysis have been presented in Priß et al. (Reference Priß, Wainwright, Lawrence, Turnbull, Prell, Karittevlis and Ioannides2025). The respective data files and scripts are available on GitHub (https://github.com/dpriss/Filling_the_gaps) and Zenodo (https://zenodo.org/records/14140732). Calculations for network metrics are presented in the script ‘5.Descriptive_network_analysis’.
Funding statement
This project has received funding from the European Union’s Horizon 2020 research and innovation programme under the Marie Skłodowska-Curie grant agreement o. 859937.
Author contributions: CRediT Taxonomy
Deborah Priß: Conceptualization-Lead, Methodology-Lead, Writing - original draft-Lead, Writing - review editing-Lead. Dan Lawrence: Conceptualization-Supporting, Methodology-Supporting, Writing - original draft-Supporting, Writing - review editing-Supporting. John Wainwright: Conceptualization-Supporting, Methodology-Supporting, Writing - original draft-Supporting, Writing - review editing-Supporting. Christina Prell: Conceptualization-Supporting, Methodology-Supporting, Writing - review editing-Equal. Laura Turnbull: Conceptualization-Supporting, Methodology-Supporting, Writing - review editing-Supporting.


 Open access