


Introduction
The genus Pteridium Gleditsch ex Scopoli (1760: 169), widely referred to as bracken, is a species of fern that thrives in both temperate and tropical regions around the globe. Fossil evidence indicates that genus Pteridium emerged approximately 55 million years ago. Within this genus, Pteridium aquilinum (Linnaeus 1753: 1075) Kuhn (1879: 11) represents a complex species comprising several varieties (POWO, 2024). The taxonomy of the genus Pteridium is complex and controversial. After a revision by Tryon (Reference Tryon1941), this genus was classified as monospecific, although several additional species had been described in this group of ferns prior to that. Recent studies, however, have identified two distinct species within the genus: P. aquilinum in the Northern Hemisphere and Pteridium esculentum in the Southern Hemisphere (Wolf et al., Reference Wolf, Rowe, Kinosian, Der, Lockhart, Shepherd, McLenachan and Thomson2019). Examination of genetic diversity of P. aquilinum and P. esculentum is challenging due to inconsistencies in morphological variation resulting from environmental factors (Schwartsburd and Prado, Reference Schwartsburd and Prado2014).
Tryon recognized a single species, P. aquilinum, in Iran. Subspecies ranks have been assigned to various morphotypes of P. aquilinum in different regions across the world. For instance, Zhou et al. (Reference Zhou, Dong, Chen, Zhang, Wen and Schneider2014) identified two diploid species based on sequence data from three chloroplast regions: P. aquilinum in the Northern Hemisphere and Africa, and P. esculentum (Forster, 1786: 74) Cockayne (1908: 34) in South America and Australia. In the Iranian context, only one species is found, namely P. aquilinum (Azadi, Reference Azadi2016). Additionally, the only subspecies present in Iran is P. aquilinum subsp. aquilinum, along with the variety var. aquilinum, which is distributed from Ardabil to Astara (Khoshravesh et al., Reference Khoshravesh, Akhani, Eskandari and Greuter2009). In northern Iran, it is notable that P. aquilinum commonly colonizes habitats that have emerged as a result of human activities. The results suggest that this species thrives in diverse environments, such as deserted agricultural fields, disturbed forests and high-altitude pastures. Several distinct factors in northern Iran influence the distribution of this species in the area, including climatic conditions, soil characteristics, topographical elements, temperature and precipitation (Amouzgar et al., Reference Amouzgar, Ghorbani, Shokri, Marrs and Alday2020). Moreover, research findings indicate that any human-induced alterations in the semi-arid ecosystems of Iran, such as those in Mazandaran, may facilitate the invasion of this species (Amouzgar et al., Reference Amouzgar, Ghorbani, Shokri, Marrs and Alday2020).
P. aquilinum is a perennial fern characterized by a creeping and branched rhizome capable of extensive spread. Given its asexual reproduction, it is expected that genetic diversity within populations would be lower compared to genetic diversity between populations.
P. aquilinum possesses several notable characteristics, including its aggressive growth, adaptability and resilience to environmental stresses such as fire. P. aquilinum possesses a robust underground stem that serves as a storage site for carbohydrates, with a diameter that can exceed 2.5 cm. Its leaf arrangement is alternate. The fronds of the eagle fern can range from 30 to 60 cm in length. The leaf blade is divided into pinnae, and each pinna is further divided into smaller segments called pinnules. Fertile fronds produce spores within sporangia (POWO, 2024) (Fig. 1). This species also demonstrates a strong reproductive ability and has the potential to persist for over a year. Although there are some beneficial traits associated with its pesticidal and insecticidal properties (Donnelly et al., Reference Donnelly, Robertson and Robinson2002), P. aquilinum is more commonly known for its negative impacts on ecosystems and habitats as well as on the health of both animals and humans (Mira et al., Reference Mira, Ramírez, Londoño and Castañeda2021). As a result, it is classified as a noxious weed that contributes to the decline of native biodiversity (Akpinar et al., Reference Akpınar, Alday, Cox, McAllister, Le Duc, Pakeman and Marrs2023). For these reasons, it is important to understand the population structure of P. aquilinum to inform conservation of ecosystems and habitats and to protect human and animal health.
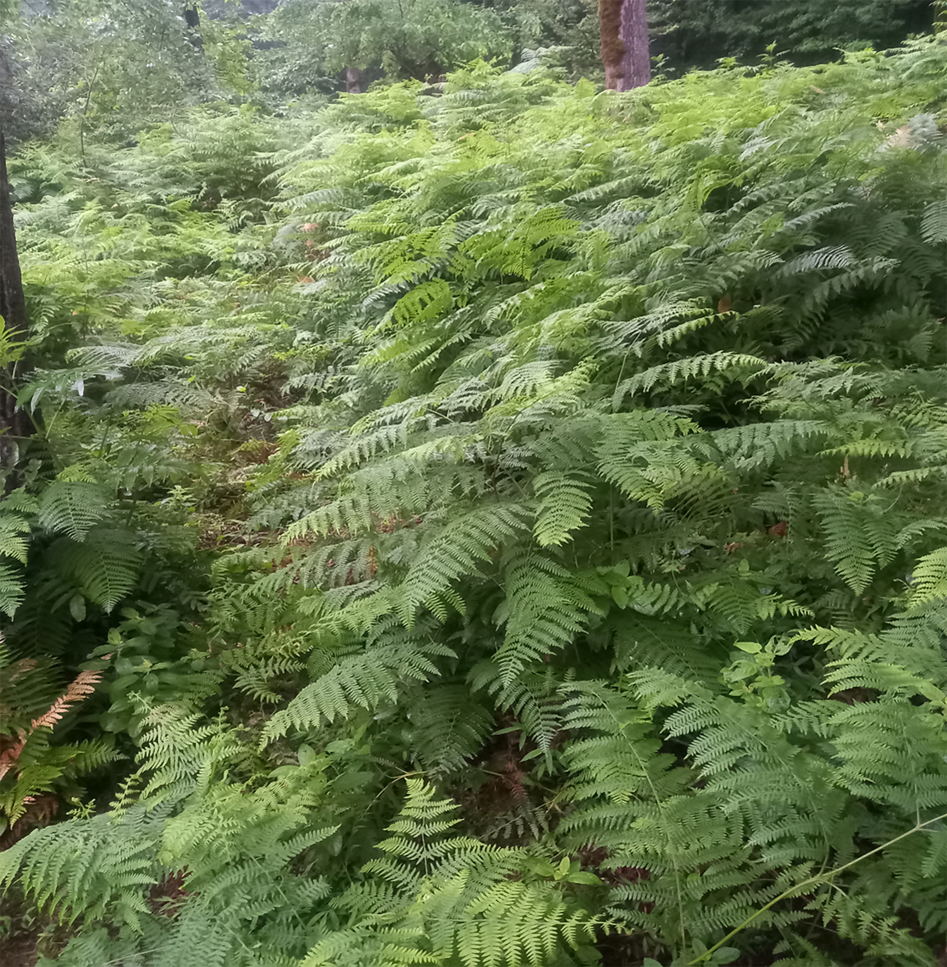
Figure 1. Pteridium aquilinum fern in its natural habitat in Mazandaran province, Iran.
Despite the sporadic presence of P. aquilinum in Iran, there is currently no documented research regarding the genetic structure and morphological plasticity of these plants within the country. The present study aims to address this gap by investigating the potential relationships among genetics, morphology and the provenance of these plants. Understanding the genetic structure and morphological variability of P. aquilinum is crucial for several reasons. Firstly, it can provide valuable insights into the species' adaptability to different environmental conditions, which is particularly important in the context of climate change and shifting habitats. Secondly, as the species can impact local biodiversity and ecosystems, understanding its genetic diversity is vital for informed conservation efforts. Furthermore, given the lack of prior research on this topic in Iran, this study is both novel and timely, filling a significant gap in the understanding of the species' ecological and evolutionary dynamics in the region. By elucidating these relationships, this study contributes to the broader field of population genetics and offers insights that may be valuable for both conservation biology and ecological management.
Materials and methods
Taxon sampling
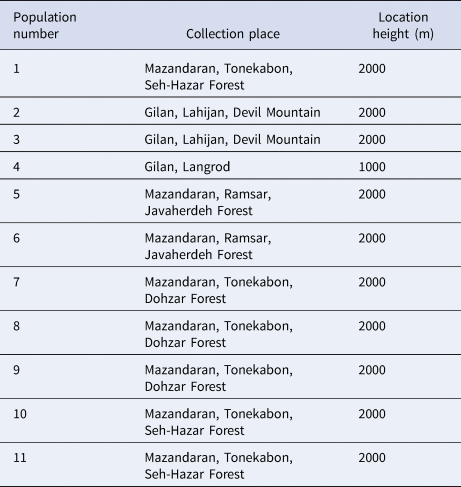
A total of 133 plants from 11 populations across three geographical regions in northern Iran were sampled for morphological and molecular marker analyses (Fig. 2; Table 1). For molecular marker studies, the leaves of the collected samples were dried as herbarium specimens according to standard protocols (Seshagirirao et al., Reference Seshagirirao, Harikrishnanaik, Venumadhav, Nanibabu, Jamir, Ratnamma, Jena and Babarao2016) and voucher specimens for each leaf were deposited in the herbarium of Shahid Beheshti University, Tehran. To ensure that each sampled leaf represented a distinct individual plant within a population, samples were collected at intervals of approximately 10 m apart, with 5–10 samples taken from each population. Identification of the specimens was performed using ‘The Flora of Iran’ (Azadi, Reference Azadi2016).
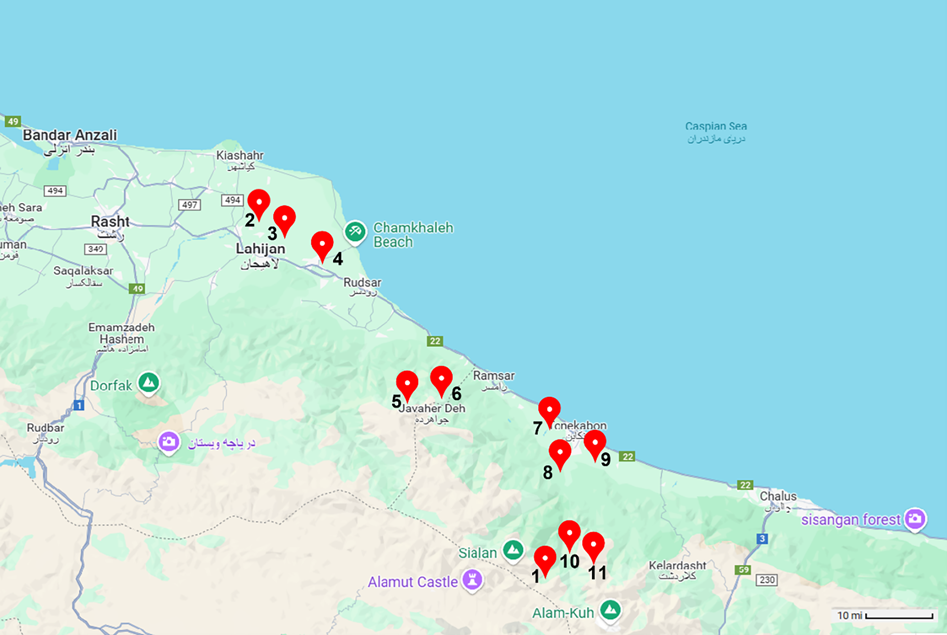
Figure 2. Geographical map of the studied populations in P. aquilinum in Iran (the numbers 1–11 correspond to the respective populations).
Table 1. Addresses and heights of the collected plants
Morphological analysis
For the morphological analysis, seven distinct traits were evaluated and quantified using absolute measurements: stipe indumentum, pinnule shape, number of pinnae, leaf type, pinnule margin, size of pinnae and size of pinnules. Prior to statistical analysis, all traits were standardized (mean = 0, variance = 1) to ensure comparability. To assess morphological differentiation among populations, we applied the unweighted pair group method with arithmetic mean (UPGMA) clustering method to the standardized morphological data. Additionally, principal component analysis (PCA) was performed to identify the most variable morphological traits across the populations.
The Mantel test (Mantel, Reference Mantel1967; Sokal and Rohlf, Reference Sokal and Rohlf1995) was used to assess the correlation between genetic and geographical distances among the studied populations. Additionally, Pearson's correlation coefficient was calculated to determine the relationships among the various variables. All analyses were conducted using PAST version 2.17.
Genetic diversity analysis
For the start codon targeted (SCoT) marker analysis, genomic DNA was extracted using the cetyltrimethylammonium bromide (CTAB) protocol (Sheidai et al., Reference Sheidai, Shagholi, Keshavarzi, Koohdar and Ijbari2019). The quality of the extracted DNA was assessed by running 1 μg of each sample on a 1% agarose gel, stained with Power Loud (Kowsar, Iran). DNA quality was evaluated based on the integrity and clarity of the bands, with the presence of a clear, intact high molecular weight band being considered indicative of high-quality DNA. Additionally, the absence of degradation, smearing or shearing on the gel was used as a further measure of DNA integrity.
Three primers were used in this study, following the work of Collard and Mackill (Reference Collard and Mackill2009): SCoT1 (CAACAATGGCTACCACCA), SCoT2 (CAACAATGGCTACCACCC) and SCoT41 (CAATGGCTACCACTGACA). Leaf DNA was extracted using a modified CTAB method, which included 2-mercaptoethanol to eliminate phenolic compounds. To assess the quality of the extracted DNA, a 1% agarose gel was prepared. Polymerase chain reactions were carried out with the following thermal cycling protocol: initial denaturation at 94°C for 5 min, followed by 40 cycles of denaturation at 94°C for 1 min, annealing at 50–60°C for 1 min, extension at 72°C for 2 min and a final extension step at 72°C for 5 min.
The SCoT bands generated were treated as two-state binary characters (coded as present = 1, absent = 0) and used for subsequent analyses. To evaluate the suitability of the SCoT markers, detrended correspondence analysis (DCA) was employed (Hill and Gauch, Reference Hill and Gauch1980).
The discriminating power of the bands was assessed using discriminant analysis of principal components (DAPC), specifically designed for binary data, implemented in the R package 4.1. Additionally, Nei's G st value was calculated using the POPGENE program version 3.1. Various genetic diversity parameters, including the number of effective alleles (N e), Shannon index (I), Nei's genetic diversity (H e) and percentage of polymorphism (%P), were determined using GeneAlex version 6.4.
Two methods were employed to investigate the genetic distinctness of the populations: UPGMA clustering, which evaluated whether the replicates of each population formed separate clusters, and analysis of molecular variance (AMOVA), performed using GeneAlex software. Furthermore, DAPC in R package 4.1 was used to group plants based on genetic data and to identify discriminating SCoT loci among the studied populations. Gene flow among the studied plants was illustrated through assignment analyses.
Association studies for geographical variables
We conducted redundancy analysis (RDA) to assess the influence of geographic variables – such as longitude, latitude and altitude – on the genetic differentiation of populations. Specifically, we aimed to measure how these geographic factors correlate with the genetic variation observed between populations. This approach integrates environmental and spatial variables to evaluate their combined impact on the genetic structure of the studied populations. In the analysis, both multiple regression and ordination methods were applied, with principal components passing through multiple regression models to quantify the relationship between geographic and genetic variables (Legendre and Legendre, Reference Legendre and Legendre2012; Segovia et al., Reference Segovia, González-Wevar and Haye2020).
Association between genetic loci and morphological characters
The impact of population genetic structure (fragmentation) is mitigated by employing PCA, which leads to more accurate results when combined with the Bonferroni correction. Without applying this correction, preliminary conclusions may erroneously identify numerous genetic regions as correlated, despite not all having significant correlations. This can result in type I errors, where false positives occur by incorrectly asserting significance for uncorrelated genetic regions.
While the Bonferroni correction helps control type I errors, it may also increase the likelihood of type II errors, leading to the misclassification of truly correlated genetic regions as non-significant (false negatives). Thus, other correction methods, such as the false-discovery rate (FDR) can be used. The Bonferroni correction is recognized as a family-wise error rate method, whereas FDR correction aims to minimize type I errors by preventing the erroneous acceptance of significance in multiple comparisons. This approach for determining significance has been suggested by Frichot et al. (Reference Frichot, Schoville, Bouchard and Francois2013).
To address both types I and II errors in our analyses, we employed both FDR tests and the Bonferroni correction, utilizing R package 4.1. Additionally, to enhance the accuracy of the model presented by DAPC, we implemented a cross-validation method as executed in R 4.1.
Results
Morphological results
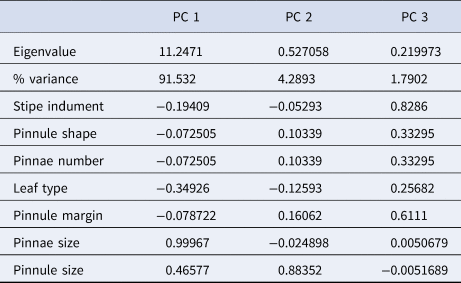
Details of the mean morphological characteristics across the 11 populations are presented in Table 2. The PCA results, based on these morphological traits, are presented in Table 3. The analysis indicates that the first three PCA axes together account for approximately 96% of the total variance.
Table 2. Results of morphological characters studied in P. aquilinum (populations numbered as in Table 1)
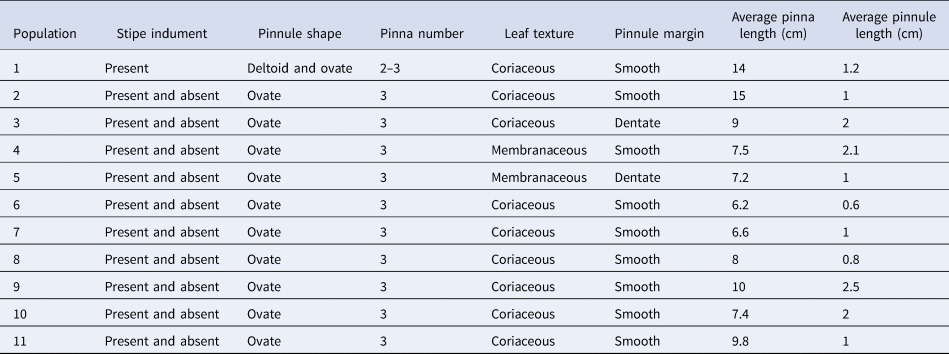
Table 3. PCA results of morphological characters
The Mantel test indicated a significant positive association (r = 0.33, P < 0.01), suggesting that the morphological differences among these populations may increase with their geographical distance. This pattern may be attributed to specific geographical and ecological local delimitations, which will be addressed in the following paragraphs.
Genetic diversity analysis
The DCA plot derived from SCoT data (online Supplementary Fig. X) illustrates that the loci are dispersed throughout the plot without significant clustering. This distribution indicates that these loci are suitable molecular markers, representing diverse genomic regions.
The frequency of SCoT bands/loci, with the number of bands varying from 14 to 22 is shown in online Supplementary Table X.
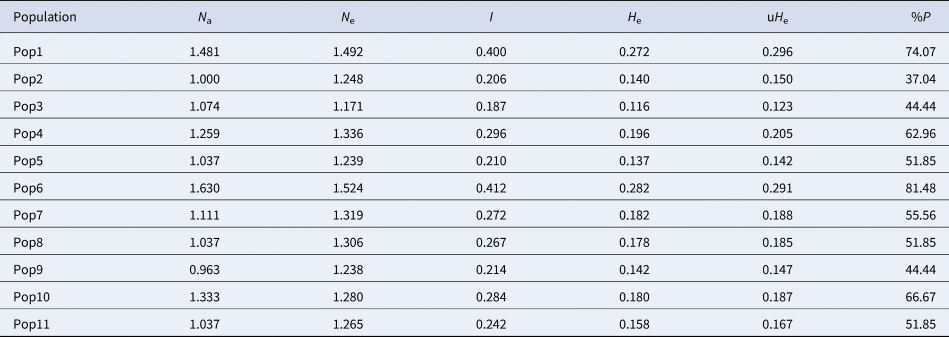
Genetic diversity parameters for P. aquilinum are presented in Table 4. Overall, the AMOVA results indicate that 63% of genetic variability is attributed to differences within populations, while 37% is due to differences among populations.
Table 4. Genetic diversity parameters in P. aquilinum populations
Nei's genetic distance analysis (Table 5) reveals a very low range of distances from 0.02 to 0.50, suggesting a high genetic similarity among the majority of these populations. A significant correlation between geographic and genetic distances was confirmed by Mantel's test.
Table 5. Nei genetic distance between P. aquilinum populations based on SCoT loci
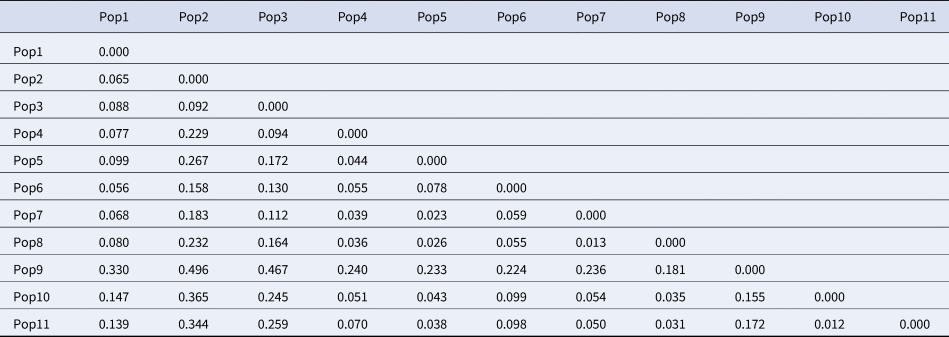
Populations 1–11 are according to Table 1.
DAPC analysis of the SCoT data indicated that the first three linear discriminant analysis (LDA) axes account for approximately 90% of the total genetic variability (Fig. 3A). The examined plants clustered into three genetic groups based on LDA analysis (Fig. 3B).
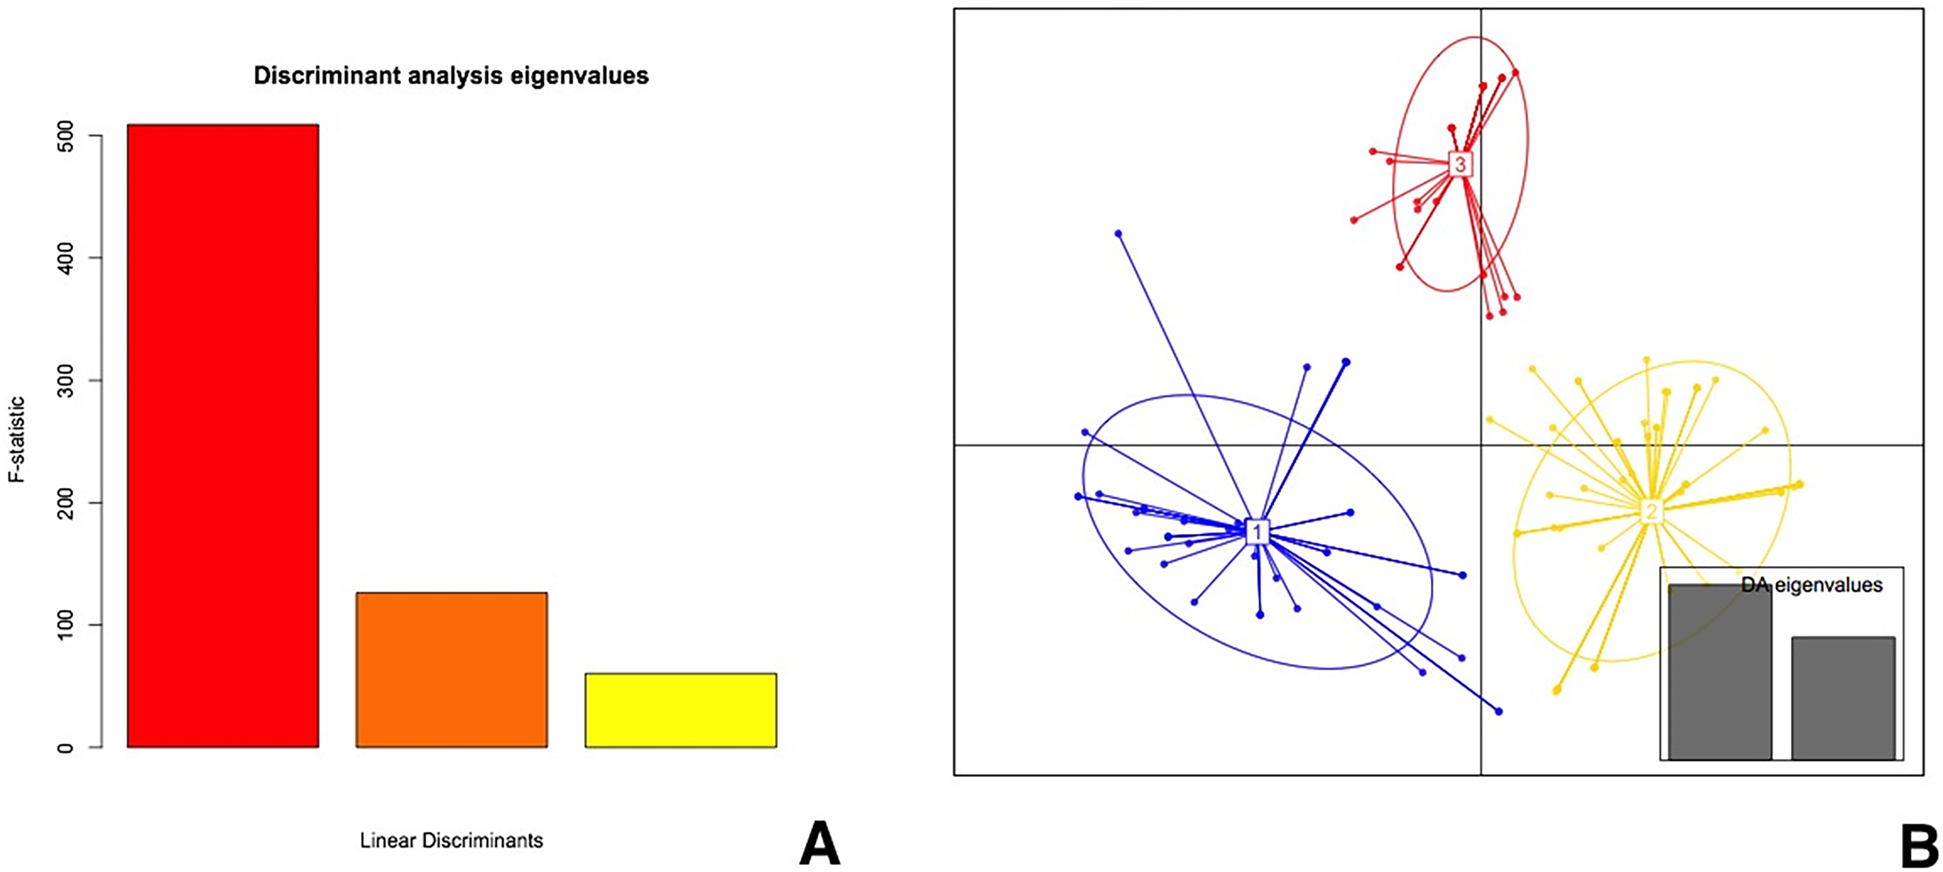
Figure 3. DAPC of P. aquilinum populations based on SCoT markers: (A) the eigenvalues of the linear discriminants and (B) a scatter plot of the first two linear discriminants, where each point represents an individual. Different colours represent different populations. Grey boxes indicate 95% confidence intervals around the centroid of each group.
Figure 4 presents a detailed view of genetic affinity and gene flow among the studied plants, with the three major genetic groups represented in distinct colours. These plants originate from different populations. Furthermore, the assignment test indicates some level of genetic admixture among these plants, consistent with G st analysis of SCoT loci, which produced N m = 0.95.
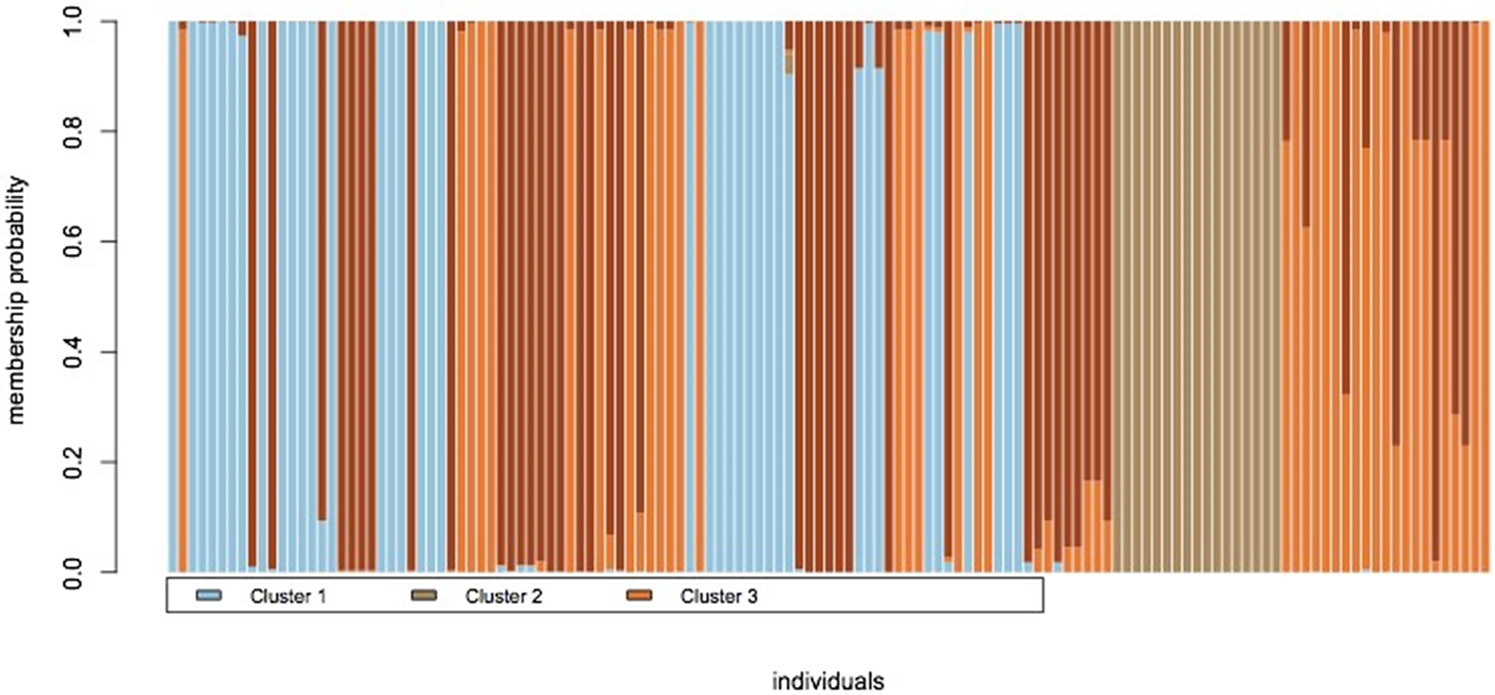
Figure 4. Assignment plot of P. aquilinum plants based on three genetic groups, showing admixture: each individual is represented by a vertical bar, and the height of each coloured segment within the bar indicates the probability of membership in one of the three inferred genetic clusters. Admixed individuals are represented by bars with multiple colours.
Association studies
The RDA plot revealed a significant association (P < 0.01) between SCoT loci and geographical variables (Fig. 5). Specifically, SCoT loci Nos. 2 and 7 are linked to longitude, whereas loci Nos. 6, 15, 13 and 1 show associations with latitude and elevation variables.
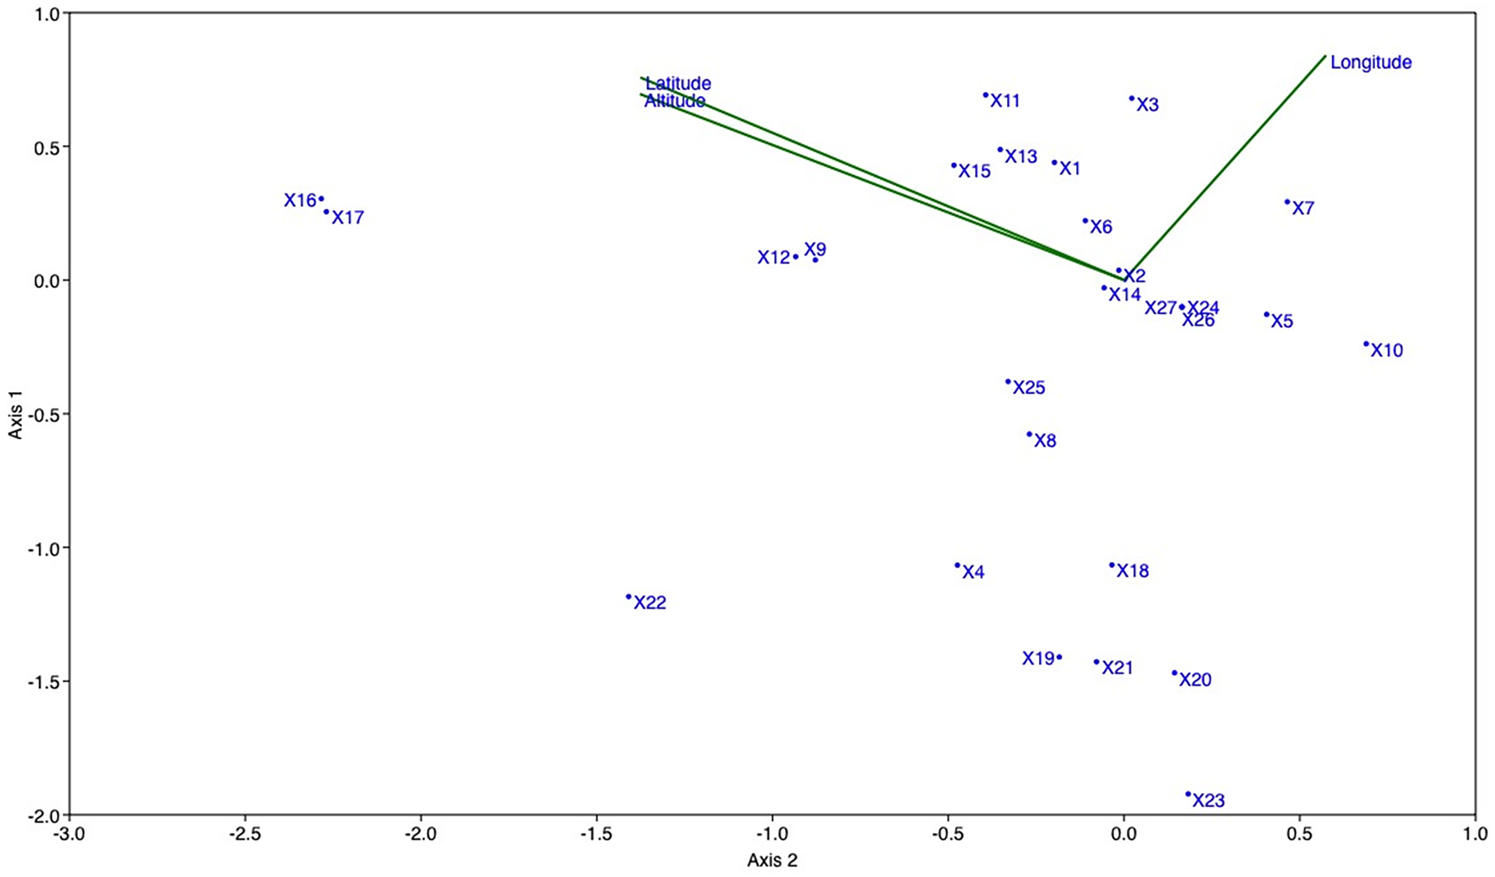
Figure 5. RDA plot between SCoT loci and geographical variables in P. aquilinum populations. Axes and points: each point represents a locus, and the axes represent the variation in band patterns of these loci. Green lines: these indicate the correlation between the loci and geographic variables.
Additionally, the results of the association studies for key morphological characteristics, identified through PCA, are illustrated in Fig. 6.
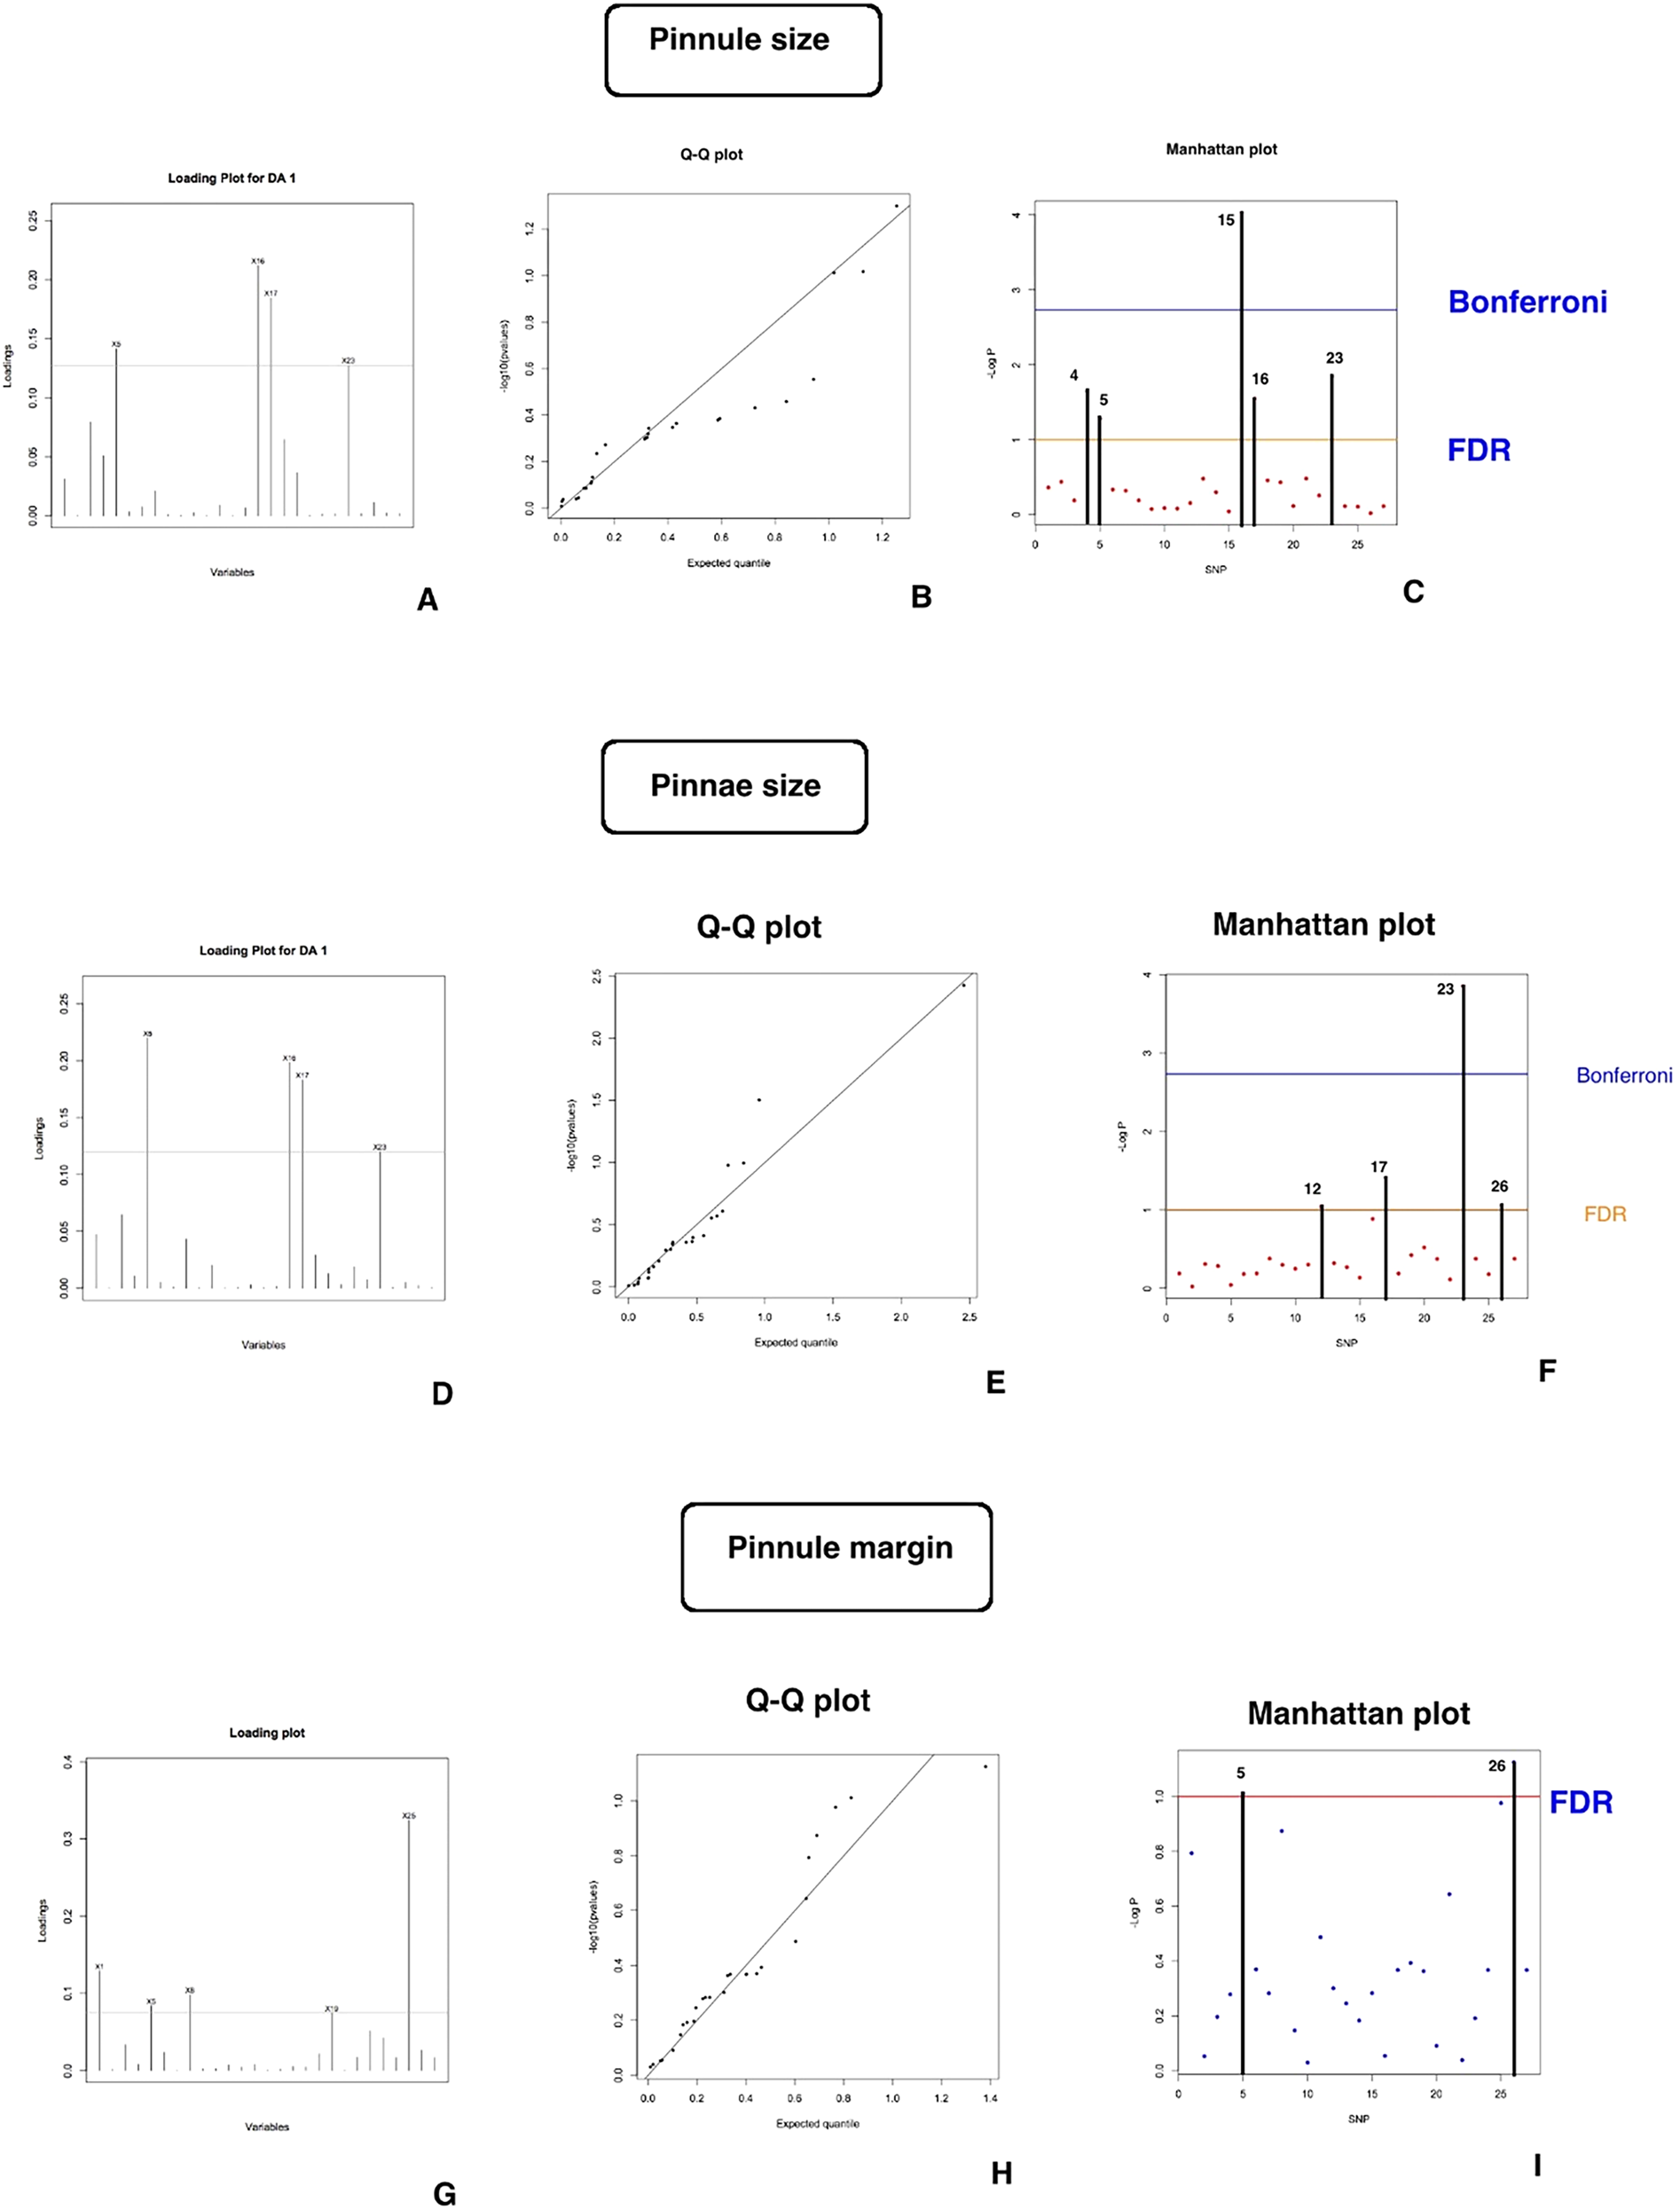
Figure 6. Association studies results of DAPC and LFMM (latent factor mixed models) methods showing significantly associated genetic regions with morphological characters.
Discussion
One of the most important findings of this study is the presence of significant genetic differences among populations of P. aquilinum, along with high genetic diversity within populations. These findings highlight the impacts of gene flow across large geographic scales. One factor that may influence gene flow and high genetic diversity is the dispersal of spores via wind. The results suggest that population mixing across different geographic areas, as observed in northern Iran, is likely. These findings align with Wolf et al. (Reference Wolf, Elizabeth Sheffield and Haufler Ch1991), which showed that spore dispersal can lead to high gene flow between distant populations, supporting the validity of our results. Furthermore, Akomolafe and Rahmad (Reference Akomolafe and Rahmad2018) identified P. aquilinum as a species with invasive potential. Understanding the mechanisms behind this species' invasion is crucial, and examining genetic diversity and gene flow between populations is key to understanding its survival and adaptability.
In this study, significant genetic diversity was observed in P. aquilinum populations in Iran, which contrasts with previous studies that suggested low genetic variation in this species, such as those of Korpelainen (Reference Korpelainen1995), who reported lower genetic diversity among populations.
This study explores various biological and genetic aspects of P. aquilinum, which can aid in a better understanding of the impacts of this species on ecosystems and biodiversity. As noted in previous studies (Fernández and Sierra, Reference Fernández, Sierra, Marimuthu, Fernández, Kumar and Thangaiah2022), the spread of this species is increasing in many parts of the world, particularly in regions with specific climate changes.
The gene flow index (N m = 0.95) calculated in this study indicates substantial gene exchange between populations. This value, however, is lower compared to European and global populations, suggesting regional genetic differentiation (Wolf et al., Reference Wolf, Rowe, Kinosian, Der, Lockhart, Shepherd, McLenachan and Thomson2019). Additionally, environmental factors, such as altitude, play a significant role in the genetic differentiation of P. aquilinum populations. The study found a significant correlation between altitude, latitude, longitude and genetic variation, which indicates that climatic and elevational changes may limit gene flow at local scales.
Morphological analyses and PCA also revealed high morphological similarity across populations, with notable distinctions. The ‘pinnae size’ had the highest positive correlation (r = 0.99) in the first principal component, while ‘pinnule size’ emerged as the most significant distinguishing feature in the second axis (r = 0.88).
Despite P. aquilinum's ability to form large colonies through creeping rhizomes, this study identified significant genetic diversity within populations, which is unexpected for a typically clonal species. The AMOVA analysis confirmed substantial genetic differentiation between populations, suggesting that geographic proximity does not fully explain genetic differences. Moreover, factors such as variable spore production rates, poor gametophyte growth, reproductive efficiency and vegetative propagation may contribute to this genetic differentiation (Fig. 7).
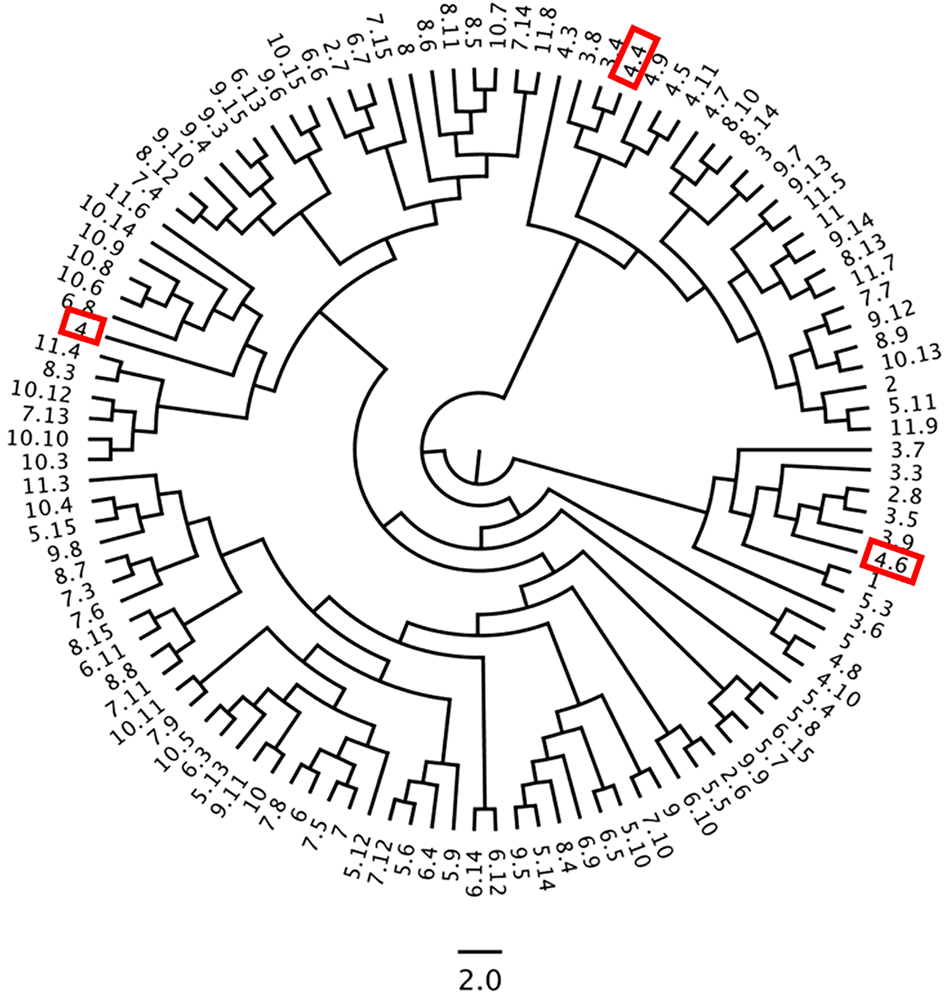
Figure 7. UPGMA dendrogram of morphological characters in P. aquilinum populations (the numbers highlighted in the red box refer to the individuals mentioned in the Discussion section. Each number is displayed as a paired ‘population number.individual number’).
The study also shows a significant correlation between genetic distance and geographic distance among populations. Wolf et al. (Reference Wolf, Haufler and Sheffield1987) found minimal genetic differentiation among British populations of P. aquilinum, suggesting random mating due to high gene flow. However, the current study found regional genetic differentiation, consistent with Wolf et al. (Reference Wolf, Rowe, Kinosian, Der, Lockhart, Shepherd, McLenachan and Thomson2019), who noted genetic differentiation at the continental scale, likely due to historically limited gene flow.
Finally, the research suggests the need for further studies comparing global populations of P. aquilinum using advanced molecular techniques to better understand its global genetic structure. Examining the impact of climate change and habitat shifts on spore dispersal and gene flow could provide deeper insights into how the plant adapts to various environmental conditions. Future studies could also explore the effects of soil factors (e.g. pH, nutrients) and the relationship between spore dispersal data and genetic patterns to better understand gene migration mechanisms.
This study demonstrates significant correlations between genetic regions and geographic variables, which could enhance our understanding of how environmental factors influence genetic diversity. It is suggested that genetically diverse populations could serve as valuable resources for germplasm collection in plant breeding programmes (Keneni et al., Reference Keneni, Dechassa, Bediye, Shimbir, Kaske, Mengistu, Kifle, Desalegn and Alemayehu2021).
Supplementary material
The supplementary material for this article can be found at https://doi.org/10.1017/S1479262124000698


