


And any people is happier who possess a variety of manufactures, than if they enjoyed one single great manufacture, in which they are all employed. Their situation is less precarious; and they will feel less sensibly those revolutions and uncertainties, to which every particular branch of commerce will always be exposed.
— David Hume, Of the Jealousy of Trade, 1742In the study of political economy, proximity is most often viewed as a benefit. Political scientists portray geographically concentrated industries as more politically potent, since they can better mobilize and push for their interests in public policy.Footnote 2 Business management textbooks tout industrial “hubs” as a source of positive spillovers and synergy, fostering innovation and firm productivity.Footnote 3 Policymakers concur, promising to boost local competitiveness by developing new regional hubs through strategic investments.Footnote 4
Yet for every Silicon Valley, there are fabric mill towns in South Carolina, coal counties in West Virginia, GM factory towns in Michigan and Wisconsin, and furniture manufacturing hubs in Mississippi, all of which have weathered increased economic pressure in recent decades. We argue that taking seriously the geographic concentration of these industries is key to accounting for the recent populist turn witnessed in developed countries.
Our premise is that layoffs and bankruptcies are not all alike in their political impacts. In this way, we follow a string of studies that claim that economic threats affecting difficult-to-replace jobs, owing either to skill or task specificity, or variation in regional demand, are especially politically significant.Footnote 5 Rather than looking to economic factors around labor mobility, however, we focus on the perceived social significance of some industries versus others. Our central claim is that geographically concentrated industries play a key role in shaping regional identity. Drawing on distinctiveness theory in social psychology, we expect that when a single industry dominates a region, individuals are more likely to see it as integral to their sense of place. As social networks are more intertwined with the industry, it becomes more representative of the community, reinforcing a shared regional identity. Shocks to such an industry are then perceived not just as economic setbacks, but as existential threats to the region’s social fabric and national standing. It is these shocks that trigger demands for restorative political action, rather than merely financial compensation.
For our purposes, geographically concentrated industries thus hold two key features: they are more likely to be viewed as representative of a region by the individuals living in that region, and they are associated with denser social networks. The confluence of economic shocks and geographically concentrated industries then produces the widely reported sense of loss that political entrepreneurs have capitalized on. Politicians on the populist right are best placed to frame economic decline as a cultural and social loss. By stoking up nostalgia for a lost past, they offer a narrative that resonates with those who view economic shocks as threats to their region’s identity. This sense of regional dispossession fuels demands for policies that promise to restore lost industries and push back against perceived threats to local ways of life. Right-wing candidates are thus able to mobilize political support by transforming economic distress into a broader grievance about identity, belonging, and regional status. In sum, we seek to provide some of the microfoundations for what has been dubbed the “economics of nostalgia.”Footnote 6
To investigate the elusive nature of jobs found in industries that are thought to make up the economic heartland of a nation, we employ multiple empirical approaches, the combination of which aims to provide a cohesive story. Through three original, quota-valid surveys on a total sample of over 7,300 Americans, we proxy for the deeply rooted social ties that such industries are associated with by asking respondents about the number of high-school peers working in their industry. We also elicit respondents’ perceptions of their region’s standing relative to the rest of the country, to capture the distinct impact that job losses in industrial hubs have on the surrounding communities, and how this relates to political attitudes. And using observational data on regional economic specialization—the same data used by the business and policy community touting the strengths of industrial hubs—we examine how such specialization is associated with the perception of economic shocks, and individuals’ behavior at the polls.
We make four related empirical claims. First, we offer evidence for an oft-mentioned yet inconclusively demonstrated phenomenon: one special feature of the recent period of deindustrialization in the United States is that it has disproportionately targeted industrial hubs. In concrete terms, geographically concentrated industries have experienced more job losses than job gains over the last twenty years. Exposure to globalization has been associated with a shift of employment away from geographically concentrated industries toward geographically diffuse industries.
Second, we turn to survey evidence to show how this matters. The effect of geography is driven in part by the overlap of employment and social networks in areas with geographically concentrated industries. We find that (1) living in areas that are home to geographically concentrated industries is associated with a higher number of pre-professional peers—proxied by high-school friends—working in the same industry; (2) individuals embedded in such networks also hold distinctive attitudes: they are significantly more likely to believe that politicians should intervene to prevent private-sector layoffs; and (3) economic shocks to industrial hubs also heighten the belief that political leaders should act, in ways that equivalent shocks to non-hub industries do not.
Third, respondents in industrial hubs perceive the fortunes of those industries as more closely tied to their region’s status. Specifically, geographically concentrated industries amplify the negative impact of economic shocks on respondents’ perception of their region’s standing, compared to the rest of the country. In this way, a region’s “hubness” means that shocks have effects that extend to all its inhabitants, even those not employed in the geographically concentrated industry itself. These effects persist when we control for respondents’ perceptions of their own subjective social standing, suggesting that the two are driven by distinct considerations, and that feelings of loss are not reducible to the economic fortunes of the household.Footnote 7 We then show that perceptions of regional standing are systematically related to right-wing populist attitudes: individuals who view their region as lower in status express greater demands for thick populist leadership traits, a relation that is especially pronounced in industrial hubs.
Lastly, tying the survey findings back to observational data, we examine how these individual attitudes are reflected in political behavior and electoral outcomes. While both left-wing and right-wing populists respond to economic distress, their distinct appeals shape their ability to mobilize voters. Left-wing populists emphasize redistribution and social welfare, which may suffice to mitigate grievances in regions with diffuse industries. By contrast, right-wing populists are uniquely positioned to capitalize on the localized sense of loss that emerges from industrial decline. Qualifying widely cited findings,Footnote 8 we show that job losses in industrial hubs were strongly associated with increased support for Donald Trump in 2016, while equivalent losses in geographically diffuse industries correlated with greater support for the Democratic Party. This suggests that the widely noted puzzle concerning the relationship between economic hardship and right-wing supportFootnote 9 may in fact be contingent on economic geography. Where job losses occur in diffuse industries, social safety nets and redistributive policies may sufficiently address economic anxiety.Footnote 10 Yet in industrial hubs, economic hardship is experienced not just as a material loss, but as an existential threat to community identity. The decline of these industries fuels economic nostalgia and a longing for restoration—an appeal that has become a cornerstone of right-wing populist rhetoric. As such, the political consequences of economic shocks are not uniform; they depend critically on whether the losses affected industries that are closely tied to a region’s identity.
Taken together, these findings illustrate how the economic upheaval of recent decades created a confluence of global economic forces and geography, with industrial hubs bearing a disproportionate share of hardship. These industries were not only major employers but also central to the social fabric of their communities, where employment and social networks were deeply intertwined. As a result, their decline was felt not just as financial loss but as an existential threat to regional identity, intensifying political grievances. This, in turn, produced an asymmetric political response: economic shocks to industrial hubs disproportionately fuelled support for the political right, while equivalent shocks to diffuse industries did not.
Much of the scholarship on the populist backlash in developed democracies tacitly gestures toward the forces we focus on here. There are frequent mentions of single-industry towns, “multi-generational employment ties” to a given factory, and economic shocks that strike at the core of “community identity.”Footnote 11 Yet getting empirical traction on these sociocultural aspects, using observational data especially, has been a challenge.Footnote 12 As Naoi remarks, observational studies have tended to focus on strictly material factors as primary drivers, while most survey evidence has instead looked to cultural factors.Footnote 13 Increasingly, scholars recognize that a full account of the political upheaval of the last decade needs to weave together these two strands of findings.Footnote 14 In this article, we attempt to do just that, by showing how the geographical clustering of industries proxies for many of the drivers of these widespread perceptions of loss. In so doing, we also present a competing picture to the common narrative about industrial clusters as founts of knowledge sharing, innovation, and productivity growth. As we show, when threatened by structural forces, such hubs can quickly turn into founts of political resentment.
Our findings hold implications for ongoing policy debates. Place-based (as opposed to person-based) relief policies targeting regions in decline, long embraced by European countries, are being considered anew in the United States.Footnote 15 Our findings offer new reasons to view such policies as welfare enhancing, beyond a strictly economic response to the increasing divergence in the growth trajectories of different regions. If shocks to geographically clustered industries lead to a disproportionate sense of loss and regional decline, then this provides a novel political rationale for targeted relief.
The Politics of Industrial Hubs
Our main theoretical claim is that job losses in geographically concentrated industries carry distinct social significance, leading to unique political effects. In communities where a dominant industry is central to regional identity, economic shocks are perceived not merely as financial hardship, but as existential threats to the community’s cohesion and status, intensifying demands for political intervention. Right-wing populist parties are especially adept at channeling these grievances into calls for restoring regional standing. We develop these expectations in what follows.
Geographic Concentration and Economic Pain
A causally prior reason to focus on industrial hubs as catalysts of political discontent is that over the last decades, such geographically concentrated industries may have been particularly exposed to structural forces in the first place. Gordon Hanson, one of the authors behind the original China Shock findings that brought attention to the unequal distribution of adjustment costs from trade competition,Footnote 16 points to anecdotal evidence of how the China Shock disproportionally targeted single-industry towns: “Part of what made the surge in Chinese exports so painful for American workers,” he writes, “was that many of them lived and worked in industry towns.” Hanson points to the case of Martinsville, Virginia, where 20 percent of all workers were employed in just two industries: furniture and knitted outerwear. As he notes, invoking our concept of interest, “This made Martinsville what economists call an ‘industry cluster’.”Footnote 17
Much of the discussion around globalization and job losses has emphasized single-industry towns, yet how well does this common narrative represent the whole picture? We know that US regions that were especially reliant on traditional industries like steel-making and furniture manufacturing have declined, but knowledge industry hubs could more than make up for these losses. Have more geographically concentrated industries truly experienced disproportionate economic pain, on average?
In Figure 1, we illustrate this pattern systematically, by showing the net employment change in industrial hubs versus non-hubs across US commuting zones, from 2000 and 2016, relative to the 2000 base year. Industrial hubs, according to Hanson’s claim, are clusters of industries that are highly concentrated in a region, and distinctive to that region, compared with the rest of the country (see section “Data: Industry Hubs and Labor Market Changes” for detailed operationalization). As the picture makes plain, hubs across the United States (top) experienced considerable losses in employment, whereas non-hubs (bottom) saw employment gains, reflecting a shift from geographically concentrated industries to geographically diffuse industries.

Figure 1. Percentage change in commuting zone employment in industrial hubs and non-hubs between 2000 and 2016
Notes: For each commuting zone and industry group, we first determine whether a given commuting zone-by-industry group cell qualifies as an industrial hub (see section “Data: Industry Hubs and Labor Market Changes” for details). We then calculate the percentage change in employment for the industry classified as hub (top) between 2000 and 2016, relative to their initial employment in 2000, and do the same for the rest of industries not considered hub (bottom). In the top panel, gray areas indicate regions with no industrial hubs under our definition.
The areas in dark red in the top panel represent some of the single-factory Martinsvilles that Hanson refers to, but also the natural-resource-rich areas that are highly concentrated in extractive industries like oil and gas, forestry, and mining. In part, this shift is an artifact of manufacturing industries being more geographically clustered than service industries,Footnote 18 which have seen the bulk of net employment gains. Yet as we also demonstrate, the relationship between industrial hubs and employment loss remains when looking strictly within manufacturing.Footnote 19 In our empirical analysis later, we also show that the picture looks highly similar when we focus specifically on economic pain due to import competition.Footnote 20
The concept of industrial hubs, captured in Figure 1, touches on the two dimensions that this article is concerned with: industry and place. Specifically, our argument pertains to a subset of industries that are geographically concentrated (like furniture making), and the areas (like Martinsville-Henry County) that specialize in these industries. This geographic clustering not only shapes local economies but also reinforces shared community identities, making job losses in these industries particularly disruptive. Layoffs in such industries are not merely economic setbacks; they are perceived as existential threats to the community’s standing and way of life.
Loss and Regional Identity
One common narrative put forth by close observers of the recent populist backlash turns on the widespread sense of loss that has provided fodder for radical political candidates. We begin by describing what this sense of loss consists of, and then we demonstrate why it may be especially keenly felt in regions that are home to geographically concentrated industries.
Focus groups run by the Pew Research Center in 2020 testify to the now familiar effects of the labor churn associated with global economic liberalization: “new job creation supplant[s] traditional work” and “lead[s] to feelings of alienation and loss.” These feelings went far beyond mere job replacement; they concerned a more generalized “loss of social solidarity.” As the Pew report summed up, “Whether left behind or swept up, feelings of loss pervade.”Footnote 21 As Wuthnow observes in a sociological analysis of the “left behind” in rural America, “besides their economic impact, business closings and a lack of jobs are also of cultural significance.”Footnote 22
Insofar as the political economy literature has recognized the importance of this sense of loss, it has done so principally through the lens of race. The object of loss, in that view, is the traditionally dominant group’s social standing, vis-à-vis historically lower status “out-groups.”Footnote 23 We do not dispute the importance of social status as it relates to race, especially in the US. We control for race throughout our analysis, and test for heterogeneous effects across racial groups, to ensure that the results are not reducible to racial identity.Footnote 24
The concept of identity comes up as an important factor in studies of the populist backlash against globalization, but it often remains ill-defined. A classic definition of social identity, and the one we base our account on, refers to “that part of an individual’s self-concept which derives from his knowledge of his membership in a social group together with the value and emotional significance attached to that membership.”Footnote 25 Social psychologists have shown that the degree of identification with a group also determines individuals’ willingness to act on its behalf.Footnote 26 Drawing on these insights, we use identity to refer to the traits that individuals use to define themselves and the group interests they will defend.
An influential body of work in social psychology provides an account of how such social identities are formed. Broadly falling under the label of distinctiveness theory, these studies find that in defining themselves, individuals gravitate toward those traits that apply to them, but are otherwise rare.Footnote 27 This expectation has most often been demonstrated in the case of ethnic and gender identity.Footnote 28 We borrow from this established body of work and apply it to our setting: the expectation becomes that regional identity is more likely to be bound up with an industry if that industry is highly represented in their area, but not prevalent in the rest of the country. According to this idea, one reason that coal workers in West Virginia, or auto workers in Michigan, identify so strongly with their industry is that they view it as distinctive and representative of their region. Coal mining and steel production are not prevalent in most US counties, but they are highly present in West Virginia and Michigan, respectively. Our operationalization of industrial hubs in the empirical analysis explicitly captures this distinctiveness dimension.
When a community is organized around an industry that is distinctive in this sense, work is not merely a means of earning a living but a defining feature of regional identity. To be sure, sociologists have long argued that all economic behavior is “embedded” in social relations;Footnote 29 yet in industrial hubs, this embeddedness is especially tangible. Dense overlapping social and professional networks create a web of relationships that shape the identity not only of those employed in the industry, but all the people living around them.Footnote 30 Our empirical analysis captures this region-wide effect. Geographic concentration means that an industry can come to structure community life. These are counties where the town’s sports teams are named after the local industry,Footnote 31 where the local radio is timed to the industry’s shift changes,Footnote 32 where its workers get discounts at local restaurants,Footnote 33 and where families have multigenerational ties to the industry.Footnote 34 In all these ways, industrial hubs serve as cornerstones of community identity. As a result, economic shocks are perceived not merely as financial hardship but as collective setbacks, signalling a broader decline in the community’s standing.
In part, this is because individual fates in industrial hubs are more likely to be intertwined. Coworkers are more likely to include peers who predate entry into the workforce.Footnote 35 Wuthnow shows how much job losses in the local industries that communities are built around reverberated to every aspect of social life.Footnote 36 Unemployment strained family relationships, frayed community ties, and undermined the shared routines that held the community together. Consistent with these broad social effects, Autor, Dorn, and Hanson document the impact of import competition on declining marriage and fertility rates. Shocks to denser networks have more generalized effects.Footnote 37
These aspects of traditional industries are well known in the sociological literature on work, which relies largely on ethnographic methods. They are far less studied in IPE, and for good reason: it is difficult to operationalize notions of embeddedness, representativeness, and regional networks through aggregate data. We do so by focusing on economic geography: we create a measure that combines the geographic concentration of an industry and the degree to which it is distinctive to a region. We show how this measure is associated with peer networks and regional identity, and how it helps explain when economic shocks have singular political effects.
The Double-Edged Sword of Agglomeration Economies
Our account diverges from the dominant scholarly perspective on industrial agglomeration, which primarily views industrial hubs as sources of economic strength, driven by the benefits of co-location externalities. Political scientists have mostly been interested in the increased lobbying power that results. Economists, for their part, have mostly examined the positive spillovers, in the form of skills and knowledge, that can result in increased innovation and productivity.Footnote 38 Yet the overall picture remains ambiguous.Footnote 39 As Kemeny and Storper put it in a recent survey of this literature, “However defined, … [regional] specialization is very inconsistently associated with productivity, employment and innovation, with studies finding a wealth of positive, negative as well as non-existent relationships.”Footnote 40 While some claim that the returns from geographic specialization exist only for high-tech sectors with high absorptive capacity,Footnote 41 others find that these are precisely the sectors that benefit from diversity.Footnote 42
One way to reconcile these mixed results is to consider how agglomeration may amplify both positive and negative economic shocks. During boom times, the dense networks and spillovers in industrial hubs is likely to accelerate growth and innovation, as the business literature on agglomeration economies suggests.Footnote 43 Yet when such industries decline, agglomeration can become a liability. Industrial hubs have not only borne a disproportionate share of recent economic pain in the United States, as we show in subsection “Geographic Concentration and Economic Pain” earlier; these losses also carry greater social weight. Building on insights from Busch and Reinhardt and the sociological literature on work, we operationalize the relevant aspects of geographically concentrated industries by focusing on two factors: peer networks and regional identity.Footnote 44 Next, we develop testable implications for each.
Industrial Hubs and Peer Networks
One of the distinctive features of economically specialized regions is that employment networks in these areas are intertwined with deeply rooted social networks that predate individuals’ entry into the workforce. Such social ties speak to the degree of an industry’s embeddedness in the local community, and thus the social impact from economic shocks to these industries.
The literature has long recognized that denser networks in geographically concentrated industries facilitate political mobilization by accelerating information flow and enabling collective action.Footnote 45 Building on this insight, we argue that when social and professional networks overlap, they not only heighten awareness of labor market shocks, but also change their perceived impact. Layoff events do not remain isolated experiences; instead, they reverberate through the community, transforming job losses into collective disruptions. In such settings, economic decline is not merely about losing a paycheck—it threatens a shared way of life and the identity of the region itself. The denser these overlapping networks are, the more generalized the disruption.
To preview our operationalization of such networks, we ask respondents about the number of people from their high school who work in their industry. High-school peers capture social networks that predate individuals’ entry into the workforce, yet their economic fortunes do not bear directly on one’s own self-interest, as might be the case with family members. When more high-school peers end up working in a given industry, that industry becomes a defining feature of the local economic and social landscape.
Consider the case of Clyde, Ohio, which houses a large Whirlpool manufacturing plant. Clyde is part of an important manufacturing hub, and comes close to being the proverbial single-industry town. As a local news article put it, “Whirlpool has been a way of life in Clyde for five generations of families. The plant has spawned countless marriages, children, and friendships.” And as Clyde’s mayor explained in the same article, “I met my wife there … Just about everybody who has ever worked there had a dad, a sister, a brother, or a cousin who worked there. When you have that kind of connection, that tends to make it more personal.”Footnote 46 Firms often call attention to these ties. As Whirlpool itself notes in reference to the Clyde plant, “some of these Whirlpool families go back multiple generations.”Footnote 47
Dense ties linking the industry and the greater community blur the boundary between social and economic spheres, such that what might remain an industry-specific event in a geographically diffuse industry instead spills over into the broader community. Because employment networks in these hubs overlap with long-standing personal relationships, economic disruptions reverberate across social institutions—from churches and community centers to civic organizations—transforming job losses from individual setbacks into existential threats to the community.
As a result, regions where employment and peer networks are deeply intertwined will experience economic shocks not only as financial hardship but as a fundamental challenge to the community’s stability, fuelling collective anxiety and political mobilization. These effects should extend beyond those directly employed in the industry, shaping the perceptions and political attitudes of the entire region. While shocks to geographically diffuse industries may be successfully mitigated through redistributive policies, job losses in geographically concentrated industries should generate demands not merely for economic relief, but for prevention and restoration—a return to the community’s original character.
We operationalize the theorized connection between economic loss, peer networks, and political demands through the following twin hypothesis:
H1a Individuals who report more high-school peers in their industry should be more likely to demand that politicians prevent job losses, all else equal.
H1b Economic shocks to geographically concentrated industries should generate stronger demands for politicians to prevent job losses, compared to shocks affecting geographically diffuse industries.
In sum, we expect that when employment networks overlap with peer networks, individuals will demand that politicians intervene to address economic shocks. When job losses are perceived not only as as financial setbacks but as existential threats to a community, the response is not merely a call for economic relief, but for prevention and restoration.
Industrial Hubs and Regional Status
Insistence on regional pride and identity is a common trope in the sociological scholarship on traditional industries.Footnote 48 Yet regional identity can also coalesce around less obviously evocative, but geographically concentrated and regionally distinctive industries—like the manufacturing of washing machines. Consider again the case of Clyde, Ohio. In a feature about Clyde called “Places That Matter,” the Whirlpool corporation asserts, “it’s the plant as much as the town that binds this community together.”Footnote 49 In Clyde, Whirlpool sponsors the local sports team. Local businesses offer discounts to all Whirlpool employees.Footnote 50 In sum, as an NBC news story put it, “In Clyde, Ohio, a Whirlpool washing machine plant defines the community.”Footnote 51 The broader claim is that when an industry is distinctive to a region, meaning it is over-represented in that area compared to other areas, residents identify with it to a greater degree. The industry’s fortunes become part and parcel of their own self-concept.
Job losses in geographically concentrated industries thus represent the erosion of regional identity. The implication is that even when a region recovers economically, its inhabitants may nonetheless feel an abiding sense of loss. This can be felt not only by those employed in the industry, but also by the broader community, whose shared identity is rooted in that industry. A recent report on the town of Janesville, Wisconsin, where a large GM plant shut down in late 2008, finds that the unemployment rate is now at 3.7 percent, lower than the US average. Yet the surrender of the area’s industrial specialization is nonetheless mourned as a significant loss by the community. “Its identity as an automaking town ripped away,” the author writes, “the local economy has become more diverse.”Footnote 52 There is little question as to how such diversification is perceived.
In contrast to a growing number of studies that highlight how job loss can lead to status loss for individuals,Footnote 53 we are thus interested in the status associated with a region. Recognizing that sociotropic preferences may dominate egotropic evaluations in voting decisions,Footnote 54 we emphasize regional standing as an important variable in its own right, distinct from voters’ sense of their own status as individuals. Accordingly, in our analysis, we control for individual standing, to demonstrate that the two are distinct, and that the observed effects are not reducible to perceived changes in individual standing. This reasoning leads to the following twin hypothesis:
H2a Economic shocks should be associated with a decrease in subjective regional standing, all else equal.
H2b When such shocks hit geographically concentrated industries, they should affect regional standing more negatively than when they hit geographically diffuse industries.
Beyond personal standing, job losses in a geographically concentrated industry represent the erosion of a region’s distinctive identity and its perceived relative standing.
Industrial Hubs and Political Behavior
We assess our expectations over individual-level attitudes using survey evidence. Yet we also expect that the peer networks and regional identity that form around industry hubs should have political effects that are observable at both individual and aggregate levels. Indeed, the sense of loss that we claim is amplified by the geographic concentration of industries has been weaponized by the campaign rhetoric of political entrepreneurs.
These have mostly originated from one side of the political spectrum. Right-wing populists are especially well-placed to respond to economic dislocation by capitalizing on “nostalgic deprivation” and promising to prevent the loss of traditional industries and restore traditional ways of life.Footnote 55 By contrast, the political left has responded to economic distress primarily through policies that expand the social safety net, emphasizing redistribution and support for labor transition. This is consistent with a traditional focus on universalistic themes and broad-based solidarity, and an attempt to build cross-cutting coalitions around shared economic interests and progressive values. Left-wing candidates thus tend to invoke notions of economic justice, labor rights, and forward-looking policies aimed at adaptation and inclusion. Conversely, the right tends to draw on counter-Enlightenment intellectual traditions that emphasize the importance of organic, locally rooted communities and identities.Footnote 56 The right’s messaging, which stresses tradition, community, and custom, is thus better calibrated to speak to localized identities and grievances. Accordingly, the remedies it promises speak not just to material recovery but to the reassertion of regional identity, making it especially effective in mobilizing communities that yearn for a return to a lost way of life, and to good effect: the politics of “economic nostalgia”Footnote 57 have proven a highly successful political strategy. Gillespie and Gest, Reny, and Mayer thus find that “nostalgia” was a significant predictor of voters’ support for right-wing populist candidates in both the United States and the United Kingdom.Footnote 58
These empirical findings align with claims from social psychology, which has long maintained that threats to group identities are an especially powerful driver of collective action. As Snow and McAdam put it in a study of social movements, “the threatened loss of the identity and the solidary incentives on which the identity is based is usually sufficient to produce high rates of participation among group members.”Footnote 59 We hold analogous expectations over the group identity that forms around industrial hubs. The more individuals identify with a group—be it an ethnic or gender group, or in our case, an industry—the more the fortunes of that group will factor into their political behavior.
Further clues about how such labor market threats translate into political behavior can be gleaned from exactly how right-wing political entrepreneurs have sought to capitalize on them. A shared sense of loss featured heavily in the political rhetoric of Donald Trump from the start of his election campaign, which regularly played on the strong sense of identity that geographically clustered industries can arouse. The town of Clyde, Ohio, home to a geographically concentrated industry beleaguered by trade competition, was thus a typical location for one of Trump’s campaign stops. When Trump visited Clyde’s Whirlpool plant during his 2020 campaign, he called one of the plant’s workers to take the stage. As she proclaimed, “Manufacturing is the heartbeat of this area. Whirlpool has an enormous impact on the state of Ohio … I work with 3,500 proud individuals. Together, we build American-made, quality products here in Clyde. We bleed Whirlpool blue.”Footnote 60 This type of sentiment, more typically associated with nationalism, and applied here to an industry, arises because that industry is the area’s defining feature. The manufacture of home appliances is a geographically concentrated industry, and Sandusky county, where Clyde is located, is highly specialized in that industry, compared to the rest of the country.
In his own speech in Clyde, Trump made explicit mention of alleged Korean dumping of washing machines, and the threat that offshoring to China posed for the United States.Footnote 61 Political entrepreneurs on the right have intuitively seized on the heightened awareness, and greater mobilization potential, of areas that are home to industry hubs. In the United States, they often invoked a bygone era when the country employed more people in manufacturing, emphasizing not only the economic loss that comes from deindustrialization, but its attendant social and cultural effects. The premise behind this messaging is that the decline of geographically concentrated industries around which entire communities formed represents more than just a labor market shock; it amounts to an existential threat to regional identity. The left’s universalistic appeals, by comparison, have a harder time gaining traction in response to place-based grievances. This explains why that prevalent sense of loss is a recurrent theme of right-wing populist candidates on both sides of the Atlantic.Footnote 62
Existing work has linked exposure to import competition with electoral outcomes,Footnote 63 though the causal mechanism often remains difficult to pin down. Economic shocks appear to result in greater support for right-wing candidates at the polls. Our claim is that these effects are especially likely in industrial hubs, where right-wing candidates are able to capitalize on greater perceived losses to regional identity. This reasoning leads to the following hypothesis about voting behavior:
H3 Economic shocks to geographically concentrated industries should be associated with greater support for right-wing candidates, compared to equivalent shocks to geographically diffuse industries.
In sum, job losses that affect industrial hubs are different. They are less likely to be dismissed merely as structural economic events. Even when they do not affect individuals directly, through dense peer networks, equivalent job losses are viewed as threats to regional identity. This translates into greater demand for prevention of job losses, and restoration of the status quo ante. Right-wing populist candidates are especially well positioned to respond to such demands.
Our account focuses on political effects. Yet this is not to deny that shocks to geographically concentrated industries may also have distinct economic effects. Even keeping the total number of job losses constant, as we do throughout our analysis, it may be that, for example, the greater skill specificity associated with industrial hubs makes it harder for individuals to relocate. Yet unwillingness to relocate is itself also connected to regional identity, which speaks to how intertwined these factors are. Rather than rule out economic effects, then, our objective is to show that the observed effect is not reducible to strictly economic considerations, and that non-material factors such as regional identity and peer networks play a crucial role. Next, we turn to the data to test the various parts of this account of loss in industrial hubs.
Data: Industry Hubs and Labor Market Changes
To test our theory, our empirical analysis relies on the concept of industrial hubs. These are clusters of industries that are highly concentrated in a region, and distinctive for that region. Industrial hubs are our proxy for how deeply rooted an industry is in a given place, and the extent to which that place is likely to define itself in terms of this industry. We thus begin by examining each region to see whether it qualifies as a hub for any industry group. Throughout the analysis, we use commuting zones (CZs) as our geographic unit. CZs are groups of US counties characterized by strong within-cluster and weak between-cluster labor market commuting ties.Footnote 64 CZs have become the most commonly used unit in the study of economic shocks in the United States.Footnote 65 Then we measure the magnitude of economic pain that each CZ, and any hubs within them, have experienced. This allows us to examine whether political responses to shocks in industrial hubs differ from responses to shocks of the same magnitude in non-hubs.
To identify industrial hubs, we rely on the method developed by Delgado, Porter, and Stern in the US Cluster Mapping Project, a collaboration between Harvard Business School and the US Department of Commerce.Footnote 66 This approach groups related industries based on co-location patterns, input-output linkages, and labor market similarities, classifying 967 industries at the six-digit NAICS level (excluding farming and public administration) into 67 groups of industries.Footnote 67 For example, auto vehicle and parts manufacturing, along with metal foundries, are all mapped into the automotive cluster. This approach aligns well with our theory: co-located industries, dependent on each other’s economic fortunes, shape regional identities.
In a second step, we determine whether a region is home to an industrial hub of any of the sixty-seven industry groups. To do so, we consider two dimensions: (1) the concentration of an industry within a region, relative to other regions; and (2) that industry’s distinctiveness for the region, relative to other industries in the same region. From the standpoint of the industry, we care about how concentrated it is within a region compared to others. From the standpoint of the region, we care about how distinctive a given industry is to a region, relative to its specialization in other industries. In this sense, the operationalization challenge we face is analogous to capturing “keyness” in text analysis, which we draw inspiration from.Footnote 68 We capture this pattern using the location quotient (LQ), “the most frequently used index’’ of regional industry specialization in the economic geography literature,Footnote 69 consistently with its use in the Cluster Mapping Project. The LQ, calculated as the ratio of an industry’s share of local employment to its share of national employment, allows us to identify industries that are more prominent in a region compared to the national landscape, that is, “the most distinctive industry’’ in an area.Footnote 70 Classic examples include the auto sector in Michigan, the furniture sector in North Carolina, and financial services in New York. The town of Clyde, Ohio, where Whirlpool operates five plants—more than half of its manufacturing facilities nationwide—is itself part of an industrial hub of appliances production, which is disproportionately featured in Ohio, second only to neighboring Indiana.Footnote 71 We calculate the location quotient (LQ) using the US Census’s 2000 County Business Patterns (CBP) data.Footnote 72
Using the LQ score (as of 2000, the beginning of our period of analysis), we classify a region as a hub for a given industry group if the region’s LQ is above the 90th percentile across all regions (indicating regional specialization),Footnote 73 and if that industry has the highest LQ among all industry groups in that region (indicating its distinctiveness to the region’s economic identity).Footnote 74 The second condition is crucial for identifying the industry that best represents a region’s economic identity. While a region may have multiple industries with LQ values above the 90th percentile, we select the one with the highest LQ as a means of capturing the region’s most distinctive industry. For instance, commuting zones in Michigan have high LQ scores in the automobile sector, placing them in the 90th percentile or above (as illustrated in the left panel of Figure 2). However, not all commuting zones in this region have the automobile industry as their most distinctive sector. The commuting zone that includes Muskegon County, for example, has an LQ of 5.6 for automobiles, placing it in the 90th percentile among 722 CZs. However, another industry appears more distinctive to the region: footwear, with an LQ of 29.2, which represents the highest LQ across all industries in the region, and at the same time, places the region above the 90th percentile across all regions in the sector. Similarly, for textiles, as shown in the right panel of Figure 2, regions in the southeast tend to have high LQ scores. However, only those outlined in yellow have textiles as their most distinctive industry and are classified as hubs for the textile industry. Using this classification rule, 93 percent of CZs are classified as hubs for some industry group. For the number of CZs classified as hubs for each industry group, see Table A2 in the appendix.Footnote 75

Figure 2. Location quotient (LQ) across commuting zones in 2000
Notes: The figures illustrate the geographical distribution of LQ scores for two selected industry groups—automotive and textile manufacturing. Darker (lighter) colors indicate higher (lower) LQ scores for each commuting zone in the respective industry. Commuting zones where the LQ score falls above the 90th percentile for a given industry and where that industry has the highest LQ among all industry groups are outlined in yellow. These yellow-highlighted areas represent hubs for each industry, defined as regions where the LQ exceeds the 90th percentile across all regions in that industry (indicating regional specialization) and where the industry has the highest LQ among all industry groups in the region (signifying its distinctiveness to the region’s economic identity)
Third, we measure the extent of economic hardship to industrial hubs and non-hubs within each CZ. To capture economic hardship, we use Trade Adjustment Assistance petition data from the US Department of Labor, for the period from 2000 to 2015. TAA petitions are a highly granular measure of local demand for economic relief in response to trade competition. Each TAA petition provides information on affected industries, the number of displaced workers, and the locations of impacted plants, allowing us to identify economic hardship at both the regional and industry levels. TAA petitions thus represent a singular data source about economic shocks, since they directly measure economic shocks at a substate geographic level with detailed industry classification.Footnote 76 Given this granularity on both dimensions of interest, TAA petitions are especially well suited to operationalizing our main right-hand-side variable.Footnote 77
To measure the degree of economic hardship in industrial hubs, we construct a CZ-level measure of taa demand in hubs, representing the number of workers included in TAA petitions that affected industrial hubs in a given CZ.Footnote
78
Specifically, for each commuting zone $c$
, we sum the cumulative number of workers included in TAA petitions (
$c$
, we sum the cumulative number of workers included in TAA petitions ( $TA{A_{ic}}$
) from 2000 to 2015 for industry
$TA{A_{ic}}$
) from 2000 to 2015 for industry $i$
classified as a hub in
$i$
classified as a hub in $c$
. With
$c$
. With ${H_{ic}}$
a binary indicator identifying industrial hubs, coded as 1 if industry
${H_{ic}}$
a binary indicator identifying industrial hubs, coded as 1 if industry $i$
qualifies as a hub in commuting zone
$i$
qualifies as a hub in commuting zone $c$
, and 0 otherwise, our measure of economic shock is computed as follows:
$c$
, and 0 otherwise, our measure of economic shock is computed as follows:
To account for differences in the size of the regional labor market, we normalize the variable by the total number of workers in the commuting zone as of 1999, $Employmen{t_{c,1999}}$
. This ensures that the measure captures the relative degree of economic shock experienced by each commuting zone, adjusted for the initial scale of employment in the broader regional labor market. We use employment as of 1999, prior to the TAA-related shocks measured from 2000 onward, to ensure that these TAA-related losses do not influence the employment denominator. We construct a measure of TAA Demand in Non-Hubs in analogous fashion for TAA-petitioning workers in industries that are not part of hubs:
$Employmen{t_{c,1999}}$
. This ensures that the measure captures the relative degree of economic shock experienced by each commuting zone, adjusted for the initial scale of employment in the broader regional labor market. We use employment as of 1999, prior to the TAA-related shocks measured from 2000 onward, to ensure that these TAA-related losses do not influence the employment denominator. We construct a measure of TAA Demand in Non-Hubs in analogous fashion for TAA-petitioning workers in industries that are not part of hubs:
Figure 3 illustrates the geographical variation of taa demand in hubs. According to this measure, 33.8 percent of commuting zones experienced some TAA-related shocks to their industrial hubs. The remaining commuting zones are either classified as containing no industrial hubs (6.9 percent) or as having industrial hubs that saw no TAA demand (59.3 percent).Footnote 79 The values vary widely, with more than 83 percent of commuting zones experiencing fewer than five TAA-petitioning workers per 1,000 workers during the examined period, while the highest recorded value is 171 TAA-petitioning workers per 1,000 workers. In Figure 3, the areas featuring industrial hubs affected by shocks include regions in Virginia surrounding Martinsville, where the furniture sector—the region’s most distinctive industry—was hit particularly hard during our period of interest. Commuting zones in Michigan, home to the auto sector industrial hub, also experienced substantial shocks. This pattern is consistent with Hanson’s observation that the labor dislocation in the United States over the last decades has disproportionately affected geographically concentrated industries.Footnote 80 We also find a strong correlation between this measure and the China trade shock, one of the most widely studied indicators of trade-related shocks (presented in Table A10 in the supplementary appendix). How might losses in such industrial hubs be especially politically meaningful? That is the question we tackle next.

Figure 3. TAA-related shocks to industrial hubs across commuting zones
Notes:The figure illustrates the geographical distribution of TAA-related shocks to industrial hubs across commuting zones. The measure is calculated as the cumulative number of TAA-affected workers in hub industries within each commuting zone from 2000 to 2016, relative to the region’s employment size in 1999 (per 1,000 workers). The break values in the legend—1.3, 4.9, 13.2, and 170.5—correspond to the 20th, 40th, 60th, 80th, and 100th percentiles among nonzero values
Empirical Analysis
To explore individual attitudes regarding the changing fortunes of regional hub industries and their political ramifications, we combine the aforementioned data on industrial hubs with original survey data and presidential election data. Throughout, we are primarily interested in how economic shocks to these industrial hubs are associated with magnified political effects. We first analyze how shocks to industrial hubs are associated with the views about politicians’ responsibility in preventing layoffs (H1). Next, we examine how shocks to hubs relate to perceptions of regional standing, compared to shocks of the same magnitude affecting non-hubs (H2). Finally, we examine electoral data to determine how these individual perceptions translate into voting patterns (H3).
Industrial Hubs, Peer Networks, and Political Beliefs
We are ultimately interested in when economic shocks translate into political upheaval. As the economic voting literature has long established, there is much variation in the extent to which voters ascribe political responsibility for economic downturns.Footnote 81 According to our argument, the more individuals view their industry through the lens of regional identity, history, and community, rather than in merely economic terms, the more likely they are to expect politicians to address economic shocks. We test this by looking at how the overlap of employment and social networks, as well as economic shocks to industrial hubs, are associated with different beliefs about political responsibility for economic outcomes (H1a, H1b).
This first analysis is based on a survey fielded on a national quota-valid sample of over 1,600 American workers, recruited in August 2021 by the market data firm Dynata to meet population quotas by age, gender, census region, and education (see Table A3 in the appendix for summary statistics of demographic characteristics and key responses of surveyed workers). In this analysis, we examine how economic shocks to industrial hubs are associated with the views of residents, regardless of whether they experienced the shock firsthand as workers. According to the theory, industrial hubs, and the dense social networks they represent, magnify perceptions of economic shocks as threats to regional identity. If so, we should expect these shocks to affect the views of all individuals living in areas that are home to industrial hubs.
As a preliminary test, we briefly examine expectations about the prevalence of peer networks in industrial hubs. To do so, we use respondents’ own indication of whether any of their high-school peers work in their industry. This is meant to capture peer networks that predate respondents’ entry into workforce. The benefit of focusing on high-school peers is that, as opposed to family links, individuals are less likely to have a personal material stake in the financial well-being of their high-school peers, which makes for a cleaner proxy of the social aspect of industrial hubs we are interested in.
We examine the association between industrial hubs and the intensity of peer networks in two ways. First, we use the LQ of an individual’s industry group within their commuting zone to proxy for their workplace’s “hubness.” As shown in Table A11 in the appendix, we find a highly statistically significant association between LQ score and the number of high-school friends that respondents report working in the same industry. That is, consistently with the theory, “hubness” as measured by the LQ is associated with greater peer network density. Second, we consider whether the respondent lives in a region that serves as an industrial hub. Here too, we find that those residing in a hub region tend to have more high-school friends working in the same industry (also in Table A11). Together, these findings align with our theoretical premise that industrial hubs are characterized by deeply embedded networks that predate workers’ entry into the labor force. How do these networks shape individuals’ perceptions of political accountability for preventing layoffs?
According to H1, we expect that individuals living in regions that have experienced greater economic shocks to industrial hubs are more likely to hold politicians accountable for preventing such shocks. To capture these attitudes, we asked respondents the following question:
-
To what extent do you think politicians should be held responsible for preventing layoffs in your industry?
Using responses measured on a scale from 1 to 10 as the outcome variable, we estimate how trade shocks to industrial hubs are associated with perceptions of political responsibility:

where
taa demand in industrial hubs
measures the magnitude of trade shock to industrial hubs in the commuting zone c where individual i resides, and
taa demand in non-hubs
measures the shock to non-hubs in the same commuting zone c
Footnote
82
Throughout the analysis, we also include a vector of controls, denoted by ${X_i}$
, which includes age, sex, race, education level, and partisanship—all of which may affect individual perceptions of political accountability for economic outcomes. We also control for union membership. Our data suggest that individuals who report high-school peers working in the same industry are somewhat more likely to be unionized,Footnote
83
which may reflect factors facilitating regional industrial organization. Since unionized workers may view the role of politics in economic outcomes differently from non-unionized workers, we control for this factor throughout. Additionally, we include dummies for census divisions to account for region-specific socioeconomic or cultural factors that could influence the pattern of peer networks and views on the role of politics. In some estimations, we also include binary indicators for sixty-seven industry groups based on each respondent’s industry of employment. In addition to the baseline model, we also show estimations where we include the peer networks variable, measured as the logged number of high-school friends working in the same industry. This allows us to assess to what extent the observed relationship between trade shocks to a region’s industrial hubs and views on political responsibility is moderated by overlapping industrial and peer networks. To ensure consistency across models, our analysis is restricted to respondents who completed high school (about 1,430 respondents), as this is the subset for which the high-school friends variable is available.
${X_i}$
, which includes age, sex, race, education level, and partisanship—all of which may affect individual perceptions of political accountability for economic outcomes. We also control for union membership. Our data suggest that individuals who report high-school peers working in the same industry are somewhat more likely to be unionized,Footnote
83
which may reflect factors facilitating regional industrial organization. Since unionized workers may view the role of politics in economic outcomes differently from non-unionized workers, we control for this factor throughout. Additionally, we include dummies for census divisions to account for region-specific socioeconomic or cultural factors that could influence the pattern of peer networks and views on the role of politics. In some estimations, we also include binary indicators for sixty-seven industry groups based on each respondent’s industry of employment. In addition to the baseline model, we also show estimations where we include the peer networks variable, measured as the logged number of high-school friends working in the same industry. This allows us to assess to what extent the observed relationship between trade shocks to a region’s industrial hubs and views on political responsibility is moderated by overlapping industrial and peer networks. To ensure consistency across models, our analysis is restricted to respondents who completed high school (about 1,430 respondents), as this is the subset for which the high-school friends variable is available.
Table 1 presents the results. In models 1 and 2, we begin by estimating the base model, including taa demand in hubs and taa demand in non-hubs . While individuals in regions that experienced more severe trade shocks are more likely to view politicians as responsible for layoffs, this effect is statistically significant for only hub industries. Substantively, for shocks to hub industries, a ten-worker increase in the number of TAA-petitioning workers per 1,000 workers is associated with a 0.12–0.13 point increase in the belief that politicians are responsible for layoffs, measured on a 0-to-10 scale. This effect is significantly smaller for shocks to non-hubs; the same number of TAA-petitioning workers in non-hubs corresponds to only a 0.02-point increase in this view. These results are particularly notable, as they suggest that trade shocks of the same magnitude can have differential effects on individual beliefs about which economic events matter politically. These effects extend beyond workers of a given hub, to the entire area that is home to that hub.
Table 1. Trade shocks to industrial hubs, peer networks, and political responsibility

Notes: Standard errors clustered by commuting zones in parentheses. Dependent variable is the belief that politicians should be held responsible for economic outcomes. All models control for demographic variables (age, sex, race, education, union membership, and perceived income) as well as partisanship (binary indicators for Republicans and Democrats). Full estimation results are presented in Table A12 in the appendix. Estimation results excluding the control variables of union membership, perceived income, and partisanship are presented in Table A16 in the appendix. + $p \lt .10$
; *
$p \lt .10$
; * $p \lt .05$
; **
$p \lt .05$
; ** $p \lt .01$
.
$p \lt .01$
.
What role does the overlap between peer and industry networks play here? In models (3) and (4), we estimate the effects of peer network intensity by including an indicator for the logged number of high-school peers working in the same industry. We then include these variables in the baseline estimation in models 5 and 6, estimating the effects of taa demand in hubs and taa demand in non-hubs while controlling for peer network intensity. Models 3 and 4 indicate that respondents with high-school peers in the industry are more likely to believe that preventing private-sector layoffs in the local economy is a responsibility of political leaders. Notably, the effect of taa demand in hubs decreases when controlling for high-school peers in the industry. This provides suggestive evidence that the impact of trade shocks to industrial hubs is, at least in part, moderated by overlapping peer and industry networks.
Among the variables included in the models, peer networks and union membership stand out as particularly significant in influencing perceptions of politicians’ responsibility for adverse economic outcomes. Substantively, one standard deviation increase in the logged number of high-school peers is associated with an increase of 0.55 points on the political responsibility variable, equivalent to an 8.9 percent increase from the average score for political responsibility. By comparison, union membership increases the score by 0.48 points, a 7.8 percent increase from the mean. Importantly, the effects of high-school peers are not reducible to, but complementary with the effects of union membership. The fact that the magnitude of peer networks effects is comparable to the well-studied impact of union membershipFootnote 84 highlights the significant role that peer networks seem to play in shaping perceptions of political responsibility.
Bringing these findings together with those of Table A11, a coherent story emerges: individuals living in areas with more concentrated industries have overlapping employment and social networks, and these networks, in turn, lead workers to blame the government for downturns to a higher degree. The denser social networks that are believed to lead to greater political mobilization among workers therefore also generate greater political demands in the face of economic hardship.
Trade Shocks, Industrial Hubs, and Regional Status
Next, we examine how economic hardship is associated with perceptions of decline in regional status, and whether this association looks different for hubs versus non-hubs. Given the emphasis on status loss in the political backlash literature, we ran a second study on some 3,000 American workers, administered online on a national quota-valid sample recruited by the survey firm Bilendi, in June 2023 (see Table A4 in the appendix for summary statistics of survey respondents).Footnote 85 Our goal was to measure individuals’ subjective sense of the standing of their region, relative to other regions in the United States. To do so, we adapted the MacArthur Scale of Subjective Social Status, developed by Adler and colleagues.Footnote 86 Since our focus is on regional economies, we applied this now-standard question about individual subjective status to regions. Respondents were presented with a picture of a ladder with ten rungs and the following caption: “Think of this ladder as showing the status of all people in the United States. At the top of the ladder are the people who have the highest standing. At the bottom are the people who have the lowest standing.” We then asked the following three questions:
-
Where would you place yourself on this ladder?
-
Now think of an average person living in your area. Where on the ladder would you place that person, compared to the rest of the country?
-
Now think of that same person living in your area 30 years ago. Where on the ladder would you have placed them 30 years ago, compared to the rest of the country?
Responses to these questions allow us to examine whether the geographical concentration of industries exacerbates feelings of regional status loss when an area experiences economic shock. Specifically, we examine how trade shocks to an area are associated with individuals’ perceptions of regional status. As hypothesized in H2, we expect that an equivalent economic shock would be associated with greater perceived loss in regional standing when it affects industrial hubs, compared to non-hubs. With respondent i as the unit of analysis, and the trade shock to i’s commuting zone c as the independent variable of interest, we estimate the following linear regression model:
where the dependent variable $Regional\;Statu{s_i}$
is respondent
$Regional\;Statu{s_i}$
is respondent $i$
’s perception of the social standing of their area, compared to the rest of the country. This measure ranges from 1 (the lowest standing on the ladder) to 10 (the highest standing). taa demand in hubs measures the magnitude of trade-related shock to industrial hubs (if any) in respondent
$i$
’s perception of the social standing of their area, compared to the rest of the country. This measure ranges from 1 (the lowest standing on the ladder) to 10 (the highest standing). taa demand in hubs measures the magnitude of trade-related shock to industrial hubs (if any) in respondent $i$
’s commuting zone
$i$
’s commuting zone $c$
, as defined in section “Data: Industry Hubs and Labor Market Changes.”Footnote
87
taa demand in non-hubs is similarly calculated for all other industries in the corresponding commuting zone. We include
$c$
, as defined in section “Data: Industry Hubs and Labor Market Changes.”Footnote
87
taa demand in non-hubs is similarly calculated for all other industries in the corresponding commuting zone. We include ${X_i}$
to control for the effect of partisanship and a set of demographic factors: respondents’ age, sex, race, education, their reported income, as well as the Census geographic division to which commuting zone
${X_i}$
to control for the effect of partisanship and a set of demographic factors: respondents’ age, sex, race, education, their reported income, as well as the Census geographic division to which commuting zone $c$
belongs. We also control for respondent
$c$
belongs. We also control for respondent $i$
’s perception of their own individual subjective status, to ensure that individuals’ perceptions of their region’s standing are not reducible to feelings about their own social standing. In some models, we also control for respondent
$i$
’s perception of their own individual subjective status, to ensure that individuals’ perceptions of their region’s standing are not reducible to feelings about their own social standing. In some models, we also control for respondent $i$
’s perception of regional status of the past. Standard errors are clustered by commuting zone.
$i$
’s perception of regional status of the past. Standard errors are clustered by commuting zone.
Table 2 presents the results. We begin by estimating the effects of taa demand in hubs in columns 1 and 2 and those of taa demand in non-hubs in columns 3 and 4. We then include both variables together in columns 5 and 6. Across all estimations, both taa demand in hubs and taa demand in non-hubs are negatively associated with respondents’ perception of regional standing. Yet the magnitude of the effect is larger for taa demand in industrial hubs than for taa demand in non-hubs, suggesting a stronger association between trade shocks to industrial hubs and perceptions of regional standing than the shocks to non-hubs.Footnote 88
Table 2. Trade shock to industrial hubs and individual perception of regional status

Notes: Standard errors clustered by commuting zones in parentheses. Dependent variable is perceived regional standing. All models control for demographic variables (age, sex, race, education, and perceived income) as well as partisanship (binary indicators for Republicans and Democrats). Full estimation results are presented in Table A17 in the appendix. Estimation results excluding the control variables of perceived income and partisanship are presented in Table A21 in the appendix. + $p \lt .10$
; *
$p \lt .10$
; * $p \lt .05$
; **
$p \lt .05$
; ** $p \lt .01$
.
$p \lt .01$
.
Substantively, based on the estimated coefficients from model 6, and given that the measure is scaled to represent one TAA-petitioning worker per 1,000 workers in a commuting zone, an increase of ten additional TAA-petitioning workers in the hub industry per 1,000 workers is associated with a 0.1 decrease on a 0 to 10 scale of regional standing. This corresponds to a 1.7 percent decrease from the mean regional standing of 5.74. By contrast, the same degree of shock to non-hub industries is associated with a 0.04 decrease on the 0 to 10 regional standing scale, representing a 0.04 percent decrease from the mean regional standing. In Figure 4, we present coefficient plots to compare the estimated coefficients of taa demand in industrial hubs and taa demand in non-hubs across different model specifications. While our main specification in Table 2 defines a hub using the 90th percentile of the LQ score across regions, the results remain with a threshold of 80th, 85th, and 95th percentile.

Figure 4. Coefficient plots: trade shocks and perception of regional status
Notes: The plot presents the estimated coefficient from model 5 (base model) and model 6 (base model + additional control) from Table 2 and their variations. While we use the threshold of 90th percentile for determining a hub for a region, we vary this threshold from 95th to 80th percentile and estimate the same models
Respondents’ own subjective status is, as might be expected, correlated with perceptions of their area’s standing. But strikingly, the effects remain when individuals’ own subjective status is controlled for: the way in which the declining fortunes of regionally clustered industries affects the negative perception of trade shocks is thus not reducible to individuals’ own subjective standing. The results are in line with a series of recent studies that show how individuals look beyond the fortunes of their own household when making the evaluations that feed into their political choices.Footnote 89 A large part of the observed effect appears to be sociotropic in nature; according to more recent findings, the relevant reference area appears to be regional rather than national, in what has been variously called local sociotropism, communotropism, or mesotropism.Footnote 90
To tie the survey results here with the electoral outcomes examined in the next section, we turn to data from a separate survey of 3,300 US respondents, where we homed in more precisely on the connection between individual feelings about regional status and political attitudes.Footnote 91 Specifically, we examined how views of regional versus individual status, measured as before, relate to preferences for different types of leaders.Footnote 92 Our measure of thick populism, developed in Baccini, Ciobanu, and PelcFootnote 93 and building on Neuner and Wratil’sFootnote 94 discussion of populism, captures demand for a political leader who: (1) “does not feel constrained by the rules to serve people’s needs;” (2) “understands that using force is sometimes required to bring about positive change;” and (3) “does whatever it takes to help their local constituents, even if it upsets other people in the country.” According to Baccini, Ciobanu, and Pelc, these traits reflect a thick ideology with explicitly right-wing authoritarian elements, distinguishing them from leadership traits also present on the populist left.Footnote 95
Table 3 presents the results. Consistent with the theory, individuals who feel their region is of low standing compared to the rest of the country are significantly more drawn to thick populist leadership traits. Meanwhile, perceptions of personal status show no significant relation in this respect, further underscoring how a collective sense of loss can be entirely distinct from egotropic effects, and how it is the former rather than the latter that appears to drive political attitudes.
Table 3. Perceptions of regional standing and populist attitudes

Notes: Standard errors clustered by commuting zones reported in parentheses. Dependent variable is populist attitudes measured on 1–10 scale. All models control for demographic variables (age, sex, race, education, and income). Full estimation results are presented in Table A23 in the appendix. + $p \lt .10$
; *
$p \lt .10$
; * $p \lt .05$
; **
$p \lt .05$
; ** $p \lt .01$
.
$p \lt .01$
.
Do these associations differ in magnitude across areas where local hub industries were more exposed to trade shocks? To assess this, we re-estimate the models on respondents living in commuting zones whose industrial hubs were highly exposed to trade-related shocks (models 4–5) and those less exposed (models 6–7), using the same approach as before. The results show a stronger and more significant association in the high-shock areas, suggesting that perceptions of regional decline are indeed more likely to translate into populist attitudes when the loss of regional standing is shared across a region.
Trade Shock, Industrial Hubs, and Electoral Behavior
How do individual-level effects identified in a survey setting manifest at the polls? Insofar as individuals hold politicians accountable for addressing economic shocks, does this belief translate into voting behavior? As we argue earlier, right-wing political entrepreneurs are especially well-placed to capitalize on the sense of loss that arises from shocks to industrial hubs. We test whether trade shocks to industrial hubs are associated with changes in a key electoral outcome (H3), by examining how such shocks relate to support for Donald Trump in 2016 versus George W. Bush in 2000. In doing so, we replicate the highly cited results from Autor and colleagues.Footnote 96 Using the same elections data and control variables as Autor and colleagues, we estimate the following model:
where the dependent variable ${\rm{\Delta }}RepublicanPart{y_{i,16 - 00}}$
is the county-level change in Republican two-party vote share in presidential elections between 2000 and 2016. Our main variable of interest, taa demand in industrial hubs
c
, measures the magnitude of trade shock to industrial hubs in the commuting zone c where county i is located. taa demand in non-hubs
c
, denotes the trade shock to non-hubs in the same commuting zone c, and serves as a comparative benchmark. Hewing closely to Autor and coauthors’ analysis, we include a battery of control variables: CZ-level employment in manufacturing, the routine share and offshorability index of occupational profile, county-level demographic controls measured in 2000 (population shares for nine age and four racial groups, female, college-educated, foreign-born, and Hispanic), county-level share of votes for the Republican candidate in the 1996 and 2000 presidential elections, as well as regional census dummies.Footnote
97
${\rm{\Delta }}RepublicanPart{y_{i,16 - 00}}$
is the county-level change in Republican two-party vote share in presidential elections between 2000 and 2016. Our main variable of interest, taa demand in industrial hubs
c
, measures the magnitude of trade shock to industrial hubs in the commuting zone c where county i is located. taa demand in non-hubs
c
, denotes the trade shock to non-hubs in the same commuting zone c, and serves as a comparative benchmark. Hewing closely to Autor and coauthors’ analysis, we include a battery of control variables: CZ-level employment in manufacturing, the routine share and offshorability index of occupational profile, county-level demographic controls measured in 2000 (population shares for nine age and four racial groups, female, college-educated, foreign-born, and Hispanic), county-level share of votes for the Republican candidate in the 1996 and 2000 presidential elections, as well as regional census dummies.Footnote
97
As shown in Table 4, the trade shock to industrial hubs played a significant role in the political shift that led to the election of Donald Trump in 2016. As before, we begin by separately estimating the effects of taa demand in hubs (columns 1–2) and taa demand in non-hubs (columns 3–4), and then include both simultaneously (columns 5–6). Across the estimated models, we find that the TAA-related shocks to industrial hubs resulted in a significant increase in support for the Republican party between 2000 and 2016. The coefficient on taa demand in hubs is positive and statistically significant throughout the estimated models. Substantively, an increase of ten additional TAA-petitioning workers per 1,000 in the hub industry is associated with a 0.38–0.49 percentage point increase in support for Trump in the 2016 presidential election, relative to 2020.
Table 4. Trade shock to industrial hubs and support for the Republican Party

Standard errors clustered by commuting zones reported in parentheses. Observations are weighted by the size of county measured as the number of total votes in 2000. Dependent variable is the change in the Republican party vote share, 2016–2000.
taa in industrial hubs
is measured as the number of estimated TAA-petitioning workers employed in industrial hubs between 2000 and 2016, expressed as a proportion per 1,000 workers based on CZ-level employment in 1999.
TAA in non-hubs
is respectively measured as the number of TAA-affected workers employed in non-hubs. Full estimation results are presented in Table A24 in the appendix. Notes:+ $p \lt .10$
; *
$p \lt .10$
; * $p \lt .05$
; **
$p \lt .05$
; ** $p \lt 0.01$
.
$p \lt 0.01$
.
By contrast, taa demand in non-hubs is negatively associated with Trump support across all our models. In other words, shocks to geographically concentrated industries favored the populist right candidate, but shocks to geographically diffuse industries translated into greater support for the Democratic Party. Examining geographic concentration may thus provide one possible solution to a recurrent puzzle in the literature: why have economic shocks favored right-wing parties, while the left’s traditional commitment to redistribution would seem better suited, on material grounds, for dealing with economic pain?Footnote 98 As seen through the lens of geographic concentration, the story becomes more contingent: when shocks hit geographically concentrated industries, they provide a singular opportunity for right-wing political leaders to capitalize on feelings of regional decline and economic nostalgia. But when shocks of the same magnitude hit geographically diffuse industries, these are more likely to be perceived as part of the normal course of economic activity. Individuals are less likely to believe that politicians are the ones responsible for preventing such shocks (Table 1), and these generate a lesser sense of loss of relative regional standing (Table 2). They are perceived as economic events that call for an economic response, which translates into increased support for left-wing politicians, and the type of redistributive policies they traditionally champion. That is, economic shocks provide a singular opportunity to right-wing populist candidates, but only when they can be presented as a threat to regional identity.
Is the manufacturing sector different? Manufacturing is prone to higher geographic clustering on average,Footnote 99 which is why we control for the initial CZ-level share of manufacturing in our analyses above. Yet we also test to see whether the effect of geographic concentration is observable within manufacturing industries. As shown in Table A29 in the appendix, the same pattern does obtain across manufacturing, even for a set of industries that tend be more geographically concentrated on average. Shocks to manufacturing industrial hubs translate into increased support for Republican candidates, whereas shocks to non-hubs show the opposite association.
Taken together, these results suggest that Trump’s electoral support reflected not just import competition and its economic effects, but more specifically the perceived decline of geographically concentrated, distinctive, regional industries.
Conclusion
One of the persistent mysteries of the political upheaval affecting Western countries over the last decade is the gap between objective economic conditions and individual perceptions. The labor dislocation due to international liberalization is comparable to past episodes of structural economic change which were not accompanied by the same level of political backlash. What is particular about this wave of economic shocks, however, is that they have been highly concentrated in certain areas, and that they have particularly affected geographically concentrated industries in these regions. As a result, we argue, the fallout has been more than merely economic. Economic shocks to industrial hubs lead to a collective sense of loss and regional decline. These sentiments, in turn, influence voting behavior, driving individuals to support the right-wing political candidates who are best positioned to speak to localized grievances.
Our analysis focuses on the United States, yet our theoretical expectations should travel to other postindustrial countries that have been similarly exposed to labor dislocation in the last decades. The United States is singular in a number of relevant respects, starting with its low unionization rate, which we show is associated with overlapping social and professional networks, and has an independent effect on beliefs about the role of politicians in preventing layoffs. Whether a greater prevalence of labor unions would further amplify the political effect of declining industrial hubs is an open question, and one that future research could address. What is certain is that the difficult-to-pin-down phenomenon around the loss of regional status and identity tied to historical industries has been evidenced in European and British contexts alike. As we note, a prevalent sense of loss and “nostalgia” following deindustrialization has been cited as a phenomenon of equal importance in the United Kindgom as in the United States.Footnote 100 Similarly, political effects in the United Kingdom have been especially notable in “places where communities were organised around large local industries.”Footnote 101 While studies highlighting the importance of nostalgia in British and European contexts are often qualitative and sociological in nature, we offer a possible means of empirically operationalizing the relevant aspect of economic geography that may account for the heightened grievances that accompany declines in deeply rooted industries across developed economies. Our approach is readily applicable to these settings, where industrial cluster-mapping projects similar to the one we rely on in our analysis already exist.Footnote 102
Yet as we show looking at the United States, these industrial hubs have accounted for more job losses than job gains over the last twenty years. Such job losses, we argue, then carry greater social implications by virtue of affecting regionally over-represented industries that touch on a place’s regional identity and overlap with its social networks. In such areas, labor dislocation is not merely an economic phenomenon. Individuals living in these areas are more likely to report a perceived loss of their region’s social standing in response to layoffs. They are more likely to look to political leaders as having a duty to prevent such layoffs, and to favor thick populist traits in those leaders. The result, as we show, manifests in an electoral shift to the political right. When economic shocks hit geographically concentrated industries, what might otherwise have been written off as structural economic change instead gives rise to strong political passions.
Acknowledgments
For valuable feedback and suggestions, we thank Stephen Chaudoin, Alexander Kuo, Taegyun Lim, George Yean, and participants at the 2021 International Political Economy Society and the IR research workshop at Harvard University, as well as the editors and reviewers of this journal.
Funding
This work was supported by the National Research Foundation of Korea (NRF) grant funded by the Korea government (MSIT) (No. RS-2022-NR068754) and Korea University (No. K2522861).
Supplementary Material
Supplementary material for this article is available at <https://doi.org/10.1017/S0020818325101203>


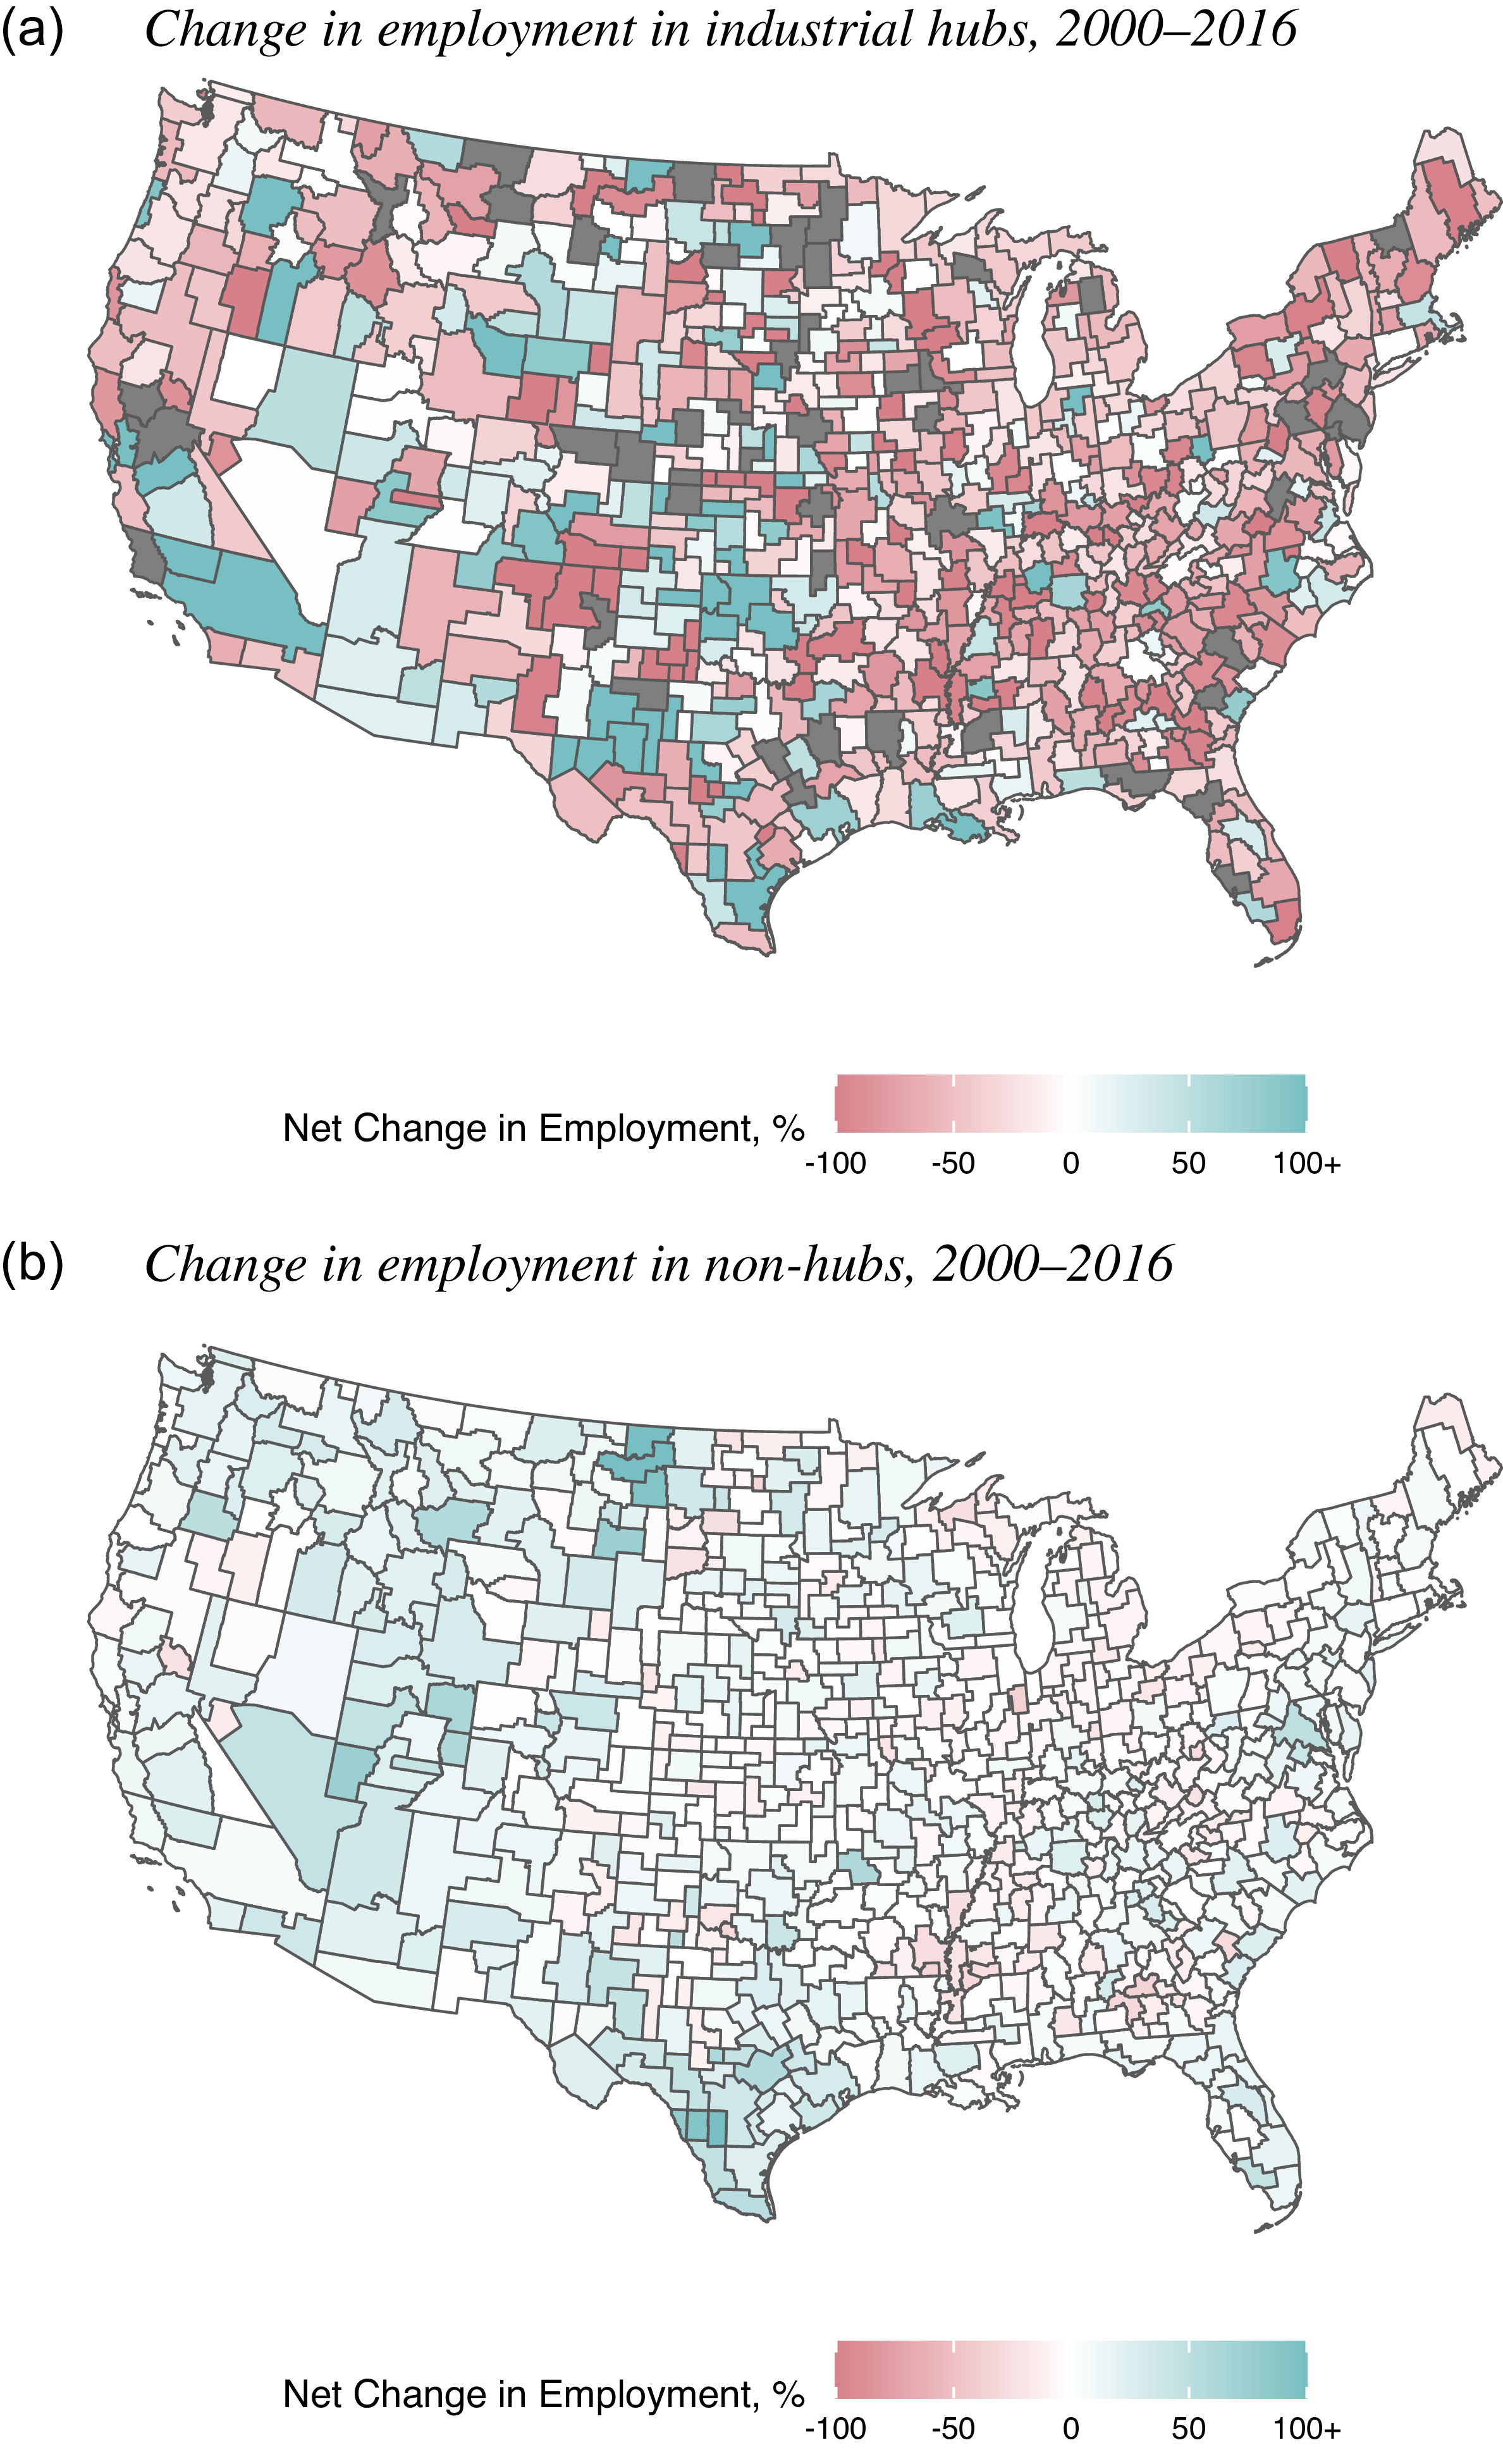
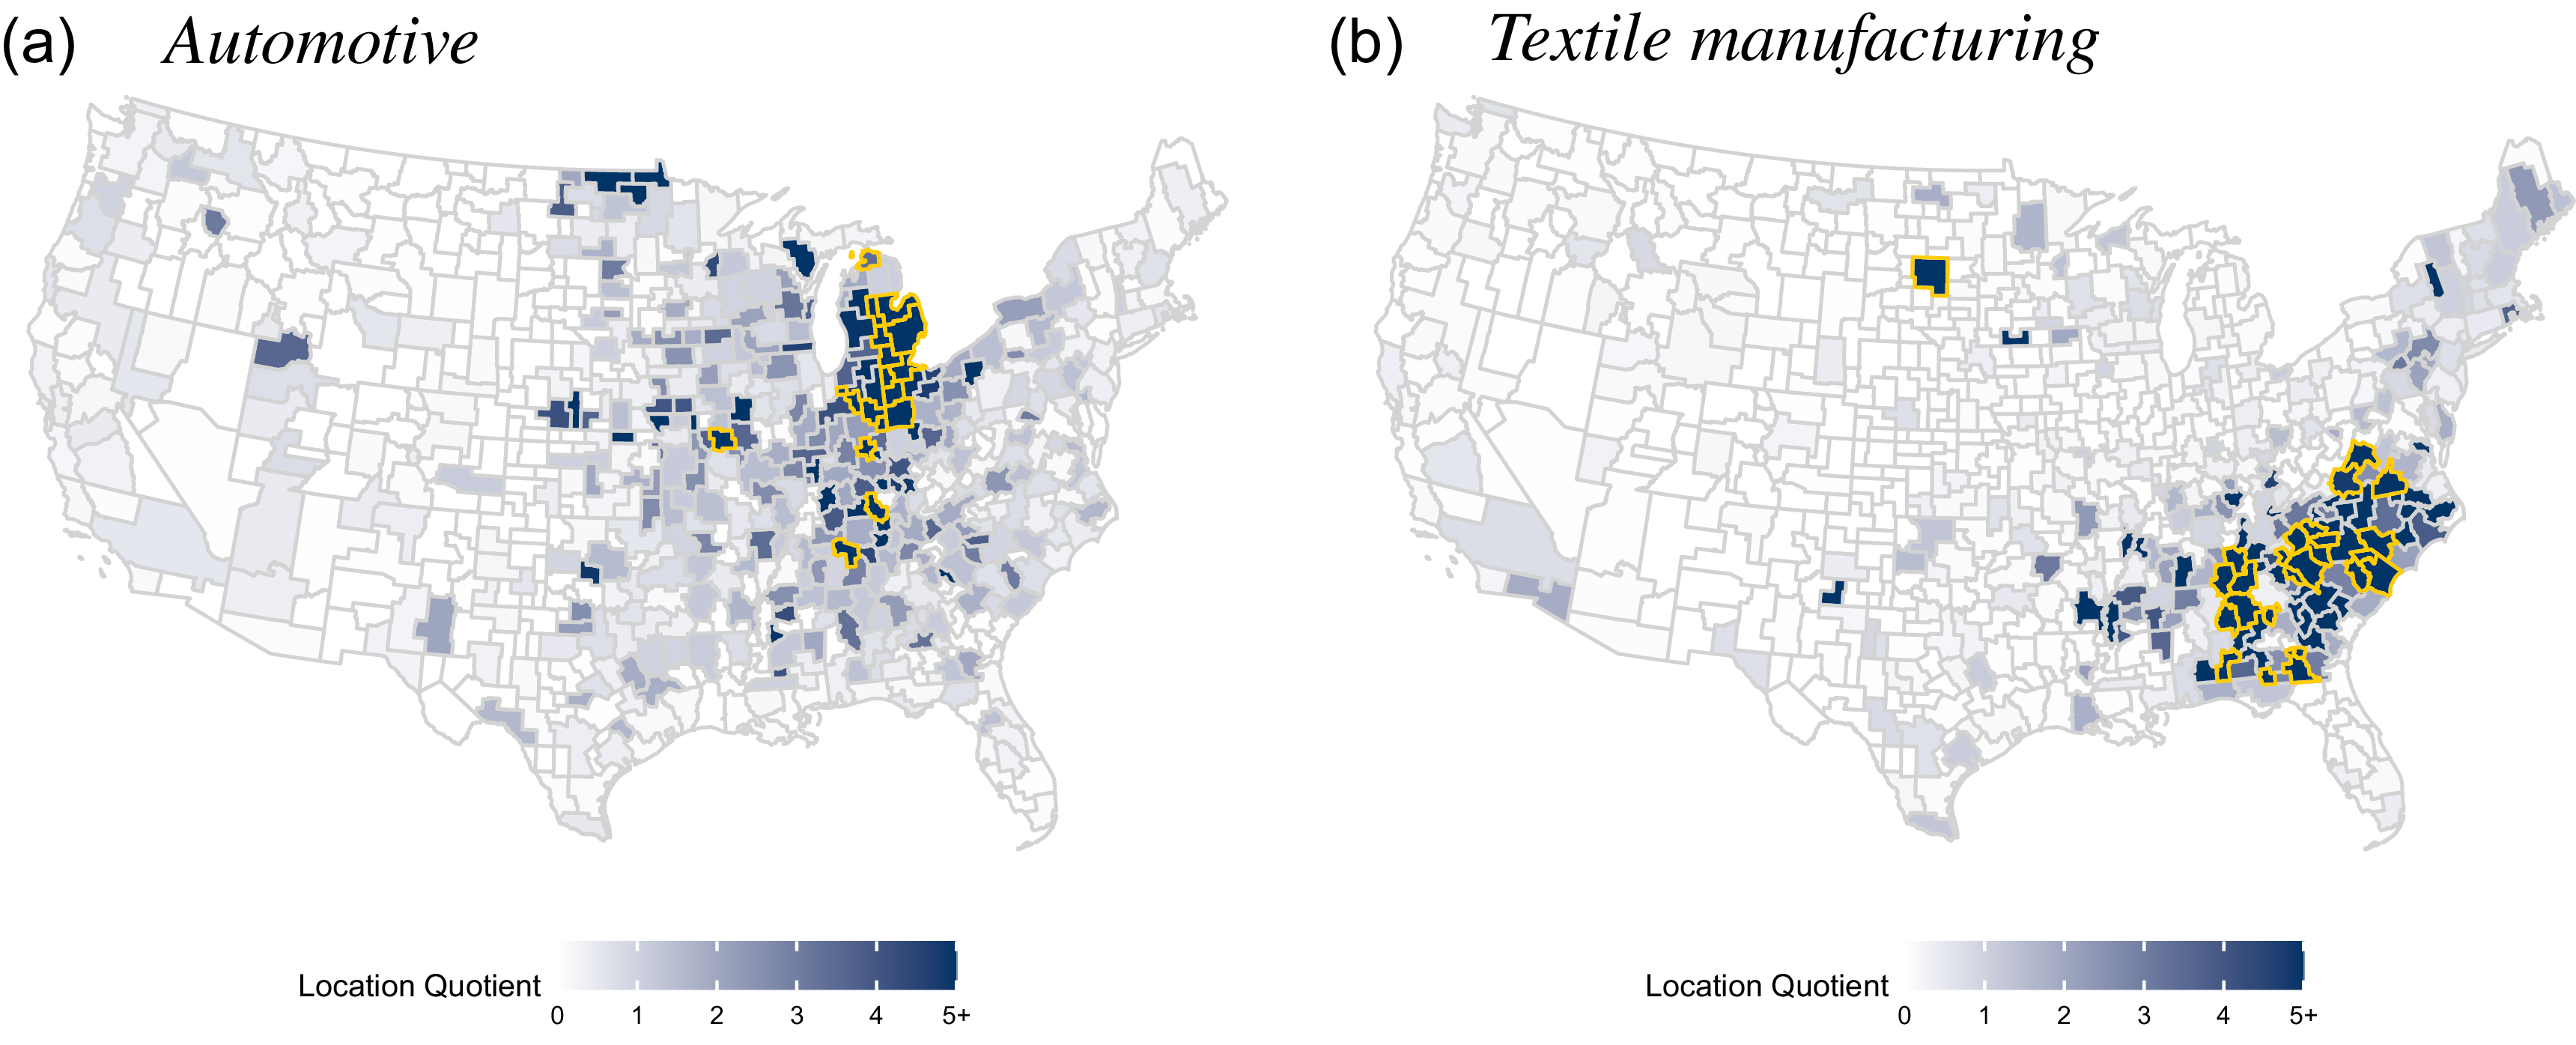
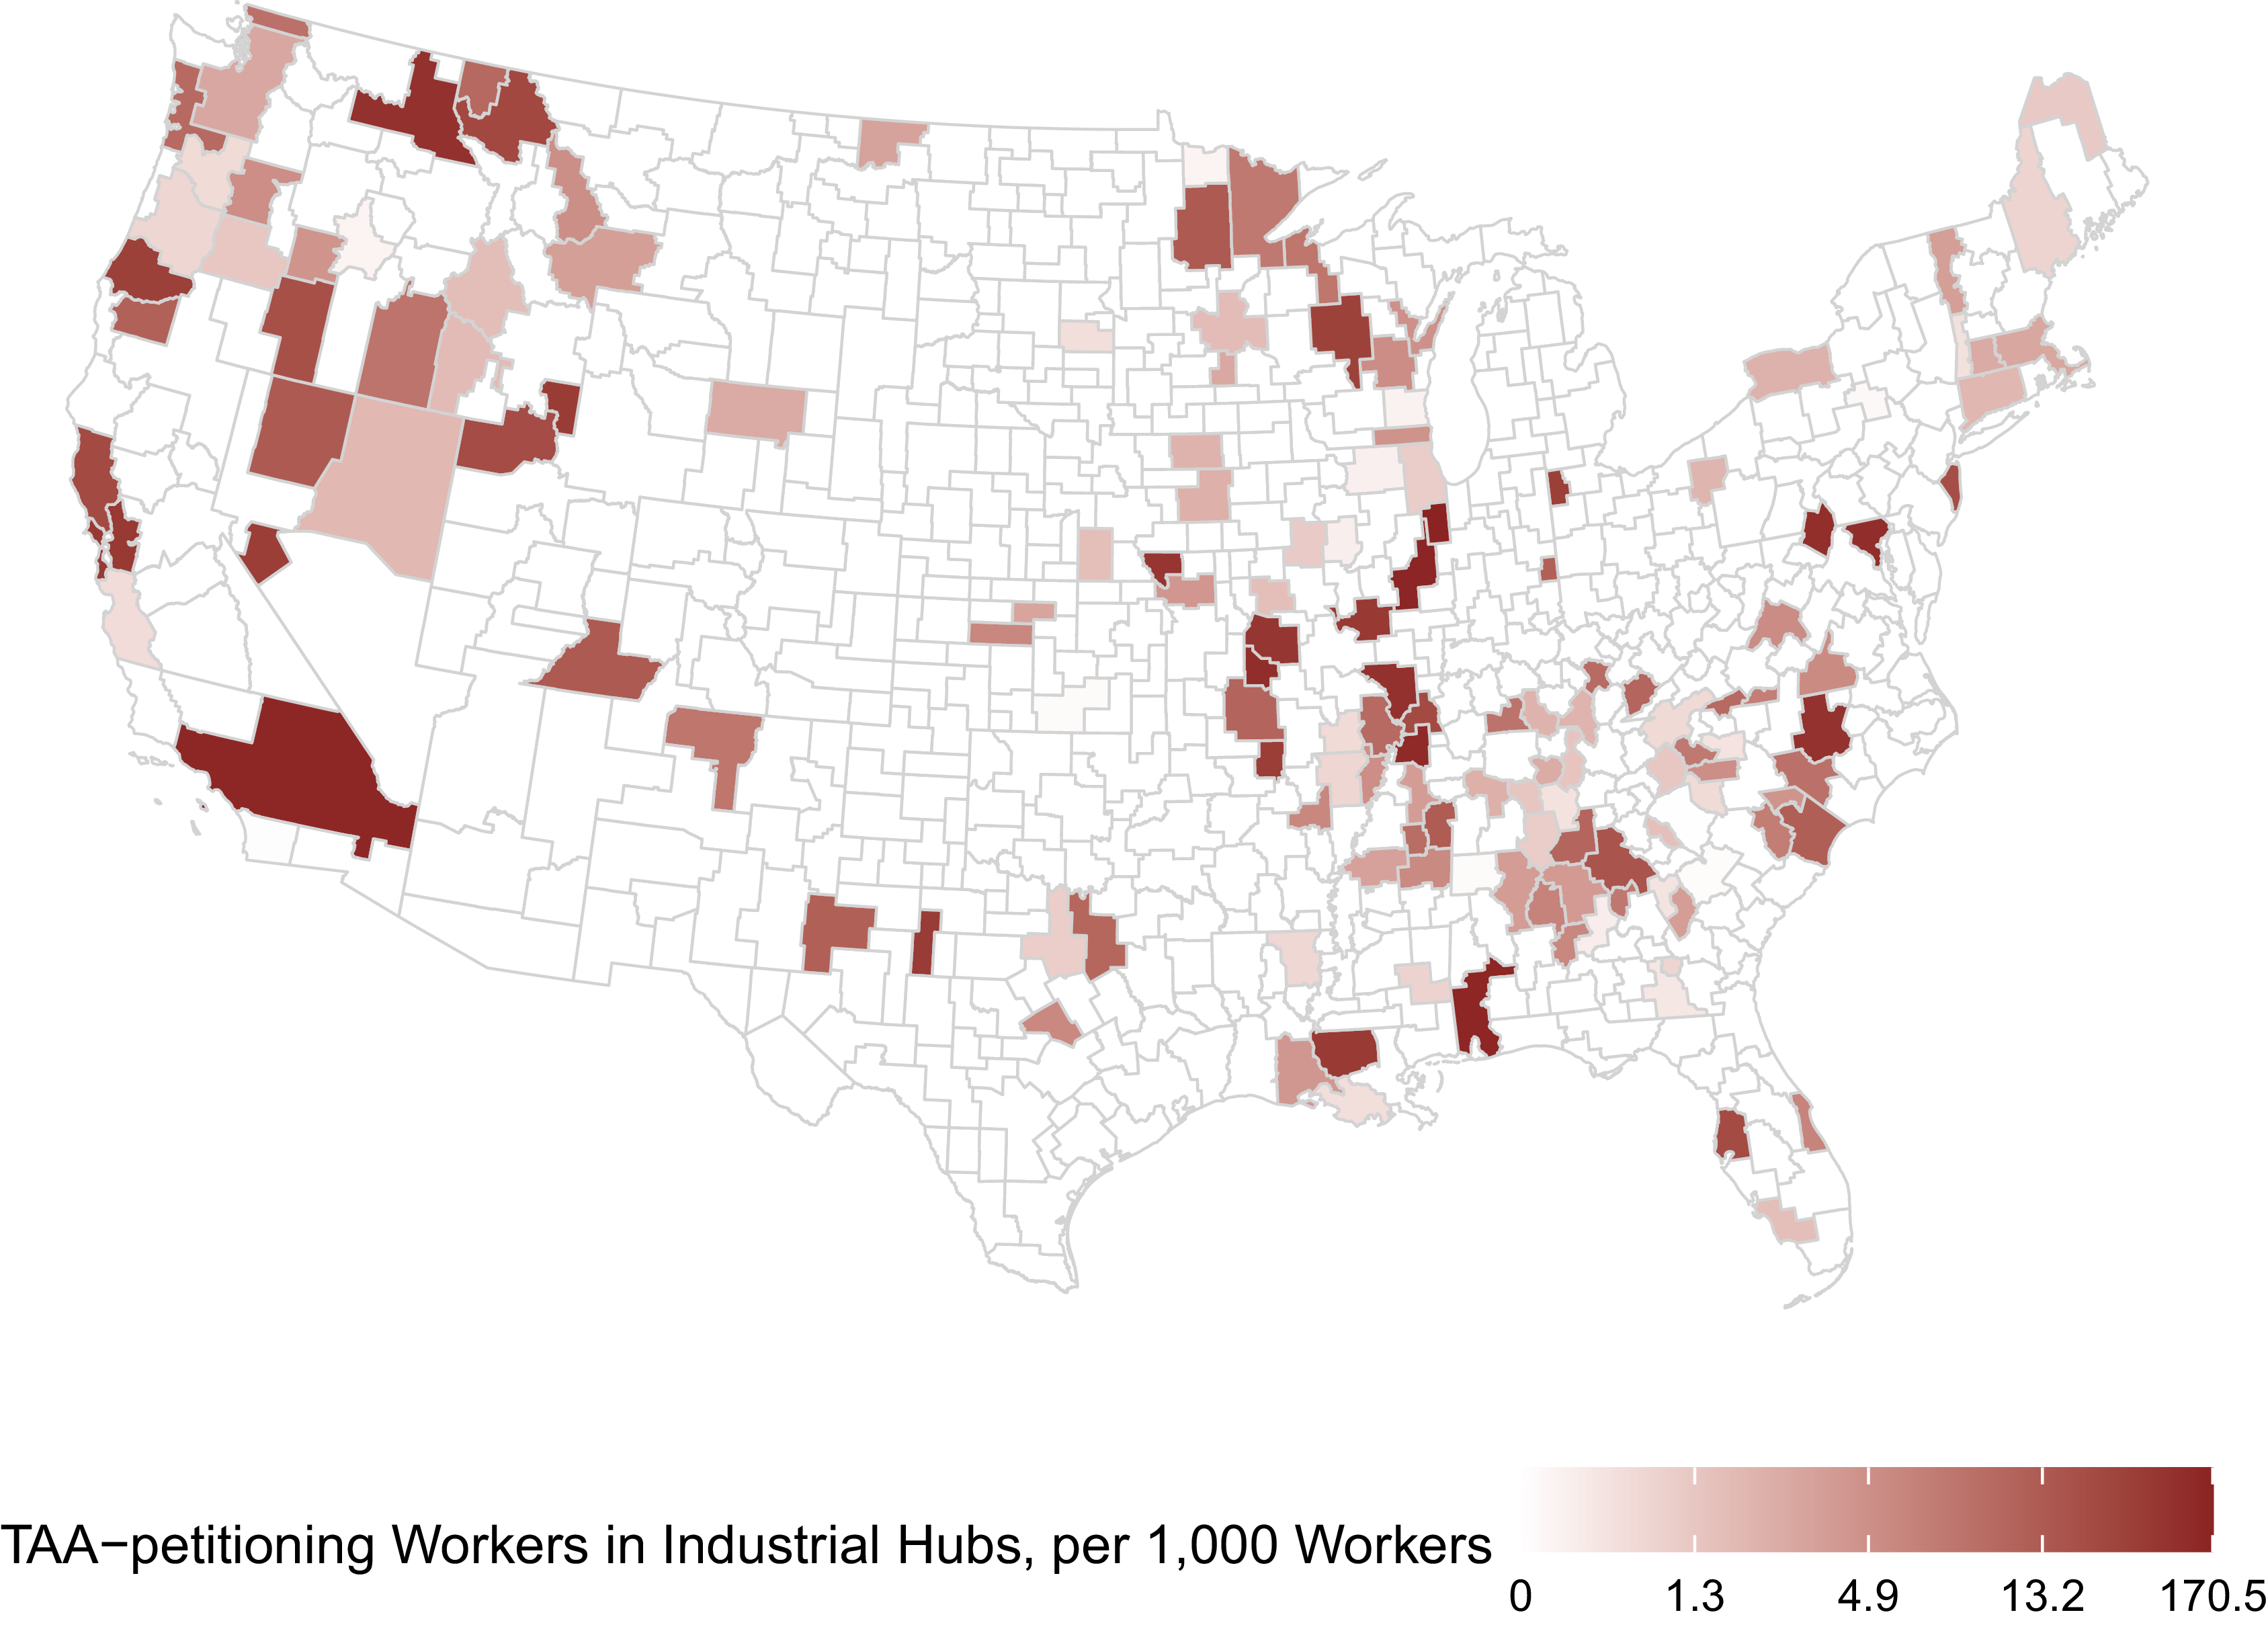
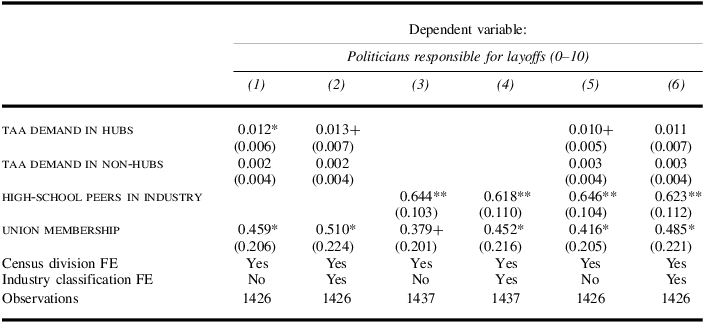
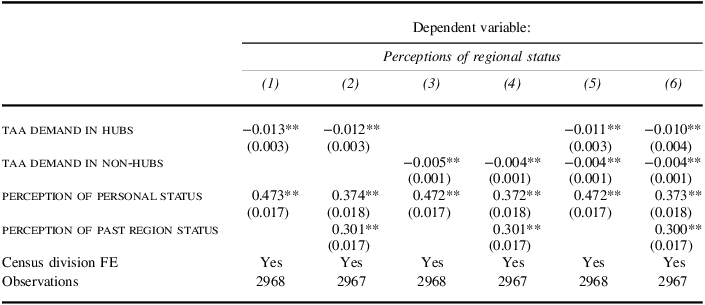
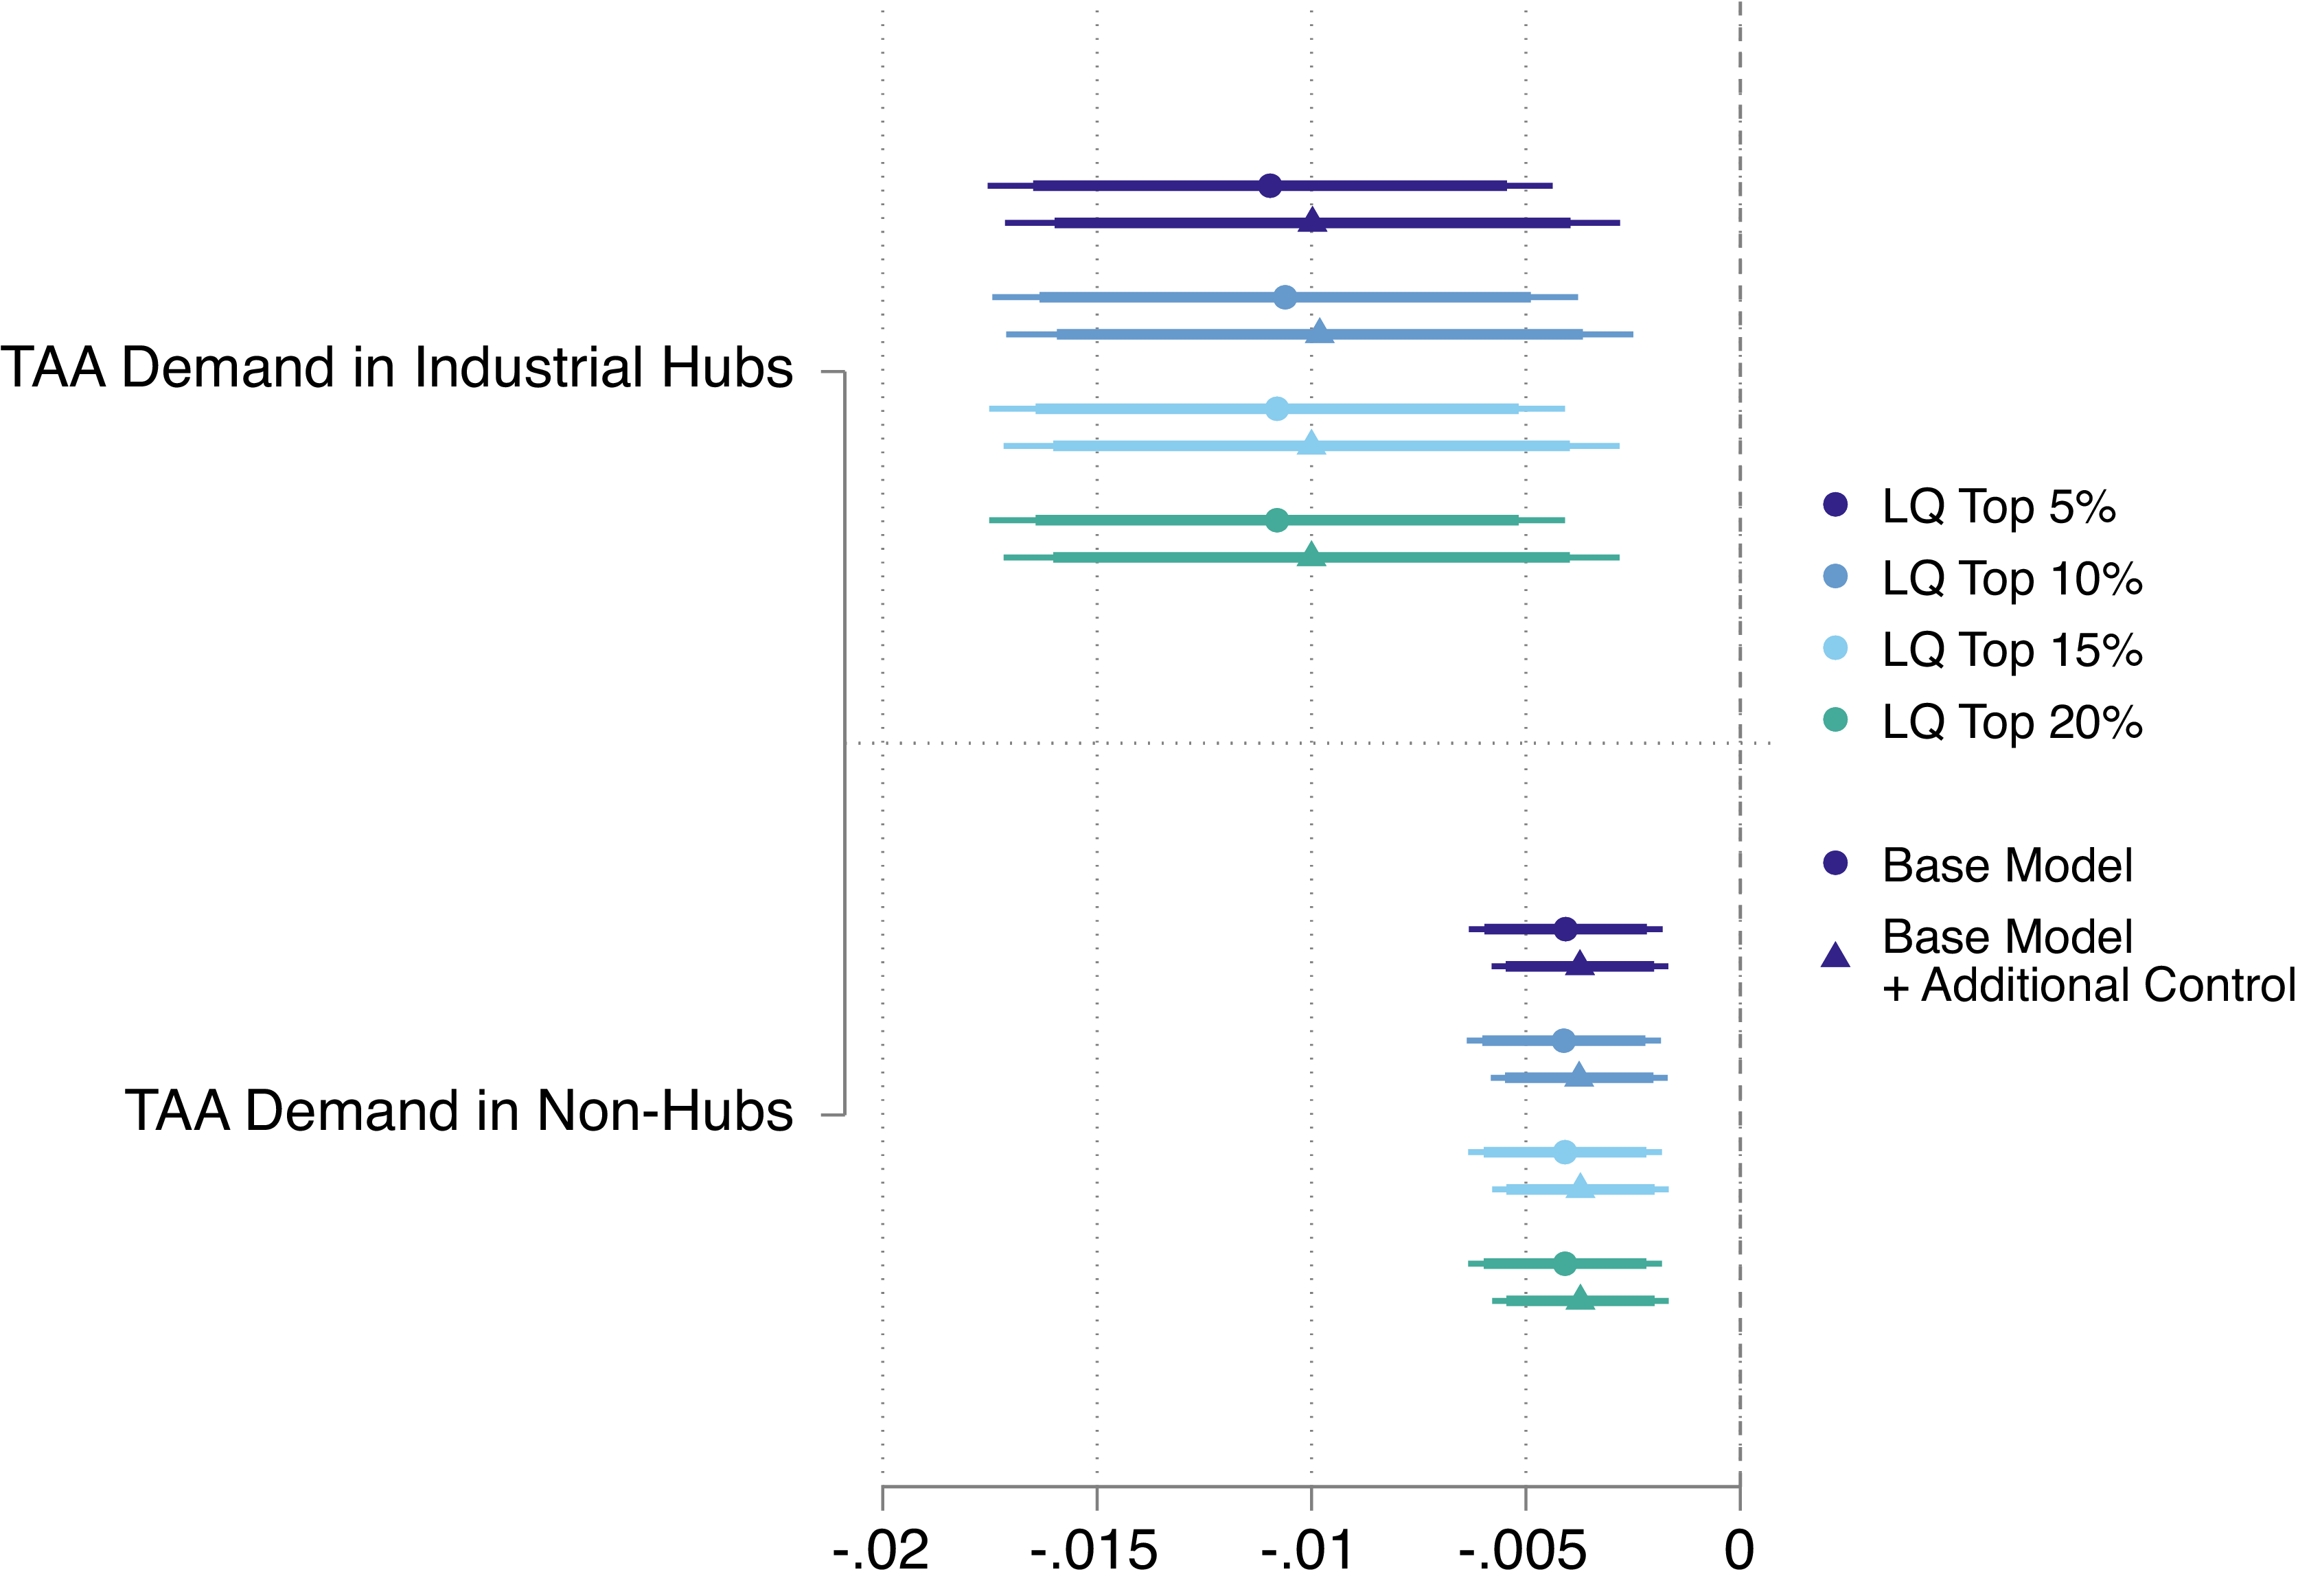
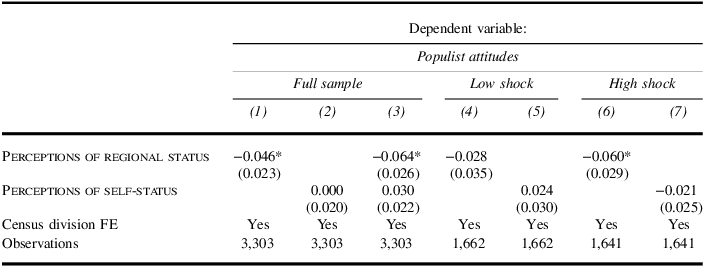
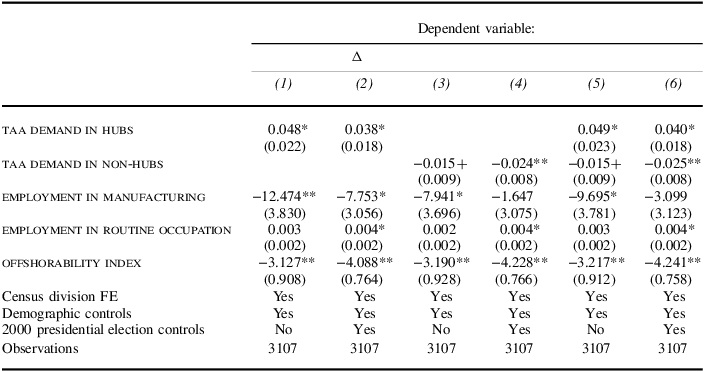


 Open access