


I. Introduction
Although it is generally accepted that adverse selection exists in residential mortgage markets, the relatively limited empirical evidence in the extant literature is mixed, inconclusive, and subject to endogeneity concerns (Ambrose, LaCour-Little, and Sanders (Reference Ambrose, LaCour-Little and Sanders2005), Elul (Reference Elul2016), and Agarwal, Chang, and Yavas (Reference Agarwal, Chang and Yavas2012)). This article tests for adverse selection in a new setting: Ginnie Mae (GNMA) mortgage-backed security (MBS) issuers’ early buyout decisions.Footnote 1 We test for adverse selection by examining whether GNMA issuers make early buyout decisions that maximize their earnings at the expense of MBS investors.
An early buyout refers to issuers’ right to buy loans out of GNMA MBS pools at par value (i.e., the loan’s remaining principal balance) if the loans are 3 or more months past due.Footnote 2 GNMA issuers can maximize their earnings by buying out seriously delinquent loans that have higher interest rate spreads and are more likely to reperform.Footnote 3 When the loans reperform, issuers can resecuritize them into new GNMA MBS pools with their original coupon rate. In a declining interest rate environment, the resecuritized loans sell for a premium, creating extra earnings for issuers. The issuers’ economic gains come at the expense of the original security holders, who must reinvest their funds at a lower rate.
We show GNMA issuers’ early buyout activity is both pervasive and economically significant. From 2015 through 2021, GNMA issuers bought out over 1.6 million seriously delinquent loans, or roughly 5.7% of all GNMA loans. Estimating the economic effect of issuers’ early buyout activity is complicated because early buyout loans are assigned a new Loan ID when they are resecuritized. Using a novel automated matching technique and conservative back-of-the-envelope calculation, we estimate that early buyouts generated $5.2 to $8.7 billion in additional revenue for GNMA issuers. If GNMA investors price early buyout risk and these costs are passed on to GNMA borrowers, we estimate they would have to pay an additional 5.4–9.1 basis points per year in interest rates.
We document adverse selection in GNMA issuers’ early buyout decisions by showing that issuers buy out seriously delinquent loans with higher interest rate spreads. Conditional on default, we find a 1 percentage point (or roughly 1-standard-deviation) increase in interest rate spread increases the probability of an early buyout by 7–9 percentage points. We provide additional support for our claim of adverse selection by examining whether GNMA issuers’ early buyout activity is a function of their access to capital. Early buyouts are capital-intensive, requiring issuers to advance the full unpaid principal balance of the loan at the time of repurchase. Accordingly, we expect issuers with less access to capital to perform fewer early buyouts. However, when issuers with less access to capital perform early buyouts, we expect them to be more selective. Consistent with these conjectures, we find that shadow bank issuers buy out loans at a 44% lower rate than traditional bank issuers, but that they cherry-pick loans with significantly higher interest rate spreads.
GNMA issuers can maximize their earnings by using their finite financial resources to only buy out loans they expect to reperform. If issuers are nearly certain a higher interest rate spread loan will not reperform, they are better off leaving it in the MBS pool and buying out a slightly lower interest rate spread loan they expect to reperform. We provide several pieces of evidence indicating that issuers buy out seriously delinquent loans that are more likely to reperform. Issuers’ decision to not buy out seriously delinquent loans that are less likely to reperform does not necessarily harm investors because every loan in GNMA MBS is federally insured or guaranteed. Instead, investors are harmed when issuers buy out loans with higher interest rate spreads that are more likely to reperform.
A central tenet of the theory of adverse selection is that informed market participants have access to private information they can use to maximize their outcomes at the expense of other less-informed parties. Using proprietary data that includes over 1.16 million servicer call logs for 3,084 early buyout loans, we i) illustrate how issuers acquire private information about the borrower and ii) show that the private information provides critical insight into whether a loan will reperform. Although issuers ostensibly collect the information on behalf of MBS investors, we show that issuers can use the private information to infer the delinquent borrower’s likelihood of reperformance (i.e., inform their early buyout decision).
We find that including the private soft information from servicer call logs in a regression examining the probability of reperformance increases its explanatory power relative to a baseline regression which includes only hard information. The improved performance does not provide causal evidence that GNMA issuers exploit the soft information in their early buyout decisions. However, when taken together with the higher early buyout reperformance rates and the fact that GNMA issuers cherry-pick loans with higher interest rate spreads, the improved performance suggests that issuers can use soft information collected during the delinquent loan servicing process to maximize their early buyout outcomes.
GNMA’s scale makes it independently policy-relevant: from 2010 to 2020, GNMA’s outstanding first-lien mortgage debt more than doubled to approximately the same size as Freddie Mac and two-thirds the size of Fannie Mae (Urban Institute (2020)).Footnote 4 GNMA differs from Fannie Mae and Freddie Mac, which are commonly referred to as the government-sponsored enterprises (GSEs), in fundamental ways that are central to this paper’s focus. The GSEs pool mortgages and issue MBS directly. In contrast, GNMA does not issue the mortgage pools it guarantees and does not use its own balance sheet to manage delinquencies. Instead, GNMA guarantees timely payment for pass-through securities sold by approved issuers. GNMA’s business model minimizes its exposure to credit risk by only guaranteeing the issuer’s servicing performance, not the underlying collateral. This structure places the entire economic burden of early buyouts on the issuer, creating strong incentives that can influence issuers’ early buyout decisions. These institutional features make GNMA MBS an ideal setting to test for adverse selection in mortgage markets.
A. Literature Review
This study contributes to several strands of literature, first and foremost being the role of adverse selection in residential mortgage markets.Footnote 5 Previous studies test for adverse selection in mortgage markets by comparing portfolio-held loans’ default and prepayment risk relative to securitized loans. The results in the literature are mixed and inconclusive. Ambrose et al. (Reference Ambrose, LaCour-Little and Sanders2005) find loans with lower default risk are more likely to be securitized. In contrast, Elul (Reference Elul2016) finds loans with higher default risk are more likely to be securitized. Whereas Agarwal et al. (Reference Agarwal, Chang and Yavas2012) find conflicting evidence of adverse selection in prime and subprime mortgage markets. The mixed results underscore the relatively limited empirical evidence of adverse selection in mortgage markets.
We contribute to the literature by testing for and documenting adverse selection in GNMA issuers’ early buyout activity. Our setting is ideal for several reasons. First, every loan in our study has already been rigorously screened and securitized. Second, every loan is backed by a federally insured or guaranteed loan program. Third, there is a relatively low level of dispersion in loan quality within and across GNMA MBS pools. Fourth, testing for adverse selection in lenders’ securitization decisions is complicated by endogeneity concerns stemming from the joint determination of observed securitization and loan performance.Footnote 6 Critically, our setting allows us to completely circumvent the endogeneity concerns in the literature. In doing so, we provide new evidence of adverse selection in residential mortgage markets.
There is a large body of research studying the effect of rate incentives on borrowers’ prepayment decisions (e.g., Green and Shoven (Reference Green and Shoven1986), Schwartz and Torous (Reference Schwartz and Torous1989), Deng, Quigley, and Van Order (Reference Deng, Quigley and Van Order2000), and Berger, Milbradt, Tourre, and Vavra (Reference Berger, Milbradt, Tourre and Vavra2021)), with much of the recent work focusing on homeowners’ failure to refinance (Keys, Pope, and Pope (Reference Keys, Pope and Pope2016)) due to lack of financial sophistication (Agarwal, Rosen, and Yao (Reference Agarwal, Rosen and Yao2016), Agarwal, Ben-David, and Yao (Reference Agarwal, Ben-David and Yao2017), and Bajo and Barbi (Reference Bajo and Barbi2018)) or psychological costs and behavior (Andersen, Campbell, Nielsen, and Ramadorai (Reference Andersen, Campbell, Nielsen and Ramadorai2020)). We identify a new form of prepayment risk in GNMA MBS, where prepayment decisions are driven by GNMA issuers rather than borrowers. Unlike typical borrowers, GNMA issuers are financially sophisticated and less prone to behavioral biases.
The notion that private information influences lending and securitization decisions is well established in the literature. However, most studies use indirect proxies of private information (e.g., Berger, Miller, Petersen, Rajan, and Stein (Reference Berger, Miller, Petersen, Rajan and Stein2005), Hauswald and Marquez (Reference Hauswald and Marquez2006), Agarwal and Hauswald (Reference Agarwal and Hauswald2010), and An et al. (Reference An, Deng and Gabriel2011)). Our article differs in that we use direct and precise measures of private information collected during the mortgage servicing process. We demonstrate that the private information offers valuable insight into a loan’s likelihood of performance. Agency conflicts arise because, while GNMA issuers collect this information on behalf of MBS investors, they can exploit it in early buyout decisions, often to the detriment of investors. Only a few other studies use direct private information: Agarwal, Ambrose, Chomsisengphet, and Liu (Reference Agarwal, Ambrose, Chomsisengphet and Liu2011), Aiello (Reference Aiello2016), and Becker, Hendricks, Houde, and Raisingh (Reference Becker, Hendricks, Houde and Raisingh2024). The contemporaneous study by Becker et al. (Reference Becker, Hendricks, Houde and Raisingh2024) is of particular interest because it uses GNMA data to show that banks are privately and asymmetrically informed about prepayment risk.
Our article is also related to research documenting the recent rise of shadow banking (Buchak, Matvos, Piskorski, and Seru (Reference Buchak, Matvos, Piskorski and Seru2018), Fuster, Plosser, Schnabl, and Vickery (Reference Fuster, Plosser, Schnabl and Vickery2019), and Irani, Iyer, Meisenzahl, and Peydro (Reference Irani, Iyer, Meisenzahl and Peydro2021)). We contribute to the literature by showing that shadow bank loans have significantly lower early buyout risk than traditional bank loans. However, when shadow banks perform early buyouts, they buy out loans with significantly higher interest rate spreads. We attribute shadow bank issuers’ selectivity to the fact that early buyouts are capital-intensive, and shadow banks are non-depository institutions whose capital structures differ from traditional banks (Pozsar, Adrian, Ashcraft, and Boesky (Reference Pozsar, Adrian, Ashcraft and Boesky2010), Buchak et al. (Reference Buchak, Matvos, Piskorski and Seru2018), and Jiang, Matvos, Piskorski, and Seru (Reference Jiang, Matvos, Piskorski and Seru2020)).
II. Data Overview
A. GNMA Loan-Level Data
Our main analysis uses publicly available loan-level data from the GNMA website. The data include over 28.4 million unique loans from December 2013 through December 2022. For our regressions, we use a subsample of just under 3 million seriously delinquent loans, focusing on the first instance of default during the study period. We consider a loan seriously delinquent when the borrower is flagged as 3 months delinquent in the GNMA loan-level data.Footnote 7 We restrict the seriously delinquent loan subsample to only include loans whose first instance of default occurred from January 2015 through December 2021. The leading and trailing windows allow us to examine borrower payment behavior in the 12 months leading up to default and loan outcomes 12 months after the borrower defaults.
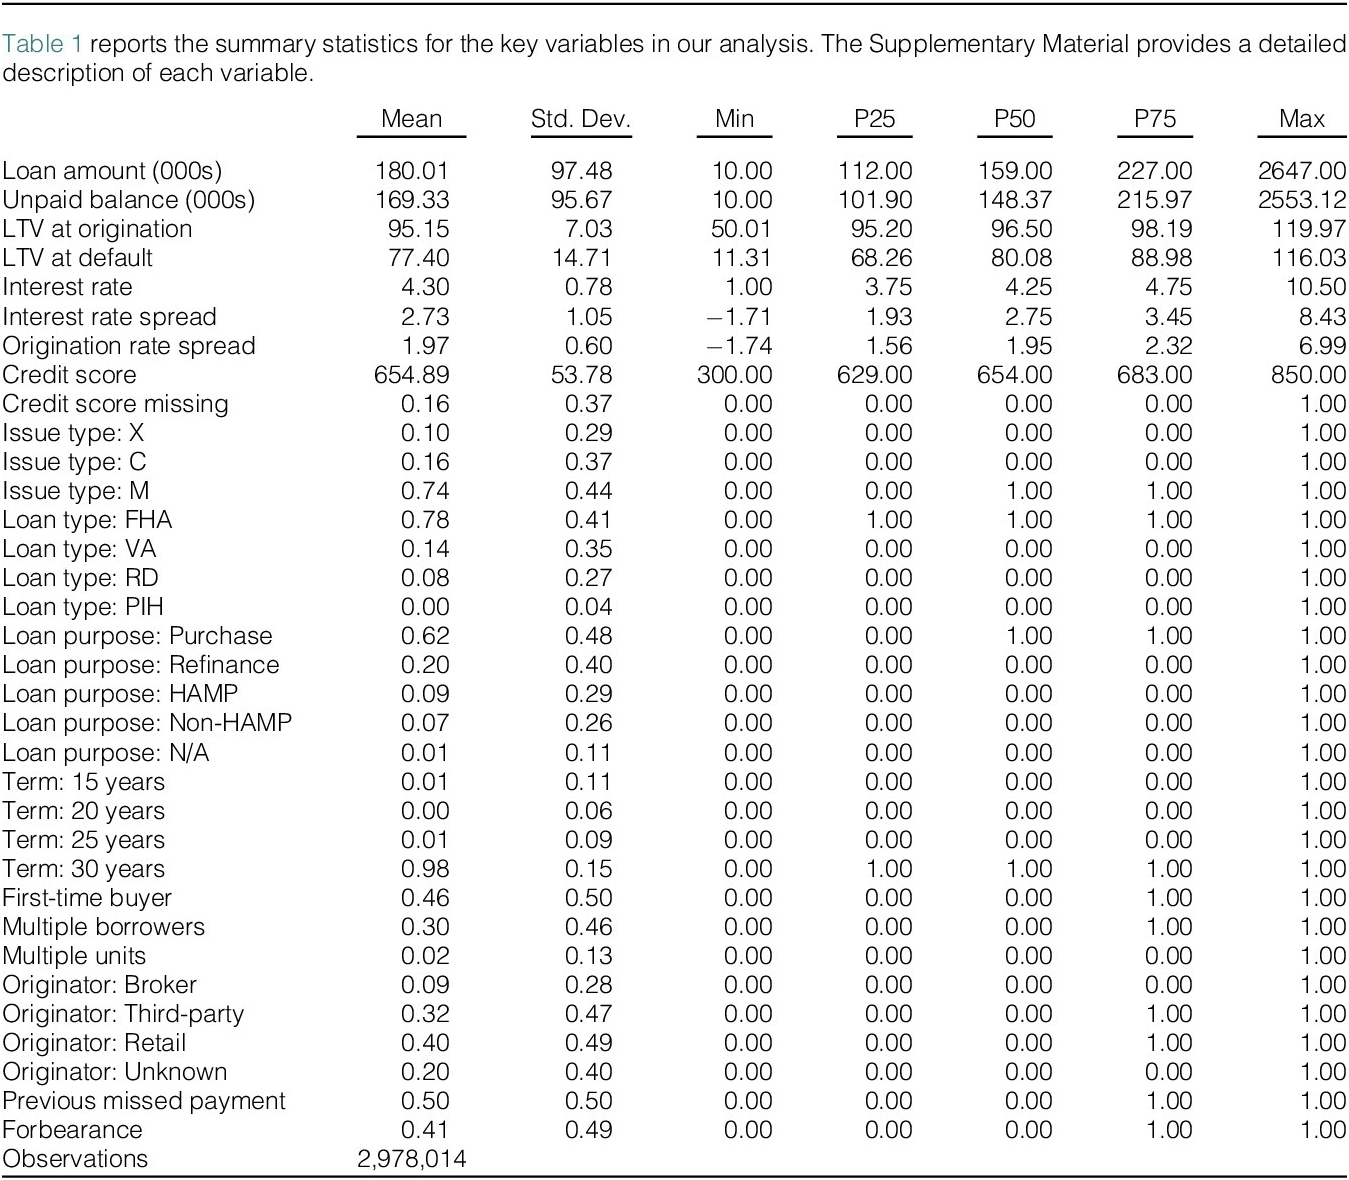
Table 1 reports summary statistics for the key variables used in the empirical analysis, including the interest rate spread variable. Each loan’s interest rate spread is calculated as the difference between its contract interest rate at origination minus the 10-year Treasury Constant Maturity Rate when the loan first becomes delinquent. We focus on interest rate spreads because they capture the potential economic gain associated with an early buyout. Figure 1 illustrates the relationship between issuers’ early buyout activity and interest rate spreads over the study period. The figure shows that as the monthly 10-year Treasury Constant Maturity Rate decreases, i) the average interest rate spread of loans that become seriously delinquent increases, and ii) the fraction of early buyouts among these newly delinquent loans also increases.
Table 1 Seriously Delinquent Loan Summary Statistics


Figure 1 Early Buyout Activity over Time
Figure 1 illustrates the monthly relationship between issuers’ early buyout activity and interest rates over the study period. The early buyout line tracks the fraction of loans that became seriously delinquent in a given month that were subsequently bought out early (left axis). The interest rate spread line reflects the average interest rate spread of those newly seriously delinquent loans, while the 10-year Treasury line represents the monthly 10-year Treasury Constant Maturity Rate (right axis).
Removal Reasons
The GNMA loan-level data provide information about the removal reason, if any, for each seriously delinquent loan. There are six possible outcomes captured in the removal reason classifications. Reason Code 1 (Mortgagor Payoff) identifies loans in which the mortgagor pays the loan in full. Reason Code 2 (Early Buyout) applies when the issuer uses its own funds to repurchase a seriously delinquent loan. Reason Code 3 (FC with Claim Payment) applies when the issuer receives and deposits insurance/guaranty funds after a foreclosure. Reason Code 4 (Loss Mitigation) applies when an issuer repurchases a loan with the express intention of performing loss mitigation. Reason Code 5 (Substitution) applies either when the issuer needs to remove and substitute a defective loan, or when the issuer is correcting for an over-collateralization by means of loan substitution. Reason Code 6 (Other) applies when the issuer removes a loan for any other reason.
GNMA closely monitors and validates the classifications used for removal reasons. Each month, issuers must certify the accuracy of their pool and loan data submitted through the Reporting and Feedback System (refer to GNMA MBS Guide, Chapter 17, Section 4). The Office of Issuer & Portfolio Management also conducts regular compliance reviews, which include assessments of issuer reporting practices. Issuers that do not meet these reporting, accounting, and certification requirements may face sanctions.
We infer two additional outcomes for loans that are not removed during the specified post-default window. Reason Code 7 (Self-cure) applies to loans that self-cure and are no longer seriously delinquent at the end of the specified post-delinquency window. Reason Code 8 (Seriously Delinquent) applies to loans that do not cure and remain seriously delinquent at the end of the specified post-default window.
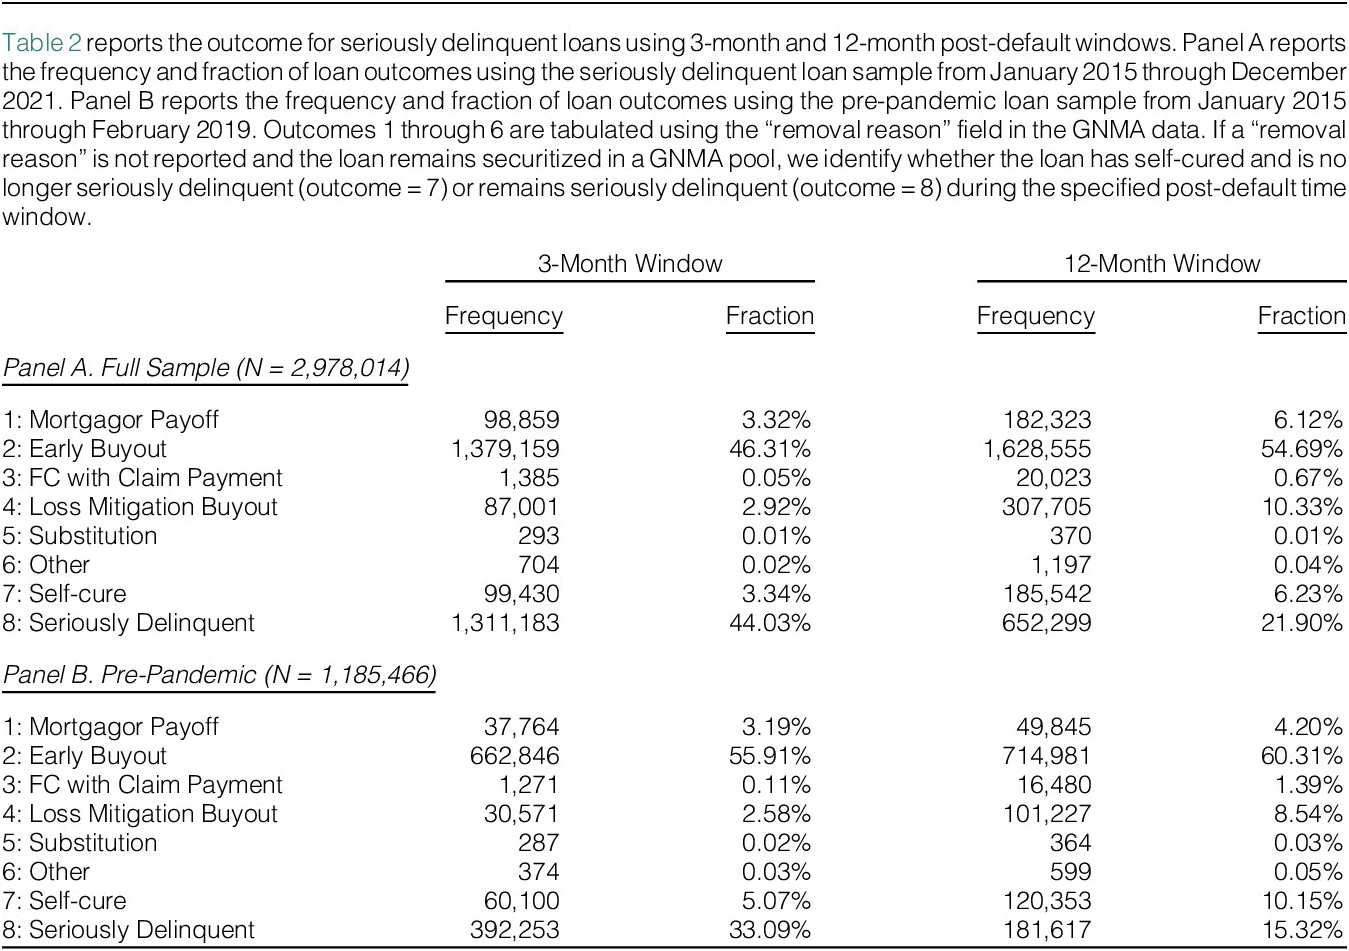
Panel A of Table 2 tabulates the loan outcomes for the full sample of seriously delinquent loans used in the empirical analysis. Issuers perform an early buyout (loan outcome = 2) on 46.31% of the seriously delinquent loans within 3 months of default.Footnote 8 Extending the trailing window to 12 months increases the fraction of early buyouts to 54.69%, indicating that most early buyouts occur within 3 months of default.
Table 2 Seriously Delinquent Loan Outcomes

Panel A also highlights the fact that issuers do not buy out a large fraction of seriously delinquent loans. We find 44.03% of loans remain seriously delinquent after 3 months, and 21.90% remain seriously delinquent after 12 months. The relatively high fraction of seriously delinquent loans that remain in GNMA pools indicates that issuers do not buy out every seriously delinquent loan—thereby suggesting issuers may cherry-pick loans with higher interest rate spreads that are more likely to reperform.
Panel B of Table 2 tabulates the pre-pandemic loan outcomes of seriously delinquent loans for comparison purposes. The pre-pandemic subsample includes seriously delinquent loans whose first instance of default occurred before March 2019. The March 2019 cutoff provides the trailing 12-month window necessary to observe the post-default outcomes prior to the COVID-19 pandemic. We use this pre-pandemic subsample of seriously delinquent loans to mitigate the potential confounding impacts of pandemic-related forbearance programs and GNMA’s temporary restriction on the resecuritization of early buyout loans. In doing so, we demonstrate that issuers’ early buyout activity was not purely forbearance-driven and that adverse selection was present before the pandemic.
B. Private Equity Data
We examine whether GNMA issuers have access to private soft information using proprietary data obtained from a large private equity firm specializing in distressed mortgage workouts. The unique data set includes 3,084 early buyout loans with a total outstanding loan balance of just under $350 million. The private equity firm purchased the loans from 5 different GNMA issuers between January 2016 and April 2019. The data include much of the standard hard information available in the GNMA loan-level data as well as soft information (i.e., servicer call logs) collected during the delinquent loan servicing process.
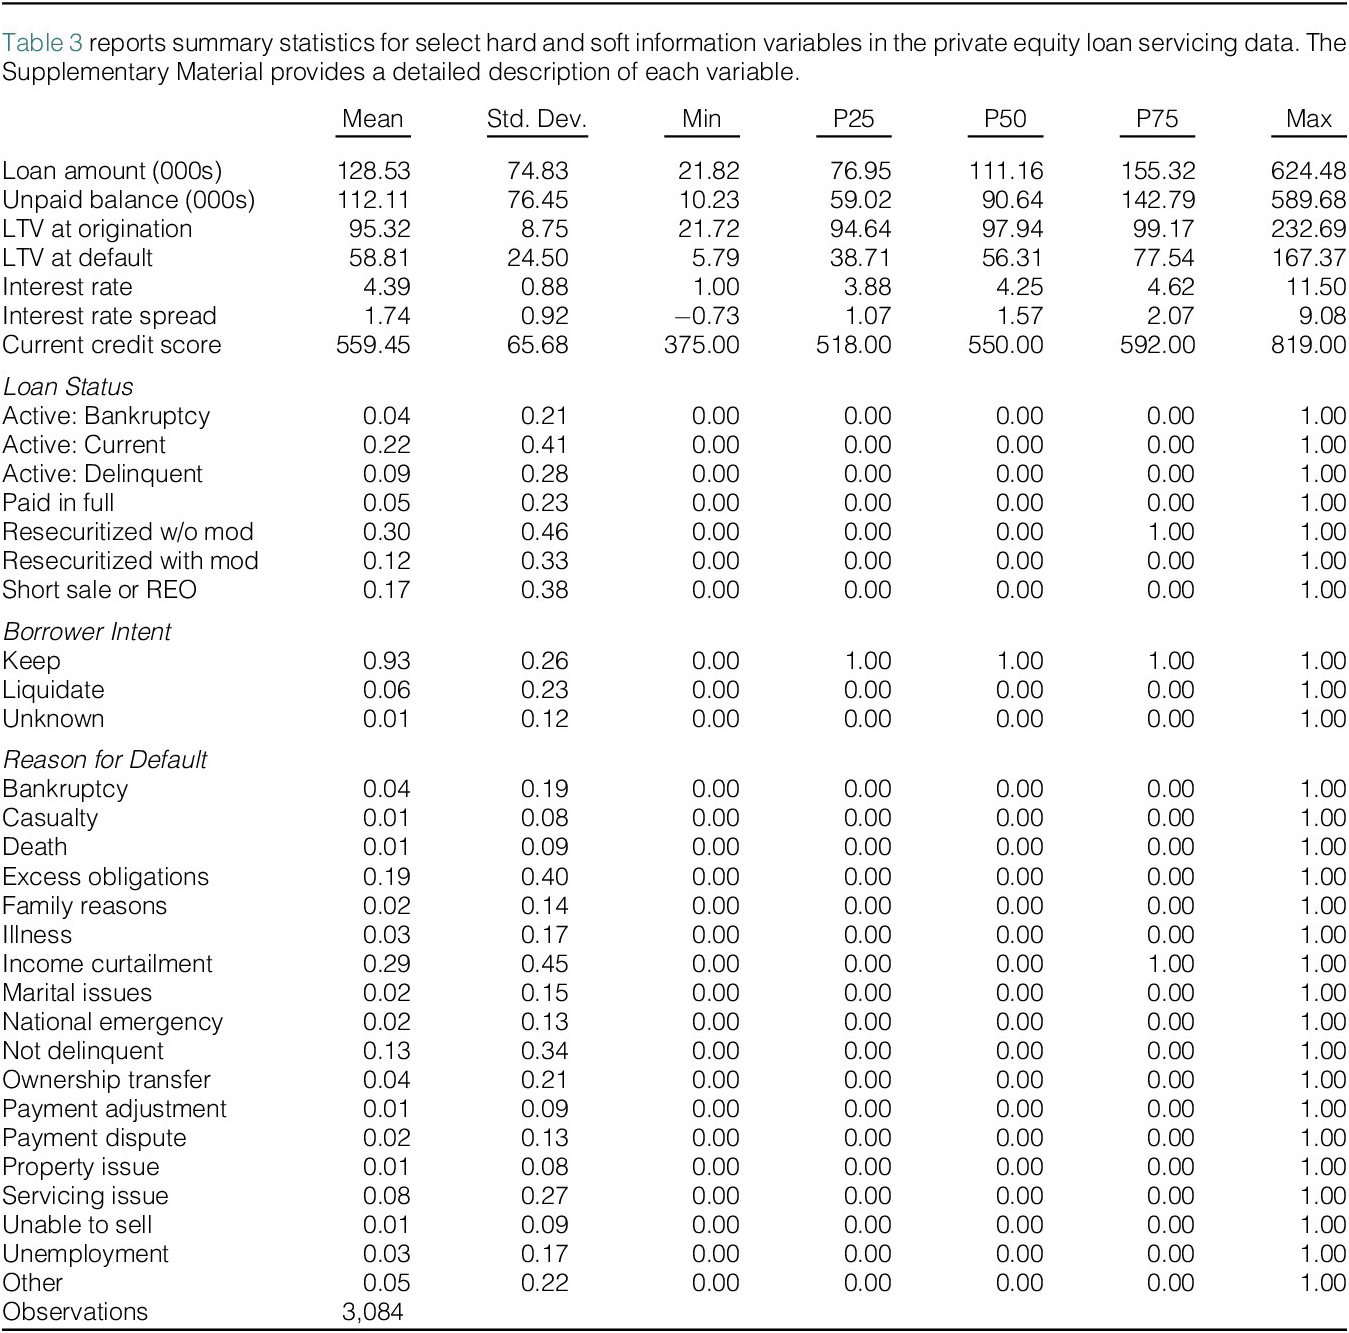
Table 3 reports summary statistics for the 3,084 early buyout loans. The average loan amount at origination ($128.53K) and unpaid balance at delinquency ($112.11K) are both considerably lower than the seriously delinquent loan sample in Table 1 ($180.01K and $169.33K, respectively). The early buyout loan subsample in Table 3 also has a lower average LTV (58.81%) and interest rate spread (1.74%) at default than the seriously delinquent loan sample in Table 1 (77.40% and 2.73%, respectively). However, the average LTV at origination is comparable in the two data sets (95.32% vs. 95.15%). The lower average interest rate spread is not surprising for two reasons. First, GNMA issuers likely keep loans with higher interest rate spreads for themselves. Second, the private equity firm specializes in difficult loan workouts. The private equity firm’s business model is to purchase difficult loans at a discount, so they are less concerned with interest rate spreads.
Table 3 Private Equity Data Summary Statistics

The loan status section of Table 3 identifies whether the loan is still active in the private equity portfolio or was liquidated as of December 2020. The borrower intent and reason for default sections of Table 3 summarize the soft information collected during the delinquent loan servicing process. We extract these two pieces of soft information from over 1.16 million unique text-based servicing logs for the 3,084 loans. Section IV describes how issuers acquire the soft information and tests whether it can be used to identify seriously delinquent loans that are more likely to reperform.
III. Adverse Selection in Early Buyouts
We hypothesize that GNMA issuers make early buyout decisions to maximize their earnings at MBS investors’ expense. Issuers can maximize their earnings by quickly buying out seriously delinquent loans with high interest rate spreads that they expect to reperform before the loans self-cure in their MBS pool. This section tests each element of this hypothesis: interest rate spreads, reperformance, and timing.
A. Interest Rate Spreads
We begin our analysis by examining the relationship between GNMA issuers’ early buyout decisions and interest rate spreads. We focus on interest rate spreads because they directly measure the potential revenue GNMA issuers can generate by performing an early buyout and getting a seriously delinquent loan to reperform. We estimate an ordinary least squares (OLS) specification that takes the following form:
 $$ \mathit{\Pr}\left({EarlyBuyout}_{nt}=1|{Default}_{nt}\right)={RateSpread}_{nt}\beta +{X}_n\alpha +{Z}_{nt}\gamma +{\delta}_{ist}+\varepsilon $$
The dependent variable, $ {EarlyBuyout}_{nt} $
, is an indicator variable for loan n that defaults at time t that takes the value of 1 if the issuer performs an early buyout (loan outcome = 2) within 12 months, and 0 otherwise.Footnote
9 We condition the dependent variable on default because issuers can only buy out seriously delinquent loans. The primary variable of interest,
$ {EarlyBuyout}_{nt} $
, is an indicator variable for loan n that defaults at time t that takes the value of 1 if the issuer performs an early buyout (loan outcome = 2) within 12 months, and 0 otherwise.Footnote
9 We condition the dependent variable on default because issuers can only buy out seriously delinquent loans. The primary variable of interest, $ {RateSpread}_{nt} $
, measures the difference between the loan’s contract rate and the 10-year Treasury Constant Maturity Rate at the time of the default. In this specification,
$ {RateSpread}_{nt} $
, measures the difference between the loan’s contract rate and the 10-year Treasury Constant Maturity Rate at the time of the default. In this specification, $ \beta $
measures the impact of the interest rate spread on an issuer’s decision to perform an early buyout.
$ \beta $
measures the impact of the interest rate spread on an issuer’s decision to perform an early buyout. $ {X}_n $
is a vector of time-invariant loan and borrower characteristics, such as credit score and issue type, that are collected and reported at issuance.
$ {X}_n $
is a vector of time-invariant loan and borrower characteristics, such as credit score and issue type, that are collected and reported at issuance. $ {Z}_{nt} $
is a vector of time-varying loan characteristics that include the log unpaid principal balance and current loan-to-value (LTV) ratio at the time of default.
$ {Z}_{nt} $
is a vector of time-varying loan characteristics that include the log unpaid principal balance and current loan-to-value (LTV) ratio at the time of default. $ {\delta}_{ist} $
is a multiplicatively separable fixed effect for the issuer of the loan (
$ {\delta}_{ist} $
is a multiplicatively separable fixed effect for the issuer of the loan ( $ i $
), the state in which the house is located (
$ i $
), the state in which the house is located ( $ s $
), and month and calendar year (
$ s $
), and month and calendar year ( $ t $
) in which the loan is first seriously delinquent. In subsequent regressions, we include issuer-by-pool-by-month-by-year fixed effects. Additional results in the Supplementary Material show that our findings are robust to alternative fixed effects.
$ t $
) in which the loan is first seriously delinquent. In subsequent regressions, we include issuer-by-pool-by-month-by-year fixed effects. Additional results in the Supplementary Material show that our findings are robust to alternative fixed effects.
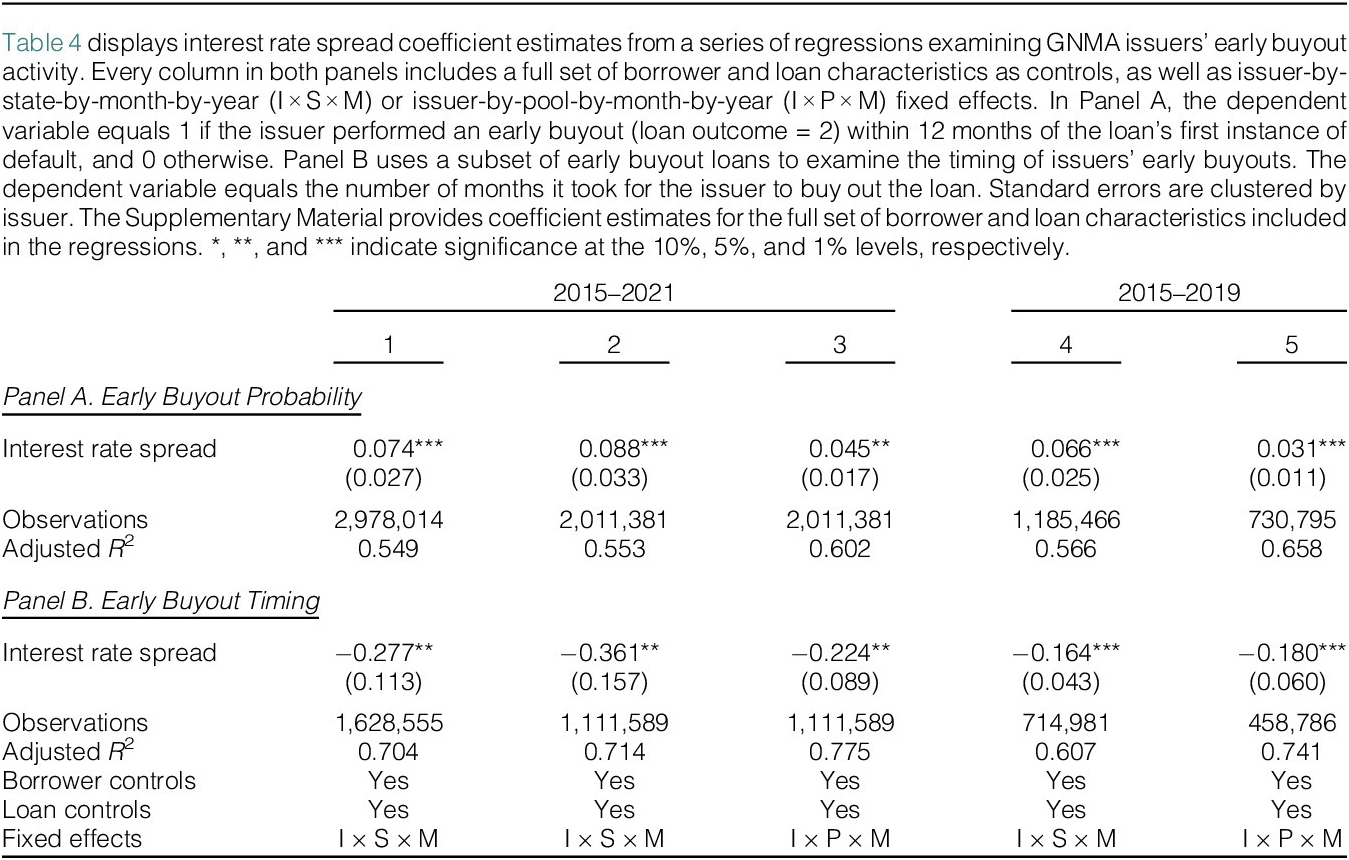
Panel A of Table 4 presents our main results for the full sample of seriously delinquent loans using a 12-month post-default window. The results highlight the effect of interest rate spreads at the time of default on issuers’ early buyout decisions. The Supplementary Material reports the complete set of coefficient estimates. Robustness checks in the Supplementary Material also show our findings are not sensitive to the length of the post-default window employed.
Table 4 Probability and Timing of Early Buyouts

The interest rate spread coefficient estimates in Panel A of Table 4 are consistently positive and statistically significant. This suggests, conditional on default, that GNMA issuers are more likely to perform an early buyout on loans with higher interest rate spreads. A 1 percentage point (or roughly 1-standard-deviation) increase in interest rate spread increases the probability of an early buyout by 7.4 percentage points in column 1 of Panel A. This effect is very significant, both statistically and economically.
GNMA offers two distinct single-family MBS programs: GNMA I and GNMA II. GNMA I MBS (issue type X) are single-issuer securities where each mortgage in the pool must have the same fixed interest rate. GNMA II MBS includes “custom” single-issuer securities (issue type C) and multi-issuer securities (issue type M). Columns 2 and 3 restrict the full sample of seriously delinquent loans to multi-issuer GNMA II MBS pools that permit interest rates to vary by as much as 50 basis points. Column 2 includes the same issuer-by-state-by-month-by-year (I $ \times $
S
$ \times $
S $ \times $
M) fixed effects as the preceding column. Whereas column 3 includes issuer-by-pool-by-month-by-year (I
$ \times $
M) fixed effects as the preceding column. Whereas column 3 includes issuer-by-pool-by-month-by-year (I $ \times $
P
$ \times $
P $ \times $
M) fixed effects that allow us to isolate the effect of interest rate spreads on early buyout decisions by the same issuer within the same pool at exactly the same time. The magnitude of the interest rate spread coefficient increases in column 2 of Panel A. A 1 percentage point increase in interest rate spread increases the probability of an early buyout by 8.8 percentage points.
$ \times $
M) fixed effects that allow us to isolate the effect of interest rate spreads on early buyout decisions by the same issuer within the same pool at exactly the same time. The magnitude of the interest rate spread coefficient increases in column 2 of Panel A. A 1 percentage point increase in interest rate spread increases the probability of an early buyout by 8.8 percentage points.
The interest rate spread coefficient estimate in column 3 remains positive and statistically significant. This finding suggests that when two or more loans become delinquent at the same time within the same pool, issuers are more likely to buy out loans with higher interest rate spreads.Footnote 10 A 1-standard-deviation increase in within pool interest rate spread increases the probability of an early buyout by the same issuer within the same pool by 4.5 percentage points. Although the magnitude of the coefficient estimate decreased relative to our preferred specifications, it is important to note that the specification in column 3 artificially separates pool-level interest rate spreads from individual loan-level interest rate spreads.Footnote 11 GNMA II MBS only allows interest rates to vary by as much as 50 basis points in each pool, so loans in a pool have similar pool-level interest rate spreads. Accordingly, the fixed effect in column 3 captures the impact of pool-level interest rate spreads, and the interest rate spread reflects each loan’s residual interest rate spread after separating out the pool-level interest rate spread.
Columns 4 and 5 of Panel A in Table 4 are identical to columns 1 and 3, respectively, except that they use a subsample of loans that became seriously delinquent from January 2015 through February 2019. We restrict both the front-end and back-end of this subsample to address the potential impact of the COVID-19 pandemic and include a previous missed payment control variable that identifies whether borrowers missed more than three payments in the 12 months leading up to default. The interest rate spread coefficient estimates in columns 4 and 5 are positive and statistically significant, indicating that issuers’ early buyout behavior was similar before the onset of the pandemic.
We examine the nonlinear relationship between early buyouts and interest rate spreads by sorting the seriously delinquent loan subsample into 25 basis point (bp) wide bins. Very few seriously delinquent loans have interest rate spreads below zero in the data, so we include them in the 0 bp bin. Similarly, interest rate spreads greater than 6 are included in the 600 bp bin. We modify equation (1) to include the interest rate spread bins as follows:
 $$ \mathit{\Pr}\left({EarlyBuyout}_{nt}=1|{Default}_{nt}\right)={\beta}_{spreadbin}\mathbf{1}{(spreadbin)}_{nt}+{X}_n\alpha +{Z}_{nt}\gamma +{\delta}_{ist}+\varepsilon $$
where $ 1{(spreadbin)}_{nt} $
is a dummy for the interest rate spread bin of loan
$ 1{(spreadbin)}_{nt} $
is a dummy for the interest rate spread bin of loan $ n $
at the time of default
$ n $
at the time of default $ t $
. The remaining variables in equation (2) are the same as in equation (1).
$ t $
. The remaining variables in equation (2) are the same as in equation (1).
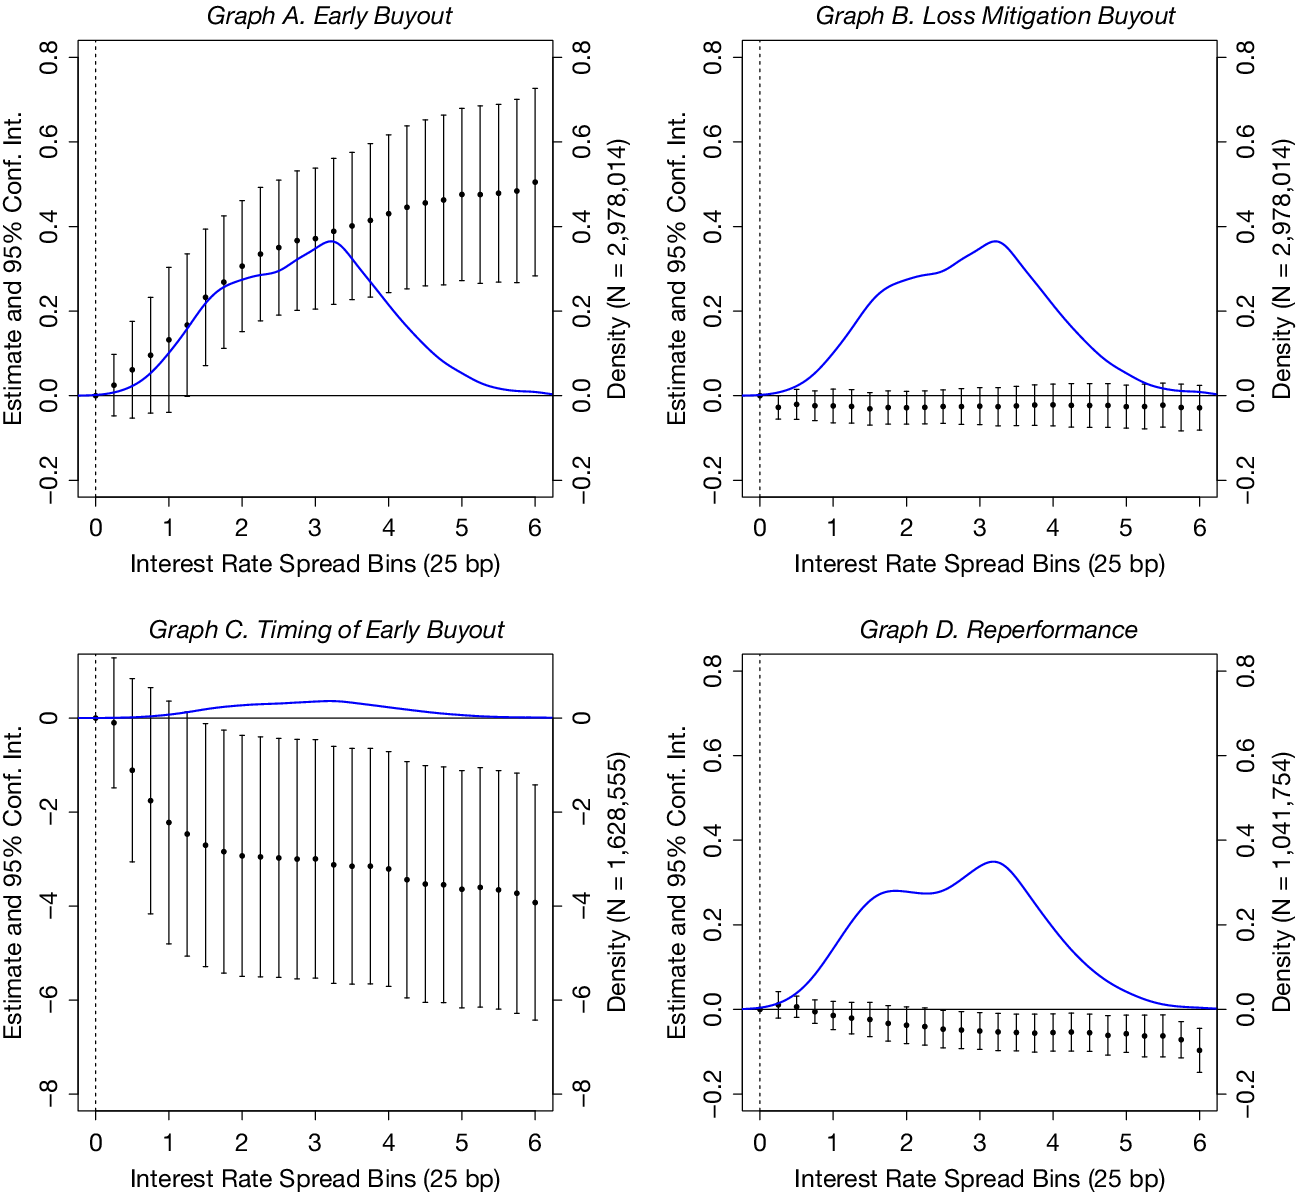
Graph A of Figure 2 displays the distribution of the interest rate spread bins and the resulting binned coefficient estimates. The coefficient estimates are initially low and not statistically different than the 0 bp bin; then they rise rapidly for interest rate spreads above 125 bp. This implies that issuers’ early buyout decisions are highly sensitive to interest rate spreads. When interest rate spreads are lower, issuers are less likely to buy out seriously delinquent loans because they offer less profit potential. However, as interest rate spreads and the corresponding potential profit associated with an early buyout increases, issuers are more likely to perform an early buyout.

Figure 2 Interest Rate Spread Bins
Figure 2 displays point estimates and 95% confidence intervals for several versions of equation (2) that use 25 basis point (bp) interest rate spread bin dummies to examine nonlinearities in issuers’ buyout activity. Interest rate spreads greater than 6 are included in the 600 bp bin. Interest rate spreads less than zero are included in the 0 bp bin. Graph A examines the probability of an early buyout (loan outcome = 2). Graph B examines the probability of a loss mitigation buyout (loan outcome = 4). Graph C examines the timing (in months) of the early buyout conditional on an early buyout. Graph D examines the probability a loan reperforms (loan outcome = 7) conditional on it not being an early buyout (loan outcome = 2) or loss mitigation buyout (loan outcome = 4). Standard errors are clustered by issuer.
GNMA issuers must keep their delinquency levels below GNMA-specified thresholds (e.g., less than 5% of loans can be 90 days delinquent) to avoid penalties and maintain good standing. In the Supplementary Material, we test the alternative hypothesis that GNMA issuers perform early buyouts to manage their delinquency levels. We rule out this explanation by examining the early buyout activity of issuers with different levels of serious delinquency. Most (over 75%) seriously delinquent loans are held by issuers with low levels of serious delinquency who are not at risk of exceeding their GNMA delinquency threshold. We find these issuers with low levels of serious delinquency are just as likely to perform an early buyout as issuers with high levels of serious delinquency. This finding indicates that the GNMA delinquency thresholds are not the primary driver of issuers’ early buyout decisions, further supporting our claim of adverse selection.
1. Loss Mitigation Buyouts
GNMA issuers also buy out seriously delinquent loans to perform loss mitigation. A buyout is necessary because issuers cannot modify a loan’s payment amount or duration while it remains in a GNMA MBS pool. Panel A of Table 2 shows that issuers buy out substantially fewer seriously delinquent loans to perform loss mitigation (loan outcome = 4) than to perform early buyouts (loan outcome = 2). We examine whether interest rate spreads are a key determinant of loss mitigation buyouts by changing the dependent variable in equation (2) from $ {EarlyBuyout}_{nt} $
to
$ {EarlyBuyout}_{nt} $
to $ {LossMitigation}_{nt} $
.
$ {LossMitigation}_{nt} $
. $ {LossMitigation}_{nt} $
is an indicator variable that takes the value of 1 if the issuer buys out loan
$ {LossMitigation}_{nt} $
is an indicator variable that takes the value of 1 if the issuer buys out loan $ n $
that defaults at time
$ n $
that defaults at time $ t $
to perform loss mitigation (loan outcome = 4) within 12 months, and 0 otherwise.
$ t $
to perform loss mitigation (loan outcome = 4) within 12 months, and 0 otherwise.
Graph B of Figure 2 displays point estimates and 95% confidence intervals from the nonlinear regression. The resulting binned interest rate spread coefficient estimates are negative and not statistically different than the 0 bp bin, even at the higher end of the interest rate spread distribution. Taken together with our earlier findings, this suggests issuers buy out loans with higher interest rate spreads when performing early buyouts but not loss mitigation buyouts, which supports our claim of adverse selection in GNMA issuers’ early buyout activity.
GNMA issuers are only required to report a loss mitigation buyout when a loan requires modification at the time of repurchase. However, some early buyout loans may later undergo loss mitigation to return to performing status, raising concerns about potential misclassification of removal reason codes. We believe this concern is limited for several reasons. First, as noted in Section III.A.1, GNMA actively monitors and verifies the accuracy of the reported removal reason codes. Second, Section IV demonstrates that issuers gather private information during the delinquent loan servicing process that provides insight into whether a loan will likely need modification. Because early buyouts are capital-intensive, issuers have little financial incentive to perform early buyouts on loans they expect will require future loss mitigation. Instead, they are more likely to use their limited capital and informational advantage to perform early buyouts on loans likely to self-cure. Lastly, as shown in Section III.D, we find 84.6% of resecuritized early buyout loans are not modified.
2. Access to Capital
We provide additional support for our claim of adverse selection by examining whether GNMA issuers’ early buyout activity is a function of their access to capital. Early buyouts are highly capital-intensive, as issuers must advance the full unpaid principal balance of the loan at the time of repurchase. This implies that issuers with less access to capital should perform fewer early buyouts. However, when issuers with less access to capital perform early buyouts, we expect them to be more selective in the loans they buy out. We test these conjectures by exploiting differences in the capital structures of non-depository shadow banks and traditional banks.Footnote 12
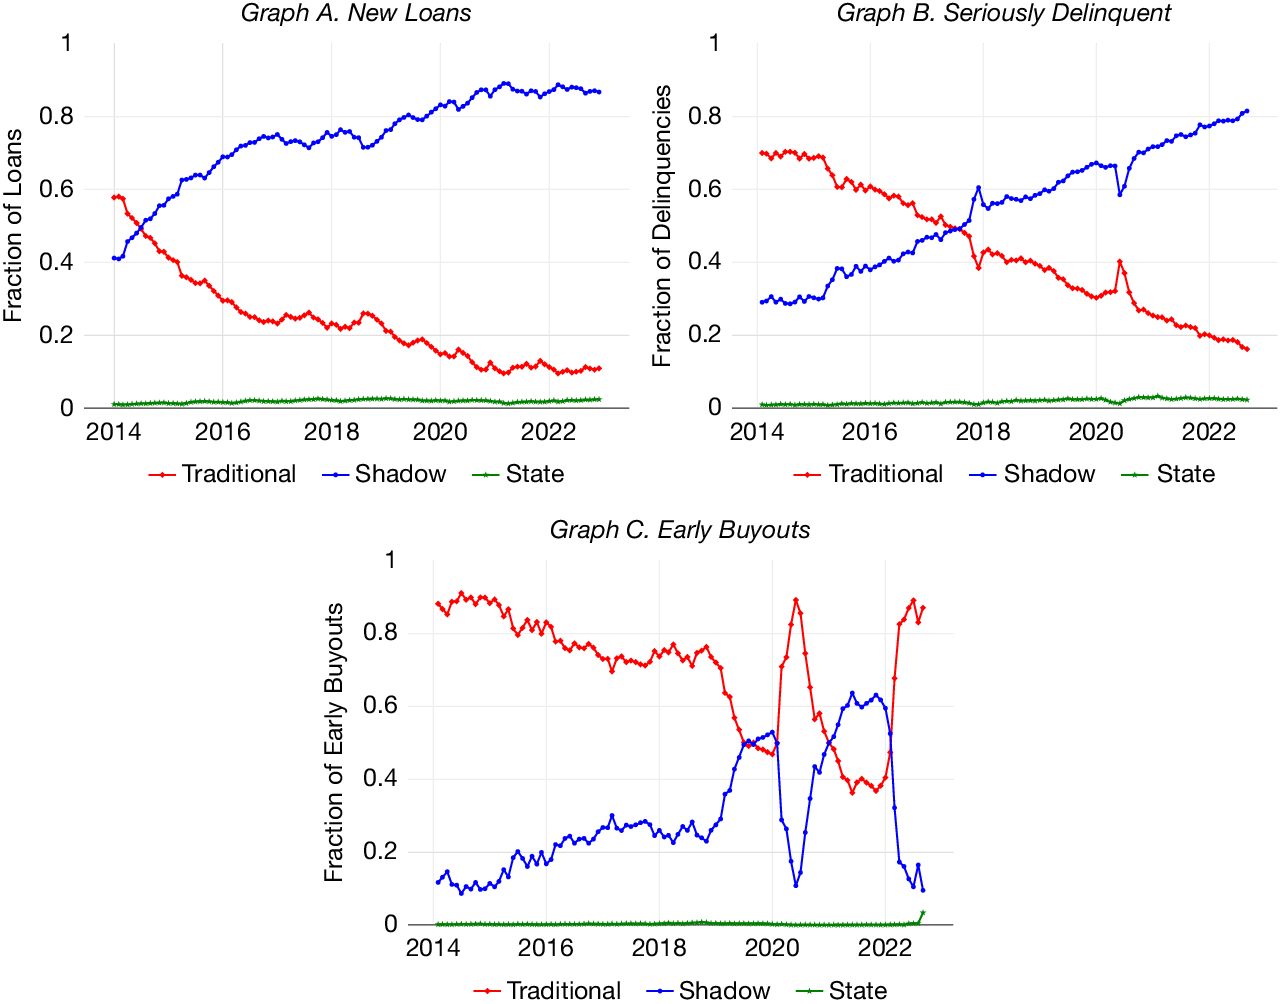
This comparison is of particular interest because Graph A of Figure 3 shows that shadow bank issuers’ share of GNMA loan issuances increased substantially, from 40% at the end of 2013 to over 80% in 2021. Graphs B and C of Figure 3 show that shadow banks’ share of seriously delinquent loans increased in tandem with their share of new issuances, but that their relative share of early buyouts lagged. Graph C also shows that traditional banks were able to quickly adapt and buy out a large fraction of loans placed in forbearance programs in 2020, which prompted GNMA to impose a temporary restriction on the resecuritization of early buyout loans in June 2020 to disincentivize forbearance-driven adverse selection.

Figure 3 GNMA Issuer Types
Graph A of Figure 3 plots the relative share of new loans entering GNMA MBS pools by issuer type. Graph B plots the relative share of seriously delinquent loans by issuer type. Seriously delinquent loans that are bought out early are not included in Graph B. Graph C plots the relative share of early buyouts by issuer type. The issuer types in each graph include traditional banks, shadow banks, and state financing authorities.
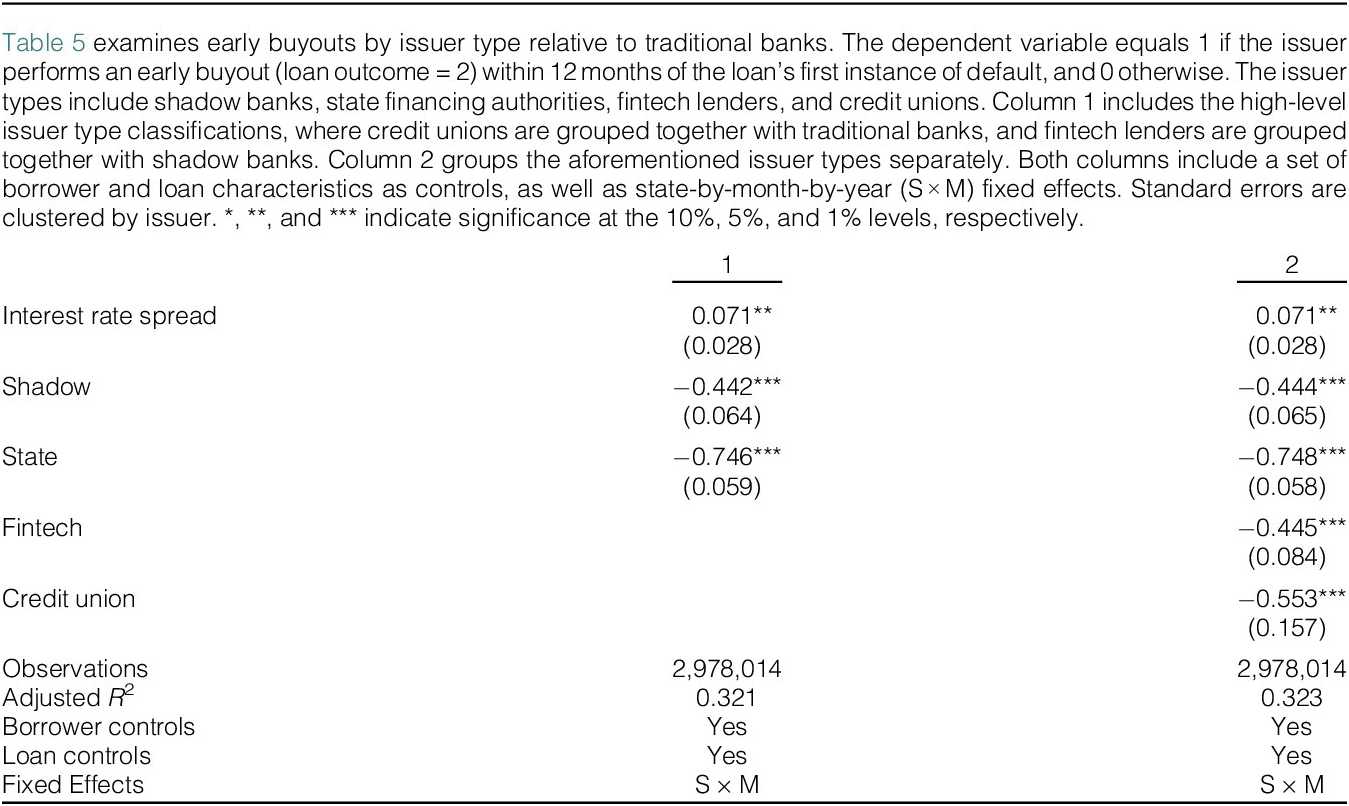
Table 5 examines the probability of an early buyout by issuer type. Both columns use a modified version of equation (1) that includes indicator variables for the issuer type. The issuer types include shadow banks, state financing authorities, fintech lenders, and credit unions—with traditional banks being the holdout. Column 1 of Table 5 includes the high-level issuer type classifications where credit unions are grouped together with traditional banks, and fintech lenders are grouped together with shadow banks. Column 2 groups the aforementioned issuer types separately. Every column includes a full set of borrower and loan characteristics as controls as well as state-by-month-by-year (S $ \times $
M) fixed effects.
$ \times $
M) fixed effects.
Table 5 Early Buyouts by Issuer Type

The coefficient estimates in columns 1 and 2 of Table 5 reaffirm our earlier finding that issuers are more likely to perform early buyouts on loans with higher interest rate spreads. The results also highlight significant differences in early buyout activity across issuer types. The coefficient estimates in columns 1 and 2 indicate that shadow bank issuers buy out seriously delinquent loans at a 44% lower rate than traditional bank issuers. We suspect that shadow banks’ lack of depository funds requires them to be more selective when deciding which seriously delinquent loans to buy out early.
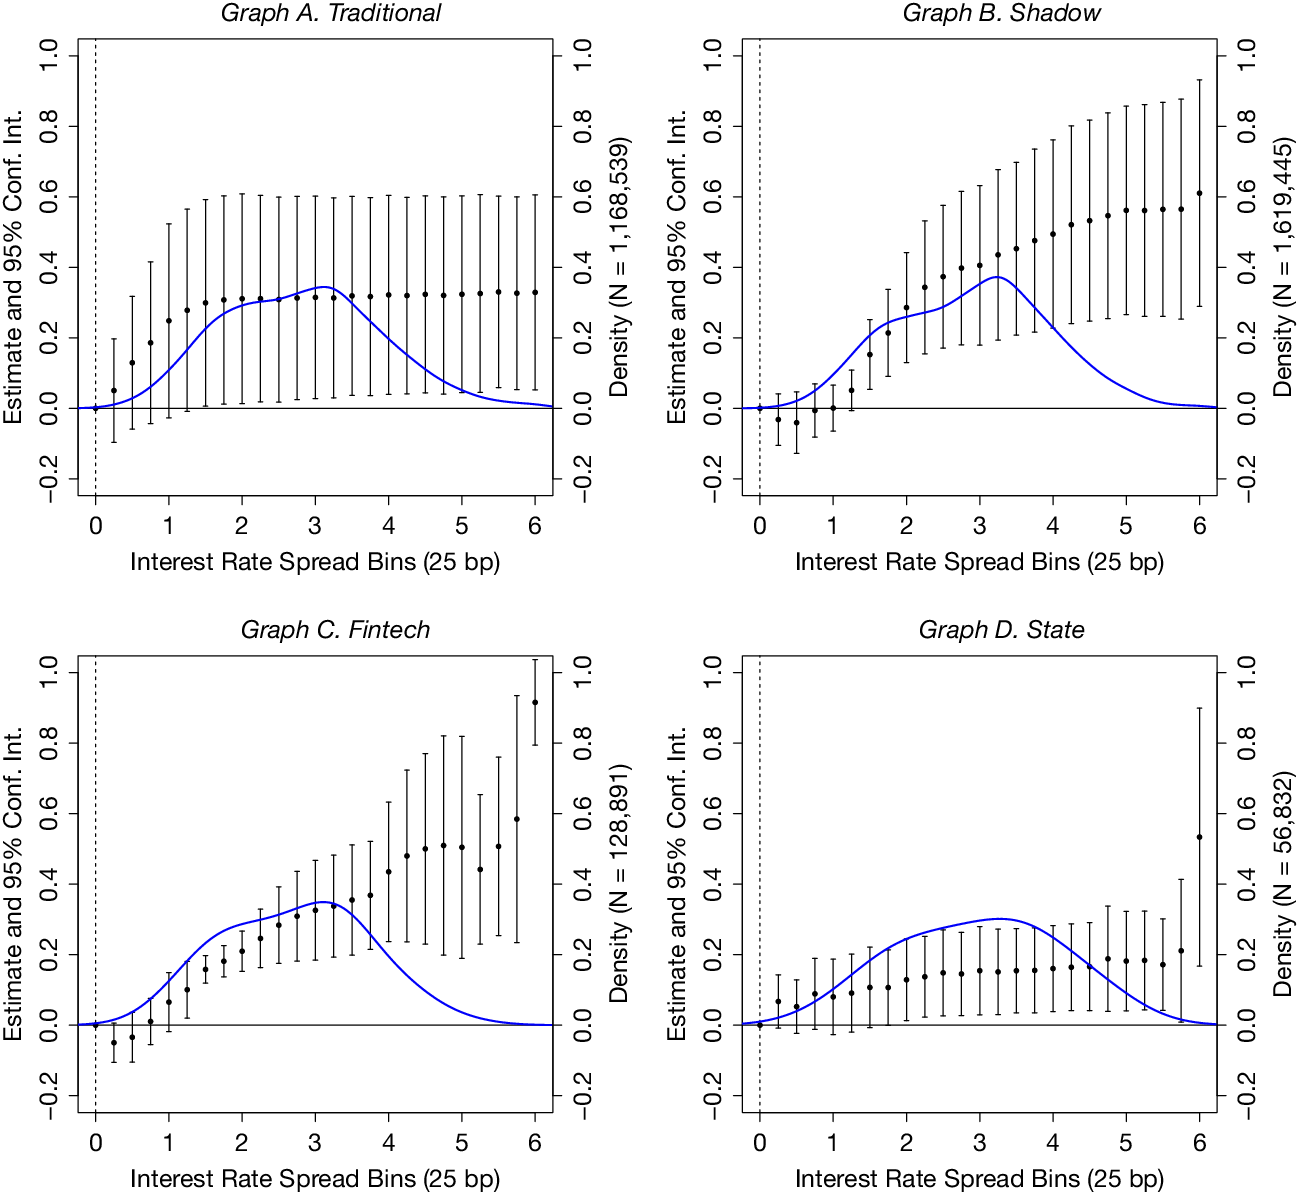
We test our conjecture by examining the nonlinear relationship between early buyouts and interest rate spreads by issuer type. We rerun the regression in equation (2) separately for a subsample of traditional bank loans (Graph A of Figure 4), shadow bank loans (Graph B), fintech loans (Graph C), and state financing authority loans (Graph D). There are not enough seriously delinquent credit union loans to run a similar subsample analysis. Each graph in Figure 4 displays the distribution of the interest rate spread bins and the resulting binned coefficient estimates.

Figure 4 Early Buyouts by Issuer Type
Figure 4 displays point estimates and 95% confidence intervals for several modified versions of equation (2) that use 25 basis point (bp) interest rate spread bin dummies to examine early buyout activity by issuer type. Interest rate spreads greater than 6 are included in the 600 bp bin. Interest rate spreads less than zero are included in the 0 bp bin. Graphs A through D examine the effect of interest rate spreads on early buyouts within 12 months of default (loan outcome = 2) separately for traditional banks, shadow banks, fintech lenders, and state financing authorities. Standard errors are clustered by issuer.
The four graphs in Figure 4 display a similar pattern. The coefficient estimates are initially low and not statistically different than the 0 bp bin; then they rise as interest rate spreads increase. However, the rate at which the coefficient estimates rise and the magnitude to which they rise vary by issuer type. Although the regression results in Table 5 indicate that shadow bank and fintech issuers are less likely to perform an early buyout, the plots in Figure 4 indicate that they are more sensitive to interest rate spreads. These findings support our conjecture that issuers with less access to capital will perform fewer early buyouts but will be more selective when they perform early buyouts.
B. Timing of Early Buyouts
The higher potential profit associated with higher interest rate spreads likely affects not only the probability that an issuer will perform an early buyout but also the timing of the early buyout. Time is of the essence because seriously delinquent loans are no longer eligible for an early buyout when they self-cure. Accordingly, issuers have a strong financial incentive to quickly buy out high interest rate spread loans before they reperform. The descriptive statistics in Table 2 support this assertion by showing that most early buyouts occur within 3 months of default.
We formally test whether interest rate spreads affect the timing of early buyouts using the following specification:
 $$ {TimeToEarlyBuyout}_{nt}={RateSpread}_{nt}\beta +{X}_n\alpha +{Z}_{nt}\gamma +{\delta}_{ist}+\varepsilon $$
The dependent variable, $ {TimeToEarlyBuyout}_{nt} $
, equals the number of months it takes an issuer to perform an early buyout on loan n that defaults at time t conditional on an early buyout occurring. The
$ {TimeToEarlyBuyout}_{nt} $
, equals the number of months it takes an issuer to perform an early buyout on loan n that defaults at time t conditional on an early buyout occurring. The $ {TimeToEarlyBuyout}_{nt} $
variable ranges from 0 to 12. The variable equals 0 if the issuer performs an early buyout the same month the loan defaults and equals 12 if the issuer performs an early buyout in the final month of the 12-month trailing window. The independent variables in equation (3) are identical to equation (1).
$ {TimeToEarlyBuyout}_{nt} $
variable ranges from 0 to 12. The variable equals 0 if the issuer performs an early buyout the same month the loan defaults and equals 12 if the issuer performs an early buyout in the final month of the 12-month trailing window. The independent variables in equation (3) are identical to equation (1).
Panel B of Table 4 displays the coefficient estimates from equation (3) using the full sample of early buyouts in columns 1 through 3 and a pre-pandemic subsample in columns 4 and 5. The interest rate spread coefficient estimates in Panel B of Table 4 are consistently negative and statistically significant. This indicates that GNMA issuers buy out loans with higher interest rate spreads faster than loans with lower interest rate spreads. A 1 percentage point increase in interest rate spread reduces the timing of the early buyout by approximately .22 to .36 months in the full sample and .16 to .18 months in the pre-pandemic subsample.
Graph C of Figure 2 displays point estimates and 95% confidence intervals for a modified version of equation (3) that includes 25 bp interest rate spread bin dummies in place of the continuous $ {RateSpread}_{nt} $
variable. Initially, the coefficient estimates are not statistically different than the 0 bp bin. Then, they become statistically different than 0 from the 150 bp bin through the 600 bp bin. Graph C shows that issuers buy out loans with higher interest rate spreads much faster than loans with interest rate spreads of zero.
$ {RateSpread}_{nt} $
variable. Initially, the coefficient estimates are not statistically different than the 0 bp bin. Then, they become statistically different than 0 from the 150 bp bin through the 600 bp bin. Graph C shows that issuers buy out loans with higher interest rate spreads much faster than loans with interest rate spreads of zero.
C. Reperformance
GNMA issuers maximize their earnings by buying out loans they expect to reperform and leaving seriously delinquent loans they do not expect to reperform in GNMA MBS pools. Table 2 highlights the fact that a relatively small fraction of seriously delinquent loans reperform. In Panel A, only 12.35% of the seriously delinquent loans reperform (6.23% self-cure and 6.12% have a mortgagor payoff). Focusing on the subset of seriously delinquent loans that were not bought out early (i.e., 45.31% of the loans), this implies a self-cure rate of 13.7% and a reperformance rate of 27.3%. The relatively small fraction of seriously delinquent loans that reperform in GNMA MBS pools suggests that issuers perform early buyouts on loans that are more likely to reperform.
Ideally, we would compare the reperformance rates of the non-early buyout loans to early buyout loans in the GNMA data. However, this comparison is complicated by the fact that the early buyout process removes loans from GNMA pools. Once removed, the loan’s performance is no longer visible to researchers. Furthermore, when an early buyout loan is resecuritized into a new GNMA pool, it is assigned a new “Pool ID” and “Disclosure Sequence Number” which serves as the loan’s unique “Loan ID.” In other words, GNMA does not flag or provide a direct crosswalk identifying early buyout loans that are resecuritized. We address this obstacle in three ways.
First, we compare the non-early buyout reperformance rate above to the private equity data in Table 3. The summary statistics in Table 3 indicate that 69.8% of the early buyout loans in the private equity data reperform. This reperformance rate is high given that the sample contains early buyout loans sold to a private equity firm specializing in difficult loans. Moreover, the 69.8% early buyout loan reperformance rate in the private equity data is substantially higher than the 27.3% non-early buyout loan reperformance rate in Table 2.
Second, we develop a novel automated matching technique that links early buyout Loan IDs to their corresponding resecuritized Loan ID. Our automated procedure relies on matching early buyout loans based on agency type (FHA, PIH, RD, or VA), state, first payment date, loan origination amount, and the timing of the early buyout relative to when the loan is resecuritized. The procedure is fairly conservative in that the matching process requires exact matches on several fields, one of which is continuous. The Supplementary Material provides a step-by-step overview of our automated matching process. We match 41.9% of the early buyout loans to a newly resecuritized Loan ID in the GNMA data.
The 41.9% resecuritization rate only captures a portion of the early buyout loan reperformance rate. It does not include reperforming early buyout loans that issuers decide to keep as portfolio loans, mortgagors pay off, or those that we do not successfully match. Accordingly, the early buyout loan reperformance rate is almost certainly greater than 41.9%. Despite these limitations, the 41.9% early buyout loan match rate is still substantially higher than the 27.3% non-early buyout loan reperformance rate in Table 2.
Third, although we cannot directly test whether issuers buy out seriously delinquent loans that are more likely to reperform, we can test whether the higher interest rate spread loans they do not buy out are less likely to reperform. We assume that issuers’ early buyout decisions are a function of loans’ interest rate spread and their likelihood of reperformance. As interest rate spreads increase, the required likelihood of reperformance necessary to perform an early buyout decreases. Our underlying assumption is that if issuers make early buyout decisions based on the likelihood of reperformance, then the higher interest rate spread loans they do not buy out should be less likely to reperform than the lower interest rate spread loans they do not buy out. Graph D of Figure 2 displays point estimates and 95% confidence intervals for a modified version of equation (2) where the dependent variable equals 1 if the seriously delinquent loan reperforms, and 0 otherwise. We estimate the regression using seriously delinquent loans that are not an early buyout (loan outcome = 2) or loss mitigation buyout (loan outcome = 4).
The binned coefficient estimates in Graph D of Figure 2 gradually decrease as the interest rate spread bins increase. Initially, the coefficient estimates are not statistically different than the 0 bp bin. Then, they become statistically different than 0 from the 250 bp bin through the 600 bp bin. The Supplementary Material presents similar results using a continuous variable in place of the interest rate spread bins. Conditional on the seriously delinquent loan not being bought out, the results indicate that a 1 percentage point increase in interest rate spread decreases the probability a loan will reperform by 1 percentage point. A higher interest rate at the origination time may imply a higher non-performance risk. We emphasize, however, that our interest rate spread variable measures the difference between the contract rate and the market rate at the time of default, not origination. Similar to the main results, the regression also includes the origination rate spread variable to control for the difference between the contract rate and the market rate at the time of origination.
Taken together with the higher reperformance rates above, Graph D of Figure 2 suggests GNMA issuers can identify and perform early buyouts on seriously delinquent loans that are more likely to reperform. Section IV illustrates how GNMA issuers gain access to private soft information they can use to identify loans that are more likely to reperform.
D. Self-Cure Versus Issuer Effort
Seriously delinquent loans with higher interest rate spreads present greater profit potential relative to those with lower spreads. The results in the preceding sections indicate issuers are certainly aware of the greater profit potential and act swiftly to buy out high interest rate spread loans before they self-cure, which would render them ineligible for early buyout. We interpret issuers’ early buyout behavior as evidence of adverse selection. However, such an interpretation is not unambiguous.
Importantly, issuers must “cure” delinquent loans before they can be resecuritized. It is plausible that a substantial proportion of reperforming loans that were resecuritized did not self-cure, instead requiring issuers to undertake costly remediation efforts—such as restructuring, renegotiation, or other loss mitigation strategies—to restore the loans to performing status. Under this scenario, the additional revenue generated through early buyouts may serve as compensation for the issuers’ remediation efforts and associated costs, rather than reflecting profits derived from adverse selection. In which case, MBS investors are not necessarily harmed.
We investigate this alternative explanation by examining whether the resecuritized early buyout loans—identified through our automated matching process—retained their original terms at the time of resecuritization. If the loan was not modified, we classify it as self-cured; if the terms differed, issuer remediation efforts cannot be ruled out. We compare the loan’s interest rate, maturity date, and unpaid principal balance. We consider a loan modified if its interest rate changed, its maturity date changed, or its unpaid principal balance decreased by more than 10%.Footnote 13 Our analysis reveals that 84.6% of the resecuritized early buyout loans were not modified, indicating a self-cure rate that is substantially higher than the 13.7% observed for non-early buyout loans in Panel A of Table 2.Footnote 14
IV. Private Soft Information
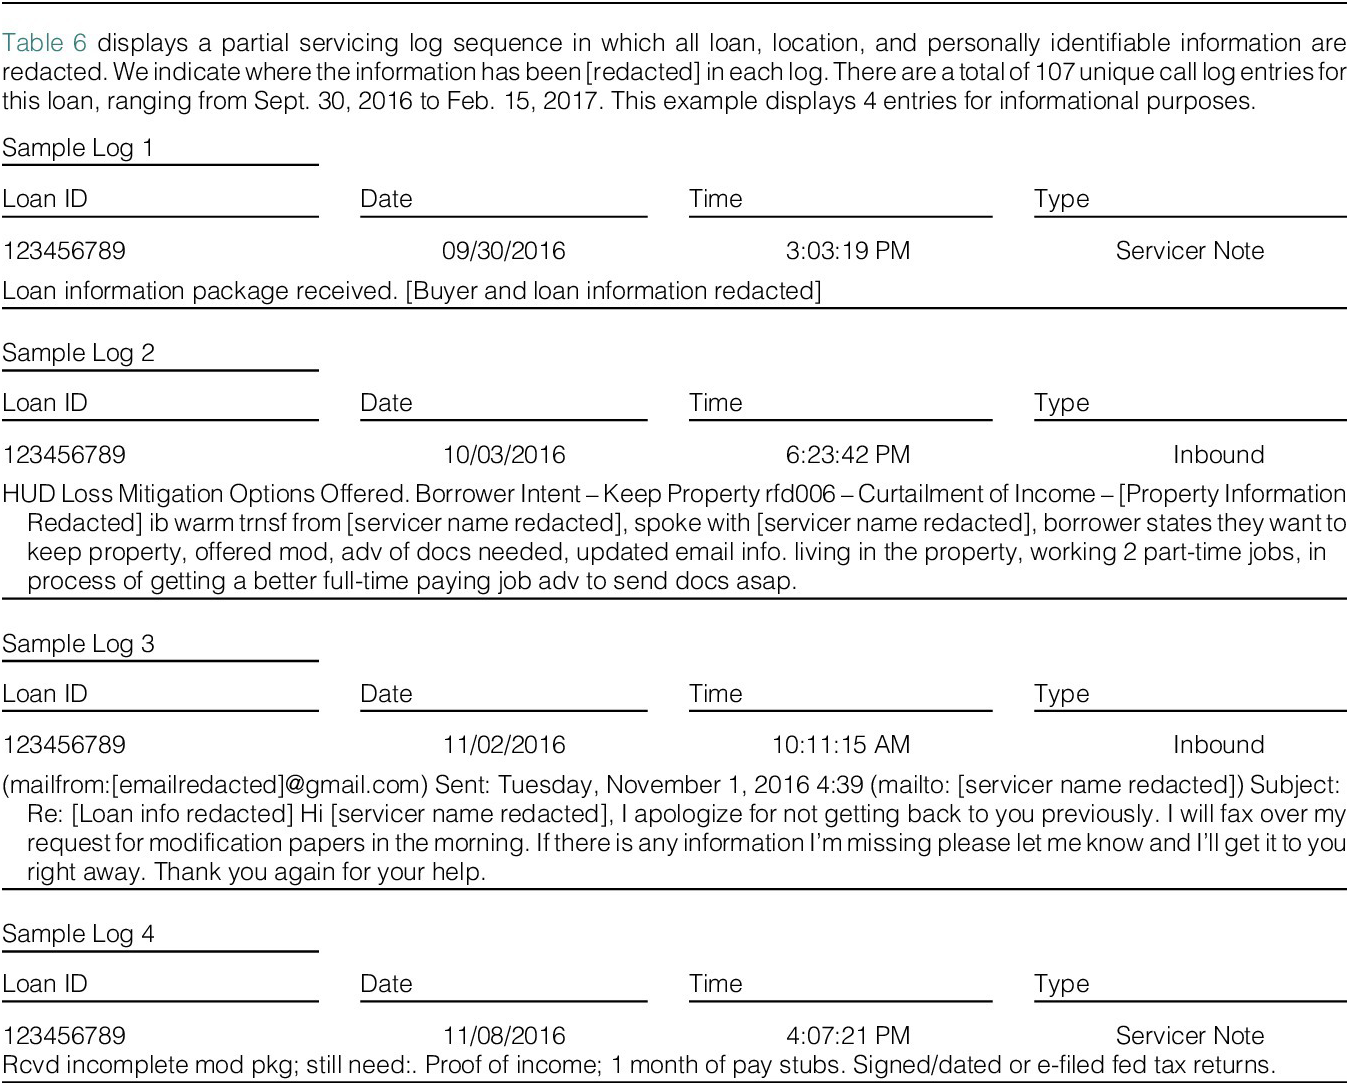
GNMA issuers gain access to private soft information during the delinquent loan servicing process. Issuers contact delinquent borrowers when they miss a mortgage payment. Issuers document their communication efforts and discussions with delinquent borrowers in servicer call logs. Table 6 presents a truncated servicing log sequence for 1 of the early buyout loans in the private equity data. The servicing log sequence displays 4 of the initial 107 servicing logs for the loan over a 5-month period. All loan, location, servicer, and personally identifiable information are [redacted].
Table 6 Servicing Log Sequence Example

Sample Log 1 in Table 6 is the first entry in the sequence. It provides information about the loan and borrower that has been redacted. However, much of the information in the log is already codified and available in the hard information. Sample Log 2 is the second entry in the servicing log sequence. It captures the first successful contact between the borrower and the servicer. In contrast to the previous log, Sample Log 2 contains soft information that has not already been captured in the hard information. For example, Sample Log 2 indicates the borrower is intent on keeping the property, and their income is curtailed. Similar information is available in a fairly structured format for most of the 3,084 loans. Sample Log 2 also contains a wealth of soft information in unstructured text. For example, the text in Sample Log 2 indicates the borrower is living in the property and working two part-time jobs. Sample Log 2 also indicates the borrower is in the process of getting a full-time job with better pay. This soft information highlights the borrower’s conviction to reperform, ability to reperform, and improving prospects of reperforming. Sample Log 2 also indicates the servicer offered the borrower a loan modification.
Sample Logs 3 and 4 document the borrower’s navigation of the loan modification process. Approximately 1 month after the loan modification is offered, Sample Log 3 displays an email from the borrower stating they will fax their loan modification request the next day. Approximately 1 week later, the servicer enters a note indicating they received the loan modification request. However, the servicing log also notes the modification package is missing proof of income and tax returns. The truncated sequence of servicing logs in Table 6 provides a glance into the detailed soft information collected by GNMA issuers.
We use the structured text in Sample Log 2 to populate the borrower intent and reason for default fields in Table 3. We populate the fields using the first successful contact with the delinquent borrower. We focus on the first contact because it provides the best proxy for the soft information available to issuers when they perform early buyouts. The borrower intent fields identify whether the borrower wants to keep the property, liquidate the property, or their intent is unknown. As noted earlier, issuers have little financial incentive to buy out delinquent loans if the borrower is not intent on keeping the property because a short sale or REO liquidation is inevitable. Thus, it is not surprising that 93% of the borrowers in the early buyout loan subsample state that they want to keep their homes.
The bottom section of Table 3 identifies the borrower’s reason for default. The two most common reasons for default are income curtailment (29%) and excess financial obligations (19%). Other common reasons suggest the borrower had a temporary setback and is no longer delinquent (13%) or their default is due to a servicing issue (8%)—both of which are examples of easy profits via early buyouts for GNMA issuers. The Supplementary Material provides a detailed description of the remaining reason for default variables. Taken together, the borrower intent and reason for default variables represent soft information issuers can exploit to inform their early buyout decisions. Information asymmetry concerns arise because MBS investors do not have access to this soft information, even though it is ostensibly collected on their behalf as part of the delinquent loan servicing process.
Issuers’ ability to identify and buy out seriously delinquent loans that are more likely to reperform is predicated on the assumption that the soft information they collect during the loan servicing process has explanatory power. We examine how much variation in the probability that an early buyout loan will reperform is explained by standard borrower and loan characteristics (i.e., hard information) relative to regressions that include both hard and soft information. The baseline regression that includes only hard information takes the following form:
 $$ \mathit{\Pr}\left({Reperform}_{nt}=1|{EarlyBuyout}_{nt}=1\right)={H}_{nt}\alpha +S{\delta}_s+Y{\Psi}_t+\varepsilon $$
The dependent variable, $ {Reperform}_{nt} $
, is an indicator variable for early buyout loan n that defaults at time t that takes the value of 1 if the loan reperforms, and 0 otherwise. We consider a loan reperforming if its loan status is “Active: Current,” “Paid in full,” “Resecuritized w/o mod,” or “Resecuritized with mod” in Table 3.
$ {Reperform}_{nt} $
, is an indicator variable for early buyout loan n that defaults at time t that takes the value of 1 if the loan reperforms, and 0 otherwise. We consider a loan reperforming if its loan status is “Active: Current,” “Paid in full,” “Resecuritized w/o mod,” or “Resecuritized with mod” in Table 3. $ {H}_{nt} $
includes both time-invariant and time-varying loan and borrower characteristics representing the hard information in our regressions. Subsequent regressions include both hard and soft information. Equation (4) also includes fixed effects for the state where the house is located (S) and the calendar year in which the loan is first delinquent (Y). We estimate the regressions using the subsample of 3,084 early buyout loans in Table 3.
$ {H}_{nt} $
includes both time-invariant and time-varying loan and borrower characteristics representing the hard information in our regressions. Subsequent regressions include both hard and soft information. Equation (4) also includes fixed effects for the state where the house is located (S) and the calendar year in which the loan is first delinquent (Y). We estimate the regressions using the subsample of 3,084 early buyout loans in Table 3.
We evaluate the performance of the different regression models in two ways. We first use the $ Adjusted $ $ {R}^2 $
from the regressions to measure how much variation in the probability of reperformance is explained by soft information relative to regressions that include only hard information. Then, we plot receiver-operating characteristic (ROC) curves. ROC curves show the variation in the true positive rate (TPR) and the false positive rate (FPR) as we vary the probability threshold for declaring an early buyout observation to be reperforming. We also report the area under the curve (AUC) for each regression. The AUC is frequently used to summarize the information in an ROC curve (see, e.g., Bradley (Reference Bradley1997), Fuster, Goldsmith-Pinkham, Ramadorai, and Walther (Reference Fuster, Goldsmith-Pinkham, Ramadorai and Walther2022)).
$ {R}^2 $
from the regressions to measure how much variation in the probability of reperformance is explained by soft information relative to regressions that include only hard information. Then, we plot receiver-operating characteristic (ROC) curves. ROC curves show the variation in the true positive rate (TPR) and the false positive rate (FPR) as we vary the probability threshold for declaring an early buyout observation to be reperforming. We also report the area under the curve (AUC) for each regression. The AUC is frequently used to summarize the information in an ROC curve (see, e.g., Bradley (Reference Bradley1997), Fuster, Goldsmith-Pinkham, Ramadorai, and Walther (Reference Fuster, Goldsmith-Pinkham, Ramadorai and Walther2022)).
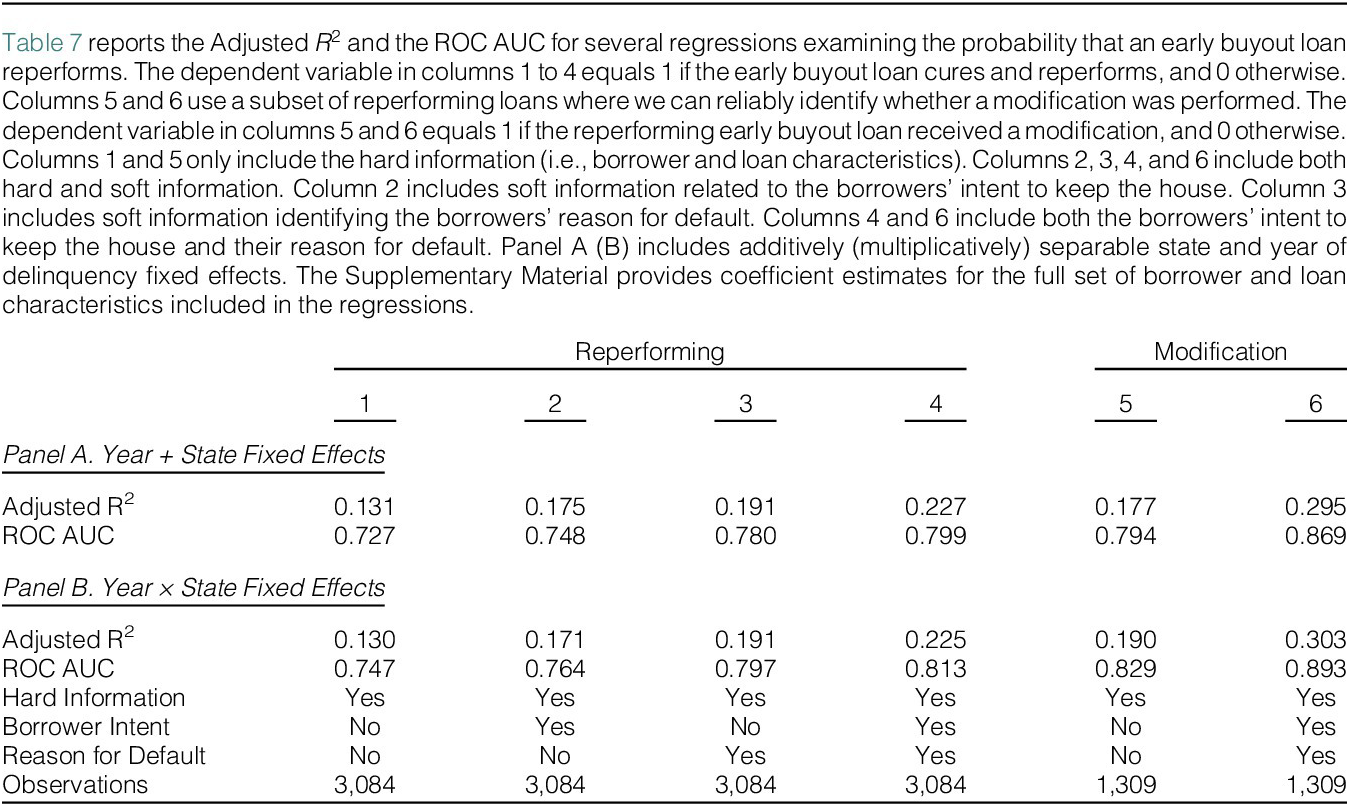
Panels A and B of Table 7 report the $ Adjusted $ $ {R}^2 $
and ROC AUC for several regressions that include additively or multiplicatively separable state and year of delinquency fixed effects. The results are similar in both panels, so we focus our discussion on Panel A. Column 1 displays the
$ {R}^2 $
and ROC AUC for several regressions that include additively or multiplicatively separable state and year of delinquency fixed effects. The results are similar in both panels, so we focus our discussion on Panel A. Column 1 displays the $ Adjusted $ $ {R}^2 $
for the baseline regression that includes only hard information. The hard information, which explains 13.1% of the variation in the probability that an early buyout loan reperforms, includes similar variables as the earlier GNMA loan-level regressions. One key difference is that the private equity data include the borrowers’ revised credit score at the time of delinquency, which we include in place of the borrowers’ credit score at origination. Thus, our regressions examine whether the soft information collected during the servicing process provides explanatory power above and beyond the information captured in borrowers’ revised credit scores.
$ {R}^2 $
for the baseline regression that includes only hard information. The hard information, which explains 13.1% of the variation in the probability that an early buyout loan reperforms, includes similar variables as the earlier GNMA loan-level regressions. One key difference is that the private equity data include the borrowers’ revised credit score at the time of delinquency, which we include in place of the borrowers’ credit score at origination. Thus, our regressions examine whether the soft information collected during the servicing process provides explanatory power above and beyond the information captured in borrowers’ revised credit scores.
Table 7 Probability of Reperformance

Columns 2 to 4 in Panel A of Table 7 incorporate the two pieces of soft information discussed earlier in this section. Column 2 includes the delinquent borrowers’ intent to keep their house, column 3 includes the borrowers’ reason for default, and column 4 includes both pieces of soft information. The combined regression in column 4 explains 22.7% of the variation in the probability that an early buyout loan reperforms. The 9.6 percentage point increase in explanatory power represents a 73% increase relative to the baseline estimation in column 1, which only includes hard information. A partial F-test indicates the difference between the regression model with soft information in column 4 and the nested model without soft information in column 1 is statistically significant at the 1% level (F statistic = 20.7).
Columns 1 to 4 of Table 7 also display the AUC for each model. The AUC increases as we include the soft information. A higher AUC is preferred, as this indicates the ROC curve is closer to the northwest corner of the plot, where the TPR is higher for any given level of the FPR. Graph A of Figure 5 plots the ROC curves for the four models. Graph A shows that the models with soft information perform better than those with only hard information.

Figure 5 ROC Curves
Figure 5 plots the ROC curves for models that only include hard information relative to those that include hard and soft information. All models include additively separable state and year of delinquency fixed effects. Graph A plots the ROC curves for the models examining the probability that an early buyout loan reperforms in columns 1 through 4 of Panel A in Table 7. Graph B plots the ROC curves for the models examining the probability an early buyout loan requires a modification to reperform in columns 5 and 6 of Panel A in Table 7.
The Supplementary Material reports the complete set of coefficient estimates for the four models examining the probability that an early buyout loan reperforms. A quick glance at the soft information variables indicates loans with borrowers who are intent on keeping their house have a significantly higher probability of reperforming. In contrast, several of the reasons for default variables indicate that loans with borrowers who are ill, experiencing marital problems, or have excessive financial obligations have a significantly lower probability of reperforming.
GNMA issuers perform early buyouts (loan outcome = 2) and loss mitigation buyouts (loan outcome = 4). These two types of buyouts are not equally attractive to GNMA issuers. When considering an early buyout, issuers must determine whether some form of loss mitigation will be necessary to cure the loan. If loss mitigation is required to cure the loan, issuers perform a loss mitigation buyout. If loss mitigation is not required at the time of the buyout, then issuers perform an early buyout. It is possible that loss mitigation, such as a loan modification, is ultimately required to cure an early buyout loan. Loan modifications are a concern because they frequently affect the terms of the loan, which affects the profitability of the early buyout. Accordingly, we examine if the soft information collected during the loan servicing process provides insight into the probability that an early buyout loan requires a modification to reperform.
Columns 5 and 6 of Table 7 examine the probability that an early buyout loan requires a modification to reperform. Columns 5 and 6 use a subset of reperforming loans that are classified as either “Resecuritized w/o mod” or “Resecuritized with mod” in Table 3. The dependent variable in both columns equals 1 if the reperforming early buyout loan received a modification, and 0 otherwise.
Column 5 includes only hard information, and column 6 includes hard and soft information. The $ Adjusted $ $ {R}^2 $
increases by 11.8 percentage points in column 6 relative to column 5. This implies the inclusion of the soft information in column 6 increases the relative explanatory power of the model by 67%. A partial F-test indicates the difference between the regression model with soft information in column 6 and the nested model without soft information in column 5 is statistically significant at the 1% level (F statistic = 12.6). The ROC curve in Graph B of Figure 5 clearly shows the model with soft information (column 6) performs better than the model that only includes hard information (column 5). Moreover, the AUC increases by 9.4% in column 6 relative to column 5.
$ {R}^2 $
increases by 11.8 percentage points in column 6 relative to column 5. This implies the inclusion of the soft information in column 6 increases the relative explanatory power of the model by 67%. A partial F-test indicates the difference between the regression model with soft information in column 6 and the nested model without soft information in column 5 is statistically significant at the 1% level (F statistic = 12.6). The ROC curve in Graph B of Figure 5 clearly shows the model with soft information (column 6) performs better than the model that only includes hard information (column 5). Moreover, the AUC increases by 9.4% in column 6 relative to column 5.
The coefficient estimates for the reason for default variables reported in the Supplementary Material provide additional insight into the results in column 6 of Table 7. The coefficient estimates indicate that loans whose borrowers are ill, have had their income curtailed, or are unemployed are more likely to receive a loan modification in order to reperform. These results are straightforward and intuitive, suggesting that GNMA issuers can exploit this private information to maximize the return on their early buyout decisions. This is a concern because GNMA issuers ostensibly collect the soft information on behalf of MBS investors as part of the delinquent mortgage servicing process.
Overall, the results in Table 7 indicate that including private soft information from servicer call logs in our model increases its explanatory power relative to a baseline model that only includes hard information. It is important to note that the improved performance does not provide causal evidence that GNMA issuers exploit the soft information in their early buyout decisions. However, when taken together with the fact that GNMA issuers cherry-pick loans with higher interest rate spreads, the improved performance suggests that issuers can use the private soft information to maximize their early buyout outcomes.
V. Economic Significance
Given the robustness of our main results, it is worth performing a back-of-the-envelope calculation to estimate the additional revenue generated by GNMA issuers’ early buyout activity. Our calculation is simple and straightforward. We first estimate the revenue potential of each early buyout loan by taking the difference between the loan’s market value and its remaining mortgage balance at the time of default. Assuming each loan reperforms, its market value equals the present value of its remaining monthly principal and interest payments. We discount the remaining payments using the 30-year fixed mortgage rate at the time of default. We then aggregate the loan-level revenues to estimate the total potential revenue.
Our back-of-the-envelope calculation initially assumes every early buyout loan self-cures, is resecuritized, and is held to maturity. In this case, we estimate that the 1.63 million early buyouts from January 2015 through December 2021 generated approximately $25.9 billion in additional revenue for GNMA issuers. Next, we adjust our back-of-the-envelope calculation using the early buyout loan reperformance and self-cure rates in Section III.C. For simplicity, we assume early buyout loans that are modified or do not reperform provide no economic benefits or losses. We also adjust our back-of-the-envelope calculation for prepayment using the standard Public Securities Association (PSA) prepayment model.
Using the reperformance (41.9%) and self-cure (84.6%) rates from our automated matching technique along with 100% PSA prepayment, we estimate GNMA issuers’ early buyout activity generated approximately $5.2 billion in additional revenue for GNMA issuers from January 2015 through December 2021. The $5.2 billion estimate is very conservative because our automated matching technique’s 41.9% match rate represents a lower bound of the early buyout loans’ reperformance rate. If we instead use the 69.8% reperformance rate from the private equity data, we estimate GNMA issuers’ early buyout activity generated approximately $8.7 billion in additional revenue for GNMA issuers from January 2015 through December 2021. This estimate is also conservative, as the private equity firm focuses on difficult loans. However, this conservatism is likely balanced by the fact that our back-of-the-envelope calculations do not account for the costs servicers incur when early buyout loans require modification or fail to reperform.
Pricing Implications
The estimates above indicate early buyouts represent an economically significant form of prepayment risk unique to GNMA MBS. If the early buyout option is not priced, then GNMA investors are clearly harmed when issuers use private information to buy out seriously delinquent loans with higher interest rate spreads that are more likely to reperform. Conversely, if the early buyout option is priced, its cost may be passed on to GNMA borrowers through higher mortgage rates.
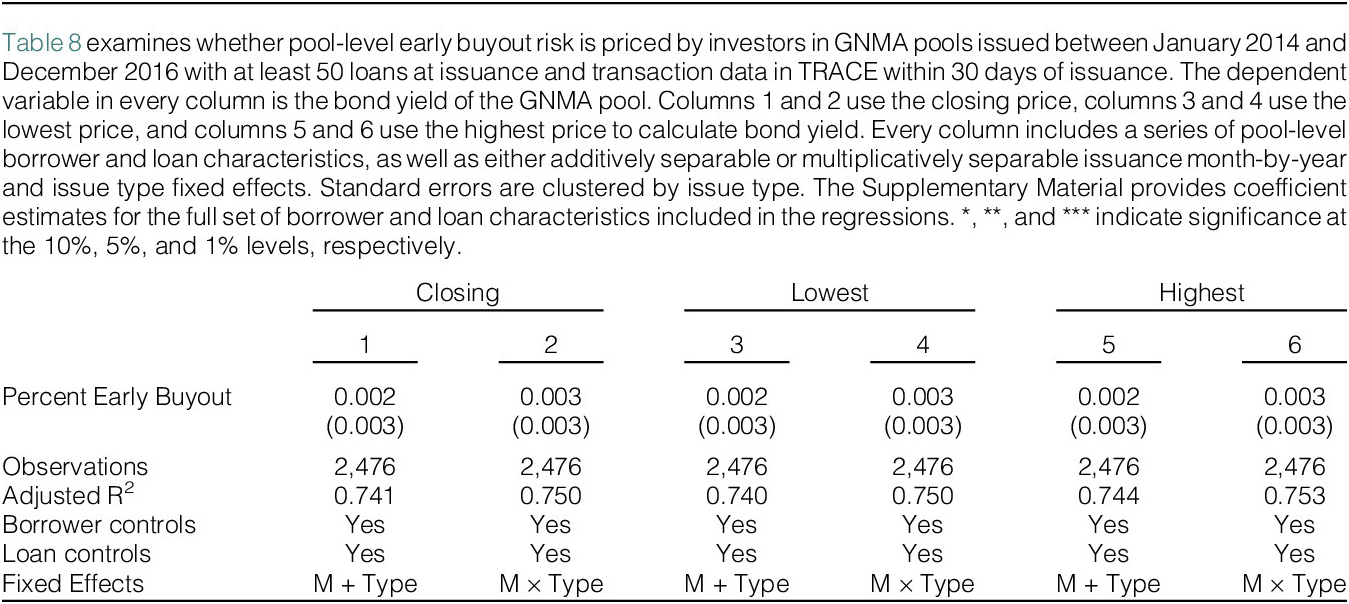
To assess whether GNMA investors price early buyout risk, we compare bond yields of GNMA pools with varying early buyout rates. Specifically, we regress GNMA pool yields on ex post pool-level early buyout rates, calculated as the percentage of loans that become seriously delinquent within 2 years of issuance and are bought out within 12 months of default. Yields are derived from daily trading data in the TRACE database using each pool’s closing price on the trading day closest to issuance. The key underlying assumption of our approach is that if pool-level early buyout rate expectations are correct (i.e., ex ante forecasts reasonably approximate ex post performance) and the early buyout option is priced, then ex post early buyout rates should significantly predict bond yields. Alternatively, if pool-level early buyout rate expectations are incorrect or the early buyout option is not priced, then no such relationship should exist.
Table 8 presents regression results for 2,476 GNMA pools issued between January 2014 and December 2016. Each pool had at least 50 loans and TRACE data within 30 days of issuance. The December 2016 cutoff ensures results are unaffected by COVID-19-related buyout behavior. All regressions control for average pool-level borrower characteristics (e.g., credit score, debt-to-income ratio) and loan features (e.g., loan-to-value ratio, loan amount) as well as issuance month-by-year and issue type fixed effects. Columns 1 and 2 calculate bond yields using the closing price, while columns 3 and 4 use the lowest price, and columns 5 and 6 use the highest price on the trading day closest to issuance in TRACE.
Table 8 GNMA Bond Yields

Across all specifications, higher early buyout rates are not associated with significantly higher yields. This suggests that GNMA investors do not explicitly price the early buyout option. However, investors may lower their bids for all GNMA MBS because they cannot predict which MBS pools are more likely to face issuers’ selective buyouts. This uniform discount would imply that the early buyout risk is priced at a portfolio level. This scenario is plausible, as issuers only gain insight into a loan’s potential for reperformance after it becomes seriously delinquent, not when they initially package the loan into a GNMA pool.Footnote 15
We explore the pricing implications if investors price early buyout risk and those costs are passed on to GNMA borrowers. Using pre-pandemic early buyout activity from 2015 through 2019, we first estimate the average annual revenue generated by early buyouts to be between $536 million (assuming a 68.9% resecuritization rate, 84.6% self-cure rate, and 100% PSA prepayment) and $908 million (assuming a 100% resecuritization rate, 84.6% self-cure rate, and 100% PSA prepayment). Then we divide the average annual revenue by the roughly $1 trillion total amount outstanding in GNMA MBS. Assuming GNMA investors price the early buyout option, we estimate it would require all GNMA borrowers to pay an additional 5.4 (536M/1T) to 9.1 (908M/1T) basis points per year in interest rates. This estimate is comparable to the annual 7 basis point cost that Goodman, Golding, and Neal (Reference Goodman, Golding and Neal2019) attribute to VA loan churning in GNMA MBS. While these increases may seem small, they are significant given GNMA’s focus on lending to low-income and first-time homebuyers.
VI. Conclusion
Early buyouts have served as a potential source of profit for GNMA issuers for some time, as evidenced by a 2003 PricewaterhouseCoopers report touting “improved earnings associated with the buyout of loans from GNMA” (PwC (2003)). Despite being a long-established program, there is a paucity of research on the topic. This article provides the first systematic review of early buyout activity in GNMA MBS pools. We identify the key determinants of early buyout activity and document agency conflicts associated with the practice.
We provide evidence that GNMA issuers make early buyout decisions along two dimensions: the interest rate spread of a seriously delinquent loan and the likelihood that it will reperform. The interest rate spread proxies for the issuer’s potential profit if they buy the loan out early, cure it, and then resecuritize it in a new GNMA MBS pool. In our preferred specifications, we find that a 1 percentage point increase in interest rate spread increases the probability of an early buyout by approximately 7–9 percentage points.
We provide several pieces of evidence indicating that GNMA issuers buy out seriously delinquent loans that are more likely to reperform and leave loans that are less likely to reperform in GNMA pools. Then, we illustrate how issuers acquire private information about the delinquent borrower that provides direct insight into the likelihood of reperformance. We find models that include the private soft information significantly outperform those that only include hard information. Taken together, our findings provide strong support for our claim of adverse selection in GNMA issuers’ early buyout decisions.
Our findings have important implications from policy and investment perspectives. Regarding policy, early buyouts came under scrutiny in 2020 when GNMA issuers purchased large quantities of delinquent loans in COVID-19 pandemic-related forbearance programs (Maloney (Reference Maloney2020)). In response, GNMA imposed a temporary restriction on the resecuritization of early buyout loans to “ensure that transactional activity related to these options does not impair market confidence in Ginnie Mae securities (GNMA APM 20–07).” Our findings provide evidence of adverse selection that supports GNMA’s pandemic-related early buyout restriction. Moreover, we document adverse selection well before the onset of the pandemic.
From an investment perspective, we find GNMA issuers perform early buyouts on 54.7% of seriously delinquent loans, constituting roughly 5.7% of all GNMA loans. Using a conservative back-of-the-envelope calculation, we estimate early buyouts generated between $5.2 and $8.7 billion in additional revenue for GNMA issuers from January 2015 through December 2021. Taken together with the adverse selection in our main results, the substantial volume and revenue generated by early buyouts indicate that they represent a significant form of mortgage prepayment risk that is unique to GNMA MBS.
Supplementary Material
To view supplementary material for this article, please visit http://doi.org/10.1017/S0022109025102068.


 Open access