


Introduction
Organized volunteers are a key component of emergency management (Alexander, Reference Alexander2010; Baxter-Tomkins & Wallace, Reference Baxter-Tomkins and Wallace2009; Dostál & Balarinová, Reference Dostál and Balarinová2013; Krogh & Lo, Reference Krogh and Lo2023). Therefore, understanding the factors that sustain their motivation and participation is crucial, not only for organizations, but also for broader societal emergency-response mechanisms.
Search-and-rescue (SAR) missions are among the most demanding tasks for volunteers. Although risks are usually well-managed through extensive training and safety protocols, it is difficult to eliminate the risk of physical injury. Additionally, volunteer mental health is an increasing concern among practitioners and in research; for example, post-traumatic stress disorder (PTSD) is more common in volunteer emergency responders than in the general population (Berger et al., Reference Berger, Coutinho, Figueira, Marques-Portella, Luz, Neylan, Marmar and Mendlowicz2012; Köse, Reference Köse2023; Thormar et al., Reference Thormar, Gersons, Juen, Djakababa, Karlsson and Olff2013). Fear of harm can deter risk-averse individuals from participating (Gunessee et al., Reference Gunessee, Subramanian, Roscoe and Ramanathan2018; Rosychuk et al., Reference Rosychuk, Bailey, Haines, Lake, Herman, Yonge and Marrie2008; Shi et al., Reference Shi, Wei, Gao, Kang, Ning, Liu, Liang, Sun, Jiao and Liang2018), yet effective SAR teams benefit from diversity in risk tolerance. Since excessive risk-taking can endanger other volunteers and jeopardize mission outcomes, a pool of volunteers with a generally high risk propensity is undesirable (Eltz, Reference Eltz2015).
This study examines whether robust trust relationships can mitigate risk aversion’s potentially negative effects on volunteer motivation in high-risk volunteering. Trust’s importance increases in high-risk, collaborative contexts characterized by interdependence (Cook et al., Reference Cook, Yamagishi, Cheshire, Cooper, Matsuda and Mashima2005; Mayer, Davis, & Schoorman, Reference Mayer, Davis and David Schoorman1995; Koller, Reference Koller1988), such as SAR volunteering. Our study addresses gaps in the literature by quantitatively assessing the uniqueness of SAR volunteers compared to those active in other areas of volunteering and by paying particular attention to risk-averse SAR volunteers. Studies of high-risk volunteering often focus on volunteers with high risk tolerance and emphasize heroic efforts and strong group cohesion (Fine & Holyfield, Reference Fine and Holyfield1996; Lois, Reference Lois1999; Perkins & Metz, Reference Perkins and Metz1988). While several studies have analyzed the motivational structures of SAR and emergency responders (Khalemsky et al., Reference Khalemsky, Schwartz, Herbst and Jaffe2020; Martens, Reference Martens2017; Collie & Shalev Greene, Reference Collie and Greene2023), there are few comprehensive studies on volunteers’ attitudes toward risk (Dong, Reference Dong2015), and, in particular, how motivation and risk attitudes interact. This study contributes by highlighting the particular importance of trust for maintaining motivation among risk-averse SAR volunteers.
We expect trust relationships between volunteers to be stronger in SAR than in other areas of volunteering, and that SAR volunteers who have trust in and feel trusted by peers will be more motivated and participate more often. We also hypothesize that confronting and managing risk motivates some volunteers (Lois, Reference Lois1999; Lyng, Reference Lyng1990), but deters others (Britto et al., Reference Britto, Van Slyke and Francis2011; Dong, Reference Dong2015). Finally, we propose that trust can buffer against the negative effects of risk aversion on motivation and participation, especially when trust is perceived as reciprocal.
Next, we describe the case under study before presenting the theoretical framework, methods, and results.
SAR Volunteering in Norway
The Norwegian SAR service is a structured collaboration between public agencies and voluntary organizations, integrating central and local rescue centers, police forces, and volunteers (Krogh & Lo, Reference Krogh and Lo2023). Around 25,000 volunteers contribute millions of hours every year, mostly unpaid (Gjerde & Winsvold, Reference Gjerde and Winsvold2016). Public authorities do not organize volunteers themselves but collaborate with volunteer organizations (Krogh & Lo, Reference Krogh and Lo2023). The most important organizations are the Norwegian Red Cross (NRC), Norwegian People’s Aid (NPA), Norwegian Alpine Rescue Group (NARG), and Norwegian Rescue Dogs (NRD). These often act as primary response teams during operations. The police coordinate most operations (Gjerde & Winsvold, Reference Gjerde and Winsvold2016).
SAR operations in Norway often occur in difficult terrain and weather conditions and therefore require highly skilled and adaptable volunteers. Indeed, the expertise of SAR volunteers often exceeds that of public rescue services (Gjerde & Winsvold, Reference Gjerde and Winsvold2016). These features may limit the generalizability of our results. The physically demanding conditions might imply a higher threshold for participation in terms of risk tolerance and ability than in less demanding contexts, overstating differences with other areas of volunteering. While the psychological processes related to the buffering effect of trust on risk aversion are clearly relevant to other volunteering activities that involve risk (e.g., volunteer firefighters), they are less likely to apply to low-risk, routine volunteering activities. However, they could apply to other “high-reliability” (Colquitt et al., Reference Colquitt, LePine, Zapata and Wild2011) volunteer roles involving psychological stress and requiring quick, coordinated responses, such as emergency medical services or SAR in less challenging physical environments. This should be clarified in further studies.
Trust, Motivation and Participation
Trust is an initial condition for successful collaboration, an element and outcome of the collaboration process itself, and a resource during the implementation phase (Ansell & Gash, Reference Ansell and Gash2008). Therefore, the study of trust, including its influence on volunteer motivation, is crucial to understanding the operational dynamics of emergency response.
Trust is generally defined as positive beliefs about others’ trustworthiness and a willingness to be vulnerable (Mayer, Davis, & Schoorman, Reference Mayer, Davis and David Schoorman1995; Rousseau et al., Reference Rousseau, Sitkin, Burt and Camerer1998; McAllister, Reference McAllister1995). Positive evaluations of trustworthiness include perceptions or beliefs about an agent’s abilities and intentions, leading to positive expectations for future interactions. Willingness to be vulnerable refers to accepting uncertainty, or deciding to rely on the trustee despite potential risks (Fulmer & Gelfand, Reference Fulmer and Gelfand2012). In this study, “trust” refers to perceptions of positive perceptions of others’ integrity, ability, and benevolence (Mayer, Davis, & Schoorman, Reference Mayer, Davis and David Schoorman1995), while “felt trust” refers to the perception that others trust them in return (Skiba & Wildman, Reference Skiba and Wildman2019). A volunteer perceives trust as mutual when they trust others and feel trusted by them. Participation in SAR missions is an expression of trust––a willingness to be vulnerable in uncertain and sometimes risky conditions. SAR teams’ positive expectations of others, alongside the perception that others have positive expectations of them, should strengthen motivation and willingness to participate.
In terms of motivation, we are interested primarily in volunteers’ overall willingness to perform their tasks to achieve personal and organizational goals (Okello & Gilson, Reference Okello and Gilson2015), rather than the relative importance of different types of motivation.
Trust in SAR Volunteering
In civic engagement in general, trust facilitates interactions, ensures information flow, and mitigates free-riding (Suh & Reynolds‐Stenson, Reference Suh and Reynolds-Stenson2018). In SAR, trust plays an additional role due to the “high-reliability” tasks carried out by volunteers, which, unlike “typical” everyday tasks, involve unpredictability and inherent dangers (Colquitt et al., Reference Colquitt, LePine, Zapata and Wild2011). Given high vulnerability and severe consequences of errors, maintaining high reliability in such environments is crucial. This depends not only on adherence to procedures and checklists, but also on the trustworthiness of volunteers, such as their ability to improvise effectively in the face of danger (Colquitt et al., Reference Colquitt, LePine, Zapata and Wild2011; Krogh & Lo, Reference Krogh and Lo2023).
The high-reliability nature of SAR volunteering increases the need for trust. Trusting relationships are therefore also likely to be more robust than in typical volunteering tasks. Cognition-based assessments of trustworthiness (ability and integrity) are strengthened by rigorous training and collective experiences in risky situations (Ashleigh & Prichard, Reference Ashleigh, Prichard, Searle and Skinner2011; Cook et al., Reference Cook, Yamagishi, Cheshire, Cooper, Matsuda and Mashima2005; Henderson & Sowa, Reference Henderson and Sowa2023), and affect-based judgments (benevolence) are positively related to group cohesion, which is strengthened by collective participation in “dangerous leisure” (Fine & Holyfield, Reference Fine and Holyfield1996). Indeed, emergency volunteer groups are characterized by strong group cohesion and social solidarity (Lois, Reference Lois1999; Perkins & Metz, Reference Perkins and Metz1988), as are other volunteer groups participating in activities involving risk (Fine & Holyfield, Reference Fine and Holyfield1996).
Thus, we hypothesize: H1: Trust among SAR volunteers is stronger than in other areas of volunteering.
The Link Between Trust, Felt Trust, and Motivation
We expect a strong relationship between trust and motivation in SAR volunteering. Social exchange theory suggests that trust increases motivation to reciprocate perceived benevolence and fairness (Colquitt et al., Reference Colquitt, LePine, Piccolo, Zapata and Rich2012; Dirks & Skarlicki, Reference Dirks and Skarlicki2009; Konovsky & Pugh, Reference Konovsky and Douglas Pugh1994). Research on volunteering links trust in organizations with increased commitment (Passey & Tonkiss, Reference Passey, Tonkiss, Tonkiss, Passey, Fenton and Hems2000; Waters & Bortree, Reference Waters and Bortree2010). In contrast, lack of trust in high-risk environments can cause stress, diverted focus, and negatively health outcomes (Colquitt et al., Reference Colquitt, LePine, Zapata and Wild2011; Sonnentag & Frese, Reference Sonnentag and Frese2003).
Trust is a two-way street, as underlined by social exchange theory (Blau Reference Blau1964), which often informs studies in organizational behavior. It is increasingly recognized in the literature that trust in others, on the one hand, and being trusted and perceiving that trust have different effects (Dirks & de Jong, Reference Dirks and de Jong2022). Workplace studies suggest that feeling trusted by superiors increases employees’ sense of responsibility, commitment, autonomy, and self-efficacy, and also positively impacts motivation and ability to accomplish challenging tasks (Lau et al., Reference Lau, Lam and Wen2014; Salamon & Robinson, Reference Salamon and Robinson2008; Skiba & Wildman, Reference Skiba and Wildman2019; Zheng et al., Reference Zheng, Hall and Schyns2019). Studies on emergency volunteers have identified recognition as a key motivator (Baxter-Tomkins & Wallace, Reference Baxter-Tomkins and Wallace2009; Rice & Fallon, Reference Rice and Fallon2011).
Leadership styles influence the quality of trust relationships and motivation. Transformational leadership that is goal oriented, visionary, considerate, and able to generate enthusiasm has been associated with group cohesion (Henderson & Sowa, Reference Henderson and Sowa2023) and, in turn, with greater engagement (Mayr, Reference Mayr2017) in high-risk volunteer contexts. Similarly, studies on volunteer engagement have linked autonomy-supportive leadership that contains elements of felt trust with higher motivation (Haivas et al., Reference Haivas, Hofmans and Pepermans2012; Oostlander et al., Reference Oostlander, Güntert, Van Schie and Wehner2014).
H2: Trust in other volunteers and the feeling of being trusted by them are associated positively with motivation.
Physical Risk as a Deterrent and Motivator
While overcoming risks collectively can strengthen team cohesion, the risk of injury can function as a deterrent. Physical risk has been identified as a barrier to volunteering during disasters (Gunessee et al., Reference Gunessee, Subramanian, Roscoe and Ramanathan2018), pandemics (Rosychuk et al., Reference Rosychuk, Bailey, Haines, Lake, Herman, Yonge and Marrie2008), and volunteering in general (Britto et al., Reference Britto, Van Slyke and Francis2011). Risk aversion may increase stress in risky situations and thus reduce the willingness to volunteer. Previous research has found a positive relationship between risk tolerance and willingness to volunteer in emergencies (Shi et al., Reference Shi, Wei, Gao, Kang, Ning, Liu, Liang, Sun, Jiao and Liang2018) and other areas of volunteering (Dong, Reference Dong2015; Heist et al., Reference Heist, Cnaan and Lough2021).
The concept of “edgework” (Lyng, Reference Lyng1990) and related studies on heroism in SAR (Lois, Reference Lois1999) draw attention to more positive aspects of risk. Edgework involves confronting life-and-death scenarios or other boundaries that exceed physical and mental limits. It does not imply reckless risk-taking, but the opposite: minimizing risks by handling them skillfully, with improved self-control, the ability to deal with negative emotions, self-actualization, and personal growth as intended outcomes. Skillful handling of physical risks also enables advancement in the social hierarchy toward hero status.
Engagement in high-risk activities, such as volunteer firefighting, has been suggested as a way to combat alienation, promote self-actualization, and provide stimuli that a regular job does not (Thompson III & Bono, Reference Thompson, Alexander and Bono1993). Studies on volunteer firefighters show that some volunteers enjoy the risk associated with the activity (Gora & Nemerowicz, Reference Gora and Nemerowicz1985; Perrott & Blenkarn, Reference Perrott and Blenkarn2015; Simpson, Reference Simpson1996), and studies of SAR volunteers suggest a dual motivational framework in which risk-taking and altruism go hand in hand (Uriely et al., Reference Uriely, Schwartz, Cohen and Reichel2002).
H3: SAR volunteers are more risk-tolerant than volunteers in other domains.
H4: SAR volunteers with a higher risk propensity are more motivated and willing to participate in SAR missions than those with a lower risk propensity.
Trust as a Moderator
Ensuring diversity in risk attitudes among SAR volunteers is an important management concern (Eltz, Reference Eltz2015). Strategies intended to mitigate risk and uncertainty such as sufficient training, preparation, adequate insurance protection, and waivers of liability can help recruit and retain risk-averse volunteers (Dong, Reference Dong2015). Similar strategies have been implemented in the Norwegian SAR, where volunteers have been covered by workers’ compensation insurance since 2018 (Ministry of Justice & Public Security, 2020).
Despite these efforts, the risks and fear of injury are difficult to eliminate. Rescue missions can be characterized by unpredictability and lack of individual control. These factors increase the importance of trust in maintaining motivation and commitment (Pauer, Rutjens, & van Harreveld, Reference Pauer, Rutjens and van Harreveld2022). Under uncertain or risky conditions, trust facilitates action and decision making by reducing experienced uncertainty and increasing tolerance for vulnerability to a threat (Luhmann, Reference Luhmann1979; Siegrist, Reference Siegrist2021). Volunteers who trust their team to manage risks and work together under pressure will cope better with these risks and uncertainties. This dynamic is likely to be strongest among volunteers who are deterred by risk and who do not seek out the “edgework” aspect of SAR activities. More broadly, uncertainty management theory states that trust increases motivation and reduces turnover intentions as individuals need to worry less about contingencies when collaborating (Colquitt et al., Reference Colquitt, LePine, Piccolo, Zapata and Rich2012; Skiba & Wildman, Reference Skiba and Wildman2019). In the absence of trust, more cognitive resources are required to assess others’ intentions and abilities.
We propose that trust can compensate for lower motivation in risk-averse volunteers due to perceived risks, and increase their willingness to participate:
H5: Trust moderates the relationship between risk aversion and motivation, such that risk-averse volunteers maintain higher levels of motivation and willingness to participate when trust is high.
The Importance of Mutual Trust
Trust within cohesive units not only protects physical well-being, but also promotes psychological safety and resilience (Edmondson, Reference Edmondson1999; Weick & Sutcliffe, Reference Weick and Sutcliffe2011). Perceived mutual trust also empowers volunteers to engage openly and take interpersonal risks. The literature on congruence in trust relationships supports this hypothesis further (Baer et al., Reference Baer, Frank, Matta, Luciano and Wellman2021; Dirks & de Jong, Reference Dirks and de Jong2022; Korsgaard et al., Reference Korsgaard, Brower and Lester2015). A recurring finding is that any positive effect from trust is offset in the presence of underlying asymmetry (Brower et al., Reference Brower, Lester, Audrey Korsgaard and Dineen2009). Having higher actual trust than felt trust can lead to relationship breakdowns due to unmet expectations (Korsgaard et al., Reference Korsgaard, Brower and Lester2015), while excessive felt trust may burden people with high expectations and emotional exhaustion (Baer et al., Reference Baer, Frank, Matta, Luciano and Wellman2021).
Therefore, we expect:
H6: Trust’s moderating effect is amplified when trust is perceived as mutual.
The next section outlines the study design and the methods used to test these hypotheses.
Data and Methods
Study Design
The aim of the study to (1) to compare trust and risk attitudes among SAR volunteers with those in other areas of volunteering and (2) to examine the relationships between trust, risk propensity, and motivation in SAR volunteers. Data were collected through cross-sectional surveys of SAR volunteers and the general population. Both surveys were approved by the Norwegian Data Protection Commissioner and included up to three reminder emails.
Sampling and Recruitment
Two online surveys were conducted: one for SAR volunteers and another for the general population. SAR survey participants were recruited via mailing lists from three major organizations (NRC, NPA, and NARG). The inclusion criterion was participation in at least one mission in the previous year. 6,266 SAR volunteers were invited to participate via email. Data were collected in 2021 via Questback (NRC) and Enterprise Feedback Suite (NPA/NARG). The population survey, conducted in 2022, used stratified sampling from Kantar Norway’s web panel, of 40,000 randomly recruited adults. Stratification was based on age, gender, region, and education (32 strata). 9,017 members of the Kantar panel were invited to participate by email, with survey management and follow-up handled by Kantar Norway. A comprehensive description of the sampling method and panel management can be found in Supplementary Documents S2 (full Norwegian report) and S3 (English summary).
Participants
The response rate was 29% (NRC, n = 1,313) for 24% (NPA, n = 354) and 67% (NARG, n = 130). The final sample consisted of 1,659 volunteers (average age 42.1 years, SD = 12.5, 29% female) after excluding 121 NPA respondents who had not participated in SAR missions. The response rate in the population survey was 35% responded (n = 3,185, average age 50.9 years, SD = 16.9, 52% female). The data were weighted by age, gender, place of residence, and education. A subgroup of 1,477 respondents who had volunteered in the past year was identified, after excluding 74 volunteers in the “preparedness or rescue work” category to avoid overlap with the SAR sample.
Variables and Measurement
A list of all items from both surveys with question wording and response categories can be found in Supplementary Material. Trust in other volunteers was measured using an index based on Mayer et al. (Reference Mayer, Davis and David Schoorman1995) dimensions of trustworthiness: integrity, ability, and benevolence. Responses on 0–10 scales were averaged (α = 0.88 SAR, α = 0.90 population). Felt trust was similarly measured by asking respondents to indicate how much trust they thought other volunteers had in them (α = 0.90 and 0.93, respectively). The three Likert scale items selected to measure risk propensity were designed to capture a person’s propensity to take or avoid risks, with an emphasis on physical risks (α = 0.73 in SAR, α = 0.84 population). Overall motivation for SAR was measured using the question “How motivated are you to participate in voluntary rescue work?” (scale 0–10). Additional items measuring the thrill of SAR as a motivator (“I enjoy the thrill associated with rescue work”), and ten items from the Volunteer Functions Inventory (VFI) combined into the five sub-dimensions Values, Enhancement, Understanding, Social, and Career (Clary et al., Reference Clary, Snyder, Ridge, Copeland, Stukas, Haugen and Miene1998), were also included (scales 1–7). The selection of items from the VFI was based on their previous use in several Norwegian surveys on volunteering (Eimhjellen et al., Reference Eimhjellen, Steen-Johnsen, Folkestad, Ødegård, Enjolras and Strømsnes2018). Participation was measured with Likert scale items gauging the frequency of responding to SAR assignments. Scores were averaged to create an index (α = 0.63 SAR).
The population survey asked about volunteering in other areas (14 organizational categories) in the last 12 months. Respondents who had volunteered in more than one category indicated where they had volunteered the most. This variable was used in the subsequent analysis of differences between organization types.
Control variables included age, gender, education, and the standard measure of generalized trust, the latter to separate particularized trust relationships among volunteers from a general propensity to trust. For SAR volunteers, in addition to tenure, a five-item index of preparedness (α = 0.65) was included to account for expected beneficial effects of risk reduction through preparation, training, and equipment adequacy (cf. Dong, Reference Dong2015).
Procedure
The order of questions was adjusted for each target group. The SAR survey started with questions on volunteer roles and participation in SAR, followed by sections on trust relations, overall motivation, COVID-19-related volunteering (intended for a separate project), risk attitudes, values, SAR-specific attitudes, and finally demographics. The expected completion time was estimated to be 10–15 min based on internal pretesting. The population survey started with items on general trust and risk attitudes, followed by volunteering experience and, for those with prior volunteering, motivation and trust relations, concluding with a section on preparedness (for a separate project). Median completion times were 8 min for non-volunteers and 12 min for volunteers.
Data Analysis
Descriptive analysis Descriptive statistics and correlations for all variables can be found in the Appendix. The distributions of trust, felt trust, and overall motivation were skewed to the right. In addition, frequency analyses showed that responses to the key variables were clustered at the upper limit, particularly among SAR volunteers (motivation: 23%, trust: 24%, felt trust: 37%). To address skewness, quadratic transformations were used in the analyses of the relationships between trust, risk and motivation, giving more weight to the differences between high and moderate values while reducing the impact of the rare low trust/motivation observations. These variables were recoded to range from 0–1.
Estimator Both ordinary least squares (OLS) regressions and Tobit regressions were considered, the latter to account for censoring and ceiling effects due to the clustering at the upper limit on key variables. After comparing both methods (see Supplementary Material S1), we found minimal differences. Therefore, OLS was chosen for ease of interpretation and consistency across the dependent variables.
Diagnostic tests Diagnostic tests to assess possible violations of the OLS assumptions were performed, including the Breusch–Pagan test for heteroscedasticity, the Shapiro–Wilk test for normality, and the Ramsey RESET test for nonlinearity (see Supplementary Material S1). While we found no evidence of nonlinearity, all models in the SAR data analysis showed significant heteroscedasticity and non-normality. Robust standard errors were used throughout to address these issues. The differences between the classical and robust standard errors were small, indicating that violations of the OLS assumption did not have a significant impact on the results.
Hypothesis testing and model specifications Pooled data from the surveys were used to test the hypotheses comparing the level of trust (H1) and risk propensity (H3) among SAR volunteers with those of volunteers in other areas, adjusting for age, gender, education, and general trust. H2 (association between trust and motivation), H4 (association between risk propensity and motivation), H5 (trust as moderator), and H6 (mutual trust amplifies moderation) were tested using SAR volunteer data, with controls for tenure, preparedness, and organizational dummies in addition to demographics and general trust. To further test H4, the relationships between the dependent variables and the thrill of SAR were compared with the motivational dimensions of the VFI. An interaction term between trust and risk propensity was added to the model and used to test H5, and a three-way interaction including felt trust was used to test H6. Analyses were performed with STATA version 18.
Results
We first compare SAR volunteers with volunteers in other areas (H1 and H3) by pooling the SAR and population data. The rest of the analyses use only the SAR volunteer data. We examine first the direct relationships between trust, risk propensity, and the dependent variables (H2 and H4) and then the moderating effects of trust (H5 and H6).
Comparison Between SAR and Other Volunteers (H1 and H3)
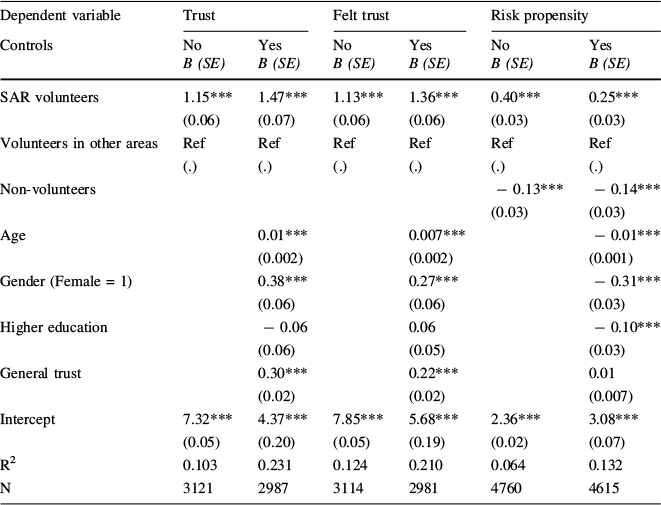
We hypothesized that volunteers in SAR would have greater trust in each other (H1) and be less averse to risk (H3) than volunteers in other areas. The results in Table 1 support both hypotheses.
Table 1 Pooled OLS regression with robust standard errors for trust and risk propensity, SAR and population sample
Dependent variable |
Trust |
Felt trust |
Risk propensity |
|||
|---|---|---|---|---|---|---|
Controls |
No |
Yes |
No |
Yes |
No |
Yes |
B (SE) |
B (SE) |
B (SE) |
B (SE) |
B (SE) |
B (SE) |
|
SAR volunteers |
1.15*** |
1.47*** |
1.13*** |
1.36*** |
0.40*** |
0.25*** |
(0.06) |
(0.07) |
(0.06) |
(0.06) |
(0.03) |
(0.03) |
|
Volunteers in other areas |
Ref |
Ref |
Ref |
Ref |
Ref |
Ref |
(.) |
(.) |
(.) |
(.) |
(.) |
(.) |
|
Non-volunteers |
− 0.13*** |
− 0.14*** |
||||
(0.03) |
(0.03) |
|||||
Age |
0.01*** |
0.007*** |
− 0.01*** |
|||
(0.002) |
(0.002) |
(0.001) |
||||
Gender (Female = 1) |
0.38*** |
0.27*** |
− 0.31*** |
|||
(0.06) |
(0.06) |
(0.03) |
||||
Higher education |
− 0.06 |
0.06 |
− 0.10*** |
|||
(0.06) |
(0.05) |
(0.03) |
||||
General trust |
0.30*** |
0.22*** |
0.01 |
|||
(0.02) |
(0.02) |
(0.007) |
||||
Intercept |
7.32*** |
4.37*** |
7.85*** |
5.68*** |
2.36*** |
3.08*** |
(0.05) |
(0.20) |
(0.05) |
(0.19) |
(0.02) |
(0.07) |
|
R2 |
0.103 |
0.231 |
0.124 |
0.210 |
0.064 |
0.132 |
N |
3121 |
2987 |
3114 |
2981 |
4760 |
4615 |
* p < 0.05, ** p < 0.01, *** p < 0.001
SAR volunteers scored 1.47 points higher on trust (p < 0.001) and 1.36 points higher on felt trust (p < 0.011) after adjusting for control variables (H1). Felt trust scores were higher than trust scores (see Table 3), suggesting that volunteers generally believe that others trust them more than they trust others. Risk propensity was also higher among SAR volunteers than among other volunteers (B = 0.40, p < 0.001) (H3). Differences decreased after demographic adjustment (B = 0.25, p < 0.001), reflecting the appeal of SAR to a younger, male population that is more inclined to risk-taking (Rolison et al., Reference Rolison, Hanoch, Wood and Liu2014). Non-volunteers showed slightly lower risk propensity than volunteers in areas other than SAR (B = −0.14, p < 0.001), which is consistent with the findings of Dong (Reference Dong2015).
It is, however, important to note that SAR volunteers do not consider themselves to be reckless. Separate analyses of the individual risk propensity indicators showed that only 9% of SAR volunteers agreed with the statement “I consider myself a risk-taker,” while 68% disagreed. The difference between SAR volunteers and volunteers in other areas on this item was not significant after adjusting for control variables (B = 0.02, p = 0.625). The differences were significant for the item “I like the feeling that comes when I take physical risks” (B = 0.12, p < .01), and particularly pronounced for the statement “I like activities in which I can test the limits of what I dare to do” (B = 0.53, p < 0.001). The thrill seems to be more in mastering and minimizing risks and testing one’s limits rather than actively seeking out risk.
Figure 1 distinguishes between different types of organizations. Trust between SAR volunteers is stronger than in any other category, and only the small category of COVID-19 volunteers (n = 30) matches the risk propensity among SAR volunteers, supporting both H1 and H3.

Fig. 1 Trust and risk propensity by organization type. Predicted values from pooled OLS regression with robust standard errors. Note 95% CI. Lines on x-axes cross at means for volunteers (blue) and population (red). Controls: age, gender, education, and general trust
Direct Relationships Between Risk Propensity (H2), Trust (H4), and Motivation/Participation
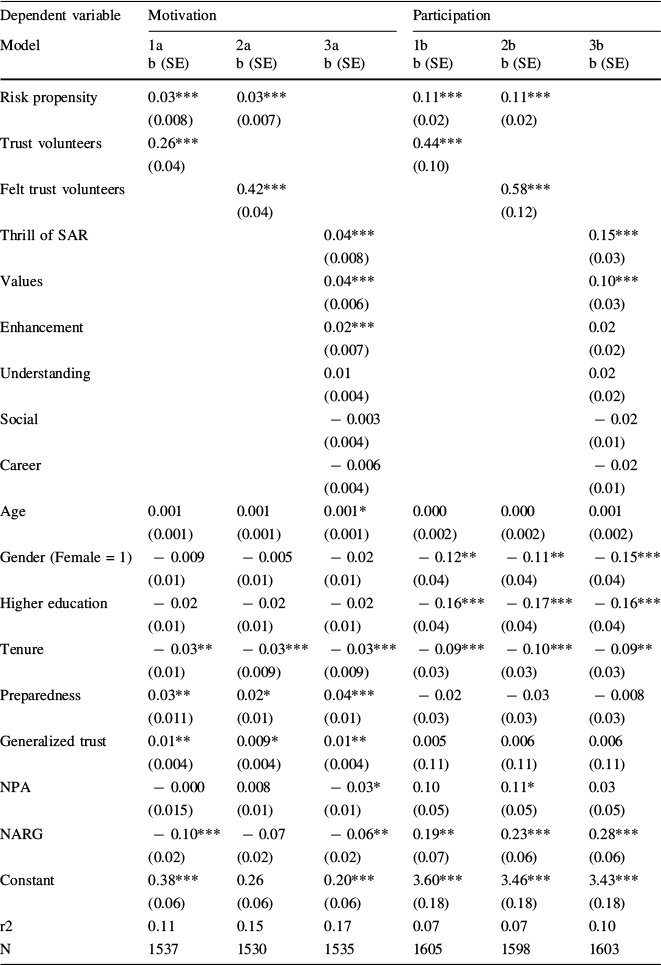
We suggested that motivation and participation are positively associated with (felt) trust (H2) and risk propensity (H4). The results are shown in Table 2. The hypotheses are tested directly in Models 1 and 2, while Model 3 further examines H4 by comparing the associations between the dependent variables and the thrill of SAR and the motivational dimensions of the VFI, respectively.
Table 2 OLS regression with robust standard errors for motivation and participation among SAR volunteers

Dependent variable |
Motivation |
Participation |
||||
|---|---|---|---|---|---|---|
Model |
1a |
2a |
3a |
1b |
2b |
3b |
b (SE) |
b (SE) |
b (SE) |
b (SE) |
b (SE) |
b (SE) |
|
Risk propensity |
0.03*** |
0.03*** |
0.11*** |
0.11*** |
||
(0.008) |
(0.007) |
(0.02) |
(0.02) |
|||
Trust volunteers |
0.26*** |
0.44*** |
||||
(0.04) |
(0.10) |
|||||
Felt trust volunteers |
0.42*** |
0.58*** |
||||
(0.04) |
(0.12) |
|||||
Thrill of SAR |
0.04*** |
0.15*** |
||||
(0.008) |
(0.03) |
|||||
Values |
0.04*** |
0.10*** |
||||
(0.006) |
(0.03) |
|||||
Enhancement |
0.02*** |
0.02 |
||||
(0.007) |
(0.02) |
|||||
Understanding |
0.01 |
0.02 |
||||
(0.004) |
(0.02) |
|||||
Social |
− 0.003 |
− 0.02 |
||||
(0.004) |
(0.01) |
|||||
Career |
− 0.006 |
− 0.02 |
||||
(0.004) |
(0.01) |
|||||
Age |
0.001 |
0.001 |
0.001* |
0.000 |
0.000 |
0.001 |
(0.001) |
(0.001) |
(0.001) |
(0.002) |
(0.002) |
(0.002) |
|
Gender (Female = 1) |
− 0.009 |
− 0.005 |
− 0.02 |
− 0.12** |
− 0.11** |
− 0.15*** |
(0.01) |
(0.01) |
(0.01) |
(0.04) |
(0.04) |
(0.04) |
|
Higher education |
− 0.02 |
− 0.02 |
− 0.02 |
− 0.16*** |
− 0.17*** |
− 0.16*** |
(0.01) |
(0.01) |
(0.01) |
(0.04) |
(0.04) |
(0.04) |
|
Tenure |
− 0.03** |
− 0.03*** |
− 0.03*** |
− 0.09*** |
− 0.10*** |
− 0.09** |
(0.01) |
(0.009) |
(0.009) |
(0.03) |
(0.03) |
(0.03) |
|
Preparedness |
0.03** |
0.02* |
0.04*** |
− 0.02 |
− 0.03 |
− 0.008 |
(0.011) |
(0.01) |
(0.01) |
(0.03) |
(0.03) |
(0.03) |
|
Generalized trust |
0.01** |
0.009* |
0.01** |
0.005 |
0.006 |
0.006 |
(0.004) |
(0.004) |
(0.004) |
(0.11) |
(0.11) |
(0.11) |
|
NPA |
− 0.000 |
0.008 |
− 0.03* |
0.10 |
0.11* |
0.03 |
(0.015) |
(0.01) |
(0.01) |
(0.05) |
(0.05) |
(0.05) |
|
NARG |
− 0.10*** |
− 0.07 |
− 0.06** |
0.19** |
0.23*** |
0.28*** |
(0.02) |
(0.02) |
(0.02) |
(0.07) |
(0.06) |
(0.06) |
|
Constant |
0.38*** |
0.26 |
0.20*** |
3.60*** |
3.46*** |
3.43*** |
(0.06) |
(0.06) |
(0.06) |
(0.18) |
(0.18) |
(0.18) |
|
r2 |
0.11 |
0.15 |
0.17 |
0.07 |
0.07 |
0.10 |
N |
1537 |
1530 |
1535 |
1605 |
1598 |
1603 |
* p < 0.05, ** p < 0.01, *** p < 0.001
Trust and felt trust are positively correlated with both motivation (trust: B = 0.26, p < 0.001, felt trust: B = 0.42, p < 0.001) and participation (trust: B = 0.44, p < 0.001, felt trust: B = 0.58, p < 0.001), supporting H2. Risk propensity is also positively and significantly related to motivation (B = 0.03, p < 0.001) and participation (B = 0.11, p < 0.001), even after adjusting for (felt) trust, supporting H4.
Model 3 shows that those who emphasize the thrill of SAR participate more frequently and are more motivated overall than those who are driven by other motivations, further supporting H4. The only exception is value-based motivation, which correlates equally strongly with motivation. The mean scores of the motivation scales in Table 3 also show that the thrill of SAR is rated highly by volunteers as a motivator—on a par with enhancement, values, and understanding—while social and career motivation are rated lower.
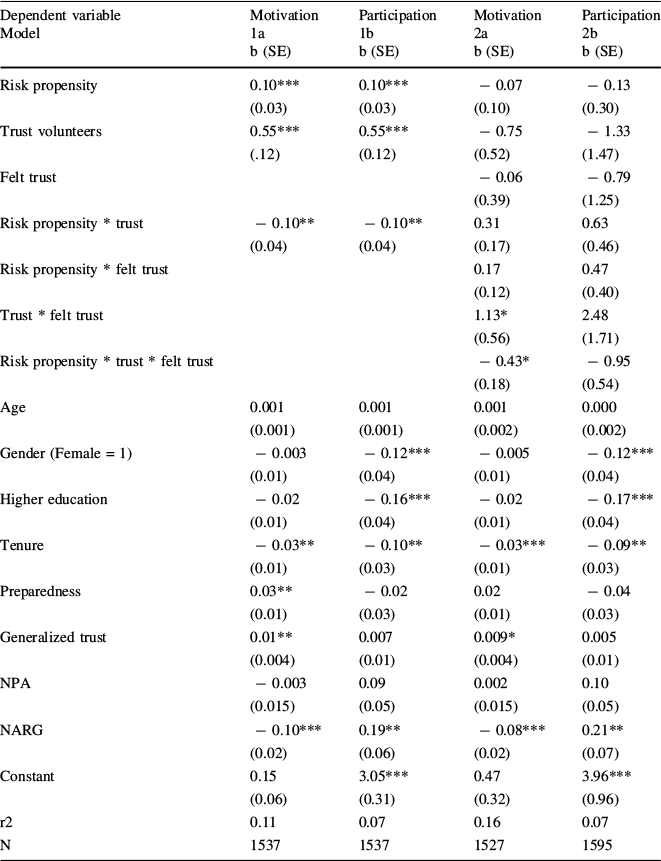
Trust as a Moderator (H5 and H6)
So far, we have found remarkably strong trust between SAR volunteers and positive associations between trust and risk attitudes and motivation/participation. Next, we examine whether robust trust relationships attenuate the negative relationship between risk aversion and motivation in SAR (H5) and whether perceived mutual trust strengthens this moderating effect (H6).
Figures 2 and 3 show the predicted values from regression analyses that include interaction terms between risk attitude and trust (H4, Fig. 2), and a three-way interaction that also includes felt trust (H6, Fig. 3). The full regression results can be found in Table 5. The interaction term is significant both for motivation (B = −0.10, p < 0.01) and participation (B = −0.24, p < 0.05), supporting H4. The differing slopes at low and high risk propensity show that as trust increases, the differences in motivation and participation between risk-tolerant and risk-averse individuals diminish and become negligible at 1 SD above the mean.
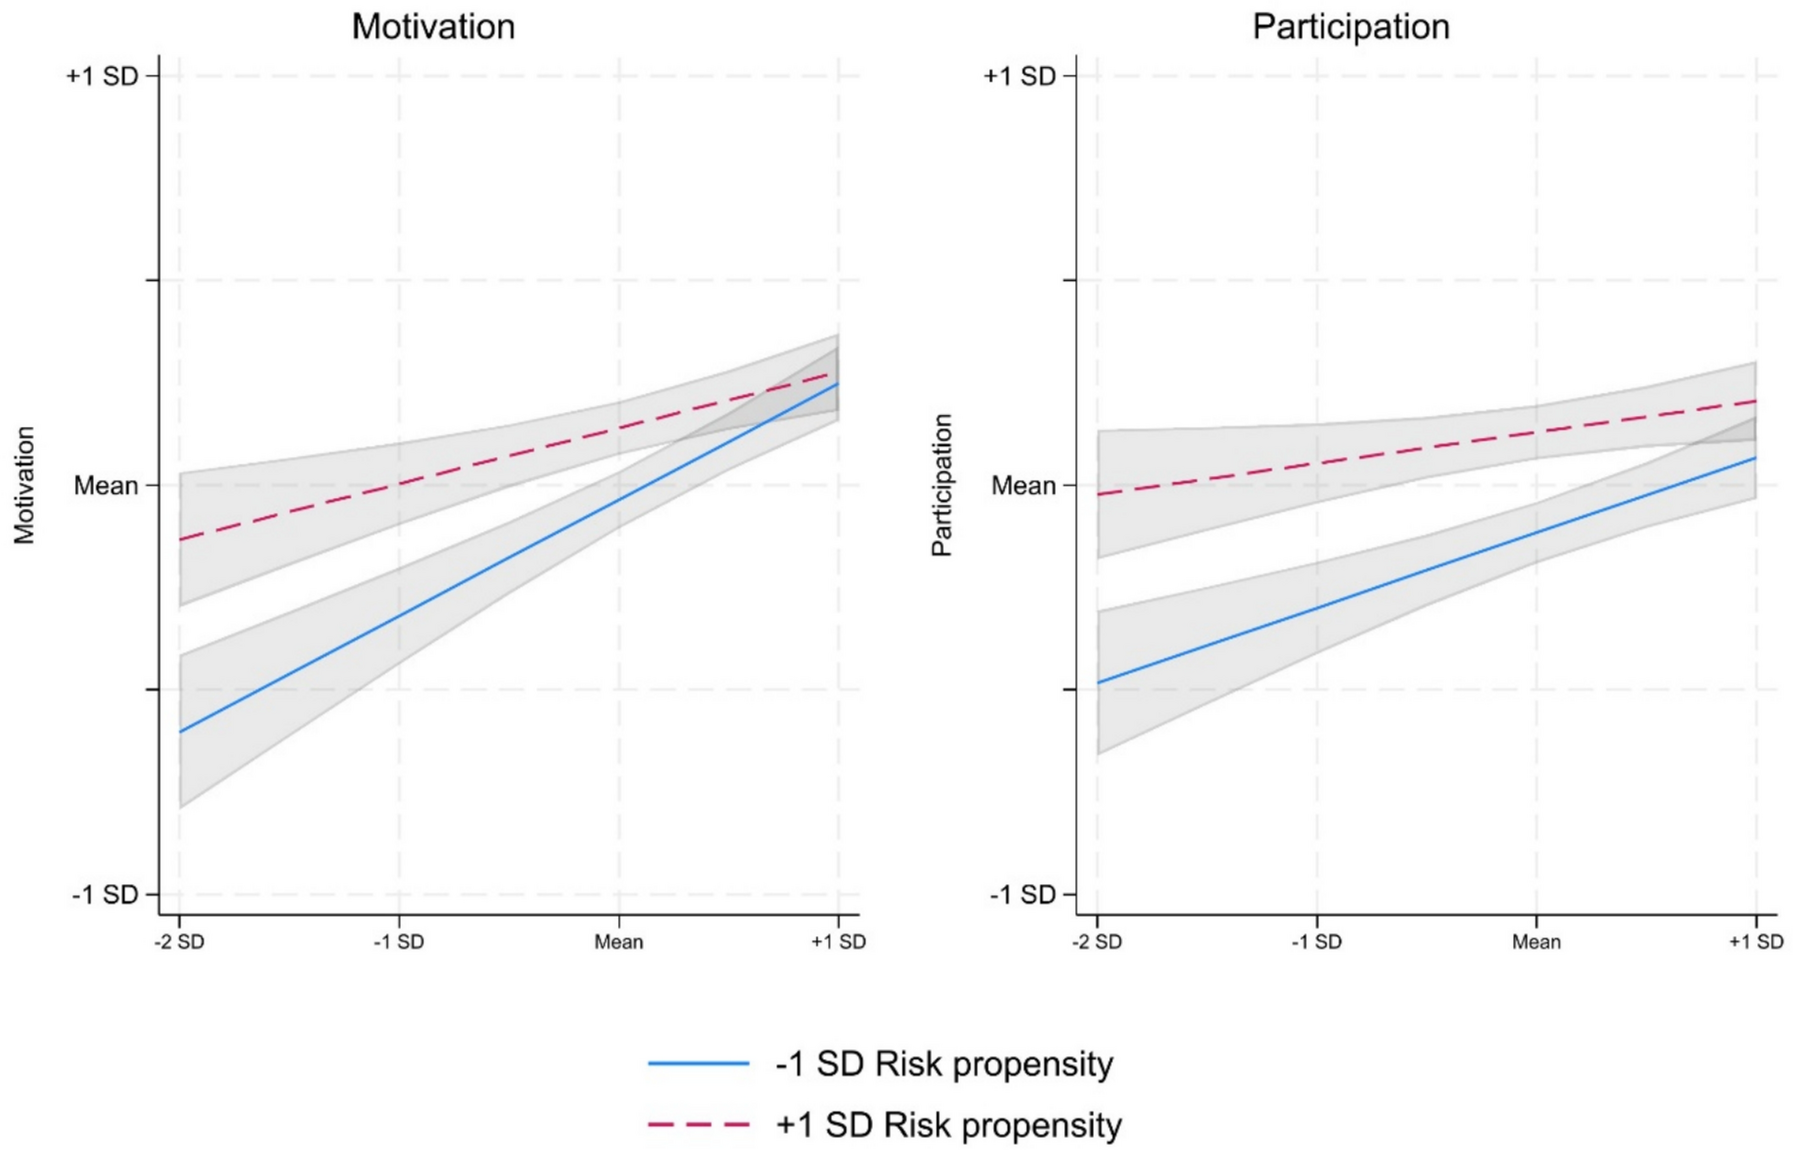
Fig. 2 Trust as moderator. OLS regression with robust standard errors. Note 95% CI. Controls: Age, gender, higher education, tenure, organization, preparedness, and general trust

Fig. 3 Mutual trust, motivation, and participation. OLS regression. Note 95% CI. Controls include age, gender, higher education, tenure, organization, preparedness, and general trust
Figure 3 shows the test of H6. Predictions for volunteers with low and high risk propensities are shown in separate panels. The predicted values indicate that the highest levels of motivation among risk-averse volunteers are found when both trust and felt trust are high, and the lowest when both are only moderate. Among risk-tolerant volunteers, differences are less pronounced. For motivation, both the three-way interaction (B = −0.43, p < 0.05) and the trust/felt trust interaction terms (B = 1.13, p < 0.05) were significant, supporting H6. For participation, support for H6 was less robust: The three-way interaction was significant only at the 90% level (B = -0.90, p = 0.092).
In summary, the findings support the hypotheses. Trust and risk propensity are higher among SAR volunteers, and trust strengthens motivation and participation, particularly for risk-averse volunteers.
Concluding Discussion
The role of risk in physically demanding forms of volunteering is twofold. For some volunteers, physical safety concerns dampen motivation to participate (Gunessee et al., Reference Gunessee, Subramanian, Roscoe and Ramanathan2018; Rosychuk et al., Reference Rosychuk, Bailey, Haines, Lake, Herman, Yonge and Marrie2008; Shi et al., Reference Shi, Wei, Gao, Kang, Ning, Liu, Liang, Sun, Jiao and Liang2018). However, the concept of edgework emphasizes that some volunteers are motivated by the challenge of overcoming their physical and mental limitations and seek personal growth and self-realization through this process (Lois, Reference Lois1999; Lyng, Reference Lyng1990). The empirical results reflect this dualism and also confirm the buffering role of mutual trust in bridging the gap by minimizing differences in motivation and participation between risk-tolerant and risk-averse volunteers.
Contributions
The results are in line with the empirical and theoretical literature that highlights functions of trust under conditions of risk and uncertainty. While the results offer few theoretical surprises, they present strong evidence of mutual trust’s critical role in an environment where risk is present. Trust does not necessarily lead to a lower perception of risk, which can be undesirable and counterproductive, but functions as a psychological buffer that enables volunteers to engage with risks confidently. Trust is particularly important for maintaining the motivation of risk-averse volunteers, and less so for volunteers with a higher risk tolerance, some of whom are motivated by the thrill of the activity and the opportunity to manage risk.
The findings suggest that camaraderie, team cohesion, and social solidarity, fostered by extensive training and shared challenging experiences (Henderson & Sowa, Reference Henderson and Sowa2023), promote the perception of a safe environment in which risky activities become manageable. The finding that perceived mutual trust reinforces the moderating effect of trust alone underscores the need to move beyond trustor-centric models––a key contribution of the second wave of empirical research on trust within organizations that gained momentum around 2010 (Dirks & de Jong, Reference Dirks and de Jong2022, p. 260). Trust needs to be analyzed as a bidirectional phenomenon to fully understand its implications.
Practical Implications
For SAR practitioners, the findings underline that fostering and maintaining an environment of strong mutual trust makes volunteers with a more conservative attitude to risk feel more comfortable participating. This is of utmost importance both for recruitment and organizational culture. Therefore, volunteer organizations in SAR should also pay attention to factors that could undermine this trust. Some further observations from the data suggest potential areas for improvement.
First, while the volunteers generally rated the training and preparation level positively, only one-in-five agreed that exercises with the police and other authorities were sufficiently frequent (see Table 5). Given the strong theoretical (minimizing risk and uncertainty) and empirically observed link between preparation and trust, as well as SAR’s collaborative nature, neglecting this area could elicit detrimental effects. Second, the correlations in Table 1 suggest that trust and motivation decrease somewhat over the course of a volunteer’s tenure. SAR volunteering is a demanding activity; therefore, additional demands, such as more intensive training, must be weighed against the risk of volunteer burnout. In a qualitative study of Norwegian SAR volunteers, stress and overload due to both internal (excessive demands and conflicts) and external (life-volunteering balance) factors were identified as potential threats to willingness to participate over time (Gjerde & Winsvold, Reference Gjerde and Winsvold2016).
Overall, high trust and motivation levels, as well as diversity in risk attitudes, indicate that the organizations studied already are doing well in this regard. SAR organizations minimize the risk of physical injury through rigorous training and preparation systems, demonstrate a strong awareness of risk management, and take a conservative approach to risk. However, this approach likely will be challenged in the near future as climate-related hazards become more pressing. Future SAR missions could involve greater risks for volunteers, who would need to take on more specialized tasks, such as in the case of forest fires, which are expected to become more frequent (Hårsåker et al., Reference Hårsåker, Karmhus, Wøien and Winsvold2023; Log et al., Reference Log, Vandvik, Velle and Metallinou2020). Therefore, as the pressure on SAR operations is likely to increase, maintaining trust could become even more important in the future.
Limitations
The study has some limitations. First, its correlational nature limits any causal inferences. Second, the survey instrument was designed to cover a wide range of topics; therefore, the ability to construct scales with multiple items and high measurement validity was limited, requiring that we rely on single-item measures. Third, low trust was almost absent in the data, so the analysis was limited to comparing volunteers with moderate and very high trust levels. Fourth, different sampling strategies were used for SAR volunteers (mailing lists of organizations) and the general population (stratified samples of web panel participants). The SAR survey may be subject to response bias, as more motivated or risk-tolerant volunteers may have been more likely to participate. Finally, the SAR data only includes active volunteers who have passed the hurdle of joining an organization. Thus, the study cannot distinguish the factors that influence recruitment (e.g., initial trust in the organization) from those that influence participation in missions (e.g., trust between volunteers). Future research should investigate in more detail how risk aversion and trust affect these two phases differently.
Suggestions for Future Research
Voluntary participation in SAR missions provides fertile ground for understanding the role of trust in sustaining motivation. Beyond addressing the methodological shortcomings discussed, future research should investigate whether the observed dynamics vary between different organizational cultures and leadership styles, such as transformational leadership, which has been shown to improve group cohesion in high-risk volunteering (Henderson & Sowa, Reference Henderson and Sowa2023).
Future research should also investigate the extent to which the patterns observed in this study apply to other volunteering contexts. As mentioned in the introduction, the sometimes physically demanding nature of the Norwegian SAR missions may limit the generalizability of our findings. Future research should investigate whether trust has similar effects in lower risk but similarly high-stakes contexts, such as emergency medical services, or SAR missions in less demanding terrain.
Finally, trust can also affect outcomes other than motivation, such as burnout and mental health. Given the increasing concern about the mental health of first responders and SAR personnel in the research literature and among practitioners (Berger et al., Reference Berger, Coutinho, Figueira, Marques-Portella, Luz, Neylan, Marmar and Mendlowicz2012; Köse, Reference Köse2023; Thormar et al., Reference Thormar, Gersons, Juen, Djakababa, Karlsson and Olff2013), future research should examine whether relationships of trust can mitigate the psychological demands of SAR work and thus potentially reduce burnout and negative mental health outcomes.
Funding
Open access funding provided by Institute for Social Research. Funding was provided by Norges Forskningsråd, 296064.
Declarations
Conflict of interest
The author declares no conflicts of interest.
Appendix
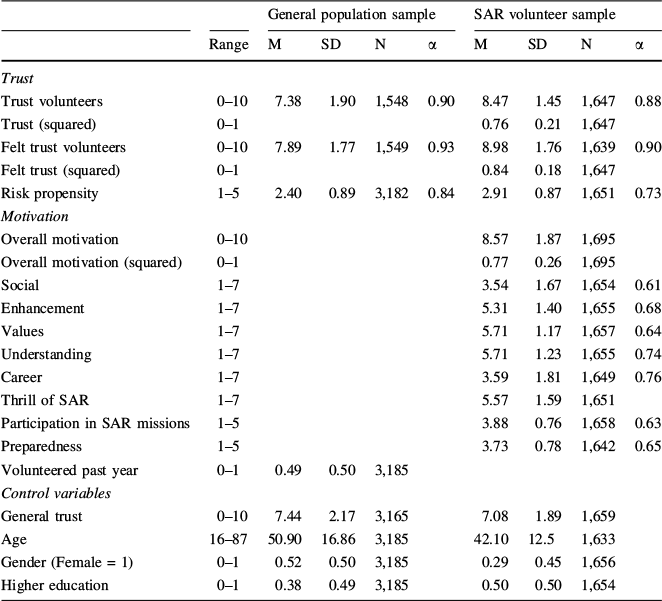
Table 3 Descriptive statistics

General population sample |
SAR volunteer sample |
||||||||
|---|---|---|---|---|---|---|---|---|---|
Range |
M |
SD |
N |
α |
M |
SD |
N |
α |
|
Trust |
|||||||||
Trust volunteers |
0–10 |
7.38 |
1.90 |
1,548 |
0.90 |
8.47 |
1.45 |
1,647 |
0.88 |
Trust (squared) |
0–1 |
0.76 |
0.21 |
1,647 |
|||||
Felt trust volunteers |
0–10 |
7.89 |
1.77 |
1,549 |
0.93 |
8.98 |
1.76 |
1,639 |
0.90 |
Felt trust (squared) |
0–1 |
0.84 |
0.18 |
1,647 |
|||||
Risk propensity |
1–5 |
2.40 |
0.89 |
3,182 |
0.84 |
2.91 |
0.87 |
1,651 |
0.73 |
Motivation |
|||||||||
Overall motivation |
0–10 |
8.57 |
1.87 |
1,695 |
|||||
Overall motivation (squared) |
0–1 |
0.77 |
0.26 |
1,695 |
|||||
Social |
1–7 |
3.54 |
1.67 |
1,654 |
0.61 |
||||
Enhancement |
1–7 |
5.31 |
1.40 |
1,655 |
0.68 |
||||
Values |
1–7 |
5.71 |
1.17 |
1,657 |
0.64 |
||||
Understanding |
1–7 |
5.71 |
1.23 |
1,655 |
0.74 |
||||
Career |
1–7 |
3.59 |
1.81 |
1,649 |
0.76 |
||||
Thrill of SAR |
1–7 |
5.57 |
1.59 |
1,651 |
|||||
Participation in SAR missions |
1–5 |
3.88 |
0.76 |
1,658 |
0.63 |
||||
Preparedness |
1–5 |
3.73 |
0.78 |
1,642 |
0.65 |
||||
Volunteered past year |
0–1 |
0.49 |
0.50 |
3,185 |
|||||
Control variables |
|||||||||
General trust |
0–10 |
7.44 |
2.17 |
3,165 |
7.08 |
1.89 |
1,659 |
||
Age |
16–87 |
50.90 |
16.86 |
3,185 |
42.10 |
12.5 |
1,633 |
||
Gender (Female = 1) |
0–1 |
0.52 |
0.50 |
3,185 |
0.29 |
0.45 |
1,656 |
||
Higher education |
0–1 |
0.38 |
0.49 |
3,185 |
0.50 |
0.50 |
1,654 |
||
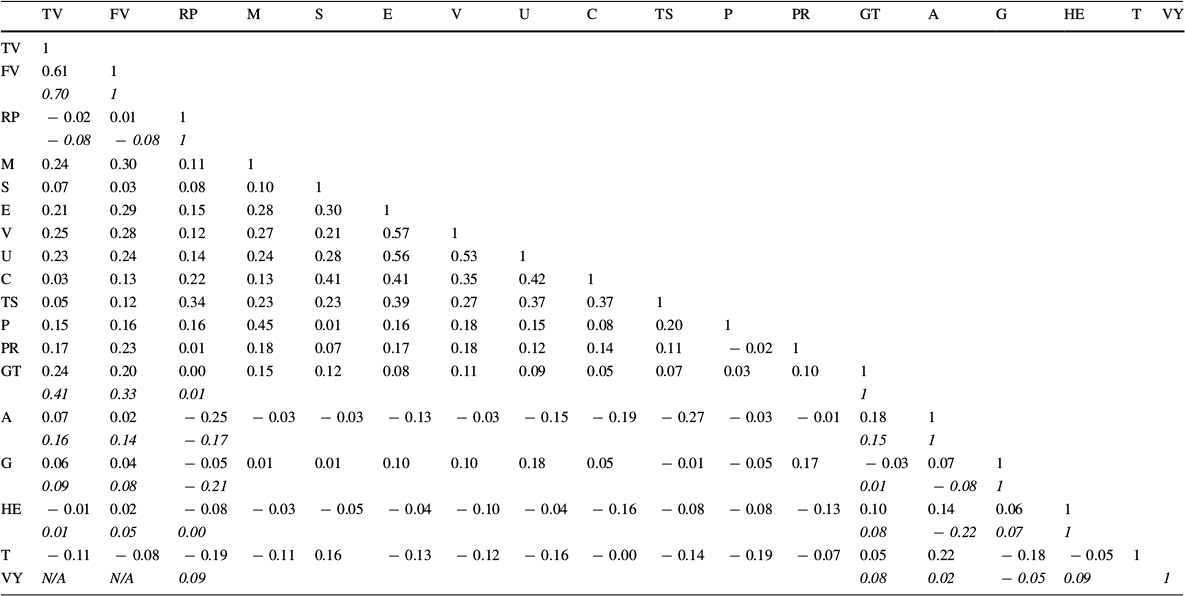
Table 4 Correlations. Pearson’s r
TV |
FV |
RP |
M |
S |
E |
V |
U |
C |
TS |
P |
PR |
GT |
A |
G |
HE |
T |
VY |
|
|---|---|---|---|---|---|---|---|---|---|---|---|---|---|---|---|---|---|---|
TV |
1 |
|||||||||||||||||
FV |
0.61 |
1 |
||||||||||||||||
0.70 |
1 |
|||||||||||||||||
RP |
− 0.02 |
0.01 |
1 |
|||||||||||||||
− 0.08 |
− 0.08 |
1 |
||||||||||||||||
M |
0.24 |
0.30 |
0.11 |
1 |
||||||||||||||
S |
0.07 |
0.03 |
0.08 |
0.10 |
1 |
|||||||||||||
E |
0.21 |
0.29 |
0.15 |
0.28 |
0.30 |
1 |
||||||||||||
V |
0.25 |
0.28 |
0.12 |
0.27 |
0.21 |
0.57 |
1 |
|||||||||||
U |
0.23 |
0.24 |
0.14 |
0.24 |
0.28 |
0.56 |
0.53 |
1 |
||||||||||
C |
0.03 |
0.13 |
0.22 |
0.13 |
0.41 |
0.41 |
0.35 |
0.42 |
1 |
|||||||||
TS |
0.05 |
0.12 |
0.34 |
0.23 |
0.23 |
0.39 |
0.27 |
0.37 |
0.37 |
1 |
||||||||
P |
0.15 |
0.16 |
0.16 |
0.45 |
0.01 |
0.16 |
0.18 |
0.15 |
0.08 |
0.20 |
1 |
|||||||
PR |
0.17 |
0.23 |
0.01 |
0.18 |
0.07 |
0.17 |
0.18 |
0.12 |
0.14 |
0.11 |
− 0.02 |
1 |
||||||
GT |
0.24 |
0.20 |
0.00 |
0.15 |
0.12 |
0.08 |
0.11 |
0.09 |
0.05 |
0.07 |
0.03 |
0.10 |
1 |
|||||
0.41 |
0.33 |
0.01 |
1 |
|||||||||||||||
A |
0.07 |
0.02 |
− 0.25 |
− 0.03 |
− 0.03 |
− 0.13 |
− 0.03 |
− 0.15 |
− 0.19 |
− 0.27 |
− 0.03 |
− 0.01 |
0.18 |
1 |
||||
0.16 |
0.14 |
− 0.17 |
0.15 |
1 |
||||||||||||||
G |
0.06 |
0.04 |
− 0.05 |
0.01 |
0.01 |
0.10 |
0.10 |
0.18 |
0.05 |
− 0.01 |
− 0.05 |
0.17 |
− 0.03 |
0.07 |
1 |
|||
0.09 |
0.08 |
− 0.21 |
0.01 |
− 0.08 |
1 |
|||||||||||||
HE |
− 0.01 |
0.02 |
− 0.08 |
− 0.03 |
− 0.05 |
− 0.04 |
− 0.10 |
− 0.04 |
− 0.16 |
− 0.08 |
− 0.08 |
− 0.13 |
0.10 |
0.14 |
0.06 |
1 |
||
0.01 |
0.05 |
0.00 |
0.08 |
− 0.22 |
0.07 |
1 |
||||||||||||
T |
− 0.11 |
− 0.08 |
− 0.19 |
− 0.11 |
0.16 |
− 0.13 |
− 0.12 |
− 0.16 |
− 0.00 |
− 0.14 |
− 0.19 |
− 0.07 |
0.05 |
0.22 |
− 0.18 |
− 0.05 |
1 |
|
VY |
N/A |
N/A |
0.09 |
0.08 |
0.02 |
− 0.05 |
0.09 |
1 |
Coefficients in italics refer to general population survey. TV = Trust Volunteers (0–10), FV = Felt Trust Volunteers (0–10), RP = Risk propensity (1–5), M = Overall Motivation (0–10). Motivation scales (1–7): S = Social, E = Enhancement, V = Values, U = Understanding, C = Career, TS = Thrill of SAR. P = Participation (1–5), PR = Preparedness (1–5), GT = General trust (0–10), A = Age (16–87), G = Gender (Female = 1), HE = Higher education (0–1), T = Tenure (1–3), VY = Volunteered past year
Table 5 Interaction risk propensity, trust, and felt trust (Figs. 3 and 4). OLS regression with robust standard errors

Dependent variable |
Motivation |
Participation |
Motivation |
Participation |
|---|---|---|---|---|
Model |
1a |
1b |
2a |
2b |
b (SE) |
b (SE) |
b (SE) |
b (SE) |
|
Risk propensity |
0.10*** |
0.10*** |
− 0.07 |
− 0.13 |
(0.03) |
(0.03) |
(0.10) |
(0.30) |
|
Trust volunteers |
0.55*** |
0.55*** |
− 0.75 |
− 1.33 |
(.12) |
(0.12) |
(0.52) |
(1.47) |
|
Felt trust |
− 0.06 |
− 0.79 |
||
(0.39) |
(1.25) |
|||
Risk propensity * trust |
− 0.10** |
− 0.10** |
0.31 |
0.63 |
(0.04) |
(0.04) |
(0.17) |
(0.46) |
|
Risk propensity * felt trust |
0.17 |
0.47 |
||
(0.12) |
(0.40) |
|||
Trust * felt trust |
1.13* |
2.48 |
||
(0.56) |
(1.71) |
|||
Risk propensity * trust * felt trust |
− 0.43* |
− 0.95 |
||
(0.18) |
(0.54) |
|||
Age |
0.001 |
0.001 |
0.001 |
0.000 |
(0.001) |
(0.001) |
(0.002) |
(0.002) |
|
Gender (Female = 1) |
− 0.003 |
− 0.12*** |
− 0.005 |
− 0.12*** |
(0.01) |
(0.04) |
(0.01) |
(0.04) |
|
Higher education |
− 0.02 |
− 0.16*** |
− 0.02 |
− 0.17*** |
(0.01) |
(0.04) |
(0.01) |
(0.04) |
|
Tenure |
− 0.03** |
− 0.10** |
− 0.03*** |
− 0.09** |
(0.01) |
(0.03) |
(0.01) |
(0.03) |
|
Preparedness |
0.03** |
− 0.02 |
0.02 |
− 0.04 |
(0.01) |
(0.03) |
(0.01) |
(0.03) |
|
Generalized trust |
0.01** |
0.007 |
0.009* |
0.005 |
(0.004) |
(0.01) |
(0.004) |
(0.01) |
|
NPA |
− 0.003 |
0.09 |
0.002 |
0.10 |
(0.015) |
(0.05) |
(0.015) |
(0.05) |
|
NARG |
− 0.10*** |
0.19** |
− 0.08*** |
0.21** |
(0.02) |
(0.06) |
(0.02) |
(0.07) |
|
Constant |
0.15 |
3.05*** |
0.47 |
3.96*** |
(0.06) |
(0.31) |
(0.32) |
(0.96) |
|
r2 |
0.11 |
0.07 |
0.16 |
0.07 |
N |
1537 |
1537 |
1527 |
1595 |


 Open access