


Introduction
The onset of the Iron Age in the Western Iberian Peninsula, particularly in the vicinity of the Tagus Estuary, is marked by the permanent establishment of Phoenician communities. This pivotal event catalyzed a myriad of changes evident across various facets of the archaeological record compared to preceding epochs, spanning from material culture to funerary practices, through alterations in architectural structures, settlement patterns, and subsistence strategies, among other dimensions (Arruda Reference Arruda2000; Sousa Reference Sousa2016, Reference Sousa2023).
Within this context, the significance of the Iron Age occupation of Lisbon gains unique importance, as the São Jorge Castle hill (Figure 1), nestled within the present-day historical district of the city, appears to have been the primary area selected by Phoenician communities for permanent settlement at the Tagus River mouth. Recent data gathered through urban archaeology endeavors have unveiled the earliest contexts linked to a permanent presence of these external groups at the base of the hill, within the confines of the current Aurea Museum Hotel (former Sommer Warehouses). This initial Phoenician phase is characterized by the city’s first orthogonal structures, potentially of a defensive nature, alongside port-related constructions, which are associated with material assemblages dating to the latter half of the 8th century BCE, according to conventional chronology (Sousa et al. Reference Sousa, Ribeiro, Rebelo and Neto2024). However, it is primarily from the 7th century BCE onward that this nucleus experiences substantial expansion, extending into higher elevations of the hill, configuring a distinctly urban landscape spanning an area of 15 to 20 hectares (Sousa Reference Sousa2014).

Figure 1. Location of Largo de Santa Cruz do Castelo (Saint George’s Castle Hill, Lisbon, Portugal).
Preventive excavations conducted at Largo de Santa Cruz do Castelo 6-7 yielded an extensive sequence of material and stratigraphic data corroborating this interpretation. Located atop the São Jorge Castle hill, the site had archaeological interventions in multiple sectors within the current building, reaching bedrock in specific areas. The excavations, directed by one of the authors (S.G.), facilitated the reconstruction of Iron Age stratigraphic sequences in this important site, with a significant portion of associated findings already published (Sousa and Guerra Reference Sousa and Guerra2018, Reference Sousa and Guerra2023). In essence, the human occupation in the area appears to have commenced no earlier than the 7th century BCE, a time frame aligned with the construction of several architectural elements, persisting at least until the 5th/4th century BCE, as inferred from recovered contextual evidence. Chronological data supporting the temporal definition of Iron Age phases in Lisbon, alongside other regions within the Tagus Estuary, primarily rely on typologies of material culture and their contextual correlations.
Absolute dating for the region, especially for Lisbon, remains conspicuously scarce. To this day, only three absolute dates, derived from a charred wood samples retrieved from Rua da Judiaria, associated with materials from the 7th and 6th centuries BCE (Calado et al. Reference Calado, Almeida, Leitão and Leitão2013), have been published. Within this framework, the data presented in this study represent a substantial stride in establishing absolute chronological boundaries for Iron Age occupation in Lisbon, even if their significance is substantially circumscribed by the phenomenon recognized as the Iron Age catastrophe (Soares and Arruda Reference Soares and Arruda2017). The ten radiocarbon dates presented in this paper for Largo de Santa Cruz, derived from samples of mammalian fauna and human remains, stem from a recent doctoral project (Paladugu Reference Paladugu2023) and UNIARQ-funded research, offering insights into the varied phases of occupation within the stratigraphic sequence of the Iron Age at Largo de Santa Cruz do Castelo.
Methodological aspects of 14C dating
Without renouncing classical dating based on ceramics, radiocarbon is one of the techniques par excellence in chronology, being a tool widely used in recent prehistory for depositional contexts in which we locate ancient organic remains.
Calibration is essential in radiocarbon dating to correct for natural and anthropogenic variations in atmospheric 14C concentrations, as well as to account for the initial inaccurate Libby half-life. Since the introduction of the first broadly applicable calibration curve in 1986 (Pearson and Stuiver Reference Pearson and Stuiver1986; Stuiver and Pearson Reference Stuiver and Pearson1986), a series of updated curves have been developed (Reimer Reference Reimer2022), greatly enhancing the precision of radiocarbon dating. However, rather than resolving all interpretive challenges, calibration has highlighted issues such as wiggles, plateaus, and reservoir effects, which complicate the calibration process and must be carefully addressed (Bronk Ramsey et al. Reference Bronk Ramsey, van der Plicht and Weninger2001; Taylor et al. Reference Taylor, Stuiver and Reimer1996, 661–662). For instance, a cluster of 14C dates that coincides with a plateau in the calibration curve can yield calendar age ranges extending beyond what would be expected based solely on the statistical uncertainty of the measurements (Guilderson et al. Reference Guilderson, Reimer and Brown2005). Despite continuous improvements in laboratory techniques and an increased focus on sampling short-lived materials (e.g., seeds), such issues persist even for dates with small uncertainties (25–35 years) and become more pronounced with larger errors.
The Hallstatt Plateau
In this regard, the de Vries IIIb disturbance/effect (Taylor et al. Reference Taylor, Stuiver and Reimer1996, 663), commonly referred to as the Hallstatt Plateau, located circa 800–400 BCE, is one of the regions of the calibration curve (Reimer et al. Reference Reimer, Austin, Bard, Bayliss, Blackwell, Ramsey, Butzin, Cheng, Edwards and Friedrich2020) that has been particularly problematic since it involves radiocarbon dating in a period of significant technological change and, in more specific terms, for the Iron Age I. This phenomenon is associated with solar variations, to which are added astronomical ones that affect the Sun cosmic radiation. Consequently, the concentration of 14C in our atmosphere directly impacts the series of calibration curves, specifically for the period of study, and we can find their discussion in Scafetta et al. (Reference Scafetta, Milani, Bianchini and Ortolani2016).
Such has been the impact of this problem in the field of radiocarbon dating that many authors have called it “the 1st millennium BCE radiocarbon disaster” or “a catastrophe for Late Bronze/Iron Age radiocarbon dating in archaeology” (Baillie et al. Reference Baillie, Pilcher, Ottaway and Ottaway1983). This impact on research is not only European but is a global problem in both hemispheres in the field of radiocarbon chronology research affecting Asia (Higham and Higham Reference Higham and Higham2009), South America (Higham and Higham Reference Higham and Higham2009) or China (Yu et al. Reference Yu, Chen, Fang, Liu, Li and Guo2021). In each new version of the calibration curve series, due to advances in the field of dendrochronology, there are improvements in specific aspects of this crucial period for the study of European pre and protohistory. In addition, the selection of short-lived samples such as seeds or domestic herbivorous species, as well as advances in 14C measurement by AMS and the use of statistical tools such as Bayesian analysis, provide solutions that, although not complete, help to resolve the chronology of this complex period. For our specific field of study, within the method’s limitations, we are forced to work with dates that, presumably, will fall within the Hallstatt Plateau.
Stable isotopes: Dietary factors
Reconstructing ancient diets through stable isotope analyses began in the late 1970s (DeNiro and Epstein Reference DeNiro and Epstein1978; Van der Merwe and Vogel Reference Van der Merwe and Vogel1978) on the principle of ‘you are what you eat’. These methods have also been applied to determine diet, subsistence, and social structure (Murray and Schoeninger Reference Murray, Schoeninger, Gibson and Geselowitz1988). Stable isotope analysis of collagen can provide valuable insights into dietary protein sources (Kohn Reference Kohn1999; O’Connell Reference O’Connell2023). Carbon and nitrogen isotopes (δ13C and δ15N) have been widely used to determine if the protein source is terrestrial or marine from the possible trophic chains of plant consumption, as well as the trophic level, distinguishing between herbivores, omnivores, and carnivores (Ambrose Reference Ambrose1991, Reference Ambrose and Sandford1993; Bocherens and Drucker Reference Bocherens and Drucker2003; Reitsema Reference Reitsema2013). For humans, the natural abundance of stable isotopes and their incorporation into human tissues is a fundamental factor in the study of diet (DeNiro and Epstein Reference DeNiro and Epstein1978, Reference Deniro and Epstein1981; Chisholm et al. Reference Chisholm, Nelson and Schwarcz1982; DeNiro Reference DeNiro1987; Pate Reference Pate1998; Katzenberg and Waters-Rist Reference Katzenberg and Waters-Rist2018), this being the basic concept for diet reconstruction based on the stable isotopes of carbon and nitrogen analysed in human bone collagen (Honch et al. Reference Honch, Higham, Chapman, Gaydarska and Hedges2006; Müldner and Richards Reference Müldner and Richards2005; Richards et al. Reference Richards, Pettitt, Trinkaus, Smith, Paunović and Karavanić2000; Schwarcz and Schoeninger Reference Schwarcz and Schoeninger1991; Van Der Merwe et al. Reference Van Der Merwe, Tykot, Hammond, Oakberg, Ambrose and Katzenberg2002).
The δ13C isotope values are characteristic for C3, C4 or CAM (crassulacean acid metabolism) photosynthetic pathways of terrestrial plants (Schoeninger and DeNiro Reference Schoeninger and DeNiro1984; Ambrose Reference Ambrose and Sandford1993; Froehle et al. Reference Froehle, Kellner and Schoeninger2012). There is a shift of 0–2‰ in δ13C values of bone collagen between trophic levels from prey to predator (Bocherens and Drucker Reference Bocherens and Drucker2003). δ13C values of the inorganic apatite of bones and teeth are reflective of the whole dietary composition that includes proteins, carbohydrates and lipids (Ambrose and Norr Reference Ambrose, Norr, Lambert and Grupe1993; Lee-Thorp et al. Reference Lee-Thorp, Sealy and van der Merwe1989). On the other hand, δ15N isotope values of bone collagen increases by approximately +3–5‰ in each successive trophic level (Hedges et al. Reference Hedges, Stevens, Koch and Leng2006; Hedges and Reynard Reference Hedges and Reynard2007 Schoeninger and DeNiro Reference Schoeninger and DeNiro1984). The combination of δ13C and δ15N can also be used to estimate consumption and proportions of marine protein (DeNiro and Epstein Reference DeNiro and Epstein1978; Mays Reference Mays1997). δ13C and δ15N are also sensitive to several factors, such as the type of essential plant diet, predominantly C3/C4 (as discussed above), but also to latitude and humidity/aridity of the area (Bird et al. Reference Bird, Crabtree, Haig, Ulm and Wurster2021). Added to this is the influence of the physiological processes, which vary depending on the analyzed part. In this sense, for example, there is a north–south gradient for δ13C values for land plants and animals. For humans, there is a tendency for northern Europe to be 1–2 times lower than in southern Europe (Van Klinken et al. Reference Van Klinken, Richards, Hedges, Ambrose and Katzenber2002). For calibrating radiocarbon data of human/animal samples with a possible protein contribution from marine origin, it is first necessary to establish the isotope value limits representing totally terrestrial and totally marine protein sourcing. The isotope value limits will allow us to establish the percent protein contribution of marine origin and, therefore, the percent contribution of the marine calibration curve to be used in the calibration.
Descriptive background
Iron Age chronology of Largo de Santa Cruz do Castelo 6–7
The establishment of chronological sequences for the early phases of the Iron Age in the Mediterranean is a particularly complex subject. This complexity arises from ongoing discrepancies between archaeometric dating and the chronology derived from archaeological stratigraphy and ceramic material seriations, which remain to be fully resolved (Doumet-Serhal et al. Reference Doumet-Serhal, Gimatzidis, Weninger, Rüden and Kopetzky2023; Gimatzidis Reference Gimatzidis, Gimatzidis and Jung2021; López Castro et al. Reference López Castro, Ferjaoui, Mederos Martín, Martínez Hahnmüller and Ben Jerbania2016; Nijboer and van der Plicht Reference Nijboer and van der Plicht2006). While this problem affects various Mediterranean regions and the southern Iberian Peninsula—where the circulation of ceramic “fossil guides,” particularly Greek Geometric productions, facilitates some chronological correlations between different contexts—the situation is even more challenging in the Atlantic Far West, where such materials are entirely absent to date.
In Portugal, the archaeological chronology for the initial stages of the Iron Age relies primarily on imports from the Phoenician colonies in southern Iberia. The chronological sequence of these imports is established based mainly on stratigraphic data and their occasional association with artifacts dated directly or indirectly through seriations constructed for the Central and Western Mediterranean. Additionally, the Phoenician colonization of Lisbon and the Lower Tagus region involved the transfer of Mediterranean specialists and technologies applied to pottery production (Figure 2). Beginning in the 7th century BCE, this process initiated a distinct production sphere that initially replicated prototypes of transport containers, table and plain wares from the Andalusian Phoenician colonies. However, these productions quickly developed unique characteristics that distinguish them from other contemporary horizons (Sousa Reference Sousa2016). The sequencing and evolution of different Tagus-region morphologies are, so far, based solely on known stratigraphic data.

Figure 2. Material culture recovered in the contexts of Largo de Santa Cruz which provided the samples.
An opportunity arose to address these issues when a specific sector from archaeological interventions at Largo de Santa Cruz do Castelo revealed a stratigraphic sequence spanning from the 7th century BCE to the mid-1st millennium BCE, accompanied by significant material remains (Sousa and Guerra Reference Sousa and Guerra2018). In this stratigraphic sequence, there is a clear predominance of the Phoenician cultural matrix. This is evident both at the technological level—with most ceramics being wheel-thrown and fired in double-chamber kilns, techniques previously unknown in the region prior to Phoenician colonization, and at the formal level, with well-defined categories including red-slip and grey table wares, storage vessels (pithoi), cooking pots, and transport containers (Sousa and Guerra Reference Sousa and Guerra2018). These forms largely reproduce prototypes found in other Phoenician influenced regions of southern Iberia and the broader Mediterranean basin. However, despite their typological affinities, most of these ceramics were already produced in the Tagus area (Ferreira et al. Reference Ferreira, de Sousa, Pereira, Guerra and Machado2020), fulfilling the daily functional needs of the resident communities while simultaneously supporting exchange networks with neighboring groups (Sousa Reference Sousa2016). In addition to these dominant assemblages, smaller quantities of handmade ceramics following Late Bronze Age traditions were also recovered, suggesting the active involvement of indigenous groups in the cultural and economic dynamics of Iron Age Lisbon (Sousa Reference Sousa2023).
The archaeological excavations undertaken at Largo de Santa Cruz do Castelo (n. 6-7) were conducted within the scope of a building remodeling project and were heavily influenced by the construction endeavors. Indeed, the excavation efforts were distributed across various building sectors, occurring over different periods, with the interpretation of data further influenced by the segmentation resulting from subsequent constructions, particularly those from the modern and contemporary eras. One crucial sector, identified as Logradouro-Casa das Máquinas/Caixa de Drenagem, yielded a relatively well-preserved stratigraphic sequence spanning from the 7th century to the mid-1st millennium BCE (Sousa and Guerra Reference Sousa and Guerra2018), a pattern later confirmed in other sections (Sousa and Guerra Reference Sousa and Guerra2023).
The excavation reached the limestone geological substrate and documented five phases of the Iron Age occupation, labelled Phases 1 to 5 (detailed descriptions provided in Sousa and Guerra (Reference Sousa and Guerra2018)). Phase 1 involved the deposition of various sediments aimed at ground leveling for construction purposes (Stratigraphic Units (henceforth referred with the prefix U.E.) [11=22], [33], and [35]), including the burial of an infant (U.E. [36]), likely associated with foundational rituals (Figure 3). A rudimentary floor of beaten earth and small pebbles (U.E. [34]) was laid atop these layers, along with a basic masonry structure. Phase 2 represented a mere remodeling of the space, introducing a new pavement (U.E. [25]) and areas of combustion (U.E.s [27], [28], [29], [30]), followed by abandonment, possibly marked by structural collapse (U.E. [10=26]). The material culture from Phases 1 and 2 suggests a timeline around the 7th century BCE. Phases 3 (U.E. [9=21]) and 4 (U.E. [8=18]) appeared to primarily consist of infill layers likely formed during the 6th century BCE (Figure 3). The final documented phase, Phase 5, represented a subsequent occupation period characterized by a negative structure (U.E.s [19], [20]) and sedimentary deposits (U.E. [15]), dating materially to the mid-1st millennium BCE.

Figure 3. Harris matrix (a) and the stratigraphic profile (b) of Largo de Santa Cruz, illustrating the spatial context of sampled units, including fill layers, ceramic concentrations, and combustion areas in relation to bedrock. Colored stars correspond to sample locations in both the matrix and profile.
When addressing the temporality of the stratigraphy of any archaeological site and its radiocarbon correspondence, it is crucial to consider the formation of the archaeological record itself. In urban spaces, particularly those with dense and long-term occupation, such as the hill of São Jorge Castle in Lisbon, it is common to encounter the removal and deposition of sediments resulting from intense anthropogenic activity. In this specific case, such activity has persisted uninterruptedly for the past three millennia. These processes can lead to the incorporation of exogenous materials into contexts associated with the formation of specific archaeological deposits. Such situations must be approached with caution and a critical perspective, analyzing all contributing factors collectively. In some cases, this may highlight discrepancies between the actual dating of the deposit, conventional dating based on material culture, and radiocarbon dating. Reconciling these different dating methods is essential for establishing chronology.
In the case of the data collected at Largo de Santa Cruz do Castelo, we have non-domestic samples that may not be directly associated with human consumption, such as the three samples of Cervus elaphus. However, the context of their recovery suggests the possibility of their presence being linked to hunting activities, which likely played a role in the economic practices of the inhabitants of this area during the Iron Age. Additionally, we have domestic samples, all of which, like the non-domestic ones, are found in these same contexts, and may relate to discards related to food diets of this community. On the other hand, there are two human samples located in primary deposits, considering that their deposition seems to have been directly associated with foundational rituals marking significant moments in the construction sequence of the site, specifically the early stages of human occupation in U.E. [36] and the beginnings of Roman urban development observed in U.E. [26].
Sampling strategy
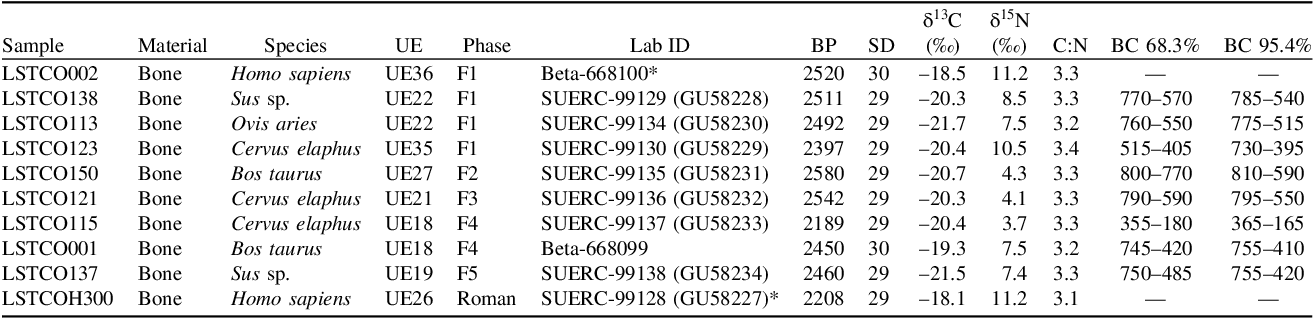
A total of ten bone samples, distributed as follows: 3 from Cervus elaphus, two from Sus sp., one from Ovis aries, two from Bos taurus and two from Homo sapiens, both infants (Table 1), were selected for the study. Samples from Phase 1 include remains from the infant burial (U.E. [36]), bones of Sus sp. and Ovis aries (both from U.E. [22]), and a bone of Cervus elaphus (U.E. [35]); Phase 2 includes a bone of Bos taurus (U.E. [27]); Phase 3 features a bone of Cervus elaphus (U.E. [21]); Phase 4 include bones of Cervus elaphus and Bos taurus (U.E. [18]); and Phase 5 involves a bone of Sus sp. (U.E. [19]). The exception pertains to another child burial discovered in a separate area of the building excavation (Edifício 2 – Sala 1 - U.E. [26]). Due to insufficient stratigraphic data stemming from challenging reading conditions, this burial was also subjected to radiocarbon dating.
Table 1. Samples from Largo de Santa Cruz do Castelo. Date calibrations are shown without reservoir effect since the samples were taken on humans

*Note: Both Beta-66100 and SUERC-99128 (GU58227) samples have δ13C and δ15N isotope values that suggest a possible reservoir effect that we will discuss in the following sub-section.
Collagen preservation criteria namely percentage of carbon by weight (%C), percentage of nitrogen by weight (%N) and C:N ratio are excellent tools to prescreen samples for radiocarbon dating (Ambrose Reference Ambrose1990; Ambrose and Norr Reference Ambrose, Norr, Lambert and Grupe1993; van Klinken Reference van Klinken1999). The human and faunal bones (except LSTCO001) sent for radiocarbon dating were selected based on prior successful collagen extraction for stable isotope analysis (Paladugu Reference Paladugu2023). The selected bone subsamples yielded collagen greater than 1% (w/w) (van Klinken Reference van Klinken1999) and the elemental analysis of the extracted collagen had carbon content (wt%) between 15.3% and 47.0%, nitrogen content (wt%) between 5.5% and 17.3% (Ambrose Reference Ambrose1990), C:N values between 3.15 and 3.50 (conservative upper limit with 0.5% tolerance) (Guiry and Szpak Reference Guiry and Szpak2021).
Radiocarbon dating
Intact bone samples were submitted for radiocarbon dating to Beta Analytic Inc. and the SUERC: Centre for Isotope Research (University of Glasgow, UK), with laboratory-specific protocols detailed in Dunbar et al. (Reference Dunbar, Cook, Naysmith, Tripney and Xu2016) and Carbon Dating, Stable Isotope Analysis Bones – Beta Analytic (2015) respectively. Sample pretreatment was carried out following the process in Brock et al. (Reference Brock, Higham, Ditchfield and Ramsey2010). The general approach of both the laboratories follows the standard method for bone collagen, a modified Longin method (Longin Reference Longin1971) where a bone subsample (0.5–4 g) is demineralized using HCl solution. After demineralization, the acid is removed and the collagen pseudomorph is rinsed with ultrapure water. A washing step, using NaOH solution, to remove alkali-soluble contaminants such as humic acids is carried out. This alkali washing step is a part of the routine protocol at Beta Analytic while at SUERC this is optional. The collagen is then gelatinized by heating the sample in ultrapure water at 80°C for 3 hr. The collagen solution is then dried down and freeze-dried to obtain a whitish crystalline powder and subsequently dated. Table 1 summarizes the radiocarbon data obtained from Largo Santa Cruz do Castelo.
Radiocarbon calibration
Two of the first-order problems related to Iron Age I at coastal sites for radiocarbon will be addressed. Firstly, the effects of the so-called 1st millennium disaster or Hallstatt Plateau in which the dating of the studied period is framed in great uncertainty, and secondly, originated by the type of sample and area: the so-called reservoir effect that affects samples with marine diet contribution whose dates become significantly older and require special treatment (such as samples of human origin in our case).
Regarding the technical methodological aspects for the chronological analyses, we have used the Oxcal 4.4.4 software (Bronk Ramsey Reference Bronk Ramsey1994, Reference Bronk Ramsey1995, Reference Bronk Ramsey2001, Reference Bronk Ramsey2008a, Reference Bronk Ramsey2008b, Reference Bronk Ramsey2009a, Reference Bronk Ramsey2009b, Reference Bronk Ramsey2017) using the IntCal20 terrestrial calibration curve (Reimer et al. Reference Reimer, Austin, Bard, Bayliss, Blackwell, Ramsey, Butzin, Cheng, Edwards and Friedrich2020) and the Marine20 calibration curve (Heaton et al. Reference Heaton, Köhler, Butzin, Bard, Reimer, Austin, Ramsey, Grootes, Hughen and Kromer2020) when necessary for the calibration of samples with a possible marine reservoir effect. In this sense, the ΔR values proper to the corresponding area and study period have been used, which will be discussed in in this section. Calibrated ranges have been rounded to multiples of 10 when the standard error is equal to or greater than ± 25 years and to multiples of 5 when less than ± 25 years (Millard Reference Millard2014; Stuiver and Polach Reference Stuiver and Polach1977).
Human bones calibration: Regional marine offset and diet
The calibration of human radiocarbon samples in areas directly related to a presumed marine food supply requires investigating a possible marine food input, which must be treated uniquely. The marine reservoir effect (Alves et al. Reference Alves, Macario, Ascough and Bronk Ramsey2018, Reference Alves, Macario, Urrutia, Cardoso and Bronk Ramsey2019) can sensitively affect radiocarbon dating, allowing the estimate of an age of up to approximately 400 years (R = 405 ± 22 14Cyr) in subtropical areas for the dated sample and requires a calibration process using a different curve. In addition, it is susceptible to local physical and chemical processes that sensitively affect the date calibration, requiring a local parameter (marine reservoir offset) ΔR to more accurately determine chronologies (Bard Reference Bard1988; Berkman and Forman Reference Berkman and Forman1996; Hall et al. Reference Hall, Henderson, Baroni and Kellogg2010). For better calibration, local studies should be performed for a given period for a better fit (Bondevik et al. Reference Bondevik, Mangerud, Birks, Gulliksen and Reimer2006; Kennett et al. Reference Kennett, Ingram, Erlandson and Walker1997). A prior study, Soares and Dias (Reference Soares and Dias2006) had reported and discussed the upwelling effect especially for our area and study period, offering local reservoir ΔR values for Lisbon.
As mentioned previously, a fundamental aspect of radiocarbon calibration is the corresponding regional marine reservoir correction (ΔR), which accounts for local variations in the calibration curve depending on the study area and time period. For Quinta do Almaraz, we use the mean value taken from the study of 95±30 (Barros and Soares Reference Barros and Soares2004), which has subsequently been specified as 95±15 (Soares and Dias Reference Soares and Dias2006) for the period 3000–600 BP approx. Moreover, it has been used for the period studied in this article in Iron Age I (Soares and Arruda Reference Soares and Arruda2017), and according to these data, the samples of this study will be discussed. We lack the closest data for the Roman Republican period. In this case, we rely on the Marine Radiocarbon Database (http://calib.org/marine/) (Reimer and Reimer Reference Reimer and Reimer2001), using Lisbon as the epicenter and calculating the average of the 10 closest values resulting in an ΔR of –25 ± 131 (these are calculated from data published in Abrantes et al. Reference Abrantes, Lebreiro, Rodrigues, Gil, Bartels-Jónsdóttir, Oliveira, Kissel and Grimalt2005 and Soares Reference Soares1993).
With the introduction of the Marine20 marine calibration curve (Heaton et al. Reference Heaton, Köhler, Butzin, Bard, Reimer, Austin, Ramsey, Grootes, Hughen and Kromer2020), it is necessary to perform transformations on the previously calculated ΔR values (Heaton et al. Reference Heaton, Bard, Ramsey, Butzin, Hatté, Hughen, Köhler and Reimer2023). We denote ΔR13 and ΔR20 as the regional offsets corresponding to the Marine13 and Marine20 calibration curves, respectively, with a reasonable approximation of ΔR
20
= ΔR
13
– 150
14
C years (Heaton et al. Reference Heaton, Bard, Ramsey, Butzin, Hatté, Hughen, Köhler and Reimer2023, 262). Despite the availability of this adjustment method, the most reliable approach is to use the Marine Radiocarbon Database (http://calib.org/marine/) (Reimer and Reimer Reference Reimer and Reimer2001), which provides regularly updated ΔR20 values. Therefore, we will discuss options for examining the differences, but we will use ΔR20 = $ -\!$
25 ± 131 for the final calibration in the models.
$ -\!$
25 ± 131 for the final calibration in the models.
With respect to dietary isotope signals, Lubell et al. (Reference Lubell, Jackes, Schwarcz, Knyf and Meiklejohn1994) have reported that isotope value limits for complete terrestrial and marine protein diets from Portugal as $- 20.0 \unicode {x2030}$ (δ13C) and $+ 8.5\unicode {x2030}$ (δ15N), and $- 15.0\unicode {x2030}$ (δ13C) and $- 13.0\unicode {x2030}$ (δ15N) respectively. Some authors mark $- 20.0\unicode {x2030}$ (δ13C) and δ15N values greater than $+ 10.0\unicode {x2030}$ as the cut-off value to start taking into consideration for a progressively marine diet (Bird et al. Reference Bird, Crabtree, Haig, Ulm and Wurster2021). For radiocarbon calibration in humans, the δ13C cut-off points of $ -\!$
12‰ for a purely marine diet and
$ -\!$
12‰ for a purely marine diet and $ - $
20‰ for a purely terrestrial diet (C3) have been widely used for southern Europe (Carvalho and Petchey Reference Carvalho and Petchey2013). Calculation of the percentage of terrestrial/marine protein input is done by linear interpolation and considering the marine calibration curve for samples with protein input greater than or equal to 20%, as there is a possibility of not providing noticeable changes in the enrichment of the δ13C value (Milner et al. Reference Milner, Craig, Bailey, Pedersen and Andersen2004).
$ - $
20‰ for a purely terrestrial diet (C3) have been widely used for southern Europe (Carvalho and Petchey Reference Carvalho and Petchey2013). Calculation of the percentage of terrestrial/marine protein input is done by linear interpolation and considering the marine calibration curve for samples with protein input greater than or equal to 20%, as there is a possibility of not providing noticeable changes in the enrichment of the δ13C value (Milner et al. Reference Milner, Craig, Bailey, Pedersen and Andersen2004).
For our case study the δ13C value of $- 21.0\unicode {x2030}$ is the most appropriate that we found for the period studied and which we corroborated from samples of herbivore fauna from Quinta do Almaraz (Soares and Dias Reference Soares and Dias2006), very close to Lisbon, which offer a mean δ13C value of $- 20.5\unicode {x2030}$. In marine systems, isotopic fractionation occurs in phytoplankton photosynthesis and is transferred through the trophic chain to values in bone collagen approaching $- 13\unicode {x2030}$ (Chisholm et al. Reference Chisholm, Nelson and Schwarcz1982; Schoeninger and DeNiro Reference Schoeninger and DeNiro1984). However, the limit value obtained for archaeological material, although very close, is $- 12.5\unicode {x2030}$, which we will take as an “entirely marine” limit value (Hobson Reference Hobson1999).
A linear interpolation method is used to calculate the contribution of the marine calibration curve, considering the limitations of the method (Cook et al. Reference Cook, Ascough, Bonsall, Hamilton, Russell, Sayle, Scott and Bownes2015). This method is based on obtaining a percentage value from the mean δ13C value of collagen and applying an interpolation equation which, despite its limitations, is widely used in the absence of local studies (e.g. Arneborg et al. Reference Arneborg, Heinemeier, Lynnerup, Nielsen, Rud and Sveinbjörnsdóttir1999; Garcia Guixé et al. Reference Garcia Guixé, Richards and Subirà2006; Müldner and Richards Reference Müldner and Richards2005; Richards and Hedges Reference Richards and Hedges1999; Richards et al. Reference Richards, Pettitt, Trinkaus, Smith, Paunović and Karavanić2000; Van Klinken et al. Reference Van Klinken, Richards, Hedges, Ambrose and Katzenber2002) between the extremes of “100% terrestrial diet” and “100% marine diet,” which are usually between $- 21\unicode {x2030}$ (with a ±1‰) and $- 19\unicode {x2030}$ (with a ±1‰) for terrestrial and $- 12\unicode {x2030}$ to $- 12.5\unicode {x2030}$ (with a ±1‰) for marine, depending on the study area, as in the previous method. The SUERC Center for the Isotope Sciences laboratory states that for these Atlantic values, they used limits $- 20.5\unicode {x2030}$ (with a $ \pm 1$
) for entirely terrestrial samples and
$ \pm 1$
) for entirely terrestrial samples and $ -\!$
12.5‰ (with a ± 1‰) for completely marine samples with an ΔR-value of
$ -\!$
12.5‰ (with a ± 1‰) for completely marine samples with an ΔR-value of $ -\!$
25 ± 131. An uncertainty of 10% is included, following the recommendations of (Ambrose Reference Ambrose and Sandford1993, 112), due to the limitations of the studies paleodiet at Lisbon. According to all these parameters we will perform the calibrations of both dates to discuss their results.
$ -\!$
25 ± 131. An uncertainty of 10% is included, following the recommendations of (Ambrose Reference Ambrose and Sandford1993, 112), due to the limitations of the studies paleodiet at Lisbon. According to all these parameters we will perform the calibrations of both dates to discuss their results.
Two human samples Beta-668100 and SUERC-99128—exhibit δ13C values above $- 21\unicode {x2030}$ and elevated δ15N values of $\,+\,11.2$
‰ (Table 1), suggesting a partial marine dietary component. Informed by the herbivore baseline values (
$\,+\,11.2$
‰ (Table 1), suggesting a partial marine dietary component. Informed by the herbivore baseline values ( $- 20.5\unicode {x2030}$; Quinta do Almaraz and this study), the estimated marine contribution range is 25–30% ± 10% (uncertainty factor of ± 10% included). As mentioned above, ΔR20 value of $ - $
25 ± 131 is used for calibrating the radiocarbon dates of Beta-668100 and Beta-668100. The radiocarbon date 2520 ± 30 (Beta-668100), corresponding to a human infant, gives a δ13C of
$ - $
25 ± 131 is used for calibrating the radiocarbon dates of Beta-668100 and Beta-668100. The radiocarbon date 2520 ± 30 (Beta-668100), corresponding to a human infant, gives a δ13C of $- 18.5\unicode {x2030}$, δ15N of $+ 11.5\unicode {x2030}$, and C:N ratio of 3.3. In particular, the relatively high δ13C and δ15N values indicate a possible reservoir effect whose contribution to the marine curve calculates to 25% ± 10% using the limits mentioned previously. The final calibration data are presented in Table 2 and Figure 4, both in agreement with the conventional ceramic chronology. For the dating of SUERC-99128 (GU58227) (2208 ± 29) laboratory values of δ13C of $- 18.1\unicode {x2030}$, δ15N of $+ 11.2\unicode {x2030}$, and a C:N ratio 3.1 were obtained. Following the same criteria as before, the contribution of the marine curve was calculated to be about 30% with a deviation of 10%.

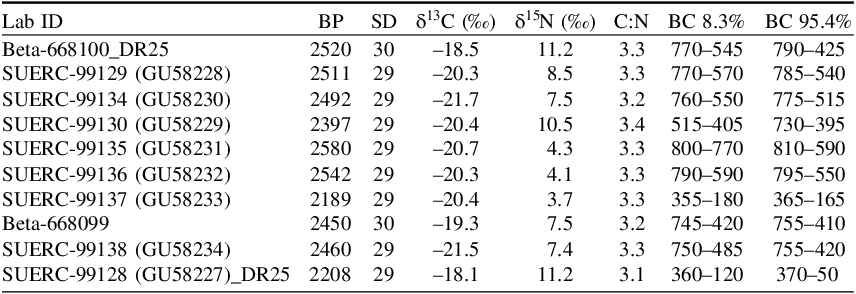
Figure 4. Final calibrated dates of Largo de Santa Cruz do Castelo.
Table 2. Final calibrated dating table. For human bone dates, the suffix DR25 refers to ΔR20 $ - $
25±131
$ - $
25±131

*Note: The * mark refers to AD (50 AD and 130 AD).
Bayesian modeling of the calibrated dates, combining the stratigraphic information and the ceramic typology of the site following the mainstream Sequence-Boundary-phase framework was also carried out using OxCal 4.4.4 (Bronk Ramsey Reference Bronk Ramsey1995; Bronk Ramsey Reference Bronk Ramsey2009a). Bayesian analysis accommodates the non-normally distributed probabilities of calibrated 14C ages and enables probabilistic modeling using prior stratigraphic information, with the chronological sequence of samples established according to stratigraphy. Samples within the phase are considered a group of unordered events. Agreement indices (A and Amodel) are used to evaluate both the reliability of individual calibrated dates within Bayesian models and the overall coherence of the model itself. The A value specifically measures how well the non-modeled calibration of each date aligns with its posterior distribution after Bayesian modeling. A values exceeding 60 indicate a statistically acceptable fit between the calibrated radiocarbon date and the model, roughly corresponding to a significance level of p < 0.05 in a chi-squared test (Manning et al. Reference Manning, Knapp, Webb and McCarthy2013, 496). Similarly, an Amodel value above 60 signifies that the overall Bayesian model is statistically reliable.
Results and discussion
Broadly, the radiocarbon dates and isotopic analyses from Largo de Santa Cruz do Castelo provide a coherent chronological framework across five archaeological phases, culminating in a Roman-Republican occupation. The radiocarbon results presented are interpreted alongside ceramic typologies, stratigraphic information to assess temporal developments at the site in five intervals.
• Interval 1: Second Half of the 7th century BCE (ca. 650–600 BCE). This interval, corresponding to stratigraphic phases F1 and F2, is supported by five calibrated radiocarbon dates 2520 ± 30 (Beta-668100), 2511 ± 29 (SUERC-99129/GU58228), 2492 ± 29 (SUERC-99134/GU58230), 2580 ± 29 (SUERC-99135), and 2397 ± 29 (SUERC-99130/GU58229)). The samples generally calibrate within the 750–550 BCE range, with four aligning closely with the narrower 650–600 BCE window. SUERC-99130 may suggest a slightly later date but remains consistent within the 95.4% confidence interval. An outlier in this group, dated to 2580±29 cal BP (SUERC-99135) might be an indicator of an earlier phase of activity on the hilltop, potentially dating to the mid-8th century BCE. Though unaccompanied by diagnostic material culture, this finding aligns with broader evidence for Late Bronze Age to early Iron Age use in the surrounding areas (Silva Reference Silva2013; Sousa et al. Reference Sousa, Ribeiro, Rebelo and Neto2024).
• Interval 2: First Half of the 6th Century BCE (ca. 600–550 BCE). Phase F3 is represented by the date 2542 ± 29 cal BP (SUERC-99136/GU58232), a sample from Cervus elaphus. Due to the Hallstatt Plateau, calibration precision is limited, but the date’s later range corresponds with the expected early 6th-century BCE timeframe. As wild fauna are less directly associated with human occupation layers, this sample is treated cautiously in interpretations but supports general site continuity.
• Interval 3: Second Half of the 6th Century BCE (ca. 550–500 BCE). This phase (F4) includes dates 2189 ± 29 cal BP (SUERC-99137/GU58233) and 2450 ± 30 cal BP (Beta-668099). The first date is inconsistent with the expected ceramic chronology and is considered intrusive. The results of the SUERC-99137 dating were not satisfactory according to the ceramic record dating the stratigraphic units (Figure 2). For this reason, a new sample (Beta-668099) was radiocarbon dated from the stratigraphic unit (U.E. [18]). The Beta-668099 data corresponds well with the 550–500 BCE timeframe. The contrast between the two dates highlights the importance of sample redundancy and stratigraphic context in complex urban deposits.
• Interval 4: 5th Century BCE (ca. 500–390 BCE). With the date of 2460 ± 29 cal BP (SUERC-99138/GU58234), Phase F5 is supported by a sample with broad calibration ranges due to the Hallstatt Plateau (750–485 BCE at 68.3% and 755–420 BCE at 95.4%). While the wide span limits chronological resolution, the result remains consistent with the expected mid-5th century BCE context.
• Interval 5: Second Half of the 2nd Century BCE (ca. 140–100 BCE). The human bone sample, SUERC-99128 (GU58227) with 14C age of 2208 ± 29 cal BP, represents this final Roman-Republican occupation. Its elevated δ13C and δ15N values ( $- 18.1\unicode {x2030}$ and
$+ 11.2\unicode {x2030}$) suggest a 30% ± 10% marine dietary component. Calibration performed using ΔR = −25 ± 131 yielded chronological ranges of 100–80 BCE (68.3%) and 190–160 BCE (95.4%), which are consistent with the ceramic typology-based estimation of the stratigraphic context, dated to approximately 140–100 BCE. This sample, unaffected by the Hallstatt Plateau, yields one of the most secure dates in the sequence.
$- 18.1\unicode {x2030}$ and
$+ 11.2\unicode {x2030}$) suggest a 30% ± 10% marine dietary component. Calibration performed using ΔR = −25 ± 131 yielded chronological ranges of 100–80 BCE (68.3%) and 190–160 BCE (95.4%), which are consistent with the ceramic typology-based estimation of the stratigraphic context, dated to approximately 140–100 BCE. This sample, unaffected by the Hallstatt Plateau, yields one of the most secure dates in the sequence.


Temporality of Largo de Santa Cruz do Castelo
The radiocarbon dates presented in this study largely align with the established stratigraphic sequence, with one exception. The final chronological interpretation incorporates all calibrated radiocarbon dates (Table 2; Figure 4), ceramic typologies (Figure 2), and site stratigraphy (Figure 3). The correspondence between the radiocarbon and ceramic chronologies is generally strong, particularly in Interval 1, where multiple radiocarbon samples confirm assignment to the late 7th century BCE. Intervals 2–4 are constrained by single samples and Hallstatt Plateau effects but show no contradictions with stratigraphic expectations. Interval 5, with clear calibration and minimal uncertainty, firmly anchors the site’s later occupation phase to the Roman-Republican period.
As can be seen in Figure 2, phases 1 and 2 correspond to ceramic Interval 1, which has multiple dates; Interval 2, corresponding to phase 3, has a single date; and interval 4, corresponding to Roman phase 5, has a single date. As mentioned earlier, Interval 3, corresponding to phase 4, has only a single valid date (Beta-668099). With these considerations in mind, the Bayesian model has been computed based solely on the first Interval, since for the rest of the intervals we only have one valid date each, in addition to being in the middle of the Hallstatt Plateau. The values yielded robust agreement values (Amodel = 83.7, Aoverall = 77.3), with all samples surpassing the 60% individual agreement threshold (Figure 5). All values exceeded 60 indicating a statistically acceptable fit between the calibrated radiocarbon dates and the model (p < 0.05) in a chi-squared test. The overall Bayesian model is statistically reliable and validates the stratigraphic sequence and ceramic dating despite calibration challenges imposed by the Hallstatt Plateau. The Bayesian model reinforces confidence in Interval 1’s chronology, demonstrating that even after falling under Hallstatt Plateau conditions, coherent results can be achieved with adequate sample representation. However, the limited number of dated contexts in other phases and the known uncertainties of calibration plateaus emphasize the importance of future targeted sampling. Expansion of the dataset, particularly for phases 2 through 4, and refinement of marine reservoir estimates will be crucial for improving temporal resolution and deepening understanding of this site’s role during key transitional periods of Iron Age and early Roman occupation.

Figure 5. Bayesian model of radiocarbon dates from Largo de Santa Cruz do Castelo using OxCal. The model includes mixed calibration curves for human samples to account for marine reservoir effects (Beta-668100 and SUERC-99128) and atmospheric calibration for all other samples. Local reservoir corrections (ΔR = −25 ± 131) are applied where appropriate. The model integrates samples from all five chronological intervals, with dates grouped by stratigraphic and contextual association. SUERC-99137 (GU58233), suspected to be intrusive, is excluded from the model. Agreement indices and posterior distributions are used to validate the consistency of the stratigraphy and the ceramic-based phasing.
Conclusions and final remarks
The results presented in this study thus constitute the first radiocarbon dating sequence (Figure 5) available for Lisbon’s Iron Age occupation. Until now, only three other dates had been published, derived from charred wood samples collected during excavations on Rua da Judiaria, which is believed to have corresponded to a karstic environment. These samples were associated with materials dating to the 7th and, primarily, the 6th century BCE (Calado et al. Reference Calado, Almeida, Leitão and Leitão2013): Sac-2526, with a highest probability range between 595–387 cal BCE (79%); Sac-2525, with a range of 594–351 cal BCE (78%); and Sac-2527, with a range of 850–411 cal BCE (97%).
These dates, like most results obtained from Largo de Santa Cruz do Castelo, are, however, fall into the range of Hallstatt Plateau, which significantly limits their precision and usefulness. Nonetheless, the data obtained allows for some considerations. Taking into account the four dates obtained for the earliest phase of occupation documented at Largo de Santa Cruz do Castelo, encompassing Phases 1 and 2, and assuming that all the dated samples are in their primary context, corresponding to the formation of their respective Stratigraphic Units, we can establish an approximate chronological range for the formation of these contexts between 730 and 590 cal BCE, i.e., centered in the 7th century BCE. The study of the material culture associated with these contexts aligns, broadly speaking, with this chronological framework, although some of the associated materials may suggest an interval more focused on the second half of that century (Sousa and Guerra Reference Sousa and Guerra2018). This corresponds to a period when local productions from the Tagus estuary were already relatively established, including amphorae (Type 1 from the Tagus estuary), red-slip plates with broader rims and black overpainting, gray ceramics featuring shapes suited for liquid consumption, and a diverse repertoire of plain and cooking wares. In these assemblages from the earliest phases, some handmade productions also appear, showcasing morphologies and decorations inherited from the repertoire of the Late Bronze Age, attesting to the presence of indigenous individuals in this area.
For the second phase (Phase 3), it is essential to emphasize the upper limit of the dating obtained, which does not surpass the mid-6th century BCE. This aligns with the chronology proposed by the chrono-typological study of the associated materials. This phase marks the emergence of regional specificities in Tagus ceramic productions. These include a greater diversity in amphora rim profiles, the introduction of plates among grayware productions—generally imitating red-slip forms—and the appearance of spherical containers in common ware. Indigenous traditions persist within the scope of handmade productions, although these become increasingly rare. This trend continues into Phase 4 (Interval 3), for which, unfortunately, no precise archaeometric data is available. Nevertheless, this phase sees a further accentuation of regional variations in ceramic production. Amphora rims become more outwardly pronounced, semi-hemispherical bowls are incorporated into red-slip productions, grayware drinking vessels exhibit greater morphological diversity, and paterae begin to appear among the plain wares.
Interval 4 (Phase 5) also lacks detailed archaeometric data but appears to center around the mid-1st millennium BCE. This phase reflects the consolidation and clear individualization of Tagus ceramic repertoires (Sousa Reference Sousa2014), including new amphora container morphologies (Type 4 from the Tagus estuary) and the introduction of high ring bases across various ceramic categories, potentially indicating Hellenic influences. Thus, despite the inherent limitations of using radiocarbon dating for contexts from the first half of the 1st millennium BCE, the data gathered allow for some progress in establishing more specific evolutionary sequences in these peripheral areas of the Phoenician colonial process. This represents an initial step that must be corroborated and confirmed with the future expansion of absolute dating for contemporaneous contexts. Nevertheless, it is a crucial endeavor to refine and bridge the gaps observed between archaeometric and conventional sequences for the Early Iron Age in the West.
Acknowledgments
This work was financed by Portuguese funds through FCT – Fundação para a Ciência e a Tecnologia in the framework of the projects:
• UIDB/00698/2020 (https://doi.org/10.54499/UIDB/00698/2020)
• UIDP/00698/2020 (https://doi.org/10.54499/UIDP/00698/2020)
Additionally, RP and CBD have received funding from the European Union’s Horizon 2020 research and innovation program under the Marie Skłodowska-Curie grant agreement No. 766311.


 Open access