


1. Introduction
Increased demand for tackling complex operational scenarios stresses companies to rethink how they deliver value to customers. A recent trend in the manufacturing sector is the servitization of products and the transition from hardware-based business models to product–service systems (PSS) offerings (Isaksson, Larsson & Rönnbäck Reference Isaksson, Larsson and Rönnbäck2009). A classic example in the literature is Rolls-Royce selling “power-by-the-hour” instead of aviation engines directly (Harrison Reference Harrison2017), while a more recent one is the “transport-as-a-service” model for autonomous hauling by Volvo Autonomous Solutions (Volvo Autonomous Solutions 2023). Both showcase how the hardware ownership is kept by the provider, while the customer is paying for the “function” performed by the system, or its “results,” which is flying hours or hauled material.
PSS comes with a new set of challenges. Solution providers need to take on a larger share of responsibility and risk, as they are now in charge of ensuring value delivery instead of just providing an enabler for value creation. Harrison (Reference Harrison2017) exemplifies this by demonstrating how efficiency, reliability and minimizing downtime – concerns previously managed by the customer – become the provider’s responsibility under a “power-by-the-hour” agreement. For PSS to be successful, one should build knowledge about the operations and customers’ business processes to ensure the provision of the correct product–service combination (Isaksson et al. Reference Isaksson, Larsson and Rönnbäck2009; Valtakoski Reference Valtakoski2017). In addition, one should deeply understand how customer value is created. Rondini, Bertoni & Pezzotta (Reference Rondini, Bertoni and Pezzotta2020) show that multiple aspects of value affect the overall “PSS experience” for both customers and providers. One approach to take a more value-centric approach, hence enabling the inclusion of multiple perspectives and comparison of vastly different solutions, is using value-driven design (VDD). Stemming from system engineering (SE), VDD was conceptualized in an effort to tackle requirements and needs holistically rather than individually (Collopy & Hollingsworth Reference Collopy and Hollingsworth2011). This was later explored in a PSS context to enable new value creation strategies to be assessed and benchmarked (Bertoni, Bertoni, & Murat Hakki Reference Bertoni, Bertoni and Murat Hakki2019), typically through the generation of a nondimensional quantity (“value score”) that designers can use to compare solutions featuring vastly different capabilities.
The operational scenario of the solution strongly influences value creation. Therefore, the success of value-driven approaches is dependent on the providers’ capability to understand the operational scenario. For complex scenarios involving several interacting systems that collaborate to achieve a goal, adopting a system-of-systems (SoS) perspective offers a valuable approach. A primary motivation for using such a perspective is to increase the performance and capabilities of the solution beyond what is possible when designing and modeling each constituent system independently (Keating et al. Reference Keating, Rogers, Unal, Dryer, Sousa-Poza, Safford, Peterson and Rabadi2003). Such cases are plausible when the goal is too complex to be managed by a single system but demands the successful interaction of several systems. An SoS inherently evolves as its purpose and constituent elements change (Jamshidi Reference Jamshidi2008). In essence, the key to developing a successful SoS lies in its ability to function over varying conditions (Wrigley Reference Wrigley2012). Therefore, SoS design is about finding a solution that performs well across different operational contexts. The challenge resides in assessing performance in an SoS, where value creation and delivery methods can vary drastically based on operational scenarios and business model propositions.
During the early design stages of an SoS, it is critical to establish a framework that measures value creation across diverse operational scenarios. The combinatorial effects of design choices on both system and managerial levels further stress this criticality. A well-designed architecture that accounts for system interdependencies and operational uncertainties is the key to such value assessments (Fang Reference Fang2022). Underpinned by modeling and simulation capabilities (Baldwin, Sauser & Cloutier Reference Baldwin, Sauser and Cloutier2015), it enables decision-makers to explore a broader range of SoS alternatives and make informed choices beyond their comfort zone. Effectively modeling SoS behavior requires capturing the interactions between constituent systems and the surrounding context (Kinder, Henshaw & Siemieniuch Reference Kinder, Henshaw and Siemieniuch2014). This also means that the design stages must consider the system and environment interaction. However, modeling each system with excessive detail can be computationally expensive. The key lies in finding a satisfactory fidelity level for each system, thus creating a more efficient simulation model (Papageorgiou et al. Reference Papageorgiou, Ölvander, Amadori and Jouannet2020). Therefore, an approach is needed that enables the design team to navigate different fidelity levels effectively based on the requirements. For example, Subosits & Gerdes (Reference Subosits and Gerdes2021) presented a trade-off between vehicle model fidelity levels and their ability to predict vehicle limits. While the optimal path and speed can be determined even with a simple point-mass model, this approach fails to capture the vehicle’s behavior on low-friction surfaces, where transient dynamics are crucial. In contrast, a single-track model can better understand these transient dynamics, especially during cornering. A more complex double-track model is needed while considering aggressive combined lateral and longitudinal acceleration.
Such a trade-off between model fidelity and computational cost is especially relevant in SoS applications, where hierarchical interactions can quickly escalate computational demands as a more accurate analysis is demanded. This article discusses how to assess SoS alternatives to better understand their value in various operational scenarios during the design process. The focus lies on supporting the SoS design decisions in the early design stages, where the design freedom is high and available knowledge is low (Ullman Reference Ullman2010). Due to this, it is valuable to introduce simulations to frontload knowledge creation, especially for SoS, where physical prototyping is resource heavy or even impossible. Further, this article presents a modular approach that enables the development team to redefine the SoS by flexibly adding or removing constitutive systems while incorporating the hierarchical dependencies between different levels. The approach allows the development team to tune the fidelity of constitutive systems within the simulation to achieve the best possible fit for the given analysis by balancing model accuracy and computational complexity. The research objective is summarized as follows:
Develop and evaluate a modular SoS simulation approach that enables users to manage hierarchical dependencies, tune model fidelity and effectively explore value creation across diverse operational scenarios in early design stages.
The proposed simulation approach aims to create a foundation for assessing different SoS configurations, providing a baseline for understanding interdependencies and combinatorial effects. From a PSS perspective, a concept is defined as: “an actionable (implementable) and assessable (screenable) design proposal…” (Sarancic et al. Reference Sarancic, Pigosso, Pezzotta, Pirola and McAloone2023, p. 2). Such an early-stage PSS design proposal primarily addresses “what” should be offered rather than “how” value is delivered (Barravecchia, Mastrogiacomo & Franceschini Reference Barravecchia, Mastrogiacomo and Franceschini2020). Therefore, the research focuses on defining different elements in the operational setting of the PSS rather than analyzing the life cycle and the impact of different service models.
The remainder of this article is structured as follows. Section 2 presents the methodology used for the research efforts. Section 3 presents the theoretical framework and critical components. Section 4 describes the developed framework, and Section 5 deploys this framework in a case study conducted jointly between researchers and practitioners. Finally, Section 6 provides the major reflections and limitations, and Section 7 raises concluding remarks.
2. Research methodology
Overall, the work presented in this article can be framed as a prescriptive study based on the stages in the design research methodology framework (Blessing & Chakrabarti Reference Blessing and Chakrabarti2009). A prescriptive study primarily aims to enhance the current state, with a set of identified issues or challenges, through developing and deploying “support.” The proposed multifidelity hybrid SoS simulation framework can be seen as this support that enables the users to explore and understand the value of an SoS while handling multiple disciplinary models at different fidelity levels, dynamic operational strategy settings and alternate scenarios. The selection of the research approach within this framework depends on the research objective and the context in which it is being studied. This article has adopted the participatory action research (PAR) approach, a subset of action research (AR) through the active collaboration and involvement of the participants in the research itself (Vaughn & Jacquez Reference Vaughn and Jacquez2020). AR combines theory and practice through an iterative problem–intervention–learning cycle where research and practice work together (Avison et al. Reference Avison, Lau, Myers and Nielsen1999). Baum (Reference Baum2006) raises three main distinctions with PAR compared to more traditional means of research. First, it targets research that enables actions. Second, it seeks a power balance between researchers and participants and active involvement and collaboration between parties. Finally, it does not separate data and information from their contexts. PAR emphasizes the integration between descriptive and prescriptive action (Bradbury Reference Bradbury2015).
Several retrospective methods for data collection (Blessing & Chakrabarti Reference Blessing and Chakrabarti2009) were utilized, including unstructured interviews, workshops and debriefs from a 2-year research project between academia and industrial partners. These data were supplemented with a narrative-style literature review for synthesizing existing research, providing a broader context for the study discussed subsequently and giving relevant insight into the trends and gaps in the existing literature. From a practical stance, this article builds on the cumulative iteration of problem exploration, action intervention and reflective learning. Physical and online meetings held regularly served as a basis for verifying and refining the proposed framework from a logical and consistent standpoint. This framework was then tested in different use cases to examine its effectiveness, reliability and usability, completing the “think–look–act” cycle typical in PAR. The validation of the proposed method was conducted through an iterative process of qualitative collaboration with the company partners. This included two on-site demonstrations at the quarries with customer feedback to assess the approach’s applicability and usability. Finally, the case study application described in this article is based on real cases within the construction machinery industry. However, the simulation results have been suitably modified while conserving a certain degree of realism to the actual scenario due to confidentiality restrictions.
3. Theoretical framework
3.1. VDD of SoS
The literature on SE emphasizes that as systems grow in complexity, defining the system boundary, that is, the line distinguishing the system of interest from its context, becomes increasingly ambiguous. To maintain a consistent perspective during the design stages, Kossiakoff & Sweet (Reference Kossiakoff and Sweet2003) propose “development control” as a definition criterion, wherein the parameters outside the engineering team’s control yet impacting the system’s operational value are considered context. Thus, the operational scenario encompasses all the forms of the system of interest, that is, the system being developed along with all possible contexts (Machchhar et al. Reference Machchhar, Toller, Bertoni and Bertoni2022). This viewpoint is preserved throughout this article.
In SE projects, the term SoS has gained significant traction over the past two decades, where the system is often regarded as a part of a more extensive integrated system known as the SoS. An SoS integrates independent, geographically dispersed systems, even those with different technologies, to achieve a unified goal through coordinated interaction (Walden et al. Reference Walden, Roedler, Forsberg, Hamelin and Shortell2015). An SoS is a solution for achieving novel capabilities that its constituent systems cannot achieve in isolation (Silva & Braga Reference Silva and Braga2020). Rather than a rigorous universal definition of SoS, the SoS community identifies key characteristics that differentiate SoS from traditional large-scale systems. As per Maier (Reference Maier1998), these five characteristics set SoS apart from traditional systems: (1) operational independence, (2) managerial independence, (3) geographic distribution, (4) emergent behavior and (5) evolutionary development of the system or components. In such a context, operational and managerial independence highlight that each constitutive system of an SoS shall be capable of operating independently from all other constitutive systems. SoS engineering must consider the design of all constitutive systems and their interactions (Keating et al. Reference Keating, Rogers, Unal, Dryer, Sousa-Poza, Safford, Peterson and Rabadi2003). Geographic distribution suggests that the constitutive system can be positioned at different locations, yet connected to functions as a single interconnected system. Emergent behavior implies that the behavior of an SoS can be more complex than the sum of its individual parts, stressing the need to study interactions and interconnections between constitutive systems, down to the subsystems and components in the system hierarchy, is of prime significance. Finally, evolutionary development means that the SoS can evolve over time as new technologies, requirements or contexts emerge. This necessitates an adaptable architecture, making the design process a multistage decision-making loop involving adding new systems, replacing or removing existing ones and constantly optimizing the network of interdependencies (Fang Reference Fang2022).
Within the realm of SE, a widely adopted framework for informed decision-making during the design stages is VDD (Lee & Paredis Reference Lee and Paredis2014). This approach aims to enable the selection of the “best” overall design from a more holistic view rather than designs that merely fulfill the requirements (Collopy & Hollingsworth Reference Collopy and Hollingsworth2011; Cheung et al. Reference Cheung, Scanlan, Wong, Forrester, Eres, Collopy, Hollingsworth, Wiseall and Briceno2012). To enable the selection of the best designs, a clear definition of value is often necessary to quantify the relative goodness of one design compared to the others. Thus, while the concept of value is multifaceted, it is helpful to view it as a numerical score reflecting an individual’s preferences (Collopy & Hollingsworth Reference Collopy and Hollingsworth2011). VDD aims to achieve the highest score for this value metric instead of optimizing each design parameter and requirement in isolation (Cheung et al. Reference Cheung, Scanlan, Wong, Forrester, Eres, Collopy, Hollingsworth, Wiseall and Briceno2012). This also means that it is possible to compare more widespread design options and concepts (Bertoni et al. Reference Bertoni, Bertoni and Murat Hakki2019) and easier alignment between stakeholders and partners in complex systems (Monceaux & Kossmann Reference Monceaux and Kossmann2012). Thus, one of the essential tasks is to define “value” so that a single numerical score can represent it. As per the value management standard, value is seen as a measure of how well the inferred design meets the desired requirements or objectives in relation to its cost (EN12973 2020). Value functions can be derived to achieve this measure. A value function is, in that case, the overall score of the design based on the fulfillment of needs and expectations concerning expected costs. From this point of view, VDD can be seen as the aggregation of different performance metrics into a unified metric. The value function itself can adopt a qualitative form, such as “early value-oriented design exploration with knowledge maturity” (Bertoni, Bertoni & Isaksson Reference Bertoni, Bertoni and Isaksson2018), or a quantitative form, such as net present value (Price et al. Reference Price, Soban, Mullan, Butterfield and Murphy2012).
VDD can also be extended to SoS, although it has an increased challenge of identifying and modeling relevant attributes. A recent review (Fang Reference Fang2022) highlighted several challenges in developing SoS, particularly because of the interdependency and heterogeneity of constituent systems in an SoS. Each constituent system in an SoS may be built using different technologies, have diverse data formats and follow different operational rules. Thus, a unified model that effectively captures interdependencies is usually a trade-off between granularity and computational cost. At the same time, these interdependencies and collaboration between constituent systems often make an SoS more valuable than deploying the constituent systems independently (Silva & Braga Reference Silva and Braga2020). From an SoS modeling perspective, it is crucial to sufficiently model the SoS and its internal dependencies to achieve a reliable representation of value creation. The following section sheds some light on different modeling methods for SoS, particularly from an operational perspective.
3.2. Modeling and simulating approaches for SoS
Modeling and simulation are a better choice when real-world prototyping is expensive or practically impossible (Borshchev & Filippov Reference Borshchev and Filippov2004) and are considered a core part of the design process today. The aim of a simulation is to reflect reality as well as possible, allowing design teams to try different concepts and scenarios more rapidly without the need for physical intervention. Within SoS, Kinder et al. (Reference Kinder, Henshaw and Siemieniuch2014, p. 151) state that “the failure of many SoS endeavors can be attributed to the inappropriate application of systems engineering processes, including modelling approaches, within the SoS domain because of the mistaken belief that a SoS can always be regarded as a single large, or complex, system.” An SoS is evolutionary, with its structures, functions and purposes added, removed or modified as the experiences and community grow and evolve (Jamshidi Reference Jamshidi2008). This means that SoS requires simulation and modeling approaches capable of effectively capturing its unique characteristics.
Several different simulation approaches have been proposed for SoS. These can be broadly categorized into network-based, probability-based, simulation-based or other methods (Fang Reference Fang2022). Each method category has its specific application area, inherent advantages and disadvantages. Network-based methods use graph theory to show interconnections between a set of entities, and in this case, the hierarchical chain constituting the SoS. By representing an SoS as a network, one can analyze its overall behavior from a high-level view (Fang Reference Fang2022). For instance, Thacker, Pant & Hall (Reference Thacker, Pant and Hall2017) used a multilevel network for disruption analysis in large-scale infrastructure. Notably, such approaches focus on the connections between entities and their statistical properties, like how often they interact or how critical they are to information flow. Probability-based methods include methods like Bayesian networks, Markov chains and so forth. A Bayesian network is a probabilistic graphical model in the form of a directed acyclic graph that describes the interconnections for an SoS; for example, Han & DeLaurentis (Reference Han and DeLaurentis2013) employed Bayesian networks to measure the interdependencies and evaluate risks at an SoS level. A Markov chain is a special kind of network graph describing a sequence of possible events, where the nodes represent states of a system, and the edges show the probability of moving between those states. The key aspect is that the transition probability to the next state only depends on the current state, making them memoryless. Mane, DeLaurentis & Frazho (Reference Mane, DeLaurentis and Frazho2011) used the Markov chain model to better understand dependencies in a network of systems. Network graphs have also been explored in other problems, such as measuring and analyzing complexity, optimization of constrained SoS, and so forth (Harrison Reference Harrison2016). However, a higher level of abstraction is generally observed while utilizing these techniques and, hence, they are usually computationally less expensive.
Simulation-based methods are preferred to understand how a SoS behaves over time, predict its overall performance or explore potential operational scenarios. In this approach, computer simulations are utilized to model the behavior of SoS components and their interactions, enabling the evaluation of different design alternatives. Mainly, three different simulation techniques exist, including discrete-event simulation (DES), agent-based simulation (ABS) and system dynamics (SD) (Borshchev & Filippov Reference Borshchev and Filippov2004) or a combination of these techniques in a so-called hybrid simulation. SD is a technique where the system is modeled using stocks (accumulations) and flows (rates of change), further using feedback loops to represent change in one aspect of this system and analyze the system’s long-term behavior. Again, it has a high level of abstraction, making it unsuitable for understanding detailed-level interactions between various SoS components (Borshchev & Filippov Reference Borshchev and Filippov2004). DES is a top-down technique where the operational process is broken down into a sequence of events. These simulations require a good grasp of events and interactions, and hence, it is particularly suited for logistics and supply chain simulations. On the other hand, ABS is a bottom-up modeling technique where different agents are modeled, that is, systems, with predetermined rules and behavior and then placed in an environment/context (Siebers et al. Reference Siebers, Macal, Garnett, Buxton and Pidd2010). These agents are autonomous and possess operational and managerial independence, making them a good option for SoS engineering (Baldwin et al. Reference Baldwin, Sauser and Cloutier2015). In contrast to other modeling techniques, ABS is decentralized, meaning that the behavior is determined at an individual level, and the global behavior is thus a result of all agents’ behaviors within the simulation environment and their interaction with each other (Borshchev & Filippov Reference Borshchev and Filippov2004). This means that ABS is a good technique for discovering the unanticipated emergent behavior of a SoS (Baldwin et al. Reference Baldwin, Sauser and Cloutier2015) and modeling human-like behavior (Hester & Tolk Reference Hester and Tolk2010). The downfall with ABS is that it is more cumbersome to set up compared to other modeling techniques and struggles to manage high variabilities and emergent changes throughout the life cycle (Hester & Tolk Reference Hester and Tolk2010; Kinder et al. Reference Kinder, Henshaw and Siemieniuch2014).
Overall, ABS has high flexibility in modeling different abstraction levels, from high-level abstraction and macro level to detailed operational and micro levels (Borshchev & Filippov Reference Borshchev and Filippov2004). However, the granularity of the behaviors of each agent might differ. A simple probabilistic function or lookup table is enough for some, while others might require more advanced dynamic models. Shanthikumar & Sargent (Reference Shanthikumar and Sargent1983) present the analytic-simulation modeling approach, where analytical models are combined with simulation models to reflect reality better. This approach is good when the entire problem cannot be analytically modeled. In the context of SoS, where intricate interactions and hierarchical structures exist, purely analytical modeling is rarely feasible, even if the constituent systems might be analytically tractable. The question is then rather the degree and complexity that the systems should be modeled with respect to required granularity and computational effort.
Looking at ABS’s current efforts in managing SoS and complex systems, An et al. (Reference An, Grimm, Sullivan, Turner, Malleson, Heppenstall, Vincenot, Robinson, Ye, Liu, Lindkvist and Tang2021) push that ABS research and development must tighten the collaboration between disciplines to identify mechanisms and interdependencies affecting the SoS outcomes. Moreover, Liang et al. (Reference Liang, Luo, Hu and Li2022) identified eight research clusters in conjunction between ABS and decision-making, with the three largest being intelligent agents, model validation and collaborative decision-making. In general, ABS is recognized as a promising simulation approach for complex contexts, both in its design and emergent behaviors. Examples of this are an ABS for assessing coal mine safety in a dynamically changing context (Cheng, Guo & Lin Reference Cheng, Guo and Lin2021) and ABS for energy power distribution in networks with the insertion of renewable-based energy systems, for example, solar power (Fichera, Pluchino & Volpe Reference Fichera, Pluchino and Volpe2018). Both these contexts can be characterized as SoS, in which ABS has been selected as a suitable modeling approach. Looking specifically at agent model fidelities, Schön et al. (Reference Schön, Marcus, Amadori and Jouannet2021) studied the effect of combining high-fidelity models with ABS. It showed that adding modeling complexity and high-fidelity models affects the performance of the simulation model, but it also prolongs the time for results to converge, stressing the need for a strategic fidelity selection. All the abovementioned examples show that ABS can be a powerful and flexible approach for simulating SoS and capturing its unique characteristics. However, the question still remains of how this can be done effectively, especially with respect to fidelity.
4. An integrated simulation framework for value exploration in SoS
The intricate nature of SoS, characterized by complex internal interactions and dependencies, makes value exploration significantly difficult. To address this challenge, this article proposes a framework for modeling SoS to explore design options during early design. This is achieved through using ABS as a simulation strategy. As mentioned above, ABS excels in SoS simulations because it allows users to tune the fidelity level of each system, optimizing computational efficiency for specific scenarios. In addition, it effectively captures the complex interactions between constitutive systems, enabling the exploration of emergent phenomena, that is, unexpected, large-scale patterns in SoS. Furthermore, ABS is organized bottom-up in contrast to DES, which is process-based and top-down (Siebers et al. Reference Siebers, Macal, Garnett, Buxton and Pidd2010). Hence, it allows for more detailed modeling of the constitutive systems within an SoS. In other words, ABS can represent and almost mirror the SoS closely, constituting behaviors that recognize managerial and operational independencies. ABS modeling can be achieved by a plethora of software, both open-source and proprietary. Abar et al. (Reference Abar, Theodoropoulos, Lemarinier and O’Hare2017) provide a comprehensive list and comparison between different ABS software, highlighting that the targeted context, required scalability and development effort should steer the software selection. The suggested framework does not advocate any specific software but instead allows the user to select based on preferences.
In ABS, each agent has a set of attributes, decision-making rules and behavior, as shown in Figure 1. Attributes are characteristics that define the agent. These could be any relevant physical properties, such as size, speed and location of the agent, or an internal state, such as health, energy level and so forth. Attributes also comprise capabilities; for instance, an agent can detect dangers or search for resources via sensing. Rules are a set of programmed instructions that dictate how the agent reacts to different events throughout the simulation. These events can be an interaction with another agent, a change in the agent’s internal state, a change in the operational environment and so forth. Finally, behavior implies the basis for state transition for an agent. While rules specify what actions an agent takes, the behavioral model defines how the agent performs those actions and the consequences of those actions. The behavior model is an analytical model, usually required to calculate the impact of an activity. This model can have different levels of fidelity depending on the required granularity. Simple lookup tables, average operating points or probabilistic functions can be used at a low-fidelity level. An example of this is an observation table of hauler cycle times in a quarry. Dynamics can be deployed and combined with machine learning algorithms to obtain high fidelity for more advanced levels. This could mean opting for quasi-static or dynamic models of a hauler’s movement (Dehghanimohammadabadi & Keyser Reference Dehghanimohammadabadi and Keyser2017). Ultimately, the internal complexity of the system and its impact and interdependencies with the rest of the SoS should determine the most suitable approach. In general, a low-fidelity model in this article is seen as the most basic representation of behavior, which then can be replaced by more advanced and accurate modeling approaches. Importantly, the behavior fidelity must be isolated and externally static (a change of fidelity should only affect the internal relations) to avoid interaction issues with other agents. An example of this is using either a look-up table or dynamic models, which render the same output datasets, but the accuracy might differ.

Figure 1. Illustration of properties of agents in ABS and different fidelity levels.
Expanding the view to a SoS perspective, the exact properties of an agent and the population of multiple agent types in a simulation are managed through the integrated simulation framework, shown in Figure 2. This framework comprises all essential aspects of building the operational scenario, essentially comprising different agent types and an environment library. The boundary definition, as described in SE literature, is adopted, leading to the categorization of operational agents into system agents ( $ \mathrm{SA} $
s) and context agents (
$ \mathrm{SA} $
s) and context agents ( $ \mathrm{CAs}\Big) $
. This division serves a practical purpose, primarily providing a clear distinction between the system under development and the rest for different stakeholders. Each agent has the abovementioned properties, including attributes, rules and behavior. The fidelity level is further pronounced and discretized into three categories: low, medium and high. The integrated simulation framework also includes enabling agents (
$ \mathrm{CAs}\Big) $
. This division serves a practical purpose, primarily providing a clear distinction between the system under development and the rest for different stakeholders. Each agent has the abovementioned properties, including attributes, rules and behavior. The fidelity level is further pronounced and discretized into three categories: low, medium and high. The integrated simulation framework also includes enabling agents ( $ \mathrm{EAs} $
). Unlike
$ \mathrm{EAs} $
). Unlike $ \mathrm{SAs} $
and
$ \mathrm{SAs} $
and $ \mathrm{CAs} $
,
$ \mathrm{CAs} $
, $ \mathrm{EAs} $
do not have specific fidelity levels. They act behind the scenes, ensuring the smooth operation and functionality of the entire simulation. Hence, these agents might not exist in the actual operational scenario but are essential for running the simulations.
$ \mathrm{EAs} $
do not have specific fidelity levels. They act behind the scenes, ensuring the smooth operation and functionality of the entire simulation. Hence, these agents might not exist in the actual operational scenario but are essential for running the simulations.
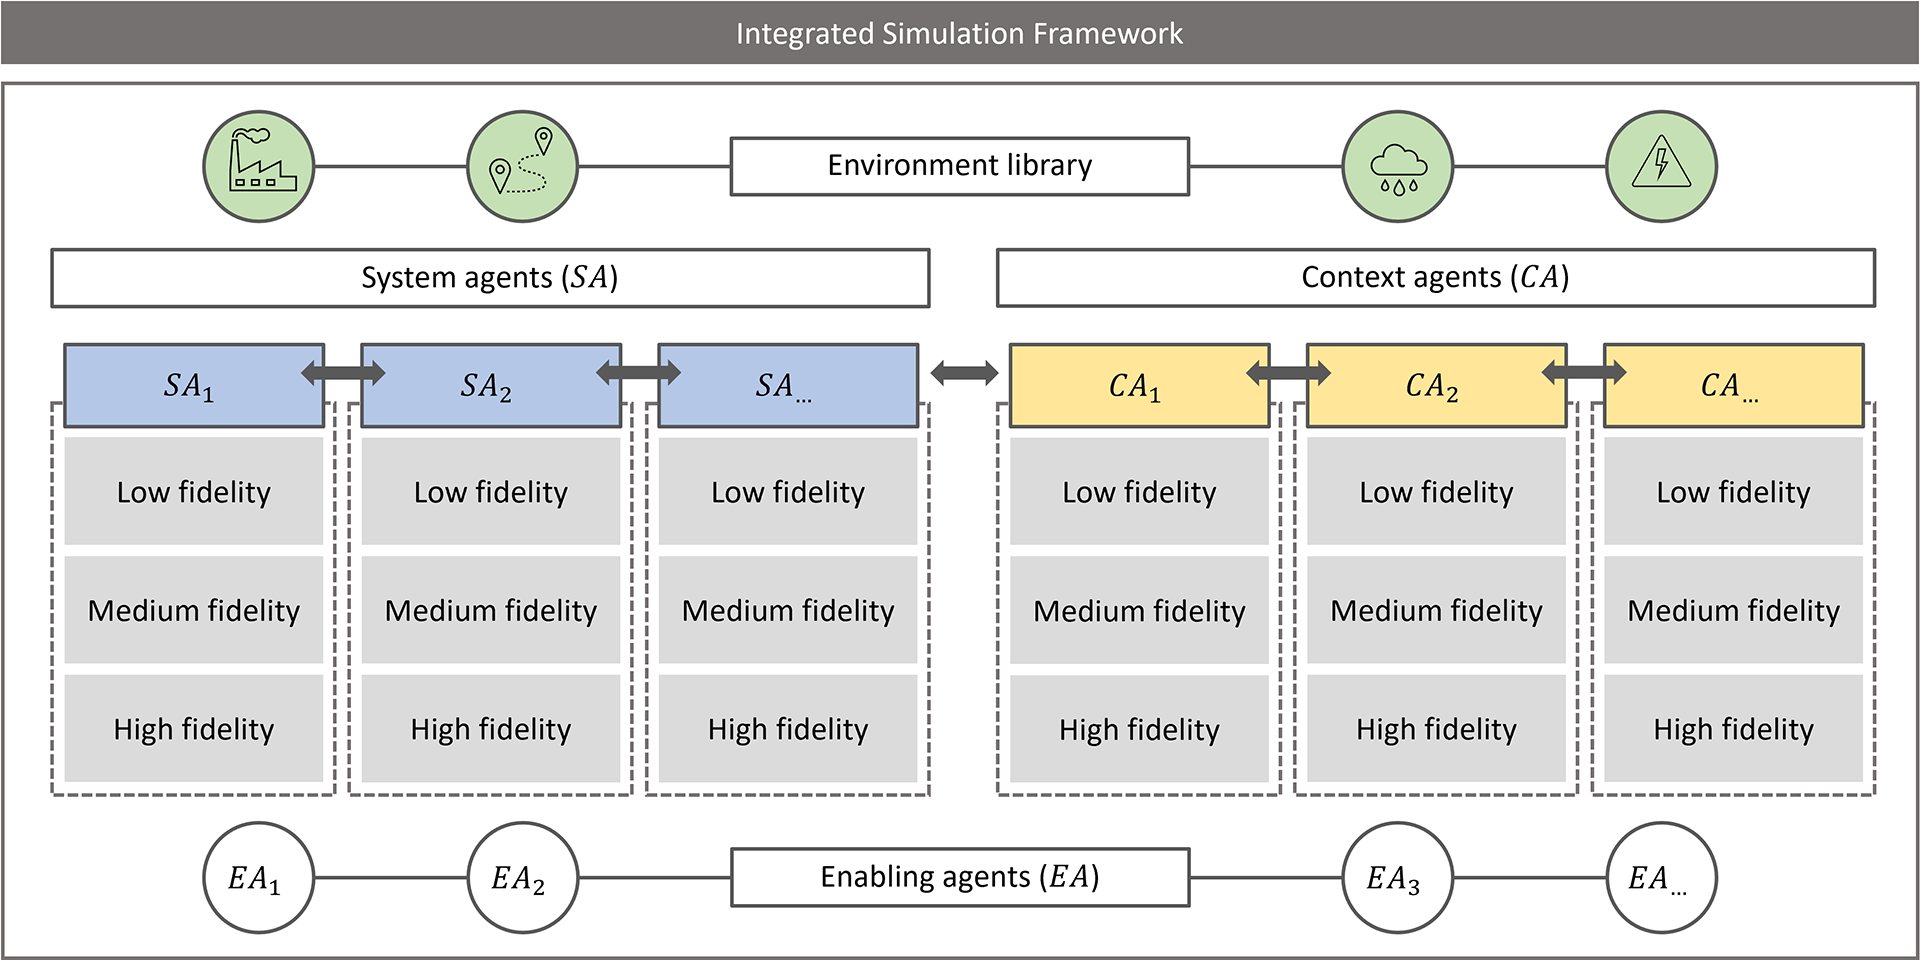
Figure 2. Overview of the integrated simulation framework.
An SoS simulation can be set up using the modular scenario builder, and this process involves the following steps:
-
1. Agent types: The first step is to define different agent types that constitute actors in the operational scenario. Borrowing an analogy from object-oriented programming, an agent type is analogous to a “class,” a fundamental building block for creating objects and then instances of those objects. Therefore, the agent type determines the attributes, rules and behavior. Then, one or several agents are instantiated from this agent type. In general, agents are the building blocks of the operational scenario and can be individuals (e.g., consumers) or even things (e.g., machines). As mentioned above, agents are divided into $ \mathrm{SAs} $
and
$ \mathrm{CAs} $
based on the definition of the system boundary.
$ \mathrm{SAs} $
are the core entities within the defined system boundary. They are directly under investigation and usually have a higher level of detail in the model. On the other hand,
$ \mathrm{CA} $
exists outside the system boundary but can still influence the behavior of an
$ \mathrm{SA} $
. Their level of detail is typically lower. Finally,
$ \mathrm{EA} $
is a separate class that operates behind the scenes. They are primarily used to ensure the smooth functioning of the simulation (e.g., data collectors or third-party integrators).
$ \mathrm{SAs} $
and
$ \mathrm{CAs} $
based on the definition of the system boundary.
$ \mathrm{SAs} $
are the core entities within the defined system boundary. They are directly under investigation and usually have a higher level of detail in the model. On the other hand,
$ \mathrm{CA} $
exists outside the system boundary but can still influence the behavior of an
$ \mathrm{SA} $
. Their level of detail is typically lower. Finally,
$ \mathrm{EA} $
is a separate class that operates behind the scenes. They are primarily used to ensure the smooth functioning of the simulation (e.g., data collectors or third-party integrators). -
2. Agent properties: Once the pool of agent types has been determined, their individual properties must be defined. These include the agent’s attributes, rules and behavior. Attributes comprise the physical capabilities of the agent, rules guide the agent’s decision-making process and behaviors define the state transition dynamics for the agent based on its attributes and the rules it follows. State transition dynamics imply how the system changes over time, and these transitions can be simulated at different fidelity levels based on the application. In this work, defining the input and output data for each agent type is critical. This is partly to ensure that the correct and sufficient data can be passed between agents and that the agent’s behavior is compatible with these inputs/outputs. Clearly defined inputs and outputs are required to allow smooth change of fidelity level and avoid intra- and inter-agent mismatches.
-
3. Environment: The environment is the virtual world where the agents interact with each other and their surroundings. It is built using the environment library in the integrated simulation framework. This library is composed of predefined elements that serve as the building blocks of the environment, such as weather phenomena, topology, road networks, power grids and so forth. Interactions of the agent with the environment are an integral part of the ABS since they can significantly affect its performance. Notably, the environment is not limited to static elements. When environmental elements exhibit dynamic behavior, for instance, routes opening and closing, becoming one-way or adjusting speed limits based on surrounding events, modeling them as
$ \mathrm{CAs} $
can be advantageous. For similar reasons, the environment can be modeled through a bundle of agents to ease the modeling process. -
4. Interactions: Interactions often involve exchanging information, allowing the operational scenario to evolve as the simulation unfolds. Within the operational scenario, the system–system interactions are modeled through communication between
$ \mathrm{SAs} $
, while system–context interactions are modeled via communications with
$ \mathrm{CAs} $
, for example, enabling systems (Walden et al. Reference Walden, Roedler, Forsberg, Hamelin and Shortell2015). Crucially, both
$ \mathrm{SAs} $
and
$ \mathrm{CAs} $
interact with the virtual environment, which forms the foundation of the operational scenario. The interaction should be deployed so that it mirrors the intended SoS as closely as possible. Agents will only interact where an interaction has been programmed. It is thus essential to thoroughly go through all possible and necessary interactions and ensure that the simulation accounts for them. These interactions should also steer the type of input/output declarations of the agent. -
5. Simulation: By this step, all the necessities should have been developed in the simulation model, and the required analytical models should have been linked to their corresponding agents. Once the linking is verified, the simulation is executed. The initialization of a simulation starts with creating the virtual context and generating agent instances based on selected operational scenarios. As the setup runs, the agents follow their program, interacting with other agents and the environment until the simulation model time is complete or a simulation stop is triggered. An event-based scheduling was deployed since the agents might have different time-step granularities. This means that the simulation model will do steps corresponding to the next event, for example, hauler movement or work order dispatch. This means that the agent’s behavior does not have to align with a fixed time step but can be dynamically scheduled to allow for higher temporal granularity and computational efficiency. Fundamentally, the simulation model will step between events rather than discretize time in fixed periods. As the operational scenario evolves over time, selecting a modeling time long enough to capture this evolvement and the natural fluctuations that might occur is essential.
-
6. Refine: This step mainly consists of analyzing the results. If needed, the model is refined, and the simulation is rerun. Once a satisfactory level is achieved, the simulation model can be deployed for experiments and decision support.


Figure 3 illustrates a schematic example of the integrated simulation framework for SoS value exploration with instances of different operational scenarios. This framework acts as a repository of reusable elements from which various operational scenarios can be constructed based on the design challenge. It comprises user-defined $ \mathrm{SAs} $
and
$ \mathrm{SAs} $
and $ \mathrm{CAs} $
alongside a predefined library of environmental elements. The fidelity level assigned to
$ \mathrm{CAs} $
alongside a predefined library of environmental elements. The fidelity level assigned to $ \mathrm{SAs} $
and
$ \mathrm{SAs} $
and $ \mathrm{CAs} $
reflects the importance of accurately representing their dynamics. Among these,
$ \mathrm{CAs} $
reflects the importance of accurately representing their dynamics. Among these, $ {\mathrm{SA}}_2 $
is designated with medium fidelity, while
$ {\mathrm{SA}}_2 $
is designated with medium fidelity, while $ {\mathrm{SA}}_3 $
is assigned high fidelity. In addition,
$ {\mathrm{SA}}_3 $
is assigned high fidelity. In addition, $ {\mathrm{CA}}_1 $
is assigned medium fidelity, while
$ {\mathrm{CA}}_1 $
is assigned medium fidelity, while $ {\mathrm{CA}}_2 $
is assigned low fidelity. Not every agent may be utilized to create an operational scenario, and hence, no fidelity level is specified for some agents. The operational scenarios built using the integrated simulation framework are shown in Figure 3. For example, operational scenario A comprises five
$ {\mathrm{CA}}_2 $
is assigned low fidelity. Not every agent may be utilized to create an operational scenario, and hence, no fidelity level is specified for some agents. The operational scenarios built using the integrated simulation framework are shown in Figure 3. For example, operational scenario A comprises five $ {\mathrm{SA}}_2 $
and two
$ {\mathrm{SA}}_2 $
and two $ {\mathrm{CA}}_1 $
. Solid lines depict system–system interaction and dashed lines depict system–context interaction. Similarly, operation scenario B comprises two
$ {\mathrm{CA}}_1 $
. Solid lines depict system–system interaction and dashed lines depict system–context interaction. Similarly, operation scenario B comprises two $ {\mathrm{SA}}_2 $
, two
$ {\mathrm{SA}}_2 $
, two $ {\mathrm{SA}}_3 $
, two
$ {\mathrm{SA}}_3 $
, two $ {\mathrm{CA}}_1 $
and so on. Thus, the integrated simulation framework serves as the foundation that the users leverage to construct diverse operational scenarios without needing to remodel the agents and environment. Each operational scenario dictates which agent types are to be included, how many agents will be instantiated and their specific attributes.
$ {\mathrm{CA}}_1 $
and so on. Thus, the integrated simulation framework serves as the foundation that the users leverage to construct diverse operational scenarios without needing to remodel the agents and environment. Each operational scenario dictates which agent types are to be included, how many agents will be instantiated and their specific attributes.
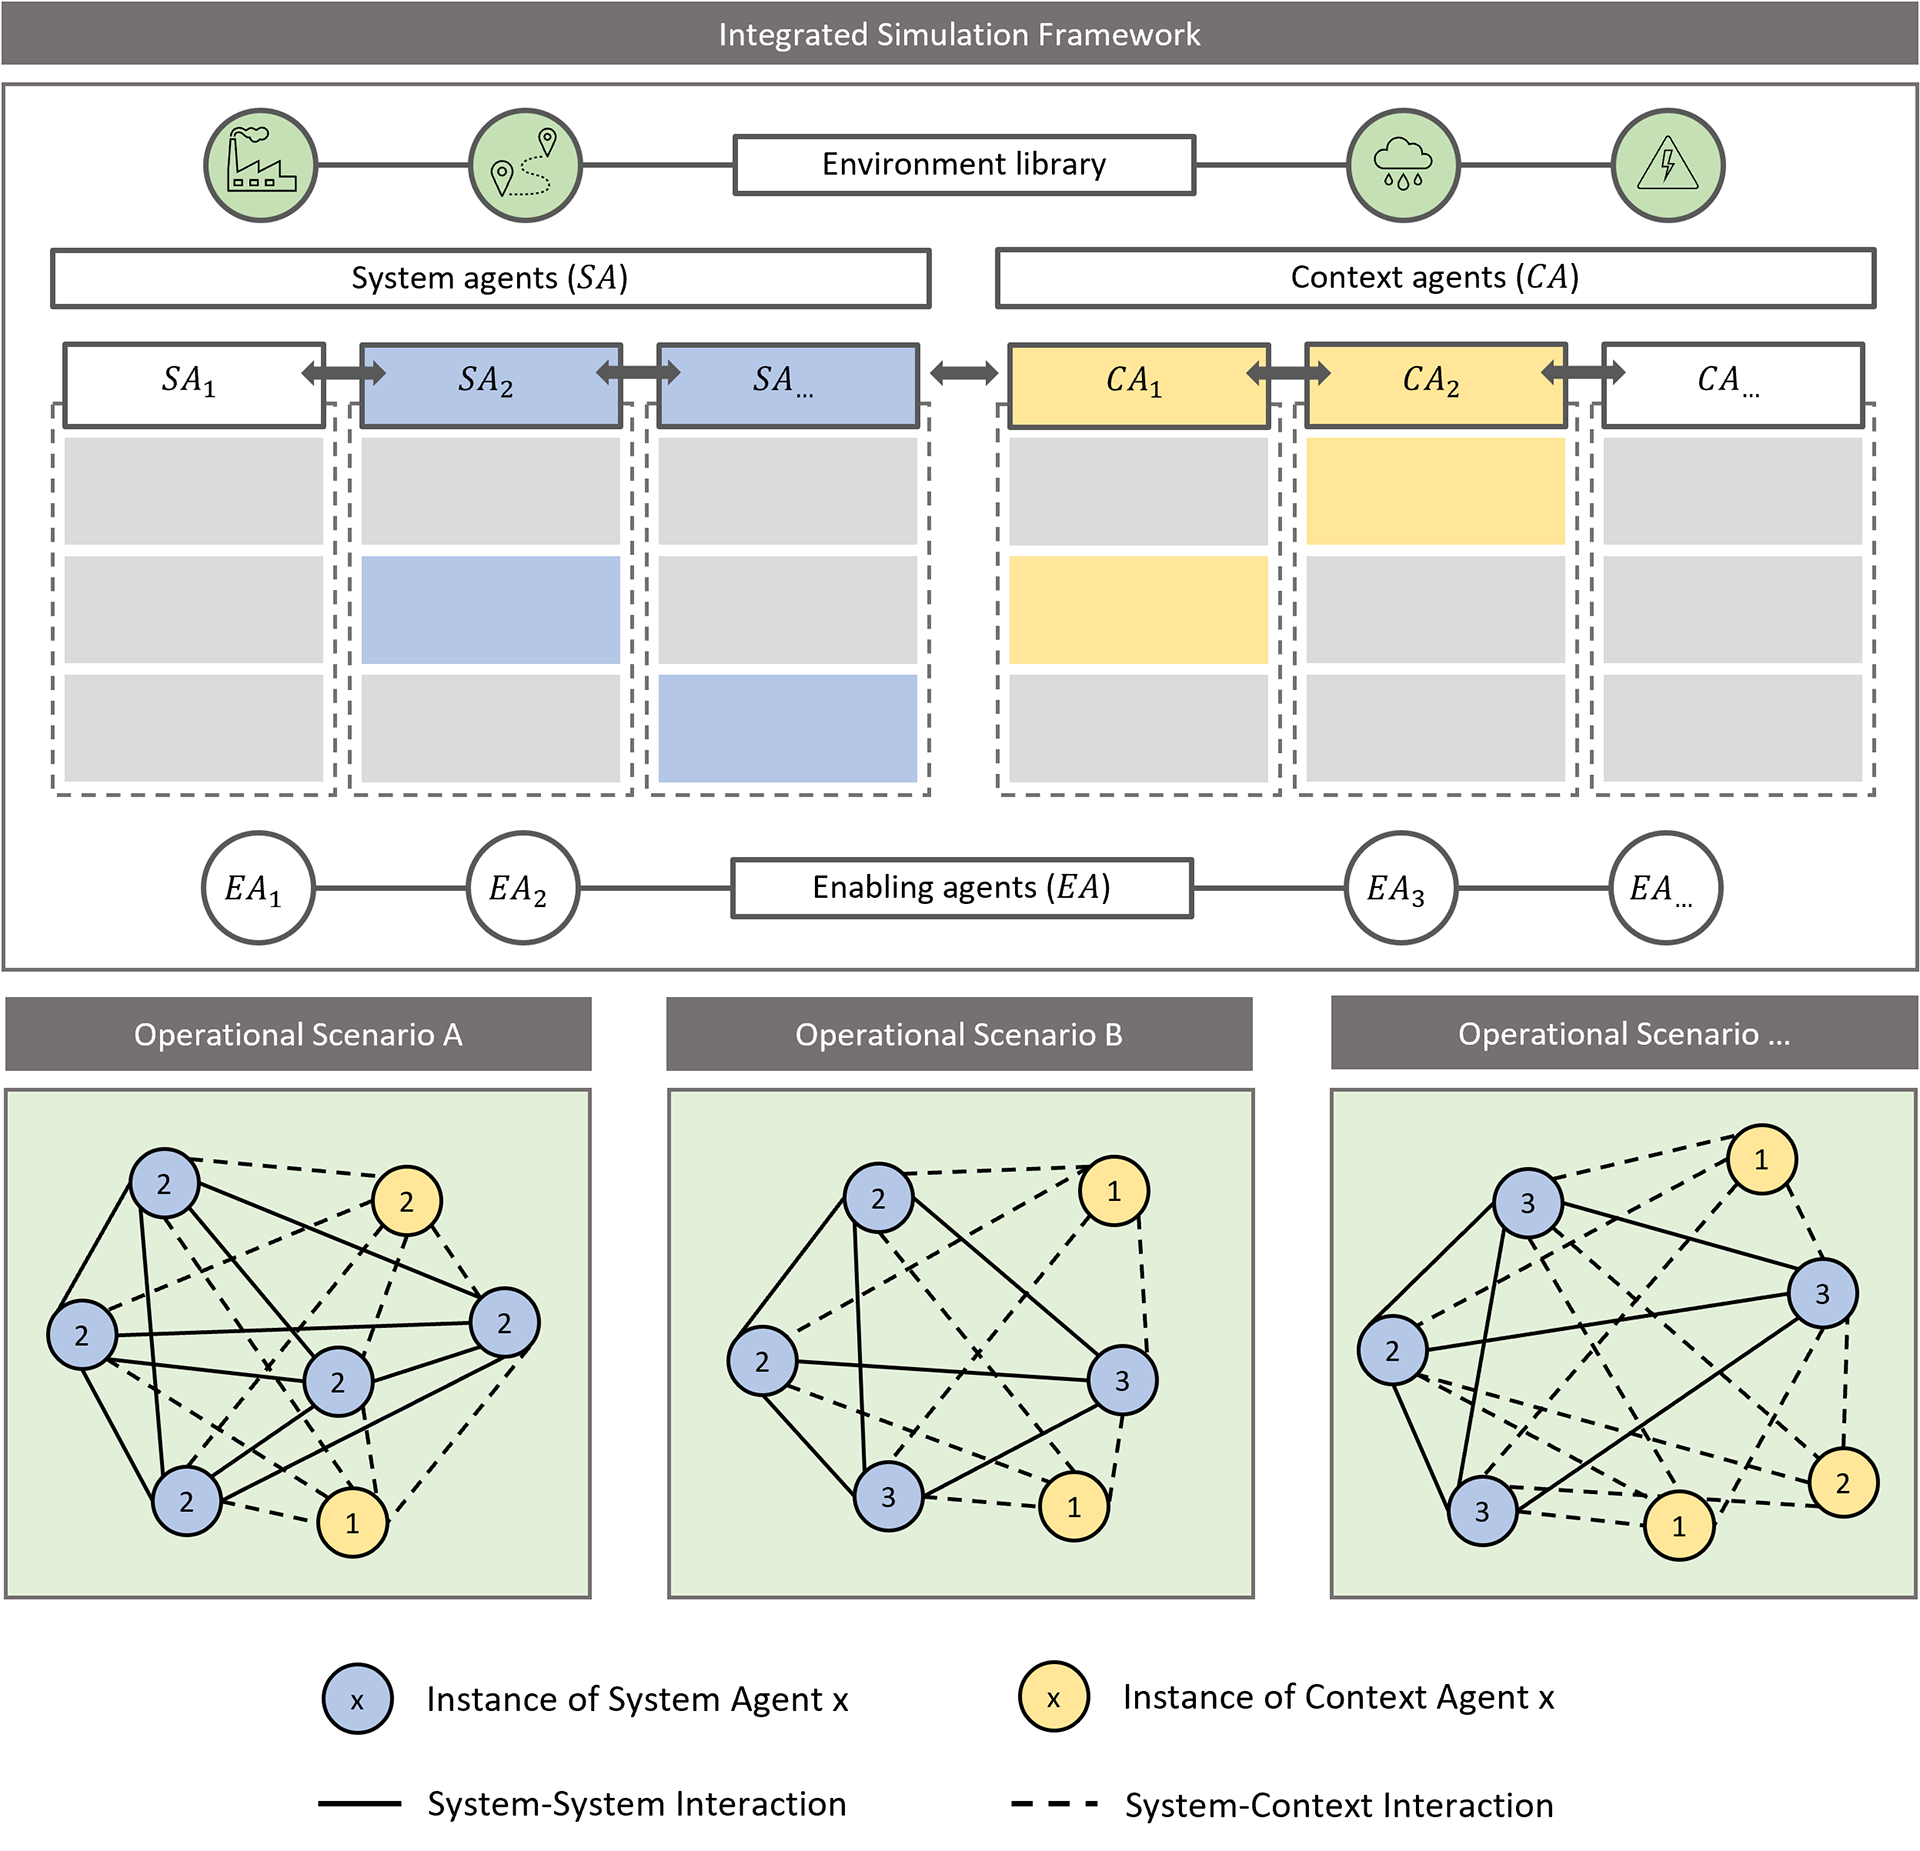
Figure 3. Overview of the proposed integrated simulation framework for SoS value exploration.
Effective decision-making in many applications relies on accurately modeling the state transition dynamics. However, directly including such a complex model within the core ABS tool may not be practical. Such tools are mainly for general purposes and are unsuited to specific problems (Dehghanimohammadabadi & Keyser Reference Dehghanimohammadabadi and Keyser2017). Therefore, integrating the state transition dynamics for decision-making using an external simulator can be worthwhile. This inclusion allows users to choose high-fidelity behavior models for agents, where the external model (e.g., vehicle dynamics and machine learning) handles the computationally intensive state transition calculations when agents interact with each other or the environment. Further, this allows the behavior models to be swapped more efficiently, providing higher flexibility and scalability for the simulation. The intention is that this allows for simulation models that balance accuracy and effort while still maintaining a holistic perspective essential for multidisciplinary decision-making.
5. Case study: development of an electric-autonomous transport solution for a quarry
A case study was conducted in collaboration with a partner company that provides transport solutions and services in the quarry industry to test the integrated simulation framework. The quarry industry is undergoing an electromobility and digital transition, replacing man-operated diesel machines with electric-autonomous vehicles and remote-controlled sites (Sánchez & Hartlieb Reference Sánchez and Hartlieb2020). Quarry companies consider autonomy a key technology for enhancing safety, efficiency and uptime while lowering emissions and costs (Caterpillar 2021; Komatsu 2023; Volvo Autonomous Solutions 2023). From a business perspective, this goes in line with emerging business models such as transport as a service (Volvo Autonomous Solutions 2023) and the general transition from product-centric sales to total care solutions (Kumar & Kumar Reference Kumar and Kumar2004). However, several challenges are connected to this transition. Examples include energy consumption and regeneration patterns, selecting the most promising technologies and solutions and the interdependencies between electric vehicles, infrastructure and environmental factors (Ertugrul et al. Reference Ertugrul, Kani, Davies, Sbarbaro and Moran2020). From a high-level perspective, a quarry can be viewed as a SoS consisting of multiple systems interacting with each other, for example, wheel loaders, haulers and crushers. Hence, performing SoS simulations can be a good approach for exploring the impact and usefulness of electrification and autonomy in the quarry industry.
Previous quarry simulation research shows examples of system behavior/dynamics based on lookup tables and probabilistic functions (Salama, Greberg & Schunnesson Reference Salama, Greberg and Schunnesson2014; Ghaziania et al. Reference Ghaziania, Monjezi, Mousavi, Dehghani and Bakhtavar2021; Huayanca, Bujaico & Delgado Reference Huayanca, Bujaico and Delgado2023). However, the potential impact of an electric powertrain and its ability to influence the consumption rate when operating autonomously requires more complex dynamics to be modeled accurately. On the other hand, some systems are sufficient to be modeled using simpler approaches. This means that a multifidelity analytical model combined with simulations is viable for addressing this challenge.
5.1. Problem formulation
The first step in the process was to better frame the challenge in the electric-autonomy transition for mines and quarries. This was achieved through a collaborative effort between researchers and practitioners. Figures 4 and 5 depict the quarry process, specifically the quarry operations, from the extraction of blasted rock to the final stage of crushed material production. The process description is developed using the IDEF0 functional modeling method. Since the hauling of material (Step A3) is of primary interest, that step has been expanded.
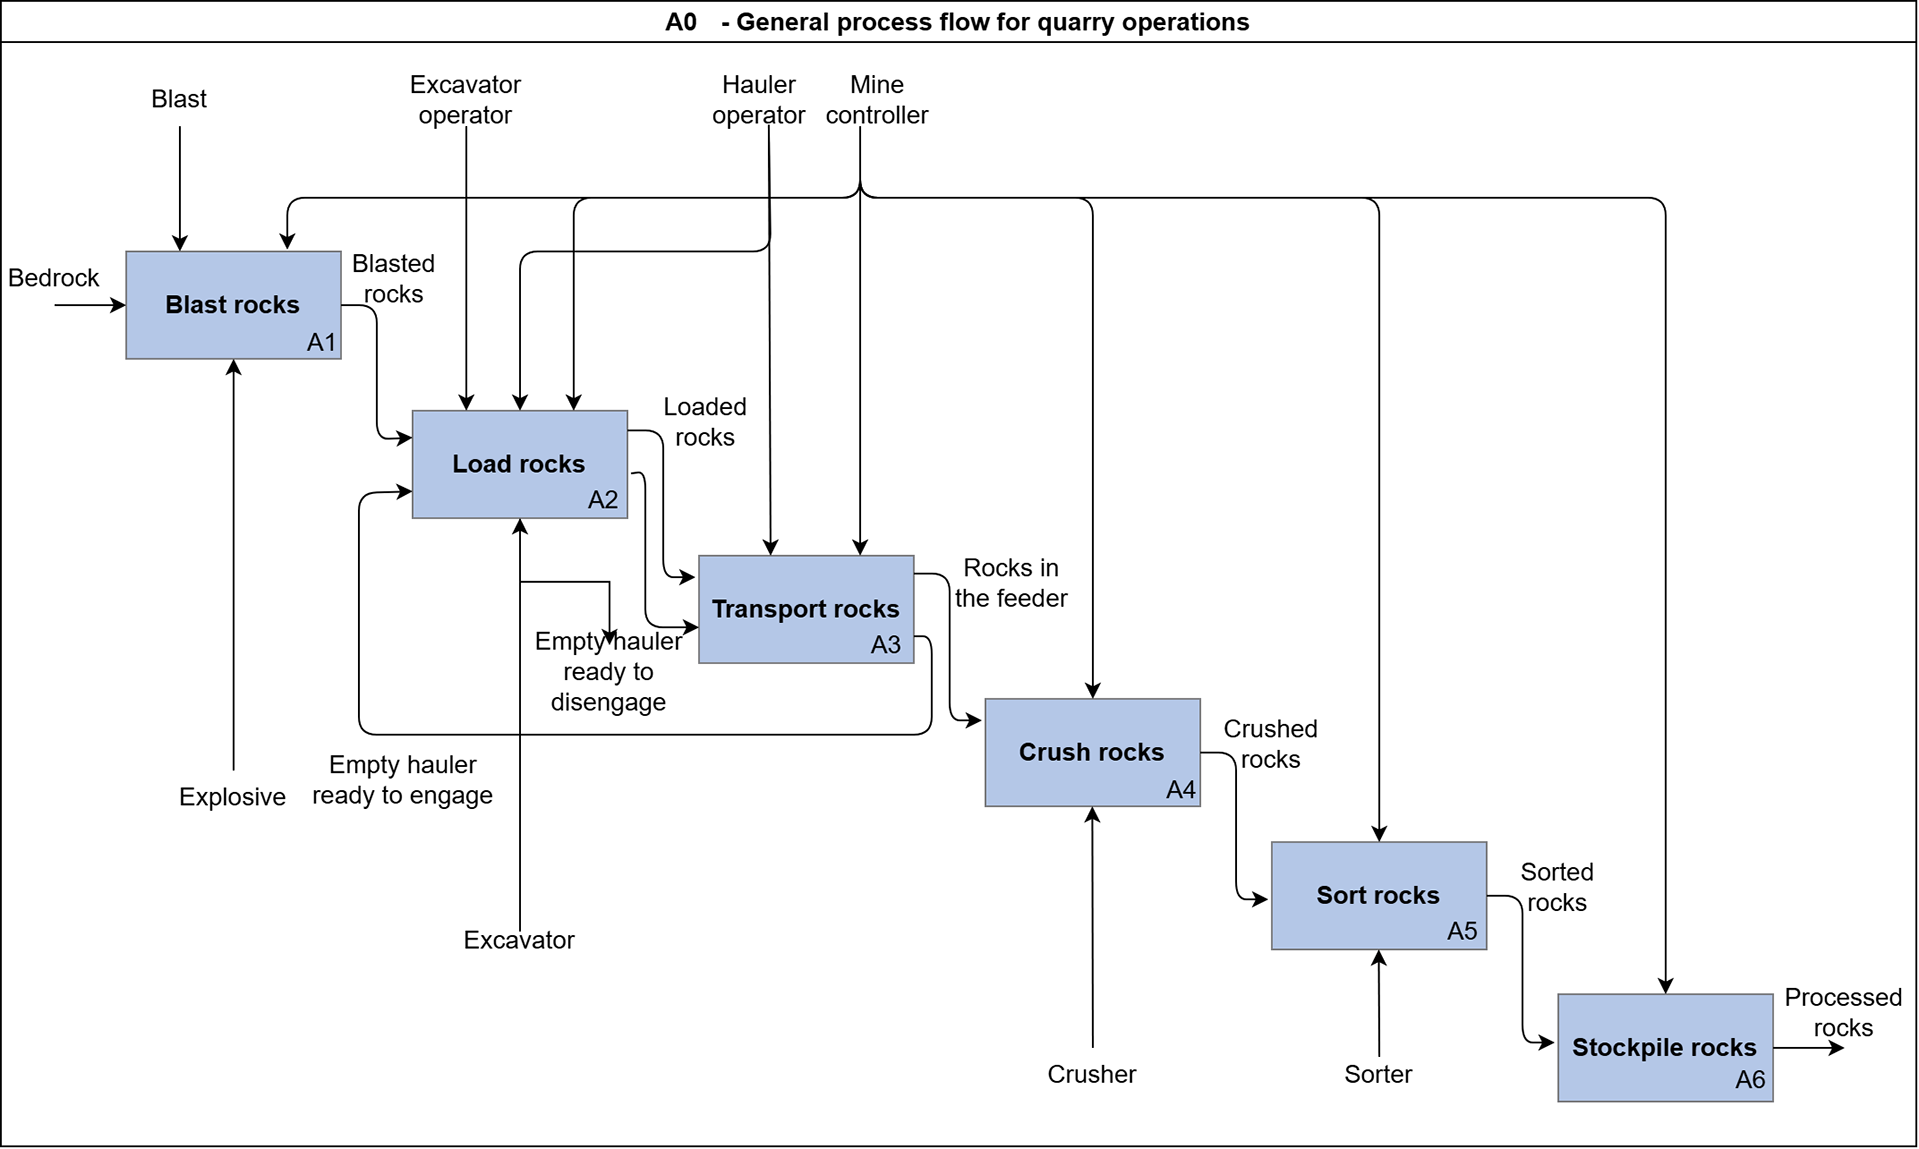
Figure 4. IDEF0 diagram of quarry operations.
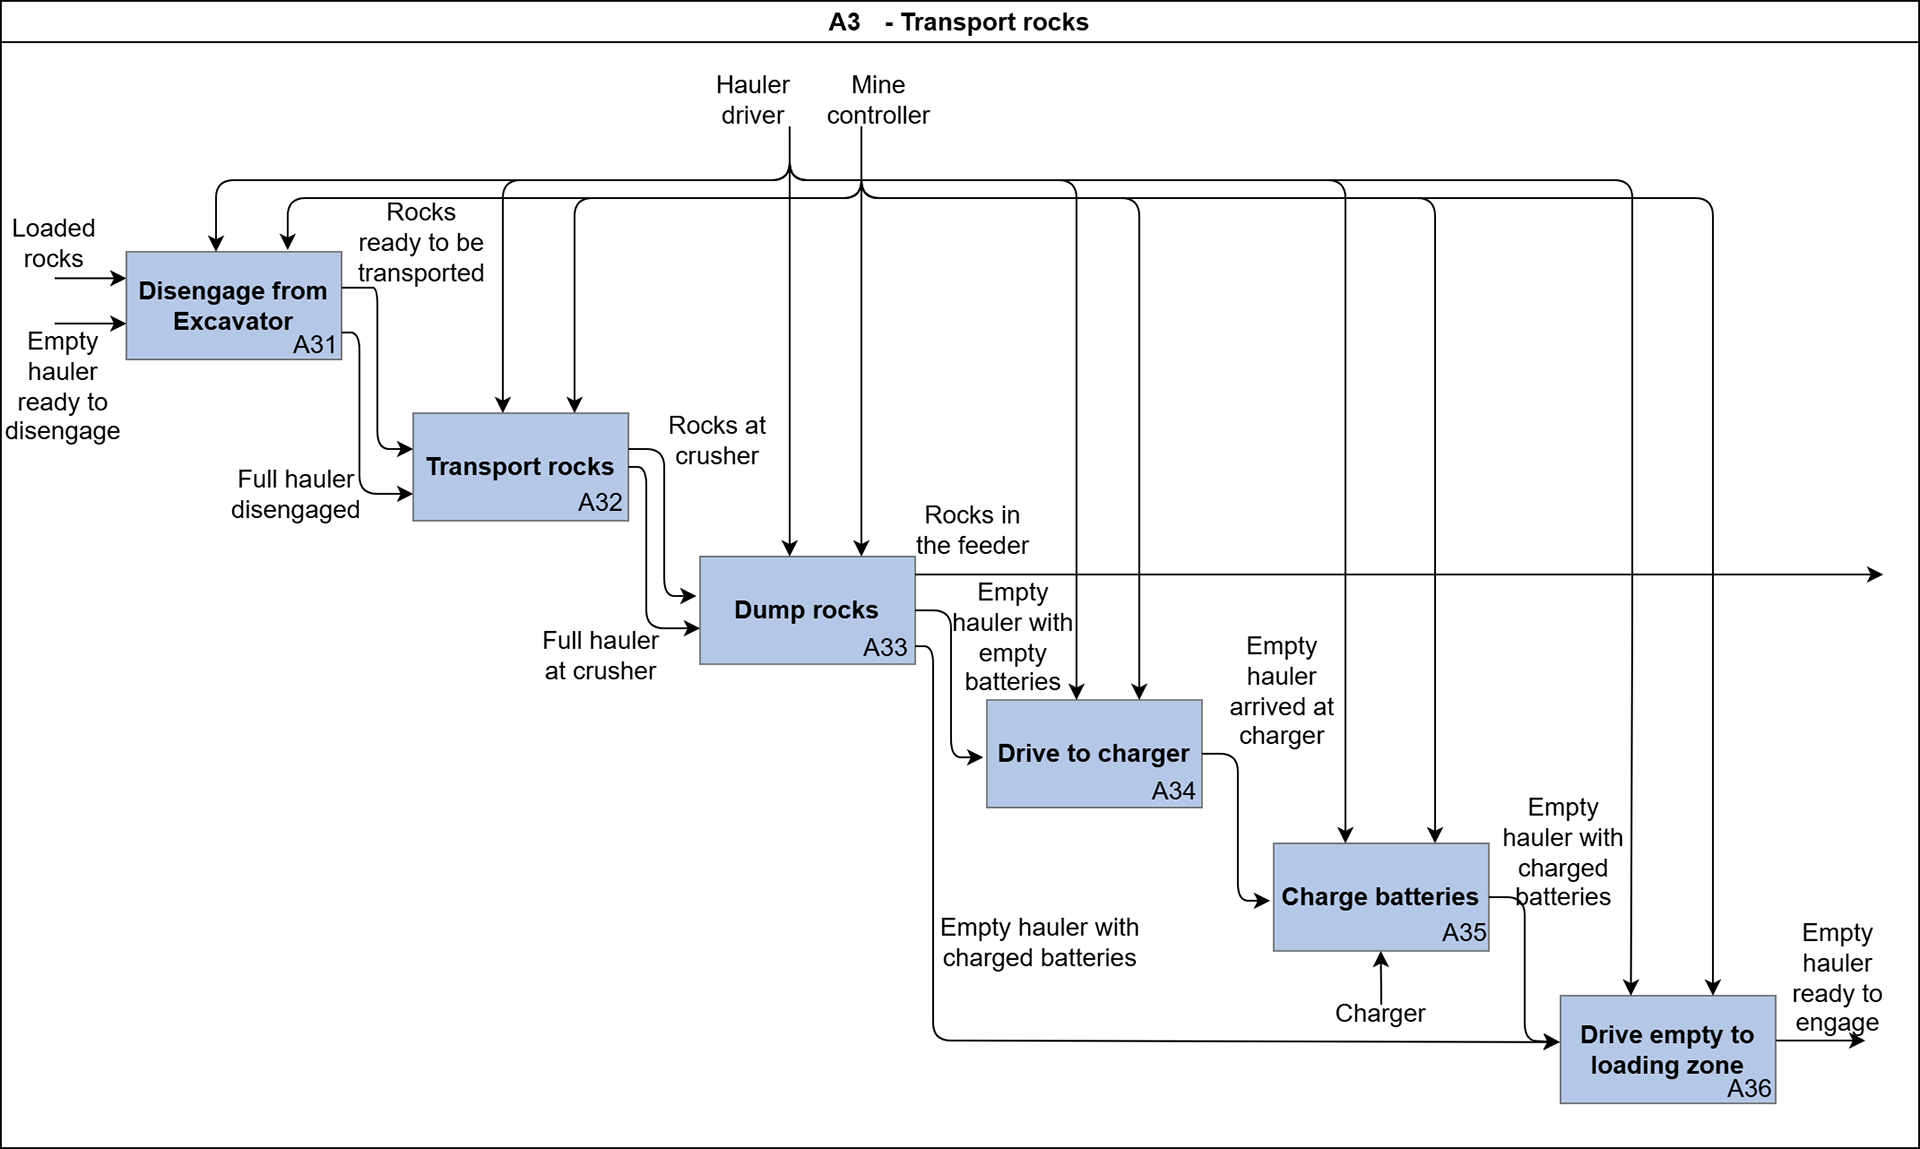
Figure 5. IDEF0 diagram of rock transportation.
A causal loop diagram was developed alongside the process model to understand the complex interactions within the simulation (refer to Figure 6). This diagram maps the internal and external dependencies between different elements of the included systems. It visually shows how changes in one element can affect others within the SoS. Positive (+) and negative (−) signs on the connections indicate whether an increase/decrease in one element has a beneficial or detrimental effect on the other. Ultimately, this diagram, together with the process flow in Figure 4, helps determine the appropriate level of fidelity needed for each simulated agent and whether an agent type should be considered.
Building on the work of Toller Melén & Watz (Reference Toller Melén, Watz, Camarinha-Matos, Boucher and Ortiz2023), the causal loop diagram was developed using a weighted value aggregation model. This model recognizes that different performance metrics contribute to overall value creation to varying degrees. Thus, weights were assigned to each metric in the aggregation, reflecting their relative importance. The value dimensions and their weights were determined collaboratively and then normalized for consistency. The thickness of the arrows in the causal loop diagram visually represents the weight assigned to each connection. The top section of Figure 6 identifies three key value aspects for a quarry (yellow bubbles): productivity, sustainability and utilization. Design objectives or performance metrics are then linked to each value dimension, explaining how these objectives contribute to achieving that value (green bubbles). Finally, different parts of the quarry operation are mapped to these design objectives, showing how they influence overall value delivery. The diagram reveals that an electric-autonomous quarry has multiple interdependencies, with context (e.g., road conditions and weather) and haulers having the most substantial influence. This makes sense as haulers are the case study’s focus on the hauling process in a mine.
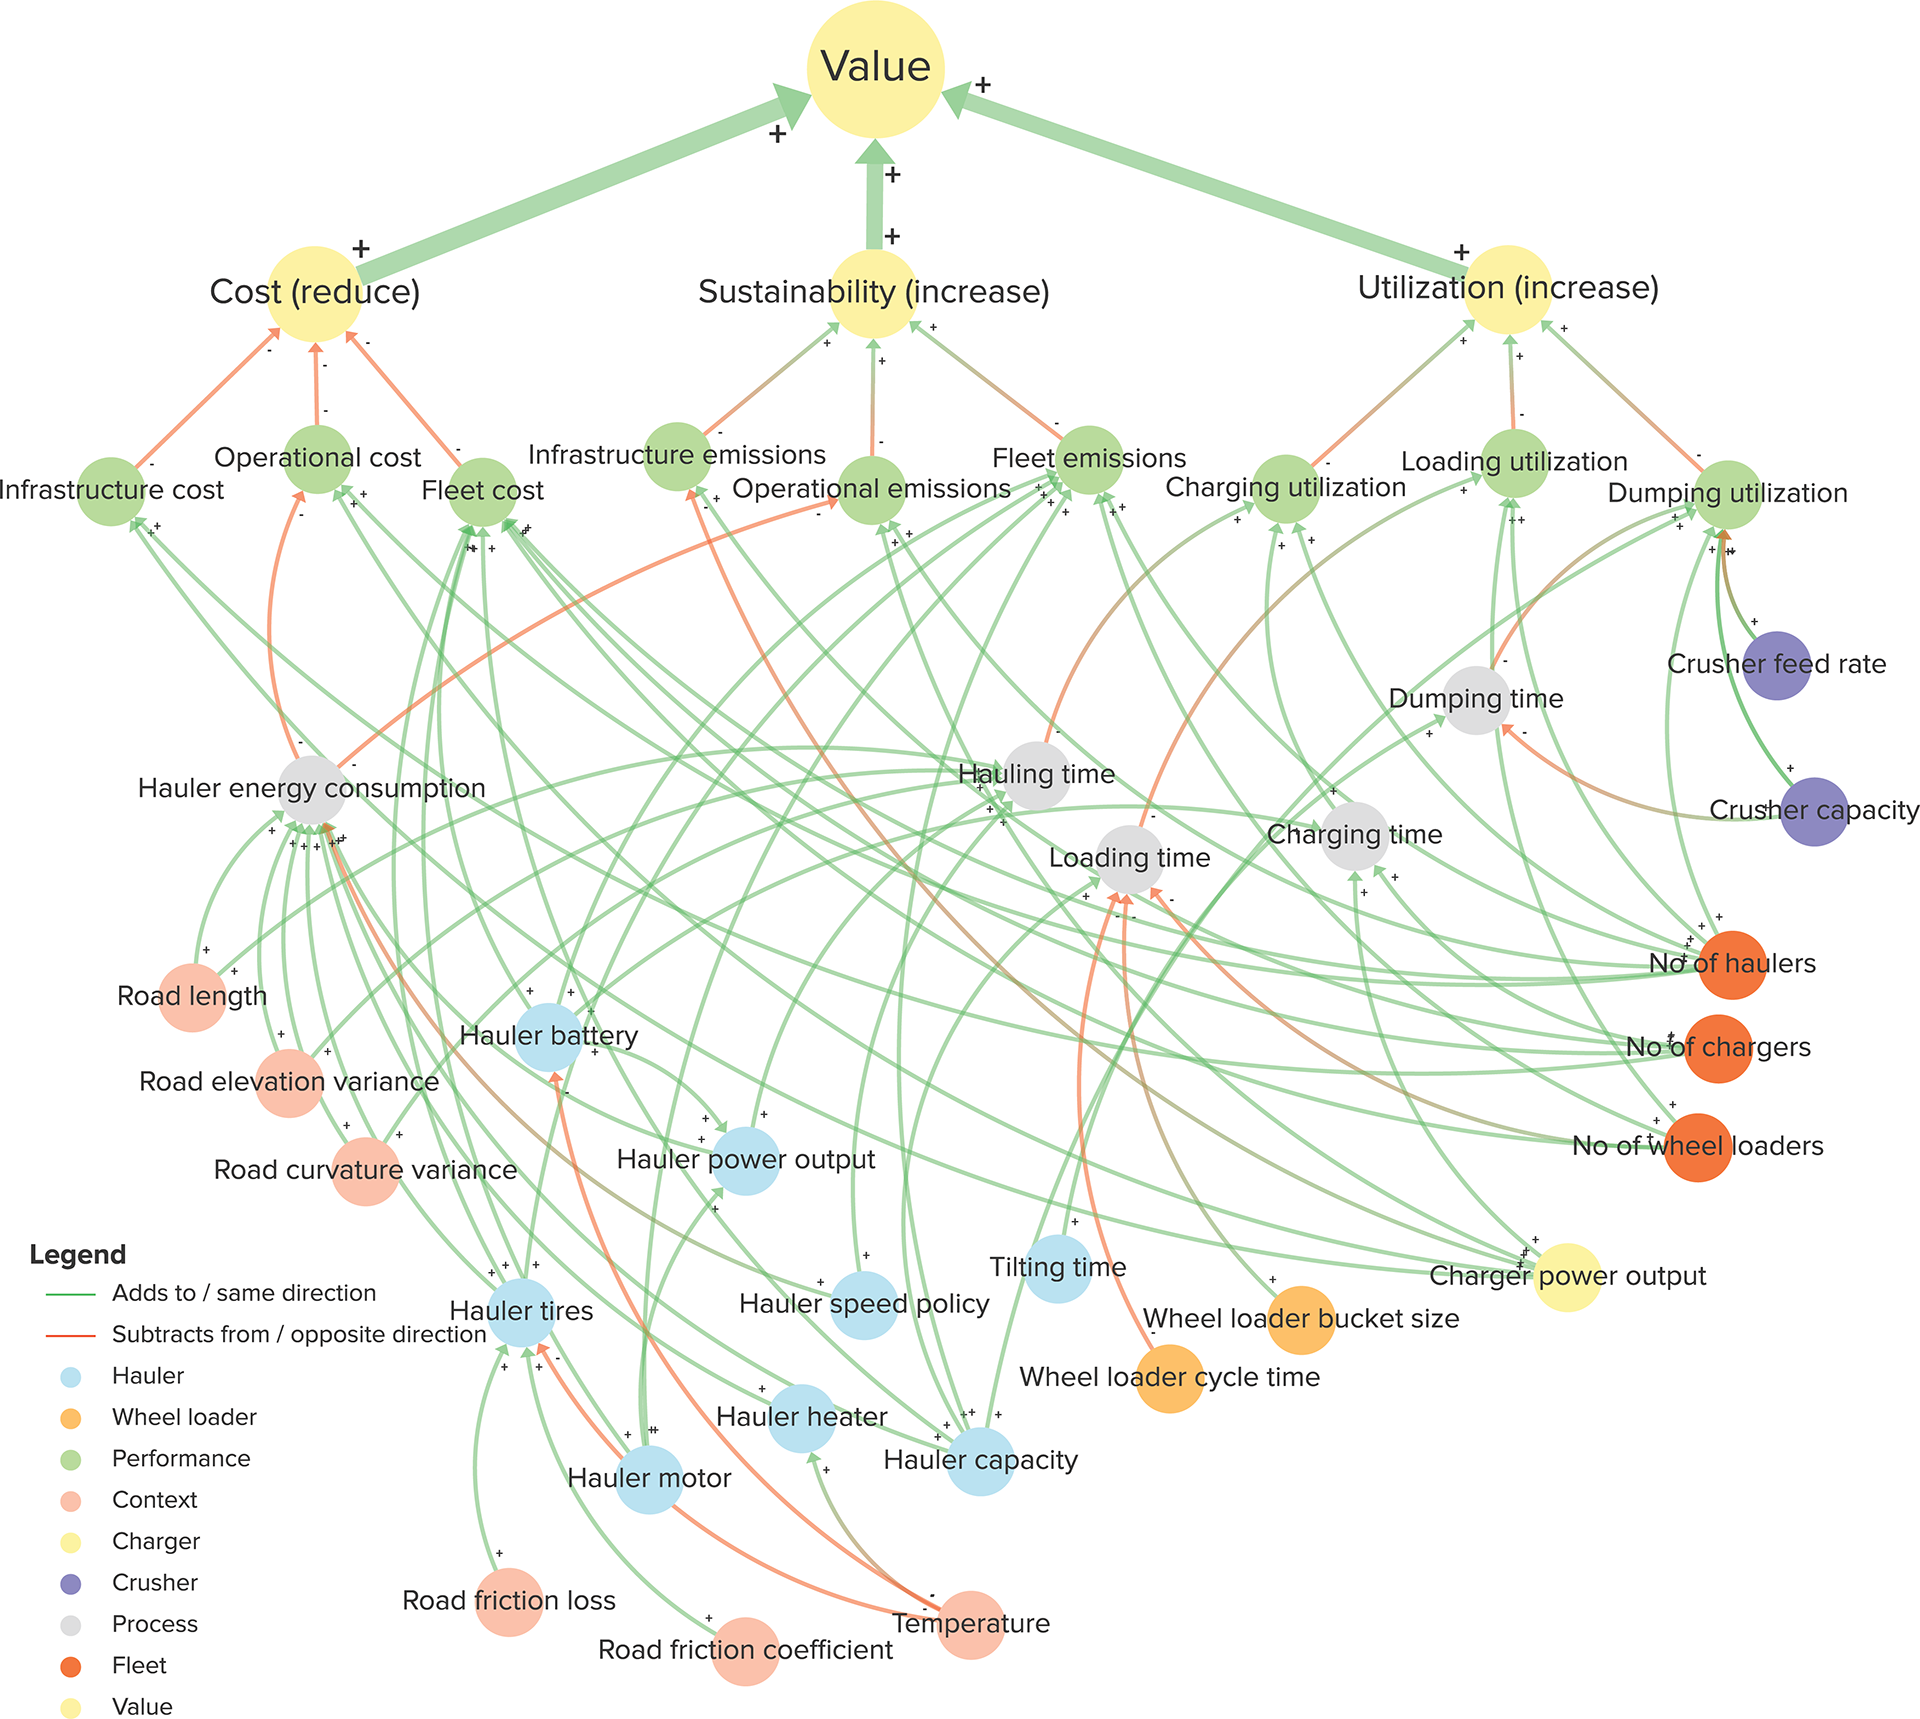
Figure 6. Causal loop diagram and the weighted aggregation for value for the quarry scenario.
5.2. Value function definition
Soban, Price & Hollingsworth (Reference Soban, Price and Hollingsworth2012) emphasize that the value function is the most central aspect of a VDD approach and essential for achieving comparability between dispersed concepts. The case study utilizes the causal loop diagram, where performance metrics, value dimensions and their respective weighting have been derived. The value aggregation further allows for stepwise evaluation of the value creation and thus enables a design team to obtain both width and depth in the analysis. Equations (1) and (2) illustrate how the overall value is calculated:
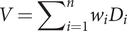 $$ V={\sum}_{i=1}^n{w}_i{D}_i $$
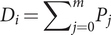 $$ {D}_i={\sum}_{j=0}^m{P}_j $$
Here, $ V $
indicates the overall value,
$ V $
indicates the overall value, $ w $
denotes the weights used for aggregation,
$ w $
denotes the weights used for aggregation, $ D $
implies a value dimension and
$ D $
implies a value dimension and $ P $
implies a performance metric. The weights assigned to each value dimension reflect their relative importance in determining overall value. This weighting is crucial because the value dimensions (i.e., cost, sustainability and utilization in Figure 6) use normalized units that fit into the value function. Normalization ensures that the value dimensions range between 0 and 1, while the weights reflect their relative importance to the overall value. Such weights may also be applied to the performance metrics. However, since all performance metrics used to calculate a specific value dimension share the same unit, no additional normalization and weighting are needed within those dimensions, which is also a preferable option as it allows for better transparency.
$ P $
implies a performance metric. The weights assigned to each value dimension reflect their relative importance in determining overall value. This weighting is crucial because the value dimensions (i.e., cost, sustainability and utilization in Figure 6) use normalized units that fit into the value function. Normalization ensures that the value dimensions range between 0 and 1, while the weights reflect their relative importance to the overall value. Such weights may also be applied to the performance metrics. However, since all performance metrics used to calculate a specific value dimension share the same unit, no additional normalization and weighting are needed within those dimensions, which is also a preferable option as it allows for better transparency.
For this case study, the weighting numbers are selected for illustrative purposes. The weights for the value dimensions are cost (0.5), sustainability (0.25) and utilization (0.25). Table 1 details all performance metrics and the formulas used to derive them. It is noteworthy that several aspects have not been included in the performance metrics, for example, connectivity costs, emissions from manufacturing and so forth. Only those considered most critical for the selection of design options have been included to maintain the simplicity of the model in this early stage.
Table 1. Performance metrics and their formulas
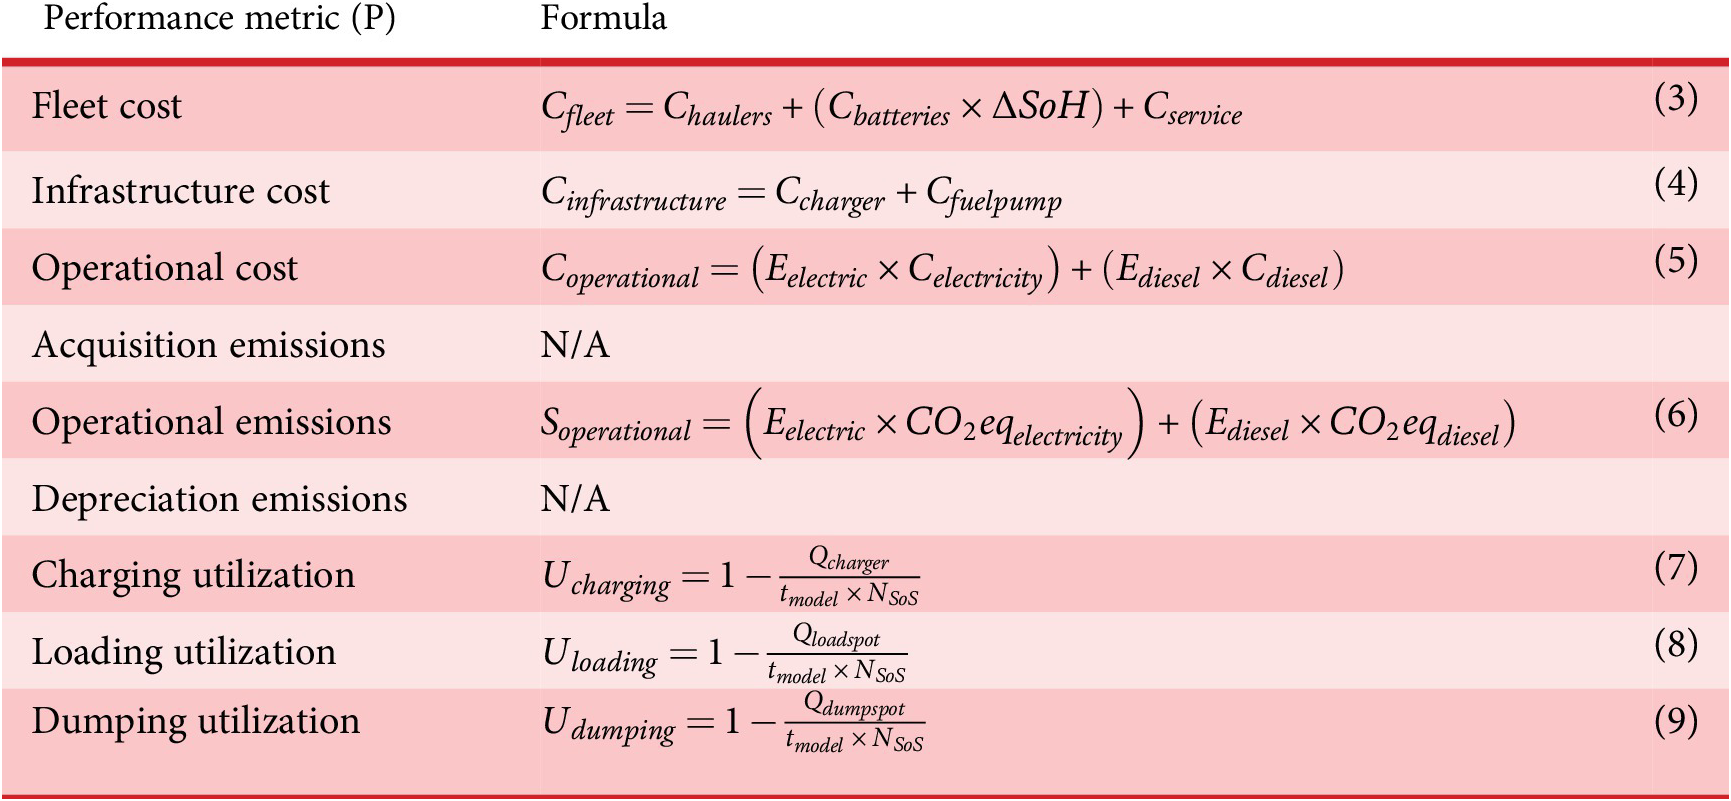
In the performance metrics, $ {C}_{xxx} $
represents the cost,
$ {C}_{xxx} $
represents the cost, $ {E}_{xxx} $
represents the energy consumed,
$ {E}_{xxx} $
represents the energy consumed, $ {S}_{xxx} $
represents the emissions,
$ {S}_{xxx} $
represents the emissions, $ {U}_{xxx} $
represents the utilization and
$ {U}_{xxx} $
represents the utilization and $ {Q}_{xxx} $
the queuing time at the respective factions is denoted by
$ {Q}_{xxx} $
the queuing time at the respective factions is denoted by $ xxx $
in the suffix.
$ xxx $
in the suffix. $ {N}_{SoS} $
is the total number of haulers in the SoS,
$ {N}_{SoS} $
is the total number of haulers in the SoS, $ \Delta SoH $
is the difference in the battery’s state of health (SoH) after the operational period and
$ \Delta SoH $
is the difference in the battery’s state of health (SoH) after the operational period and $ {t}_{model} $
is the model time. All operational costs are extrapolated, and all fixed costs are divided to represent the total annual cost.
$ {t}_{model} $
is the model time. All operational costs are extrapolated, and all fixed costs are divided to represent the total annual cost.
5.3. Simulation setup using modular scenario builder
The integrated simulation framework can now generate a baseline and repository for operational scenario generation based on the case study once the process flow and system interdependencies are established through the process description and causal loop diagram. The operational scenarios incorporate both $ \mathrm{SAs} $
and
$ \mathrm{SAs} $
and $ \mathrm{CAs} $
, as explained in Section 4. Adjacent
$ \mathrm{CAs} $
, as explained in Section 4. Adjacent $ \mathrm{EA} $
s are created to support the simulation execution. Furthermore, the integrated simulation framework provides access to a prebuilt library of elements used to build the virtual world. This allows for creating an environment that serves as the framework for agent interaction within the simulation.
$ \mathrm{EA} $
s are created to support the simulation execution. Furthermore, the integrated simulation framework provides access to a prebuilt library of elements used to build the virtual world. This allows for creating an environment that serves as the framework for agent interaction within the simulation.
Interactions between agents or the environment involve exchanging information, allowing the operational scenario to evolve as the simulation unfolds. The fidelity assigned to each agent is determined by its impact on the overall system and its internal complexity (estimated using the interdependencies identified in the causal loop diagram). Figure 7 depicts the integrated simulation framework with the selected fidelity levels developed for the case study.
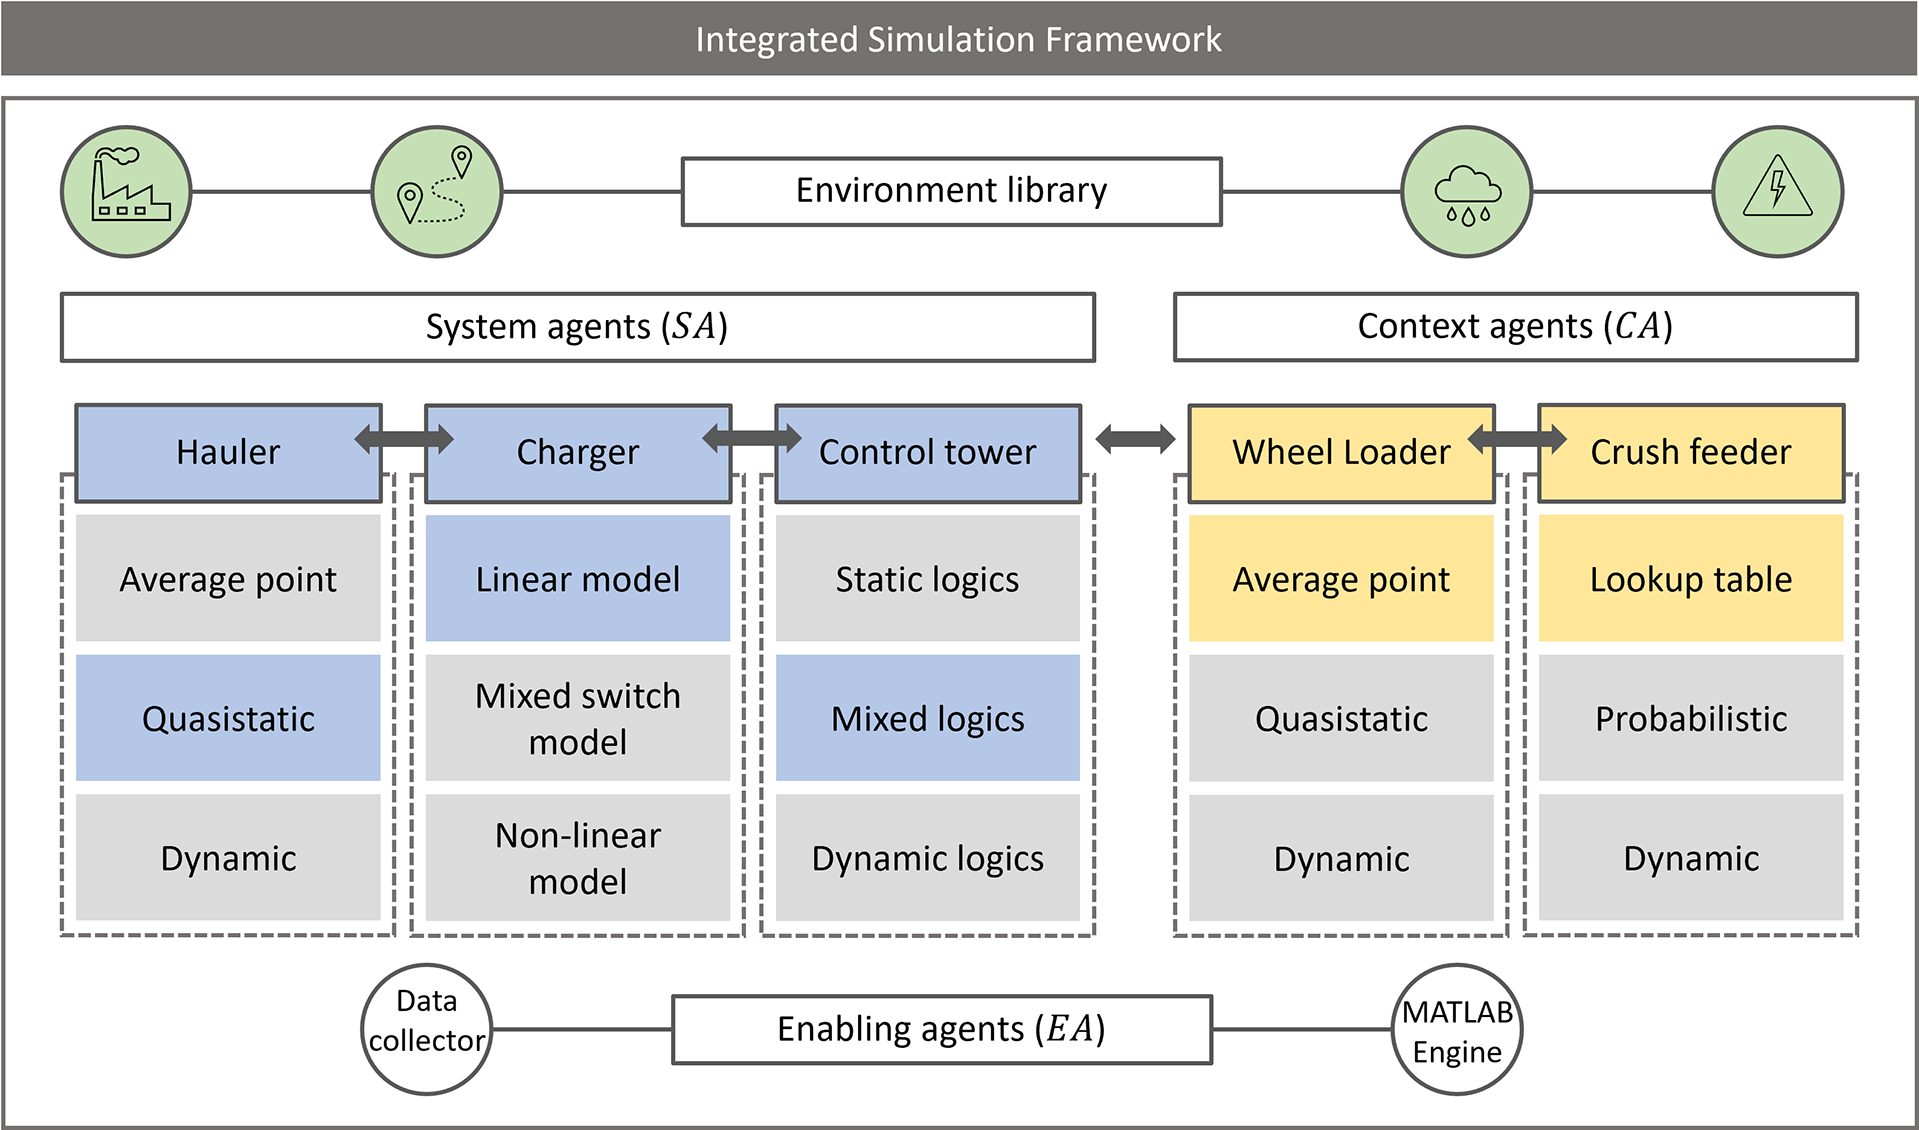
Figure 7. Integrated simulation framework with the chosen fidelity levels.
The $ \mathrm{SAs} $
modeled in the simulation are as follows:
$ \mathrm{SAs} $
modeled in the simulation are as follows:
-
• Hauler: Haulers (or load receivers) are commonly used vehicles at a quarry to transport material from one point to another. From an energy consumption standpoint, once the propulsion models are established for such a vehicle system, they can be analyzed with varying levels of accuracy depending on the computational resources available (Guzzella & Sciarretta Reference Guzzella and Sciarretta2007). The simplest is the average operating point method, which offers a quick but rough estimate by averaging all operating conditions. The quasi-static approach improves accuracy by dividing the operational cycle into segments with constant parameters, and recursive techniques like dynamic programming can then be used to calculate the global optimum. The most precise method is the dynamic approach, which utilizes differential equations to capture the system’s dynamic behavior. The quasi-static approach was chosen since the hauler is the main constituent of the SoS. A dynamic model may not be tractable as the simulation spans more extended periods with numerous variables. Dynamic programming calculates the optimal velocity profile for each movement based on a variable called “time penalty.” The time penalty acts as a tuning knob, adjusting the balance between minimizing energy consumption and minimizing travel time during the control optimization. This allows for control policies prioritizing energy efficiency, time efficiency or a balance of both.
-
• Charger: Charger is a generic type assigned to stations that replenish energy in vehicles in the desired format, that is, the charging poles or fuel pumps. Thus, they could recharge or refuel stations based on the arrival of the vehicle. Since this case study examines electrical haulers, the recharging method is predominantly used. Different levels of fidelity can be used; for instance, a linear model assuming a constant rate, a mixed switch model where the charger switches from constant-current mode to constant voltage mode at given battery state of charge (SoC) thresholds (Wu et al. Reference Wu, Pang, Choy and Lam2018), or a more detailed nonlinear model considering temperature variations (Senol et al. Reference Senol, Bayram, Naderi and Galloway2023). This work chooses a linear model as the ΔSoC is often constrained in the linear region, and higher granularity is deemed unnecessary. The time required to recharge the battery is calculated based on two critical inputs: the power output and the battery specifications. For diesel machines, a simple fixed flow rate is used.
-
• Control tower: The control tower is the backbone of the quarry process. It may be instantiated at global and local levels. Global control towers oversee the entire production line, ensuring smooth workflow and optimizing resource allocation across the whole operation. On the other hand, local control towers focus on specific stations, managing queues and minimizing wait times for haulers by coordinating the local processes. This multilayered control system performs several functions in the operational scenario, such as keeping track of the SoC window for all machines, assigning different time penalties and so forth, and dictates specific agent interactions based on the user-defined logic. For instance, a hauler may be commissioned to a wheel loader or a charger based on availability and SoC status. Parts of the logic are based on static rules such as FIFO queuing, while others use more dynamic logic, for example, charging policy.
The $ \mathrm{CA} $
s modeled in the simulation are:
$ \mathrm{CA} $
s modeled in the simulation are:
-
• Wheel loader: The quarry operation relies heavily on wheel loaders. These are powerful machines with a large bucket at the front end. Their primary function is loading haulers, but they can also be quite versatile, tackling tasks like feeding crushers or sorting stockpiles. In this case study, wheel loaders are beyond the development control. Hence, they are considered as context and modeled using
$ \mathrm{CAs} $
in the modular scenario builder. Analogous to haulers, such a vehicle system can be analyzed at various fidelity levels. The average operating point approach is chosen to save computational resources. Probabilistic functions define the time required to perform the steps in short loading cycles (Frank, Kleinert & Filla Reference Frank, Kleinert and Filla2018), such as approaching the pile, loading the bucket, retracting, approaching the hauler, dumping the bucket and again retracting. The energy consumed is averaged based on the utility. -
• Crush feeder: Haulers unload their payload into a crush feeder. This feeder acts as a buffer, regulating the flow of blasted material to the crusher at a rate that matches the desired production output. However, the crush feeder has a limited capacity. This means a hauler might need to wait to unload if the feeder is currently full and cannot accommodate the entire payload. To prevent equipment malfunctions, the crusher itself cannot operate empty. This creates a balancing act between keeping the feeder from overflowing and ensuring the crusher has a steady material supply. Given the unchangeable nature of the feeder’s behavior in this study, a simple linear function is used within the simulation to model its performance.

In addition, the environment library is a comprehensive repository for all data related to the physical world where agents operate. This data encompasses route properties (distances, elevation, curvature), ambient temperature, weather conditions and so forth. Since no behavioral dynamics of the environment are needed in this case study, they are modeled as static objects for agent interaction.
The simulation can be initialized with the agent being modeled. Repast Symphony (https://repast.github.io/), an open-source and Java-based agent-based modeling toolkit, emerged as the ideal choice due to several advantages. First, its Java foundation ensured seamless integration with MATLAB®, the software used for high-fidelity dynamics simulation within the project. Second, Repast Symphony offered a high degree of flexibility by its ability to import any Java library to support the simulation model. Synchronously with the agent development from Figure 7, some additional agents were created and modeled to support the simulations. Referred to as $ \mathrm{EA} $
s, these agents are not part of the operational scenario but are essential for the simulation execution itself:
$ \mathrm{EA} $
s, these agents are not part of the operational scenario but are essential for the simulation execution itself:
-
• Data collector: Logging simulation data is crucial to effectively evaluate the value of the SoS in different operational scenarios. A dedicated data collector agent was built to capture vital metadata (e.g., configuration details), results data specific to the SoS (e.g., energy consumption and battery health metrics) and statistics data relevant to the operational scenario (e.g., material production, cycle counts and queue times). These data are further used to assess the SoS value of each scenario and inform future refinements through iterative analysis. The
$ \mathrm{SAs} $
and
$ \mathrm{CAs} $
might also be equipped with virtual data sensors, for example, GPS trackers or SoC monitoring, which transmit the sensed value to the data collector for logging and storage. -
• MATLAB Engine: As MATLAB® is used for more advanced dynamics modeling, a separate MATLAB Engine agent was created to be called whenever necessary.


Building trust in the simulation’s ability to replicate real-world quarry operations required a thorough verification process. This step involved leveraging extensive data from a real quarry provided by the partner company and their expertise. Both machine and site models were verified. Machine models were compared against the partner’s existing models and field data to confirm their behavior accurately reflects reality. The site was verified against the company partner’s operational site to ensure the ABS model evolves as expected. With verification done, the simulation model was ready to run the experiments and explore different operational scenarios.
5.4. Experiment setup
These experiments aimed to evaluate the performance of the SoS (comprising a fleet of haulers and supporting infrastructure) under various operational contexts. The following key design and contextual variables were chosen for the experiment:
-
• SoS options: Experiments explored a range of fleet configurations by manipulating vehicle payload capacity (25, 35 and 45 tons), engine type (diesel or electric), control policy or driving style (eco-mode and speed-mode), number of vehicles (4, 5 and 6) and charging station capacity (1 or 2 poles). These options together resulted in 72 unique SoS combinations.
-
• Context options: Three distinct virtual sites were chosen to represent typical quarry industry topologies, including hilly, curvy, and long-haul environments. Road friction (0.03, 0.04 and 0.05) and ambient temperature (−3, 12 and 27 °C) were incorporated as contextual variables to enhance complexity further. These options together resulted in 27 different contextual scenarios.
The combination of 72 SoS configurations and 27 contextual scenarios yielded a total of 1944 operational scenarios to be simulated. The selection of the SoS configuration is mainly for illustrative purposes. The framework has no theoretical limit in terms of configurations and scenarios, yet a practical limit is typically available in computing capacity and time. In addition, parameters that remained fixed throughout the simulation were introduced in the experiment, denoted in Table 2. Operating at total capacity would make the quarry operation susceptible to higher impacts from fluctuations and potentially lead to warranty issues due to excessive strain. To ensure smooth operation and avoid such complications, a 10% buffer was deemed necessary. Thus, a 90% utilization target was introduced as a buffer against unforeseen events like equipment failures, adding some resilience to the SoS.
Table 2. Design parameters and their values
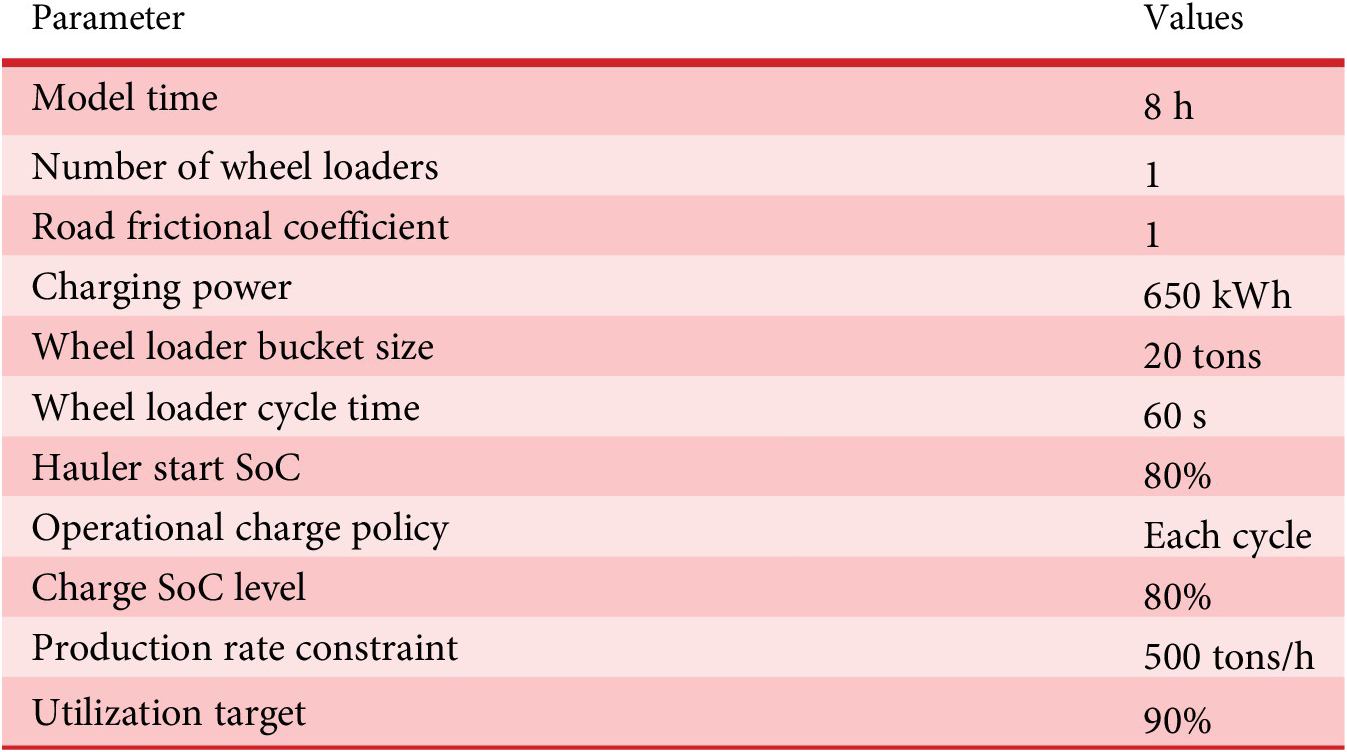
Figure 8 shows the different routes the haulers adopted for Sites A (blue), B (yellow) and C (green), respectively. These routes were selected meticulously to cover different contextual possibilities that a hauler might encounter during its operational phase. All sites are fictive to avoid exposing confidential data. However, their characteristics are based on existing sites. More specifically, these aspects characterize the three sites:
-
• Site A: This route exemplifies a long-haul, significantly consuming the energy reserves of the hauling machines. Otherwise, it contains a manageable elevation profile and relatively gentle curves.
-
• Site B: In contrast to Site A, this route is relatively shorter. It has a smooth and low elevation profile but incorporates a few sharp turns that restrict speed.
-
• Site C: Similar to Site B, this is also a short-haul route. However, it is a prime example of a highly degenerative route since the hauler must climb up the elevation in the loaded state. Moreover, there are numerous bends requiring frequent speed adjustments.

Figure 8. Hauler routes in Sites A, B and C, respectively.
The top view of the sites shows the curvature and paths in X and Y using a Cartesian coordinate system. The total distance for Site A is ~3.2 km, Site B is ~2.1 km and Site C is ~2.4 km.
Figure 9 depicts the elevation profiles for Sites A, B and C. The x-axis in the height profile represents normalized distance, and the y-axis represents height in meters. Normalization is necessary because the actual distances for each site differ.
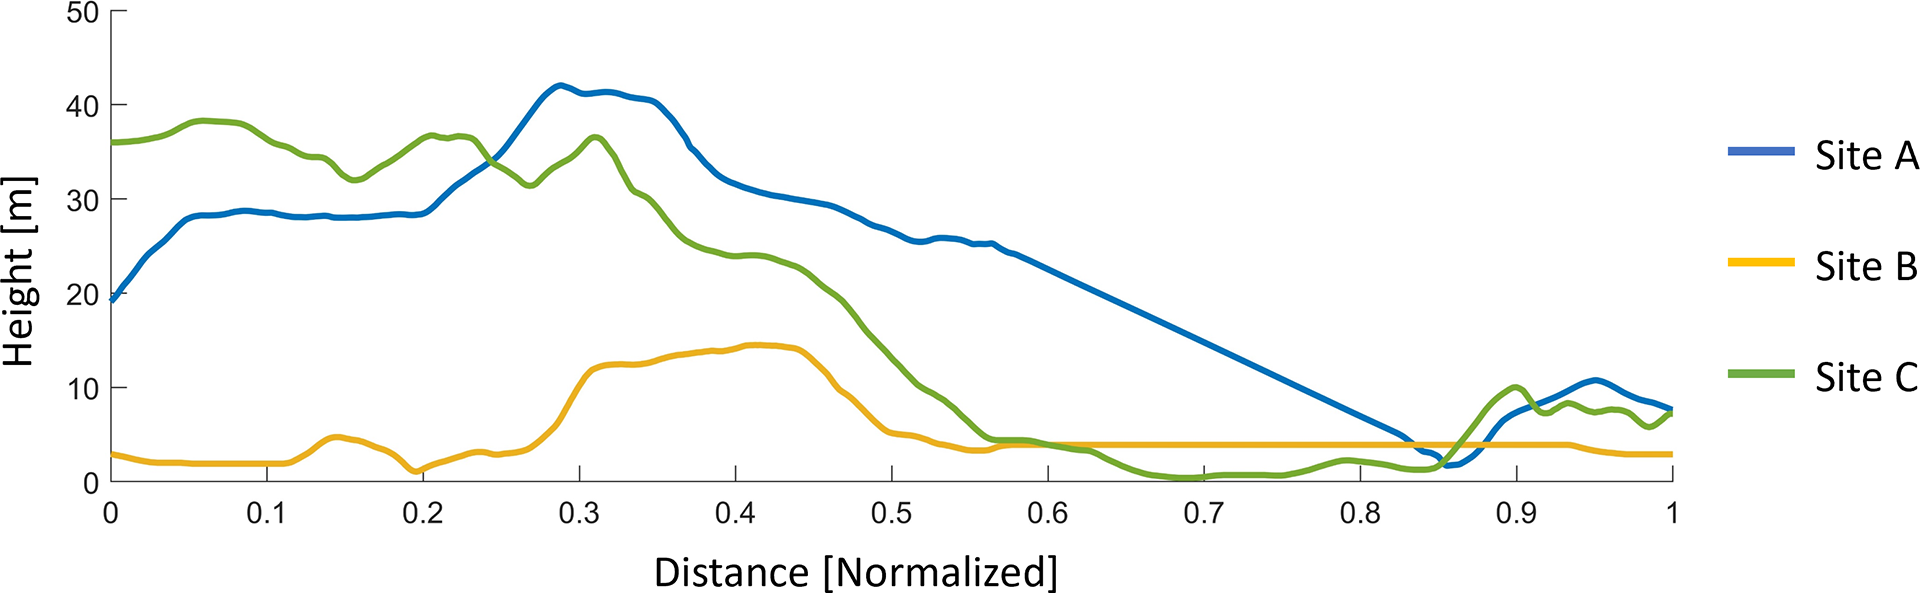
Figure 9. Elevation profile of Sites A, B and C, respectively.
With these variables and parameters defined, the experiment setup was deemed complete. Figure 10 shows an example of an operational scenario built using the integrated simulation framework for Site A using the parameters for fleet number 4 in Appendix A. This fleet comprises four haulers (marked as $ {H}_1\dots {H}_4 $
) and two charging stations (marked as
$ {H}_1\dots {H}_4 $
) and two charging stations (marked as $ {C}_1 $
and
$ {C}_1 $
and $ {C}_2 $
) within the development boundary. In addition, the global control tower that dictates a suitable operational strategy has been marked as
$ {C}_2 $
) within the development boundary. In addition, the global control tower that dictates a suitable operational strategy has been marked as $ {T}_G $
. The local control towers are
$ {T}_G $
. The local control towers are $ {T}_1\dots {T}_3 $
associated with avenues in the operational scenario that require external support in decision-making. These include the chargers
$ {T}_1\dots {T}_3 $
associated with avenues in the operational scenario that require external support in decision-making. These include the chargers $ {C}_1 $
and
$ {C}_1 $
and $ {C}_2 $
within the development boundary and the wheel loaders
$ {C}_2 $
within the development boundary and the wheel loaders $ {W}_1 $
and crusher feeder
$ {W}_1 $
and crusher feeder $ {F}_1 $
in the context.
$ {F}_1 $
in the context.
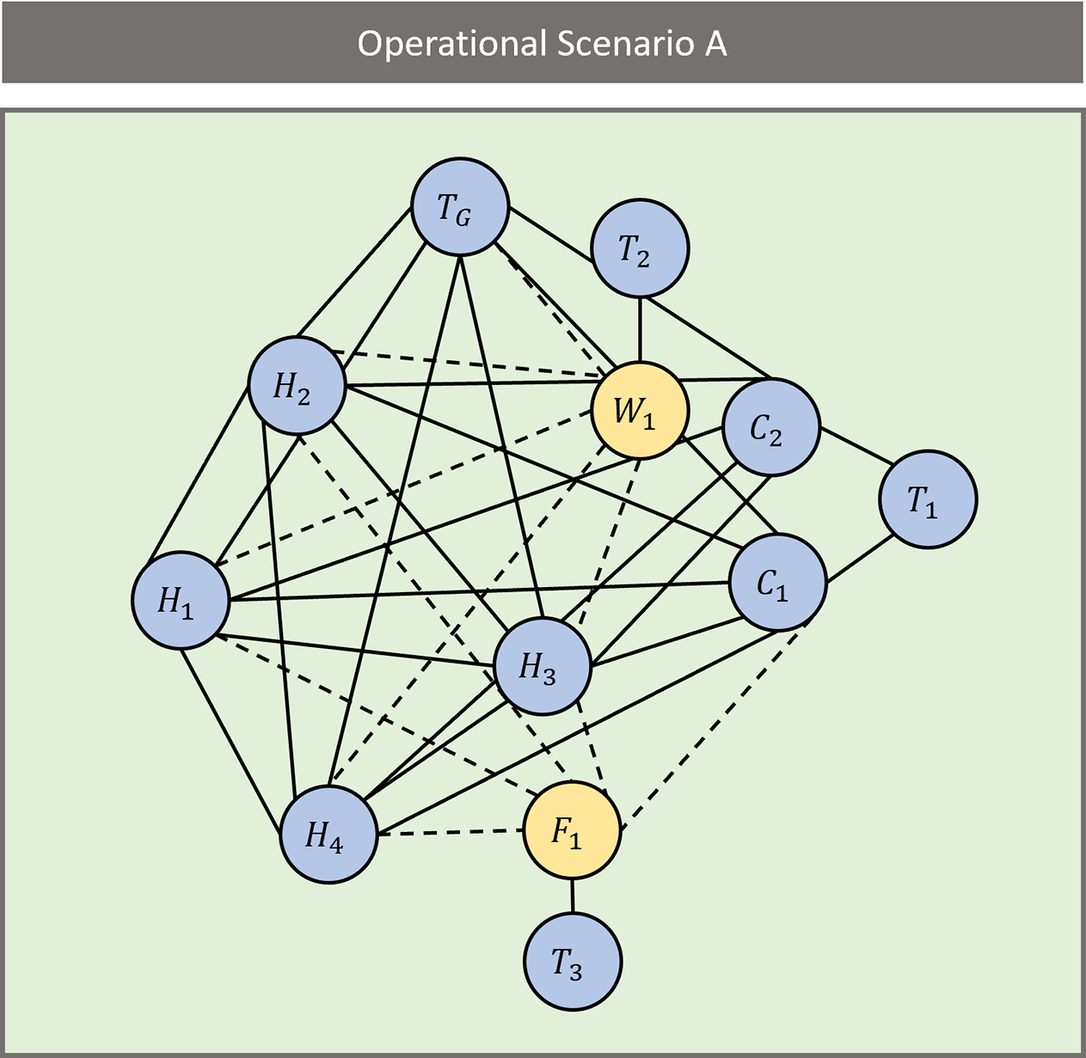
Figure 10. Operational scenario composed of Site A for fleet number 4 (referring to Appendix A).
A post-processing tool was developed to analyze simulation results. This tool calculates vital performance indicators comprising cost, sustainability and utilization, ultimately generating a composite value metric for each operational scenario. Looking at cost, the metadata and results data are used in conjunction with a cost table, inspired by partner company data, which depicts the acquisition and operational costs for all viable options. Examples include hauler purchase cost, electric price, service fees and so forth. The sustainability factors are addressed similarly through a lookup table and using the metadata and results data as input. Sustainability is limited to looking at the CO2eq emissions emerging from the energy consumption, as Life-Cycle Assessment data were unavailable or is confidential. Finally, utilization is calculated using the results data table as a factor of queuing time in relation to total modeling time. For simplicity, the post-processing was added to the simulation model as an extra step before closing the simulation run. This allowed the results data to be calculated and stored together with the metadata for easier data management.
5.5. Results
With the operational scenarios and contexts established, it was time to execute the experiment. This article used RePast Simphony as an ABS, which can perform batch runs. Hence, a parameter sweep was created and executed to simulate all scenarios. The statistical data, results data and metadata were collected and aggregated. Finally, some post-processing was conducted to obtain value scores, which could then be imported, filtered and plotted using R language and RStudio.
Figures 11–13 visualize the operational scenarios tested for each demo site. The bubble charts display all possible fleet configurations (x-axis) and their value varying over the operational contexts (y-axis). A nonfeasible combination is highlighted through a red box (nonfeasible from a vehicle perspective, e.g., total battery depletion) or a black triangle (nonfeasible from a site perspective, e.g., crush feeder runs empty). The feasible options are marked with yellow bubbles, where the size and intensity of the color dictate the value creation. The value creation achieved by each scenario according to the predetermined value assessment strategy; see Section 5.1 for the causal loop diagram and value function. At the top, the average score of all operational contexts for a fleet configuration is displayed through a blue bubble (similar to the yellow bubble) to show the value creation of a specific fleet over the operational scenario. Each fleet configuration and context number refers to a particular combination of previously stated design parameters. The conversion table can be found in Appendix A.
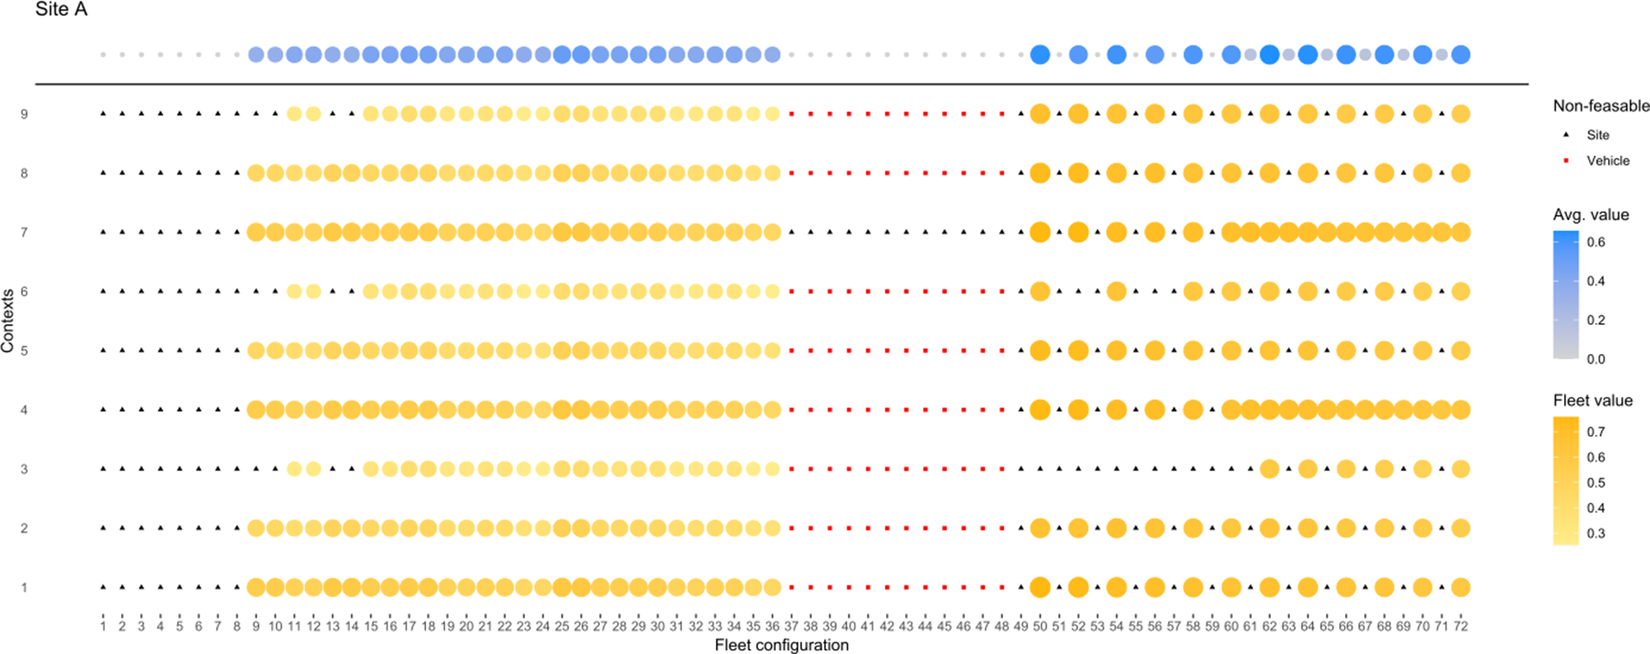
Figure 11. Value of different fleet configurations in varying contexts within Site A.
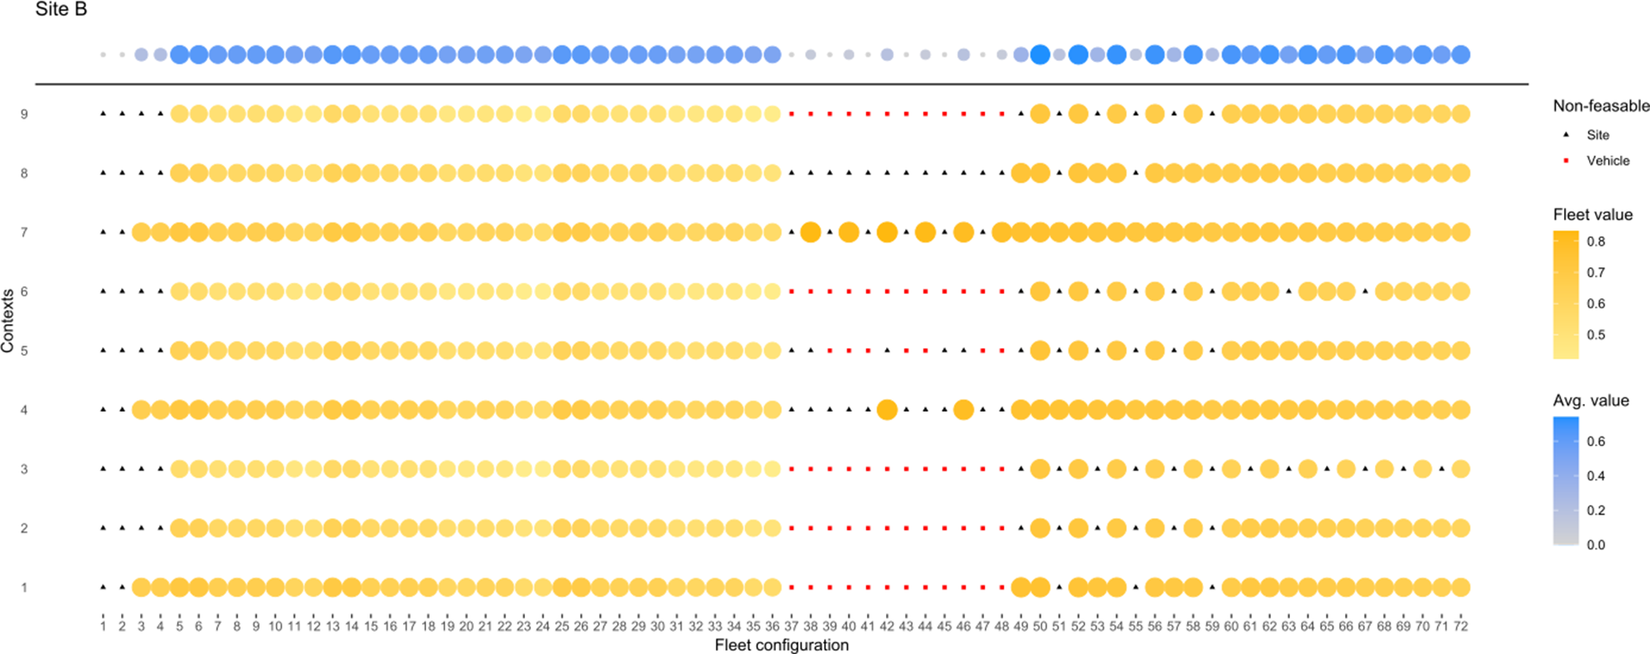
Figure 12. Value of different fleet configurations in varying contexts within Site B.
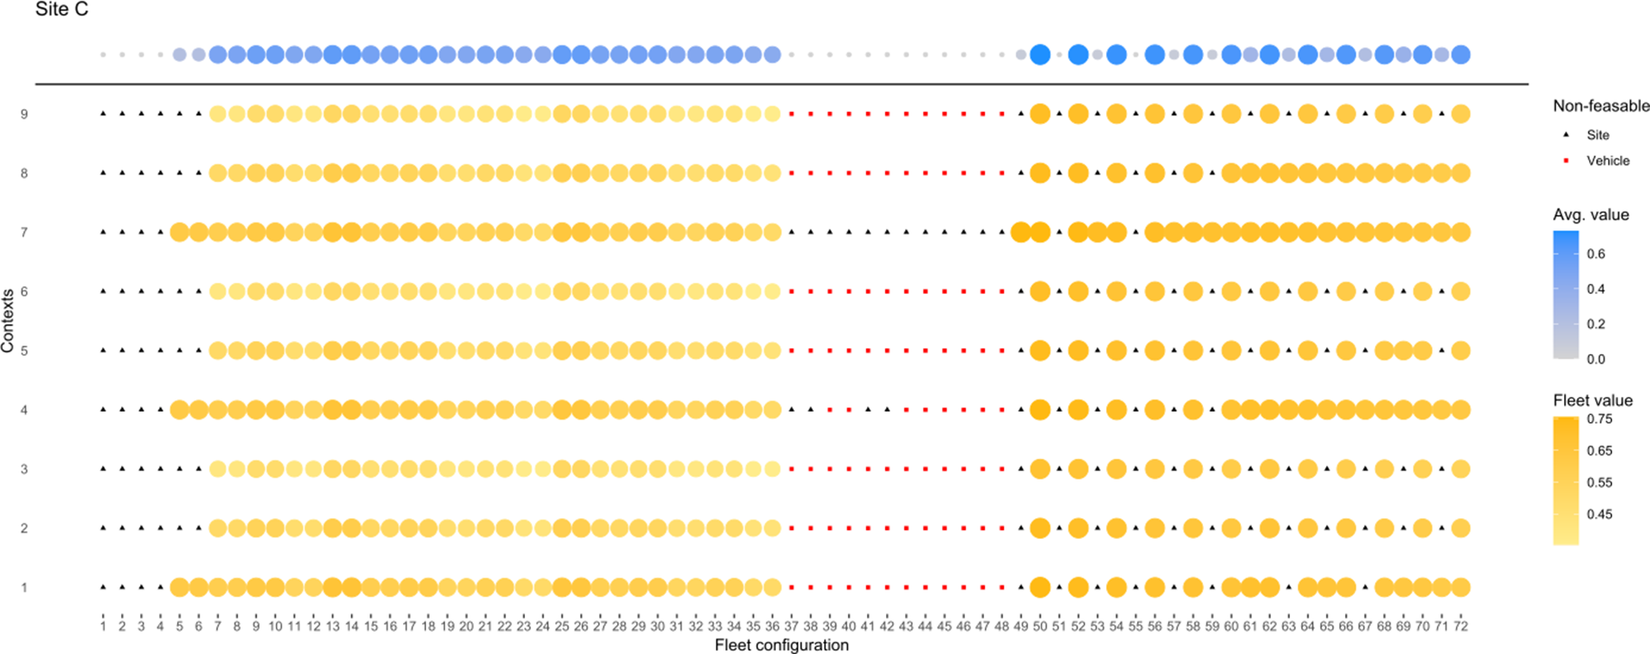
Figure 13. Value of different fleet configurations in varying contexts within Site C.
Data analysis of fleet performance at Site A, a long route with a moderately hilly profile and gentle curves, reveals that the 25-ton haulers are insufficient. Their smaller battery capacity limits their feasibility, and even in some workable scenarios, value creation remains minimal. Conversely, both 35- and 45-ton haulers demonstrate significantly better performance. They offer greater capacity, leading to improved feasibility and value creation. Interestingly, road friction appears to be a more critical factor than ambient temperature at Site A. In addition, the number of available chargers seems to be a crucial factor for overall feasibility.
Unlike Site A, Site B has a significantly lower rate of infeasible sites. This is likely because Site B has a shorter route with a smooth and relatively flat profile. This advantage, however, translates to generally higher value creation across all scenarios at Site B. While no 25-ton configurations are feasible at Site B, the difference in feasibility between 35- and 45-ton haulers is smaller compared to Site A. In addition, implementing eco-driving practices and minimizing the number of deployed haulers can further optimize value creation on this route.
Site C presents a more significant challenge for haulers than Site B due to its highly uneven elevation profile with frequent curves, necessitating frequent speed adjustments. Notably, feasibility at Site C is dependent almost entirely on two chargers, with only a few exceptions. Furthermore, the length of the route causes some 35-ton hauler options to fail, which in some cases can be solved by using a more eco-driving profile, thus rendering a lower total energy consumption.
While bubble charts offer a quick snapshot of each site, they lack detail. Bar charts focused on the top six performers were created to gain deeper insights into specific fleet performance. These charts allow the development team to analyze value dimensions like cost, sustainability and utilization across various contexts. For example, Figure 14 presents a detailed comparison of these value dimensions for the top fleet configurations at Site A, including their average performance. Interestingly, despite electric-driven fleets having more unfeasible configurations, those that function effectively deliver the highest value. This finding suggests that electric vehicles have the potential to significantly benefit the quarry industry, even if achieving optimal configurations requires further development. Otherwise, all six top performers have similar scores for cost and sustainability while performing higher in utilization.
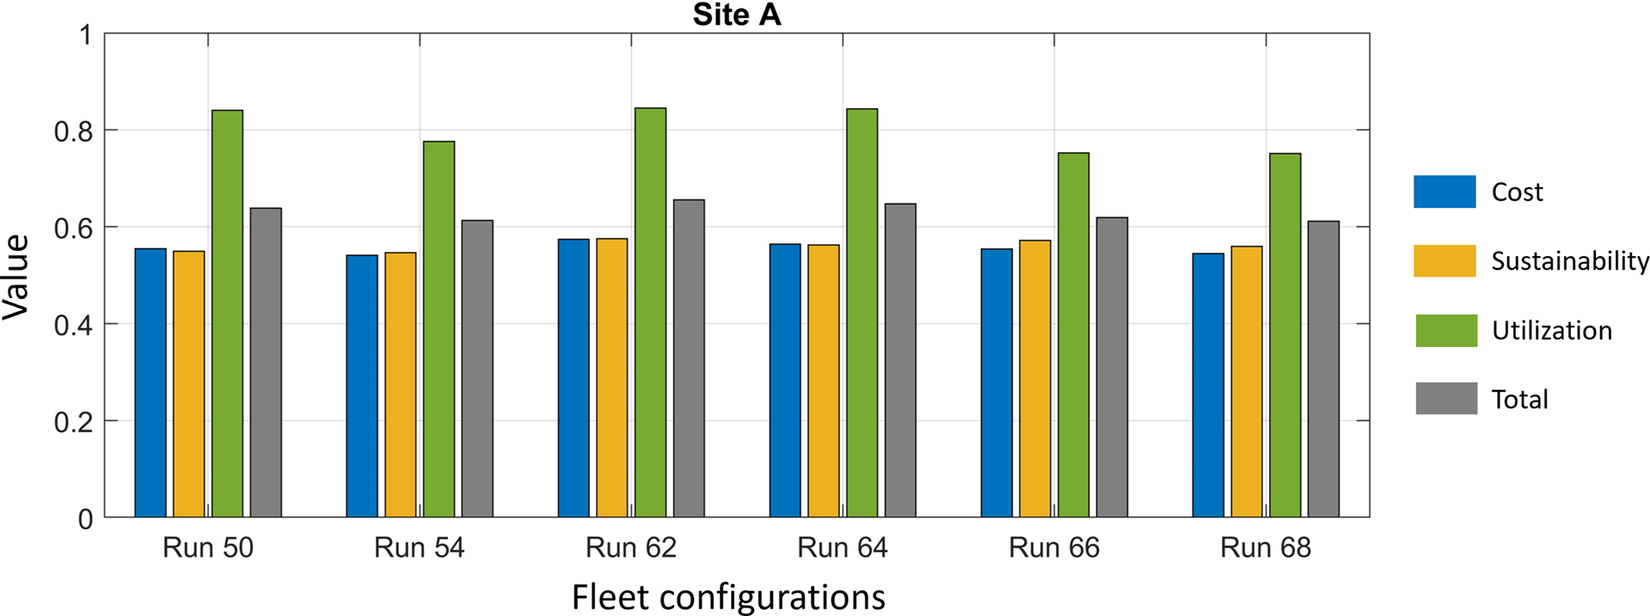
Figure 14. Bar chart highlighting the values of the value dimensions for the top six performing fleet configurations (Site A).
The line chart (see Figure 15) depicts the same fleet configurations but shows the average value across diverse operational contexts. Fleet configuration 54 stands out as the top performer across most contexts but fails in one specific scenario. This failure drags its average value down to fourth place. In essence, while it demonstrates strong potential, it struggles with robustness to changing conditions. In addition, it would be worthwhile to evaluate if the failed context is likely to occur in operation or not to assess the need to consider this in the design process. If minor tweaks could be made to those fleets, it might significantly affect the value.
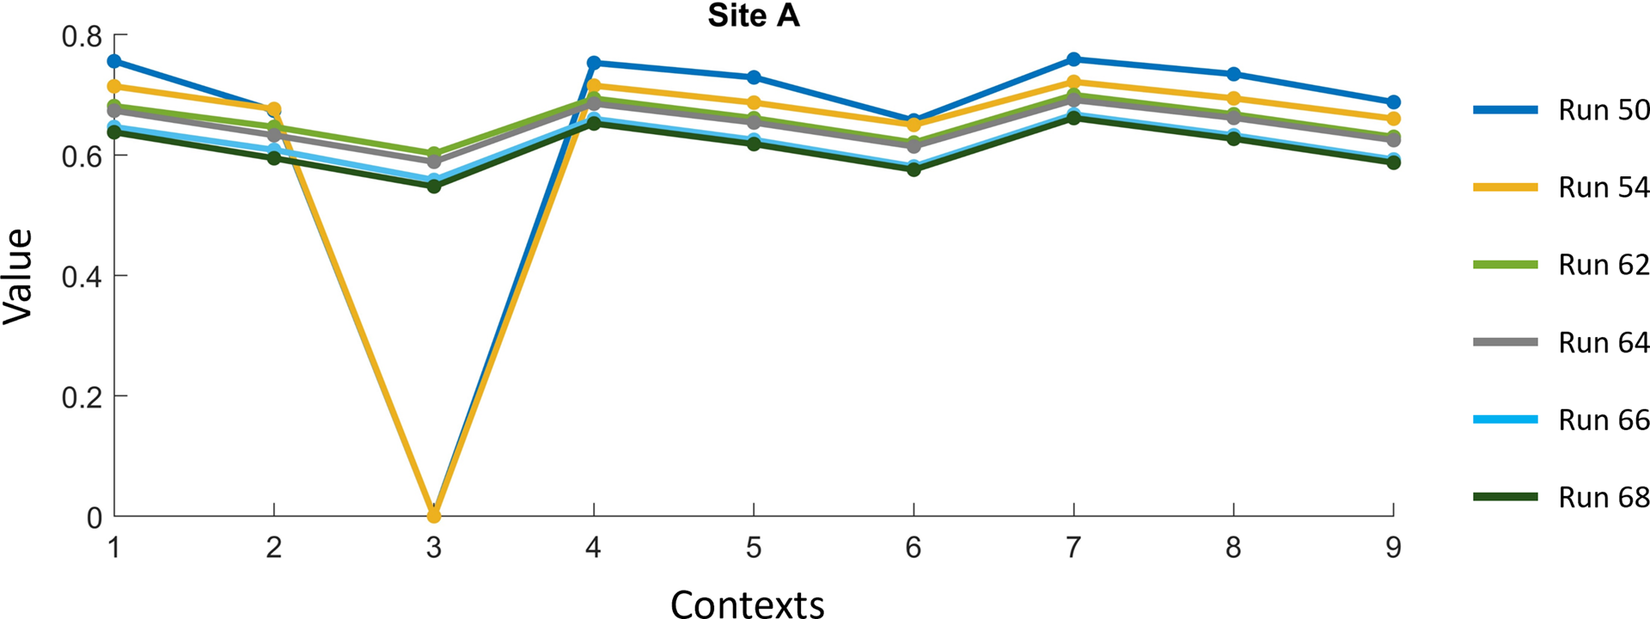
Figure 15. Line chart highlighting the values varying over contexts for the top six performing fleet configurations (Site A).
Overall, the experiment and results portray a comprehensive view of how the operational context and design parameters affects the value creation in quarry operations. Based on this, a few conclusions can be made. First, the simulation is able to evaluate a broad range of SoS designs from both a feasibility and value perspective. This helps provide an understanding of where the SoS challenges lie in quarrying and what design parameters are essential for success. Second, it shows that the electromobility transition is beneficial for enhancing the value of hauling operations and that the autonomy can effectively adjust the operations toward higher value. Finally, the operational context can significantly affect the performance of a fleet, especially electric fleets, which should, therefore, be explored in the SoS design.
5.5.1. Impact of varying fidelity levels
The results portrayed above have used the chosen fidelity level as displayed in Figure 7. The fidelity chosen for a model is an essential consideration during design decision-making since it significantly affects performance (Schön et al. Reference Schön, Marcus, Amadori and Jouannet2021) while influencing crucial decisions like system architecture modularity and sequencing of integration tasks (Maier, Eckert & John Clarkson Reference Maier, Eckert and John Clarkson2017). Higher fidelity enables capturing parts of interest with greater detail and better capturing extrinsic influences. In the proposed integrated simulation framework, agents can be assigned different fidelities based on such requirements. To demonstrate the impact of varying fidelity levels, consider a situation where the development team needs a better understanding of how a certain contextual variation affects the value of the top-performing solutions. Specifically, the team aims to investigate the influence of wheel loader performance on the value metric and, consequently, the rationale for selecting a solution from among the top performers. Previously, an average operating point approach was used to characterize wheel loader performance. Thus, a higher fidelity level was chosen, where a quasi-static model enabled performance characteristics evaluation for the wheel loader.
A standard loading cycle typically comprises four phases: transport without load, loading, transport with load and unloading, where typical V-shaped trajectories allow the wheel loader to navigate between the hauler and pile positions (Frank et al. Reference Frank, Kleinert and Filla2018). As the machine is almost stationary in the unloading phase, it is excluded, while the remaining three phases have been visualized in Figure 16. A combination of dynamic programming and reinforcement learning was used to evaluate the control policy. The choice of algorithm was driven by the precision of the model and the complexity of the problem. Dynamic programming is well-suited for finite-horizon problems within known environments. Conversely, reinforcement learning is viable for problems characterized by larger state and action spaces, particularly in stochastic environments (Bertsekas Reference Bertsekas2019). Figure 16 shows exemplary results of a loading cycle, excluding unloading. It starts from the hauler’s position, executes a reverse maneuver along the optimal trajectory and reaches the turning point. Subsequently, it drives forward toward the pile. On reaching the pile, it interacts with the gravel pile and loads the attachment. Once the attachment is satisfactorily filled, it reverses along the same trajectory, reaches the turning point and drives forward until it reaches the hauler position. Finally, it unloads the payload into the hauler. Relevant states of the wheel loader during this time have been mapped in Figure 16, with data normalized to ensure confidentiality.
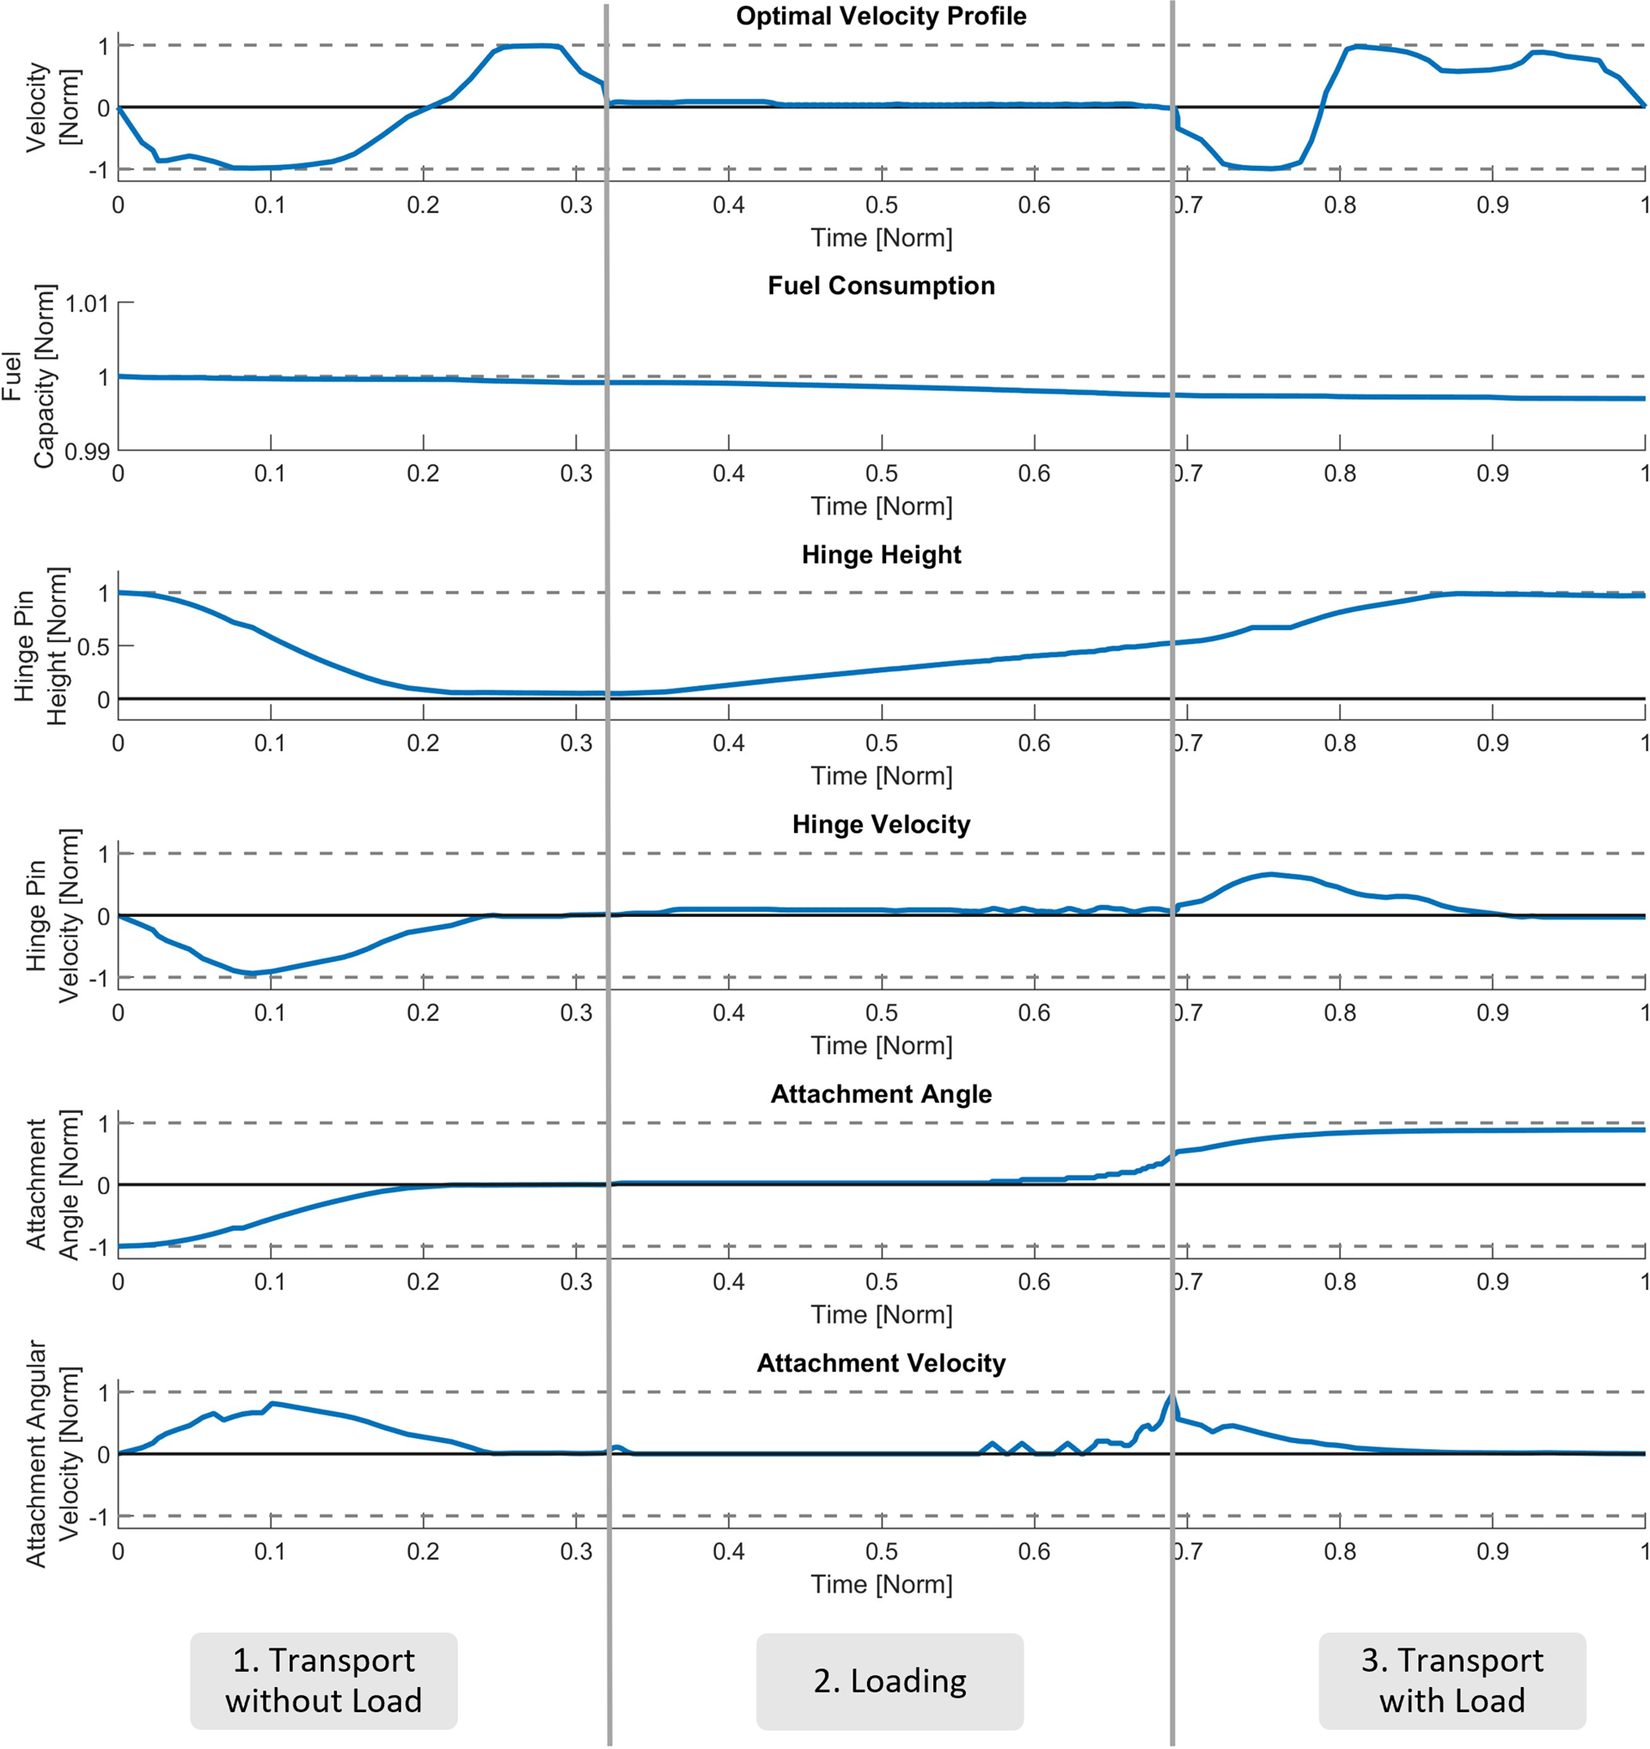
Figure 16. Simulation of an optimal control policy for the wheel loader.
The top performer fleet configuration (No. 62) at Site A (refer to Figure 15) was selected for comparison. The fleet configuration was simulated in the ABS model across all contextual options with the same setup. For comparative purposes, the fleet’s moved material and energy consumption were selected. Figure 17 shows the normalized moved material for a low- and mid-fidelity wheel loader model. The results entail that the low-fidelity models deviation from the mid-fidelity model varies over the contexts; it is highly accurate at 0.05 road frictional loss and 270 K ambient temperature, while it renders ~10% lower production at a road frictional loss of 0.03 and an ambient temperature of 285 K. In general, the contextual impact is less on the low-fidelity model compared to the mid-fidelity.
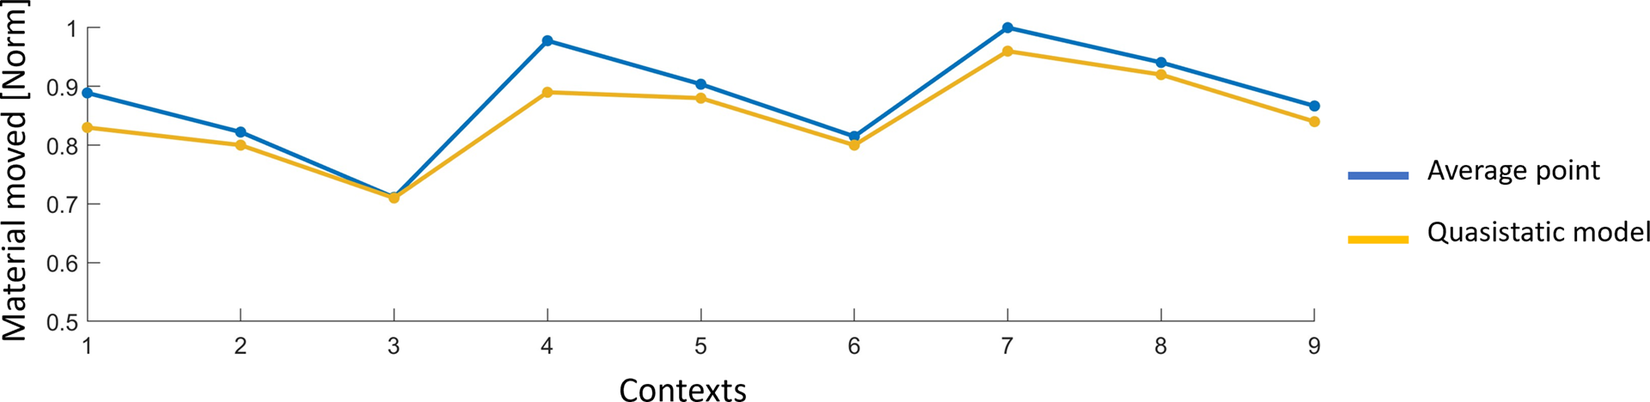
Figure 17. Normalized moved material for different fidelity models of the wheel loader.
A similar pattern occurs when looking at energy consumption, as shown in Figure 18. In general, the low-fidelity model results in lower energy consumption than the mid-fidelity model, which affects the final value of the fleet configuration.
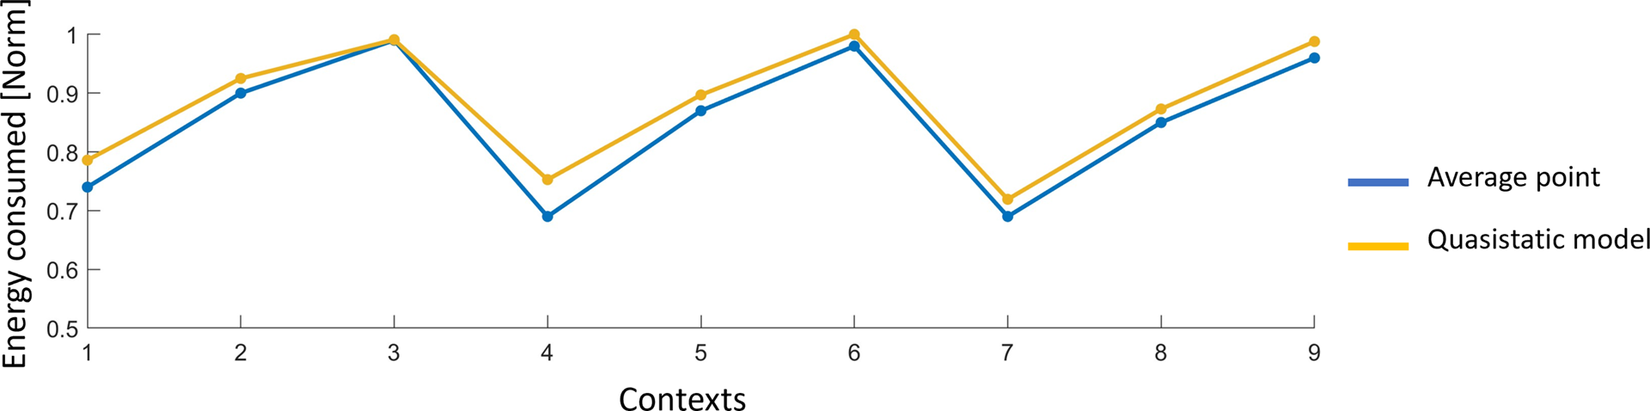
Figure 18. Normalized energy consumption for different fidelity models of the wheel loader.
An interesting pattern occurs when this is aggregated to value, as is shown in Figure 19. In contrast to previous figures, here, the total value for the low-fidelity model is more stable than the mid-fidelity model, which sometimes performs better and sometimes worse than the low-fidelity model, indicating a sensitivity to contextual constraints. The total fleet value with a low-fidelity model performs approximately 0.9 lower in total value (0.6559 for low-fidelity and 0.6645 for mid-fidelity model) compared to the mid-fidelity wheel loader, indicating that the fidelity selection has a minor impact on the results for the supporting system wheel loader at larger compared to specific contextual setups. To put this in perspective, changing the driving mode from eco to speed has a 0.09 difference in value (eco-mode is at 0.6559 speed performs at 0.6473).
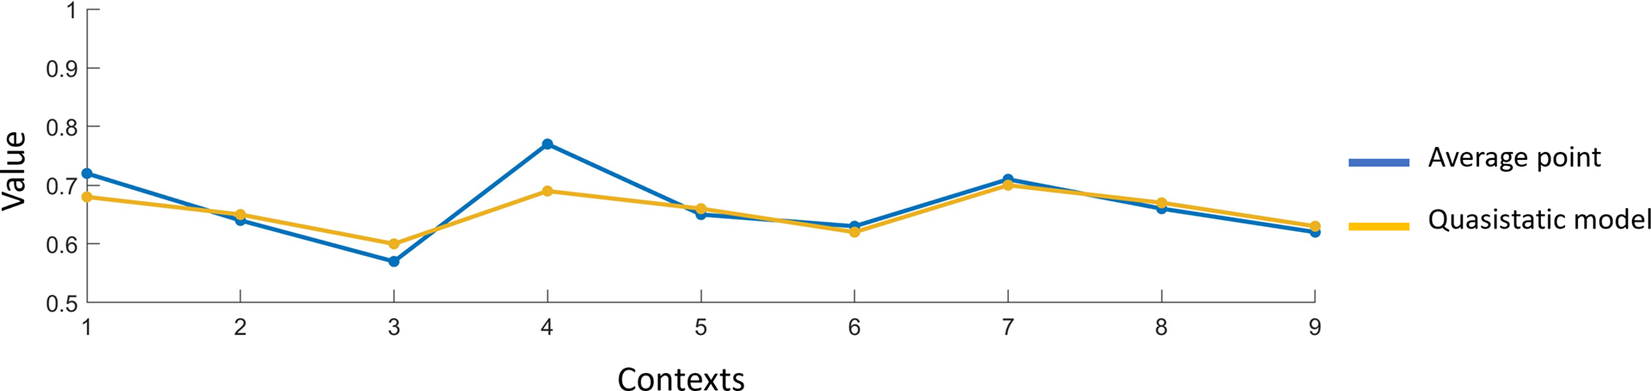
Figure 19. Value of the solution varying over contexts for the top performer using different fidelity models of the wheel loader.
In conclusion, the selection of fidelity will influence the performance and, ultimately, the value creation of a fleet. The contextual changes will be better captured with a higher fidelity model, but depending on the system, the significance of the fidelity selection will vary. Another important remark is the impact of the fidelity level on computational effort. The shift from a low to a mid-fidelity model on the wheel loader changed the simulation time from ~5 to 15 min, meaning that running the same experiment with mid-fidelity wheel loaders will increase the total simulation time by 324 h or 13.5 days. This can, of course, be reduced by parallel computing and increasing computational power. Hence, the selection of a fidelity model needs to be balanced depending on the system’s potential impact on value creation and modeling efficiency.
5.6. Case study validation
The simulation model and experiment results were presented to an expert group at the partner company as a final step. The intention of this was both to show the tool and framework itself as well as to obtain initial validation and feedback on its applicability and usefulness. For this purpose, the group was asked a set of open-ended questions. As the simulation model developed was only a proof-of-concept (PoC), there are limited possibilities for fully validating all its features and results. Instead, the focus was more on assessing its general applicability and how well the developed model can address the challenges targeted and experienced in the daily work at the partner company.
An initial remark was that it could be a good tool for better understanding how design decisions and operational contexts affects the value. However, further validation of system models is needed for the values to be trustworthy. The simulation otherwise received good remarks on its applicability and usefulness for the design process. It was also suggested that it could be a good decision support tool for early design stages and sales, since it was deemed fairly easy to import new sites and rapidly explore the design space. However, as previously stated, the experts were reluctant to believe the results without further refinement and verification.
Moreover, the value creation model developed as a part of the case study was seen as an excellent visual representation of the quarry context and a support for a better understanding of what drives and contributes to value. The participants stated that it could be a good approach for stakeholder alignment and adding transparency to the decision-making process. Finally, the PoC model was interesting for the partner company, but further development efforts must be considered commercially viable.
From a simulation and agent models standpoint, recommendations can be formulated for further development and efforts to increase validity. First, the granularity of the behavior models for operating machines should be increased to capture smaller fluctuations in quarry operations better. This is especially true for the wheel loader model. Second, the simulation model only looked at the “load and haul” – part of the operations. In the real world, many more tasks and activities are taking place. Including these and obtaining a more complete coverage of operations is essential for extending validity. Finally, the PSS perspective needs to be further incorporated into the models. Including aspects such as maintenance and failures was considered critical to allow the service perspective to be simulated and accounted for in the value exploration. In general, the simulation model needs to expand in contextual and temporal validity to best support the value exploration of SoS in a PSS context.
6. Discussion
The proposed simulation framework addresses one of the critical challenges in PSS design, that is, simulating a proposed concept throughout its operational lifespan, facilitating a context-based value exploration already in the early design stages. First, it reveals how different contexts affect the solution’s value. Secondly, it demonstrates how a sequence of contexts can affect its cumulative value. The case study demonstrates both the applicability of technology and the ability of the method to frontload the knowledge-creation process (Johansson Reference Johansson2019) during the beginning-of-life stage of the PSS. The framework effectively captures multidimensional performance indicators, including efficiency and effectiveness, providing a holistic view of the impact of the solution, as advocated by Brambila-Macias, Sakao & Kowalkowski (Reference Brambila-Macias, Sakao and Kowalkowski2018). In addition, experts from the partner company evaluated the framework’s usefulness in supporting design decision-making within their SoS context, confirming that the results aligned well with expected system behavior. This work shall be seen as the initial findings of a broader research effort. It aims to develop a generalizable, model-driven simulation approach to support value exploration in various systems. Such value explorations shall support the development team in design decision-making, especially early in the design stages.
An SoS perspective becomes necessary in PSS design because several independent systems work together to achieve a common goal and deliver value (Maier Reference Maier1998). Noticeably, while each system can function independently based on contextual information, SoS are characterized by unexpected behaviors that emerge from the hierarchical interactions of their constituent parts. For this reason, ABS is the backbone of the proposed integrated simulation framework because it informs designers how decentralized, bottom-up decisions will affect the overall system’s performance. While DES can be easier to set up and run, it relies on a predefined sequence of events. This limitation makes DES less suitable for scenarios where the system exhibits evolutionary behavior. In contrast, ABS provides a scalable approach to building complex logic within individual agents without the need to reconfigure event flows, a constant challenge in DES. Researchers have long argued about combining DES and ABS into a hybrid approach for simulating complex systems (Rondini et al. Reference Rondini, Tornese, Gnoni, Pezzotta and Pinto2017; Brailsford et al. Reference Brailsford, Eldabi, Kunc, Mustafee and Osorio2019). Elaborating on the suitability of hybrid approaches in contrast to ABS or DES can be interesting to explore in the future. Overall, three key features of the integrated simulation framework can be highlighted:
-
• Multifidelity: SoS simulation can quickly scale to become intractable due to its inherent complexity; hence, “modal granularity” (Maier et al. Reference Maier, Eckert and John Clarkson2017) is one of the widely discussed issues in design. To address this issue, the framework supports a multifidelity approach that allows users to select the level of detail within different agents. This flexibility ensures high accuracy for critical aspects while optimizing development and computational resources for less crucial areas. As a result, the framework achieves a better balance between accuracy and effort, making it possible to incorporate legacy knowledge and surrogate models in the decision-making process (Martinsson Bonde et al. Reference Martinsson Bonde, Kokkolaras, Andersson, Panarotto and Isaksson2023).
-
• Modular: Existing frameworks for design decision-making have often emphasized the modularity of the solution itself, neglecting the importance of a customizable simulation environment (Di et al. Reference Di, Matei, Scholze, Stokic, Barata and Cenedese2016; Sakao, Hara & Fukushima Reference Sakao, Hara and Fukushima2020). In contrast, the framework proposed in this article offers a customizable playground that allows users to tailor the simulation by including only the relevant agents needed for the specific operational scenario under investigation. This approach aligns with the recently identified challenges in simulating complex systems in an ever-evolving environment (Wickberg et al. Reference Wickberg, Fattouh, Afshar, Sjoberg and Bohlin2022) and eliminates unnecessary complexity. Furthermore, it simplifies the potential expansion of the simulation model in cases where the targeted SoS expands.
-
• Multidisciplinary: Decision-making in SoS most often involves the coordination of multiple stakeholders and disciplines. At the same time, tools enabling operational scenario simulation are usually for general purposes, and for this reason, they are often unsuited to specific problems (Dehghanimohammadabadi & Keyser Reference Dehghanimohammadabadi and Keyser2017). The proposed framework can add external simulators for heavy computational tasks, extending its simulation capabilities to include complex dynamics. Thus, a more accurate representation of the operational scenario is possible while still maintaining a holistic approach. A multidisciplinary perspective is essential to capture stakeholder needs in PSS.
The proposed framework focuses on value exploration of SoS configuration across multiple operational scenarios. In this article, the operational scenario refers to the interaction between the SoS and the influencing context (Machchhar et al. Reference Machchhar, Toller, Bertoni and Bertoni2022). It does not include the enterprise and business layers but instead focuses on achieving a reliable digital reflection of the physical interactions. The framework assumes that the enterprise, business and service layers are fixed (in the case study provided by the partner company), and within these boundaries, the design team is left to explore the hardware and process configuration for optimizing value.
Another critical aspect of the proposed framework is the ability to use and change fidelity levels among the agent types. On one hand, this allows for a better balance of computational complexity and efficiency while ensuring better granularity and accuracy. On the other hand, the behavior and interaction between agents need to be ensured regardless of fidelity and changes. A potential issue can be a mismatch in agent communication or when a shift in fidelity level occurs, for example, a higher fidelity model might require more input than a lower one. In the case study, this issue was addressed through ad-hoc adjustments of agent-type models. Future research shall focus on establishing more efficient and stable approaches to mitigate these challenges. Addressing this challenge would allow swapping fidelity models in the simulation platform to support decision-making along the design process without changing input–output ports.
Finally, some of the limitations encountered by this article are worth mentioning. Firstly, the framework has only been verified in a single case study at a base level. Further verifications and validations are needed to ensure generalizability and overall applicability. This includes incorporating more perspectives in the quarry operations and deploying the framework to other sectors. In addition, the servitization transition is strongly linked to value co-creation strategies and service offerings (Liu et al. Reference Liu, Ming, Song, Qiu and Qu2018). Neither of these has been considered in the PoC, but should be going forward to capture the PSS perspective fully.
7. Conclusions
This article proposes an integrated simulation framework that emphasizes multifidelity, modular and multidisciplinary approaches to support early-stage decision-making in PSS design. The framework enhances value exploration activities across a range of operational scenarios from an SoS perspective, considering varying levels of detail within constituent systems. A case study in the quarry industry showcases how the framework “frontloads” knowledge creation and helps designers better understand the multidimensional complexities that emerge when shifting perspective from a system to a SoS view. It further exemplifies the application of ABS to support early-stage design space exploration, elaborating on the central role of the technology in the simulation architecture, mainly because of its scalability and ability to model decentralized decision-making within SoS.
Future research will aim to strike the right balance between accuracy achieved through high-fidelity simulations and computational efficiency. Although the framework allows flexibility in selecting agent fidelity levels, there is a need for more guidance on making optimal choices. Future work will also delve deeper into the theoretical underpinnings connecting the research work with VDD and other value-creation methodologies to enhance the framework’s usability for decision-making. In addition, despite being developed for the PSS beginning-of-life stage, the framework shows promise for reuse in the middle-of-life stage (Sarancic et al. Reference Sarancic, Pigosso, Colli and McAloone2022) when the solution is operational, warranting further investigation.
Eventually, the developed case solution today offers only basic two-dimensional plotting, which poses challenges for inexperienced users trying to understand and visualize simulated operations. The possibility of exploiting extended reality to create more immersive experiences of how the various operational scenarios unfold is currently under investigation.
Appendix A
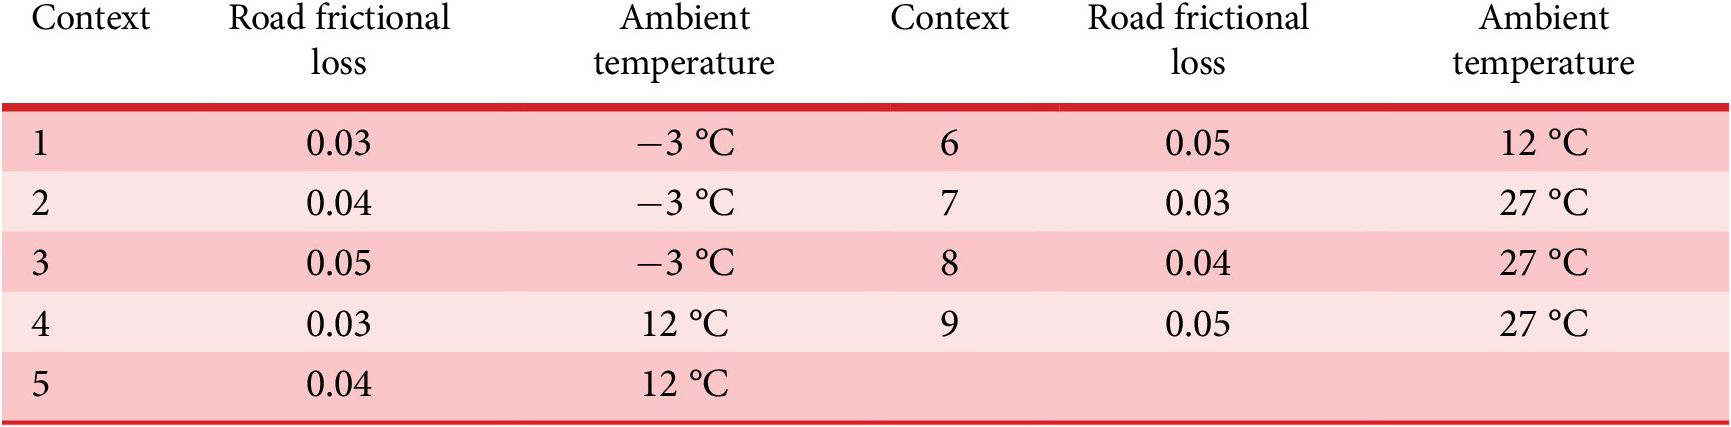


 Open access