

1. Introduction
Human activities in middle- to high-latitude and high-altitude areas heavily depend on the principles of snow mechanics, with snow engineering construction and snow disaster prevention being central to cold region engineering. The apparent shear strength of snow, a porous medium, is a critical parameter for the slip resistance, thus influencing the design of facilities such as compacted snow runways and ski slopes for winter tourism, particularly in northeastern China (Perla and others, Reference Perla, Beck and Cheng1982; Federolf and others, Reference Federolf, JeanRichard, Fauve, Lüthi, Rhyner and Dual2006; Vallero and others, Reference Vallero2021; Cao and others, Reference Cao, Mo, Zhang, Zhang and Fan2024). In the context of disaster management, the strain-softening properties of snow contribute to the complex avalanche mechanisms observed in highland mountainous regions (McClung, Reference McClung1981). Thus, both engineering and disaster management demand precise characterization of the shear properties of snow bodies. Understanding the main factors controlling the snow strength and its evolutionary patterns is not only a frontier in cold region materials science but also a theoretical foundation for snow and ice safety and snow disaster warning systems.
Research on snow apparent shear strength encompasses field testing, laboratory simulation and numerical modelling. In early field studies, the shear frame method (de Quervain, Reference de Quervain1951) was utilized to investigate the effects of density (Keeler, Reference Keeler1969) and temperature (Matsushita and others, Reference Matsushita, Matsuzawa and Abe2012) on strength. However, this method suffers from stability issues (Perla and Beck, Reference Perla and Beck1983) and size dependence (Jamieson and Johnston, Reference Jamieson and Johnston1998). Modern techniques include the use of portable force control instruments (McClung and Schweizer, Reference McClung and Schweizer2006; Podolskiy and others, Reference Podolskiy, Barbero, Barpi, Borri-Brunetto and Naaim2014) and laboratory direct shear tests (Bjerrum and Landva, Reference Bjerrum and Landva1966), which can be combined with discrete element method (DEM) numerical models (Kabore and others, Reference Kabore, Peters, Michael and Nicot2021), to elucidate the effects of ductility (Fukuzawa and Narita, Reference Fukuzawa and Narita1992) on strength and understand the ductile-to-brittle transition. Changes in the internal structure of snow during shearing (de Montmollin, Reference de Montmollin1982), arising from particle rearrangement and cohesive bond disruption (Hagenmuller and others, Reference Hagenmuller, Chambon and Naaim2015), are important for snowpack modelling (Johnson and Hopkin, Reference Johnson and Hopkin2005; Bobillier and others, Reference Bobillier, Bergfeld, Capelli, Dual and Schweizer2020; Bahaloo and others, Reference Bahaloo, Casselgren, Forsberg and Sjödahl2021). While progress has been made in understanding the mechanics of snow compaction (Shenvi and others, Reference Shenvi, Sandu and Untaroiu2022), theoretical analysis lags behind (Chen and others, Reference Chen, Xiao and Dong2025). Previous research on snow apparent shear strength often suffers from inadequate control of variables such as the snow density, temperature and loading rate (Petrovic, Reference Petrovic2003); this is partly due to the limitations imposed by natural snow accumulation, even in controlled laboratory settings, which make control of the variation in physical quantities, including density, difficult. Furthermore, few studies have linked the changes in snow microstructure after shear damage to mechanical properties. However, understanding the diversity of snow deformation mechanisms from a microstructural point of view is crucial for improving our knowledge of the mechanical properties of snow (Schweizer and others, Reference Schweizer, Jamieson and Schneebeli2003).
In this study, a simplified unconfined shear test, as described by Marinho and Oliveira (Reference Marinho and Oliveira2011), was employed to quantify the shear strength of compacted snow under controlled density, strain rate and temperature conditions. The test was modified by removing vertical loading, enabling systematic observation of changes in the snow crystal microstructure after shearing. Field-compacted natural snow samples were subjected to various shear rates, and these experiments were complemented with DEM simulations to explore particle-scale fracture mechanics. The simulated fracture patterns were then compared with the experimental results, allowing quantification of the specific effects of density, strain rate and temperature. On the basis of these findings, recommendations are provided for the use of snow as an engineering material in construction, emphasizing the importance of optimizing snow engineering design parameters.
2. Experimental programme and methodology
2.1. Research area
The experiment was conducted from 31 January to 14 February 2024 in Harbin City, Heilongjiang Province, China, at the comprehensive water conservancy experimental field of Northeast Agricultural University. The site was located at 45°44′37″ N and 126°43′28″ E, with an elevation of ∼136 metres above sea level, encompassing an area of 8100 square metres. The study area experiences a temperate monsoon climate characterized by distinct seasonal variations. During winter, it is predominantly influenced by a temperate continental air mass, resulting in cold and dry conditions. In contrast, summer conditions are shaped by the influence of a temperate oceanic air mass or a metamorphic tropical oceanic air mass. The region has an average annual temperature of 4.3°C. Specifically, in January, the average temperature is approximately −18.3°C, with an average wind speed of ∼2.8 m·s−1. In February, the average temperature slightly increases to approximately −14°C, with an average wind speed of ∼3.0 m·s−1. The average annual precipitation, including snow, is 23.6 mm during winter, and the maximum snow depth reaches ∼41 cm (Wang and others, Reference Wang, Fu, Han, Liu, Xiao and Leng2021). At the end of the snowfall from the afternoon to the night of 30 January 2024, snow was collected and stored on a shaded surface the following day for use in the test. The test was conducted over a 2 week period, during which the temperature increased over time and exhibited diurnal oscillations, as shown in Fig. 1d. Positive temperatures began to appear on 12 February, and tests of the high-temperature section were completed during this period.

Figure 1. Location and temperature of the study area: (a) Harbin City, Heilongjiang Province; (b) Northeast Agricultural University; (c) comprehensive experimental field of the water conservancy; and (d) line graph of the temperature changes during the experimental period.
2.2. Experimental programme
The snow shear test was conducted with a Byes-3003 microcomputer-controlled electronic compression tester equipped with servo motors to maintain a constant speed during tension or compression. To measure the strain rate, a DA-20-type DC differential transformer displacement transducer was employed; this transformer had a linearity of <0.05%. Engineering stress measurements were obtained via a PSD tensile pressure sensor (Celtron-SJTH); this sensor had a range of 500 kg and an accuracy of 0.1 N. The snow temperature was monitored via a PT-100 platinum resistance temperature sensor with an accuracy of ±0.1°C.
We divided the experimental steps into the following segments.
(1) The process of preparing the snow samples for testing began with the collection of falling snow using a snow shovel, as illustrated in Fig. 2a. To minimize the influence of temperature, solar radiation, wind and other environmental factors, snow was stored on the shaded side. In the later stages of snow collection, consistent collection of snow from the same location on the shaded side was important. Ensuring that the snow samples have similar initial shapes enhances the repeatability. The snow density was set to between 300 and 550 kg·m−3 on the basis of previous tests and considering the characteristics of compacted snow. Appendix A displays the specific experimental groups.

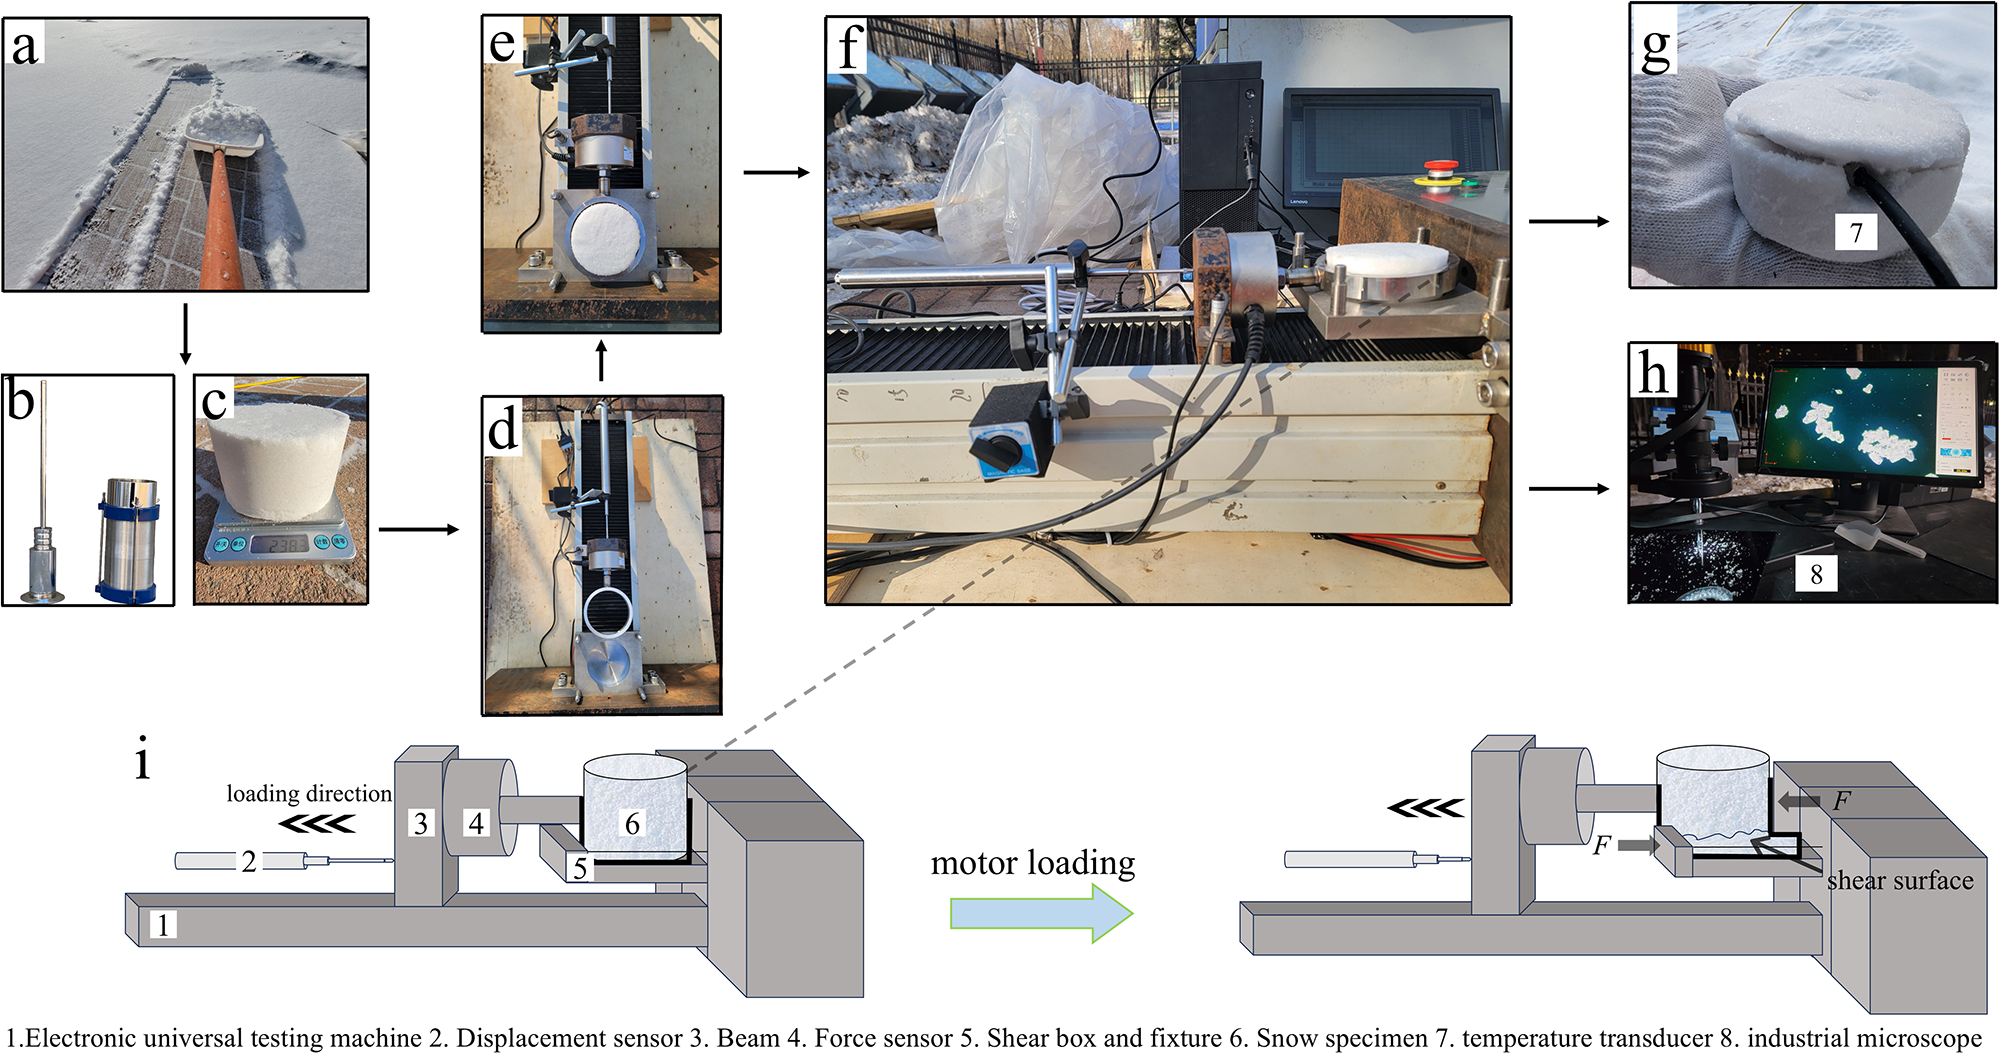
Figure 2. Snow sample preparation and test procedure. (a) Natural snow collection; (b) compacted snow sample; (c) compacted snow density measurement; (d) testing machine; (e) loaded snow sample; (f) schematic diagram of the unconfined shear test site and loading process; (g) snow temperature measurement; (h) observation of the snow crystal microstructure; and (i) loading process diagram.
(2) Snow samples were prepared by compacting the snow in layers via a specially constructed cylindrical compactor, as shown in Fig. 2b. This method ensures maximum homogeneity within the snow samples during compaction. After preparation, the compactor sidewall was removed, the snow sample was extracted and the sample was immediately placed into a shear box for testing. The process of snow metamorphism constantly occurs in snow samples (Schleef and others, Reference Schleef, Löwe and Schneebeli2014). However, this process occurs extremely slowly in the natural state of snow and is typically measured in weeks (Kaempfer and Schneebeli, Reference Kaempfer and Schneebeli2007; Riche and others, Reference Riche, Montagnat and Schneebeli2013). Therefore, within the time scale of sample production and loading, the resulting deterioration effect can be almost negligible. The sample preparation process, including compaction, was completed within 30 seconds to 1 minute, thus avoiding changes in the snow sample caused by sintering during the preloading process due to a prolonged time. After the density was calculated via the mass volume method, the corresponding mass of snow was taken and compacted in a compactor to the designed snow density, as shown in Fig. 2c. Owing to the same diameters of the compactor and shear box (Fig. 2d and e), the compacted snow sample could be perfectly embedded into the shear box without damage (Landva, Reference Landva1964). During this period, we assumed that the snow sample was uniformly sintered and that sintering was weak enough to neglect its impact on the test results. Since the sample preparation time was rapid, we also ignored temperature fluctuations between sample preparation and testing. The temperature dependence was attributed to the snow temperature during testing rather than to the air temperature during sample preparation.
(3) The samples were placed in an electronic testing machine placed horizontally in a downwards position and then subjected to an unconfined shear test, as shown in Fig. 2f. Photographs of the test site and a schematic diagram of the loading process are given in Fig. 2f and i, where the lower end of the fixture was fixed in the centre of the pressure tester to ensure uniformity of loading, and four rivets were used to tightly connect it to avoid displacement caused by stretching. The size of the shear box was based on McClung’s (Reference McClung1977) shear box (diameter of 115 mm, thickness of 16–18.5 mm) and the size ratio of the undisturbed soil direct shear test blade (Castellanos and Brandon, Reference Castellanos and Brandon2013), considering the space available in the testing machine. The final design of the shear box for this experiment had an inner diameter of 10 cm and a height of 3.6 cm. This aspect ratio ensured that the damage to the sample came from shear force (Jin and others, Reference Jin, Miao and Du2023). Owing to the softening characteristics of snow under stress, shear action is usually accompanied by mixed damage, such as compression, but in this work, all such damage was considered deformation driven by shear force. Therefore, we treat the measured values as apparent shear strength and use them in subsequent result analysis.
The lower end of the fixture was securely fixed at the centre of the pressure tester to ensure uniform loading, and four rivets were employed to prevent displacement due to stretching. The upper part of the fixture was connected to the tensile force transducer via a connector, which featured a ring-shaped end and a groove at the bottom to accommodate the snow sample. A contact displacement transducer was affixed to the base of a magnetic meter, which was attached to the sidewall of the universal testing machine. The telescopic probe of the transducer made contact with the beam of the testing machine. Since the tester was positioned flat on the floor, precise adjustment of the cantilever of the magnetic gauge holder with a level was needed to align the displacement transducer with the tensile force transducer. Owing to the lateral isotropy of compacted snow (Lang and Harrison, Reference Lang and Harrison1995; Kabore and Peters, Reference Kabore and Peters2020a), the mechanical response remains consistent when the applied load direction is parallel to the specimen cross section in this experiment. Consequently, the test was conducted by loading the compacted cylindrical snow columns parallel to each other after they were placed in the fixture. Once loading commenced, the servo motor was activated, causing the beam to move. The displacement sensor located in the upper part of the beam was compressed, and the resulting displacement was recorded. In this experimental setup, the beam exerted a shear force on the snow sample by dragging the ring, whereas a tensile force sensor attached to the lower end of the beam recorded the resistance of the snow sample. This process was used to determine the ultimate engineering stress at the point of failure. The entire fixture and beam were constructed from high-strength steel, characterized by high rigidity, minimal deformation and a stable structure; thus, they functioned as a cohesive unit.
(4) Once the snow sample was loaded and subsequently damaged, a temperature sensor was inserted into the snow layer, as depicted in Fig. 2g, to record the snow temperature after signal stabilization. Next, the snow crystal particles at the fracture cross section of the sample were delicately scraped with an ice scraper to preserve the original structure of the snow crystals. These particles were then placed on a cryogenically cooled black acrylic plate, as shown in Fig. 2h, for microstructural observation. Microstructure observations were carried out with commonly used optical microscopes (Bailey and Hallett, Reference Bailey and Hallett2004). The observations were conducted on a JT-H6 industrial microscope; its magnification and focal length were adjusted to achieve optimal image clarity (Libbrecht, Reference Libbrecht2005; Sturm, Reference Sturm2024). Snow crystal images were quantitatively analysed using the Sobel algorithm and Otsu algorithm (Hu and others, Reference Hu, Li, Lu, Wang, Wei and Zhao2024), with the process divided into the following four steps: grayscale conversion, edge extraction, threshold segmentation and edge closure. Additionally, when the boundaries of snow crystals were poorly defined due to overlap and adhesion, we employed visual identification to confirm the boundaries of the snow crystals. After the snow crystal boundaries were determined, the irregular areas were converted into the diameter of equivalent circles. The detailed steps are shown in Appendix B.
(5) Finally, we also attempted to incorporate the measured snow crystal sizes into an open-source discrete element model (Smilauer and others, Reference Smilauer2021). We referenced the contact model developed by the Jiang team (Jiang and others, Reference Jiang, Shen and Wang2015) and combined it with Huo’s (Huo and others, Reference Huo, Hu, Li, Yang and Jia2023) model of uniaxial compression tests on compacted snow to address several typical crack propagation scenarios. In the numerical simulation, we used the same shear box dimensions as those at the experimental site and generated ∼6 × 10⁴–105 particles within the shear box on the basis of experimental data to ensure statistical representativeness. The schematic diagram is shown in Fig. S1 in Appendix C. Considering the effects of particle‒particle friction and temperature on the bonding strength, we applied the corresponding treatments on the basis of Huo’s (Huo and others, Reference Huo, Hu, Li, Yang and Jia2023) model.
The unconfined apparent shear strength was determined via Eqn (1), which involved calculating the ratio of the ultimate shear force to the area of the compacted snow sample. Similarly, the loading strain rate was assessed via Eqn (2). This calculation involved determining the average strain rate of the compacted snow sample from the initial application of force until the point of failure.
 \begin{equation}\tau = \frac{{{P_{{\text{max}}}}}}{{\pi {r^2}}}\end{equation}
 \begin{equation}\dot \varepsilon = \frac{\varepsilon }{t}\end{equation}
 where τ represents the apparent shear strength or shear engineering stress (MPa); P max represents the maximum shear force (N) at the destruction of the snow sample; r represents the radius of the compacted snow sample (mm);  $\dot \varepsilon $ represents the average strain rate (s−1); ε represents the ultimate strain; and t represents the time from loading to destruction of the sample (s).
3. Results
3.1. Destruction patterns and influencing factors
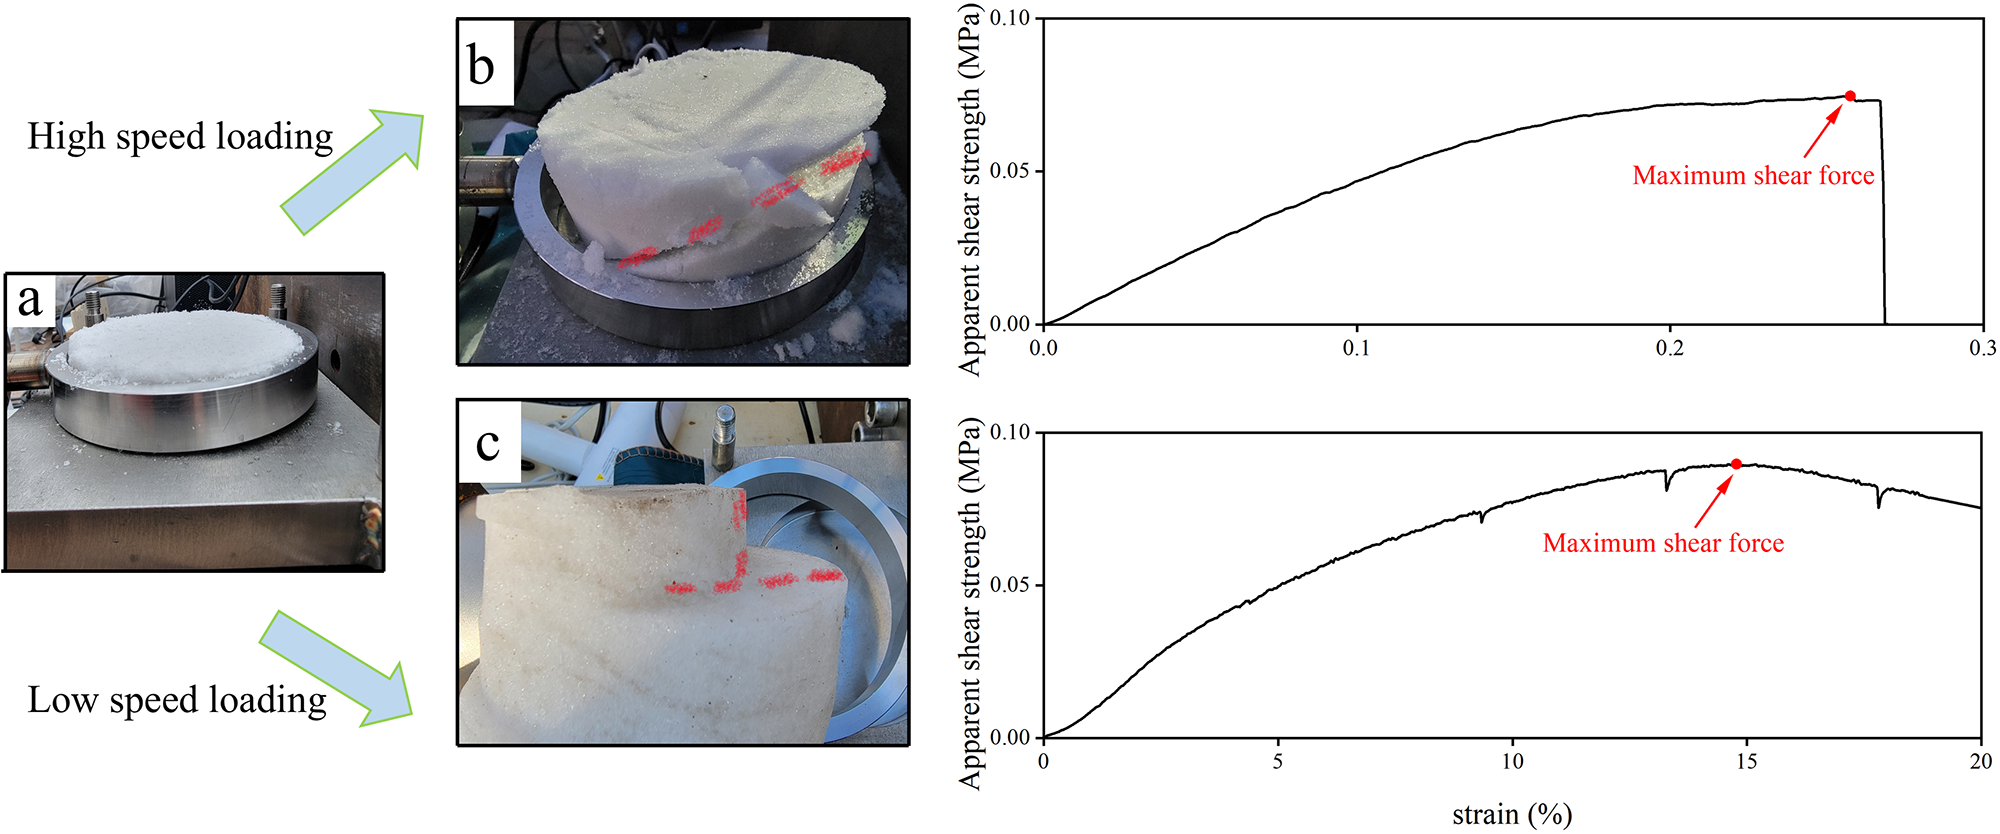
The shear failure modes of compacted snow can be classified into two types. Figure 3a shows the initial snow sample with a density of 500 kg·m−3 placed in the shear box before loading. Figure 3b shows an actual photograph and the stress‒strain curve after brittle failure occurred at a snow temperature of −9.8°C and a strain rate of 4.56 × 10⁻³ s−1. Similarly, Fig. 3c shows an actual photograph and the stress‒strain curve after ductile failure occurred at a snow temperature of −8.5°C and a strain rate of 6.68 × 10⁻⁵ s−1. In the brittle failure test, the shear stress rapidly increases with time and peaks. Fracture subsequently occurs within a short time, the engineering stress drops to zero and the test ends. During this period, the snow sample undergoes brittle failure. In contrast, the stress‒strain curve of snow under the ductile failure mode fundamentally differs from that under the brittle failure mode, as shown in Fig. 3c. After the maximum load is reached, the engineering stress does not suddenly drop but gradually decreases. Additionally, the post-destruction morphology significantly differs between the two types of failure, as depicted in Fig. 3b and c. Brittle fracture occurs suddenly during deformation, often without noticeable precursors, resulting in a rough fracture site. In contrast, ductile failure involves prolonged deformation, and upon loading, the sample typically demonstrates significant local necking phenomena (Motahari and others, Reference Motahari, Liu, Bai, Khorrami and Raabe2025). These differences serve as the foundation for distinguishing between brittle and ductile failure in the subsequent analysis (Reiweger and others, Reference Reiweger, Schweizer, Dual and Herrmann2009).

Figure 3. (a) Snow samples; (b) stress‒strain curve of a snow sample and its brittle failure; and (c) stress‒strain curve of a snow sample and its ductile failure. The red broken line marks the location of the crack after damage.
The snow temperature significantly affects the strength of ice crystal bonds and the creep characteristics of snow (Delmas, Reference Delmas2013). Different strain rates cause ductile or brittle changes in snow (Arenson and others, Reference Arenson, Colgan and Marshall2021). The snow density directly affects the porosity of snow, causing differences in the internal structure (Morris and others, Reference Morris and Wingham2014). In this study, the snow density after compaction, the loading rate and the snow temperature are considered key variables. Table S1 in Appendix A details the experimental design for the classification tests based on these variables.
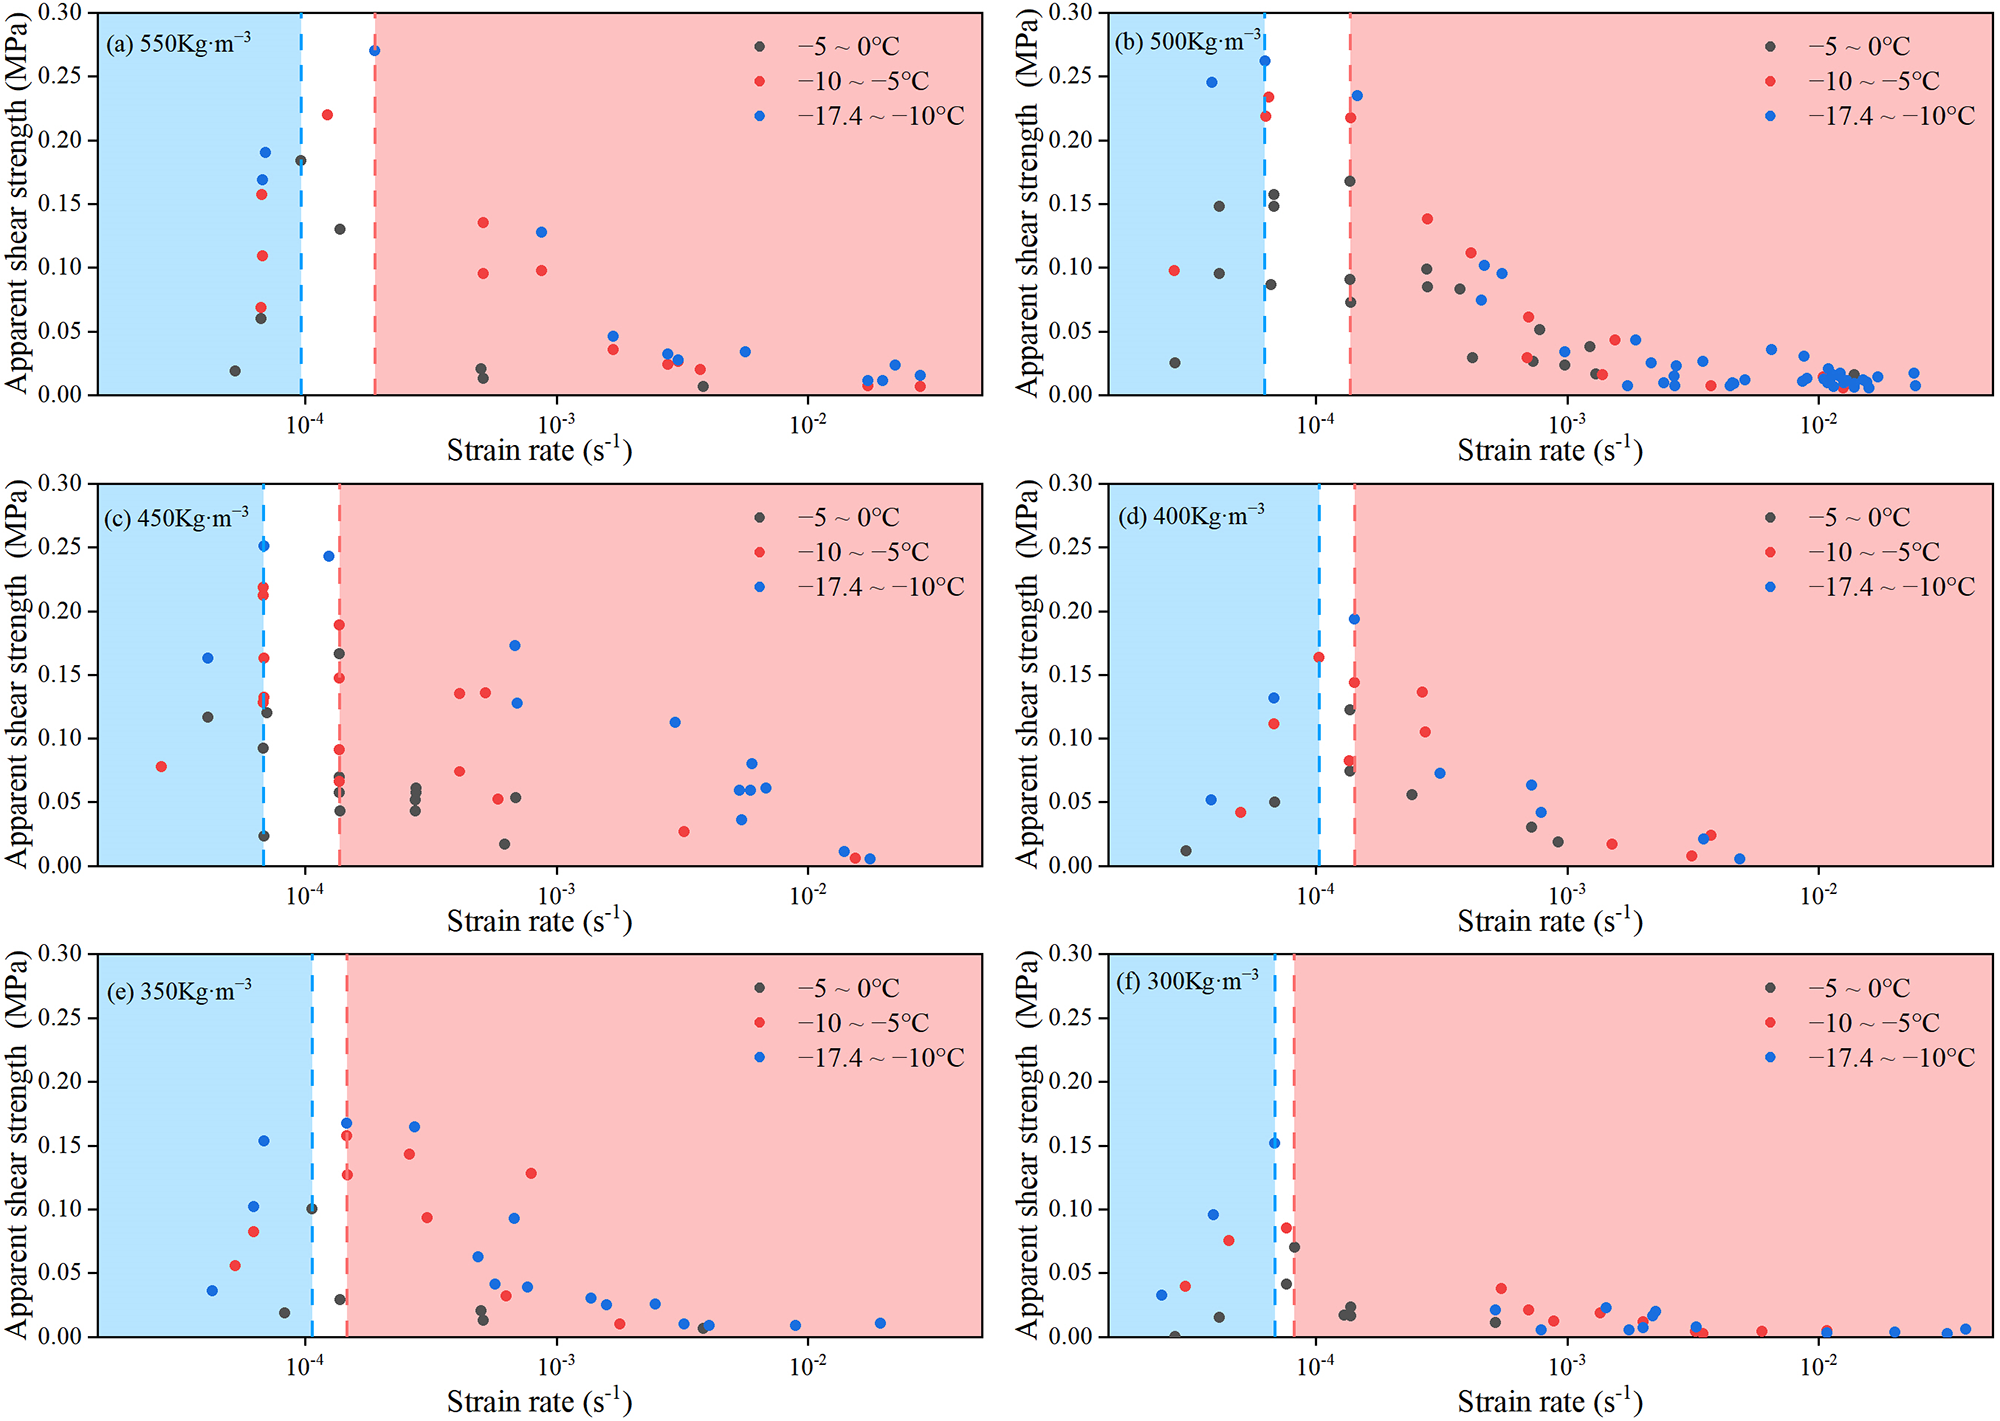
The results from these tests are illustrated in Fig. 4. We divide the subgraphs according to the density, and different coloured scatter points distinguish different temperature intervals. The blue and red lines in Fig. 4 represent the strain rates corresponding to the maximum apparent shear strength at different temperatures, and the area enclosed by them is the critical rate transition range. We divide the plots into three regions: ductile deformation in the blue background region, brittle deformation in the red background region and the ductile‒brittle transition in the blank background region. The magnitudes vary from 2.5 × 10⁻⁴ to 0.27 MPa, with a mean value of 0.07 MPa. Notably, the apparent shear strength exhibits a complex relationship with the variables: it initially increases and then decreases with increasing strain rate; it decreases with increasing temperature; and it increases with increasing density. Owing to the wide and uneven distribution of strain rates, logarithmic axes were employed to effectively represent their variation. Notably, during the field tests, the ambient temperature could not be controlled; this complicated the analysis of its individual effects on the apparent shear strength. To address this challenge and ensure both accuracy and convenience in our analysis, we approximated the snow temperature by categorizing it into three bands, as suggested by Khvan and others (Reference Khvan2019): −5°C to 0°C, −10°C to −5°C and −17.4°C to −10°C. This approach enabled a more structured examination of the influence of the temperature, density and strain rate on the apparent shear strength of compacted snow.

Figure 4. Variation in the unconfined apparent shear strength of compacted snow with the strain rate. (a) Snow density of 550 kg·m−3; (b) snow density of 500 kg·m−3; (c) snow density of 450 kg·m−3; (d) snow density of 400 kg·m−3; and (e) snow density of 350 kg·m−3. Ductile deformation in the blue background region, brittle deformation in the red background region and the ductile‒brittle transition in the blank background region.
3.2. Effect of the strain rate on the apparent shear strength
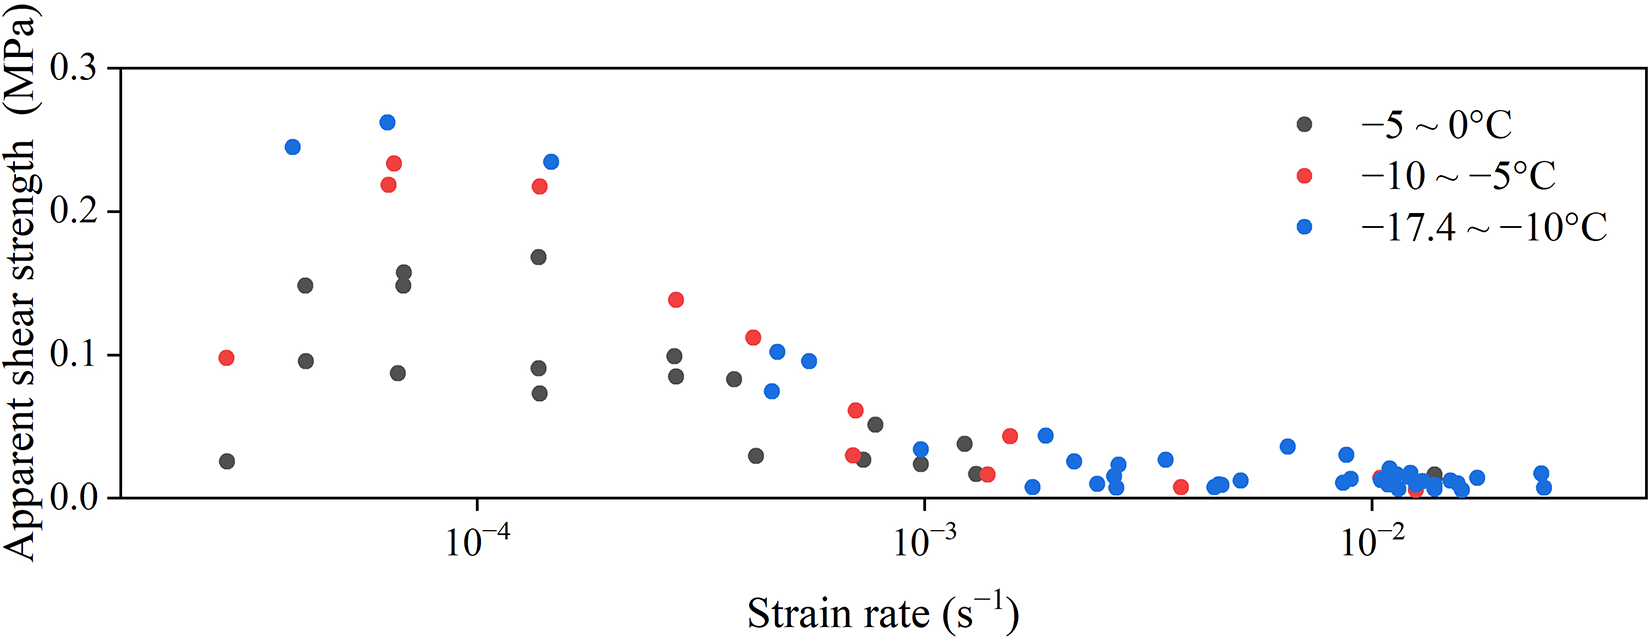
The mechanical properties of snow, as a kind of viscoelastic material, are very sensitive to the loading rate, and a ductile-to-brittle transition is generally characterized by a change in the loading strain rate. Figure 5 shows the variation in the unconfined apparent shear strength of the compacted snow samples with the strain rate for the test results at a density of 500 kg·m−3 as an example. The maximum apparent shear strength occurs near the strain rate of 10−4; at this time, the maximum apparent shear strength is defined as the ultimate apparent shear strength, and the corresponding strain rate is the critical rate for the ductility-to-brittleness transition.

Figure 5. Variation in the unconfined apparent shear strength with the strain rate for a compacted snow density of 500 kg·m−3.
In conjunction with Fig. 4, the critical rates for snow at various temperatures are consistently ∼10−4, and variations in the snow density do not result in significant changes in these critical rates. During the ductile deformation stage of the snow samples, the apparent shear strength increases with increasing strain rate. Conversely, in the ductile deformation stage, the apparent shear strength tends to decrease as the strain rate increases. Specifically, when the snow temperature ranges from −5°C to −10°C, the ultimate apparent shear strength of snow subjected to low-rate loading (strain rate of 2.8 × 10⁻⁵ s−1) is 0.1 MPa. The apparent shear strength reaches its maximum value of 0.23 MPa at a strain rate of 6.5 × 10⁻⁵ s−1. Beyond this point, the apparent shear strength gradually decreases with increasing strain rate, down to 0.006 MPa at a strain rate of 1.3 × 10⁻² s−1. The ductile deformation phase occurs between strain rates of 2.8 × 10⁻⁵ and 6.5 × 10⁻⁵ s−1; during this stage, the apparent shear strength increases by 56%. In contrast, during the brittle deformation stage, the apparent shear strength decreases by 97% as the strain rate increases from 6.5 × 10⁻⁵ to 1.3 × 10⁻² s−1.
3.3. Effect of snow temperature on apparent shear strength
The apparent shear strength of snow, which is a temperature-sensitive material, typically increases as the temperature decreases. As shown in Fig. 4, the snow samples with the same density present greater apparent shear strengths at lower temperatures than at higher temperatures, given the same strain rate. The apparent shear strength can fluctuate under certain conditions, particularly in relation to the strain rate and temperature. When the strain rate is near the ductile-to-brittle transition critical rate of 10−4 s−1, the temperature significantly influences the apparent shear strength, and all snow densities exhibit greater strengths at lower temperatures than at higher temperatures. Conversely, at high strain rates, the effect of temperature on apparent shear strength becomes less pronounced. For example, a snow sample with a density of 500 kg·m−3 subjected to shear damage at a strain rate of ∼10−2 s−1 shows little variation in the apparent shear strength with temperature. Thus, the influence of temperature on the apparent shear strength of snow is complex and intricately linked to the specific form of damage the snow sample experiences.
We selected the ultimate apparent shear strengths for each density within different temperature bands to plot them in Fig. 6. The strengths of the snow samples with a density of 500 kg·m−3 are 0.17 MPa in the −5°C to 0°C band and 0.26 MPa in the −17.4°C to −10°C band, representing an increase of 0.09 MPa or 52.9%. The strengths of the snow samples with a density of 300 kg·m−3 are 0.07 MPa at −5°C to 0°C and 0.15 MPa at −17.4°C to −10°C, representing an increase of 0.08 MPa or 114.3%. As the temperature decreases, the values of the strength enhancement for the snow samples with different snow densities are nearly the same, but the enhancement proportion is greater for the low-density snow samples. These observational data indicate that there exists a significant negative correlation between snow temperature and apparent strength.

Figure 6. Temperature-dependent ultimate apparent shear strength of snow compacted at different densities.
The complexity of snow temperature variations and the impact of temperature on test results during the trial are detailed further in Appendix D.
3.4. Effect of snow density on apparent shear strength
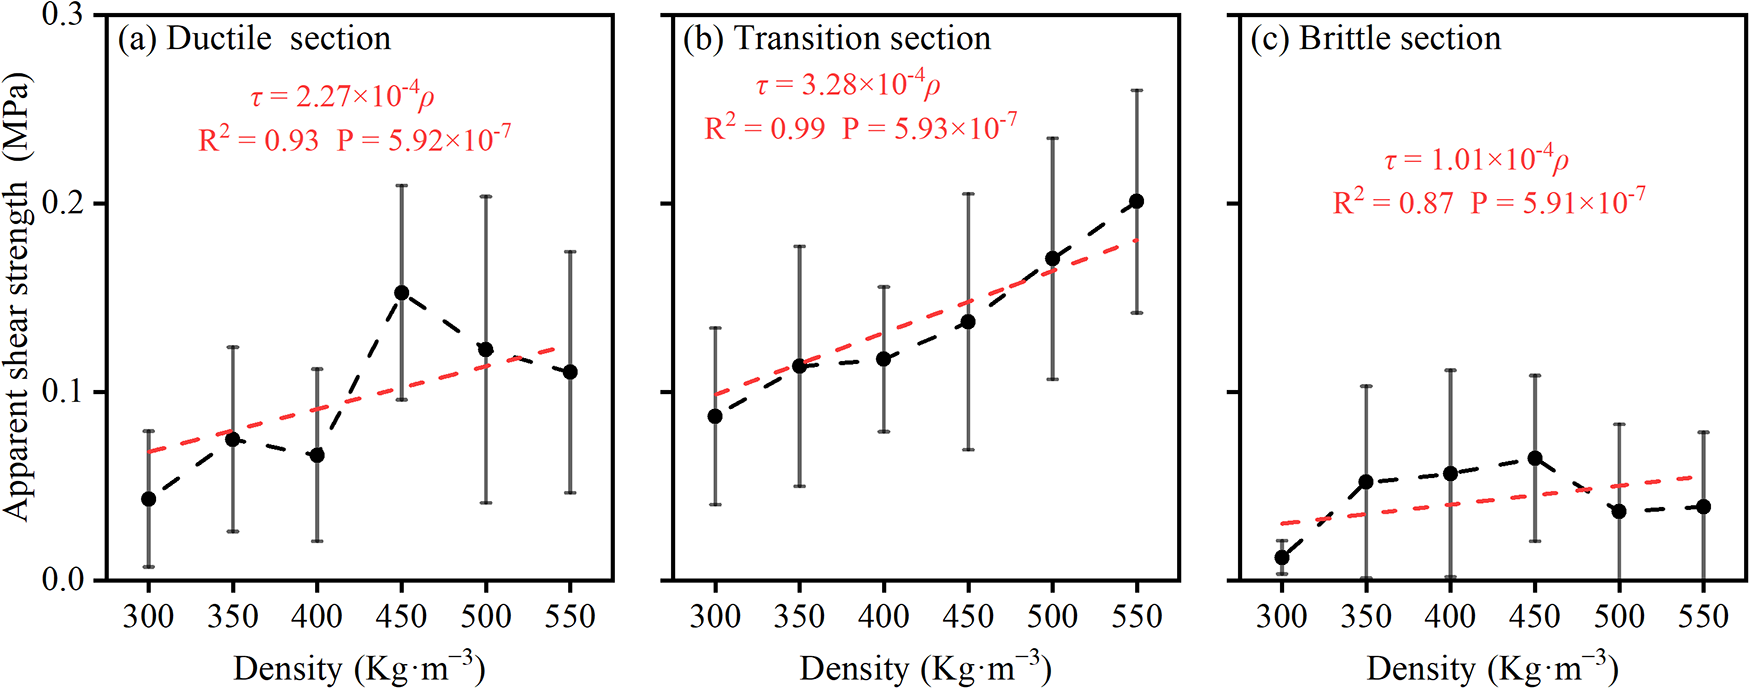
Density is a crucial physical parameter of snow and significantly impacts its unconfined apparent shear strength. Figure 7 shows the variation in the unconfined apparent shear strength of snow with the specific density across the three damage modes, which are delineated by the areas divided by the blue and red lines in Fig. 4. The error lines in the figure indicate the fluctuations caused by temperature effects at different densities. Increasing the snow density effectively increases the apparent shear strength. This enhancement is particularly pronounced during the ductile damage stage and the ductile-to-brittle transition stage, as shown by the steeper slopes of the fitted curves in Fig. 7a and b. Additionally, higher-density snow is more susceptible to strain rate effects. According to Fig. 4, the apparent shear strength of snow samples with a density of 300 kg·m−3 ranges from 2.5 × 10⁻⁴ to 0.07 MPa, with a strength difference of 0.07 MPa. The mean value decreases from 0.087 MPa in the transition section to 0.012 MPa, resulting in a difference of 0.075 MPa. In contrast, the snow samples with a density of 500 kg·m−3 have apparent shear strengths ranging from 0.02 to 0.23 MPa, with a strength difference of 0.21 MPa. The mean value decreases from 0.17 MPa in the transition section to 0.036 MPa, resulting in a difference of 0.136 MPa.

Figure 7. Density-dependent unconfined apparent shear strength of compacted snow at different shear rates. (a) Ductile failure section; (b) ductile–brittle transition section; and (c) brittle fracture section.
4. Discussion
4.1. Comparison with previous works
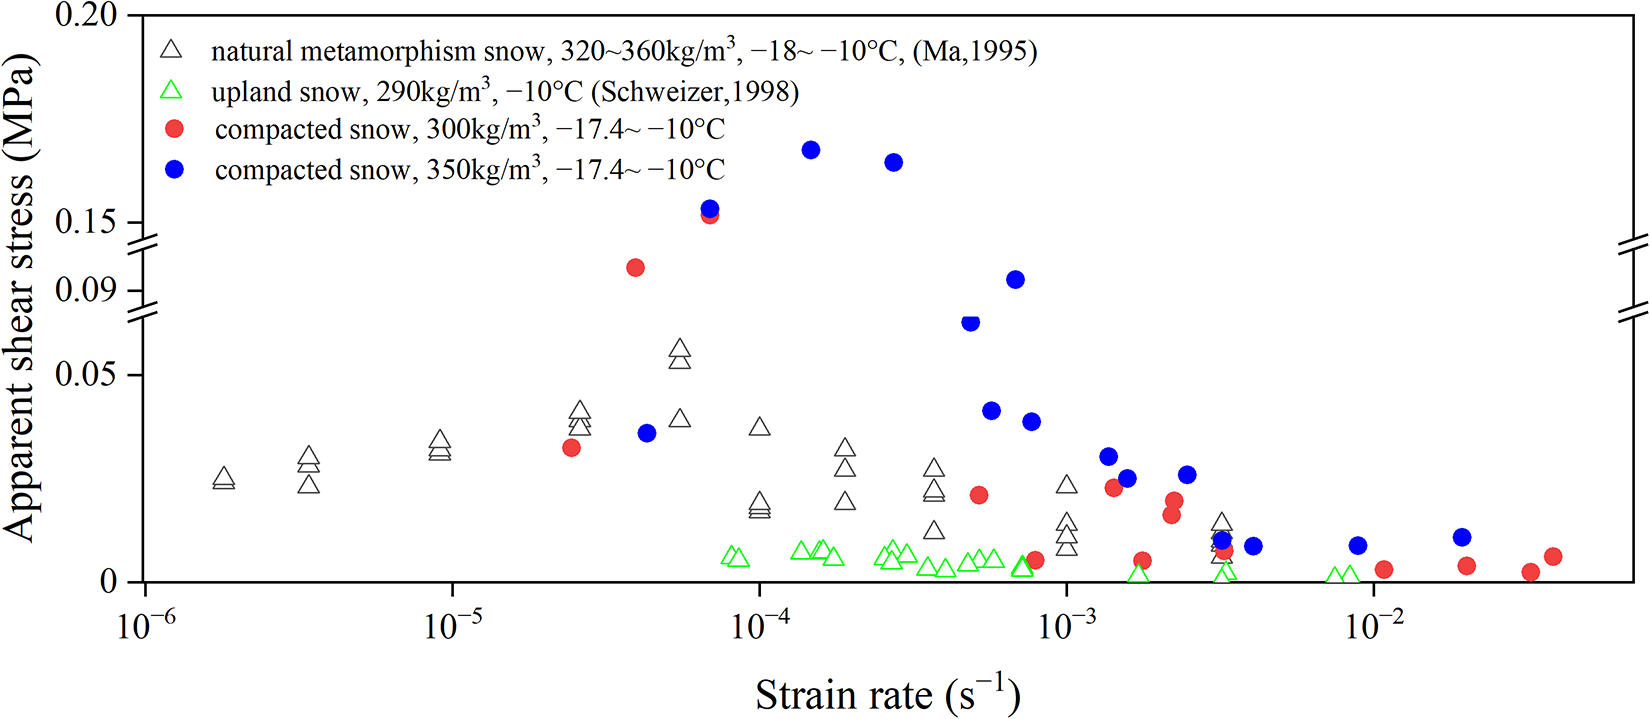
To verify the accuracy of the sample data, we compared them with previous data on the basis of the strain rate, snow crystal morphology and density. Figure 8 shows a comparison of the data obtained from some test samples with previous results obtained under conditions similar to the working conditions in this study. Ma and others (Reference Ma, Hideki and Qin1995) used metamorphic snow from agricultural fields with a density range of 320–360 kg·m−3 in tests at shear strain rates of 1.8 × 10⁻⁶–3.3 × 10⁻³ s−1. Similar to the results from the current study, these results yield a critical rate for the ductile-to-brittle transition of snow of ∼10−4 s−1. The inflection point of the ductile-to-brittle transition is not evident in Fig. 8 because only some of the data from the present tests with low densities and temperatures similar to those in the comparative literature were selected. Most of the experimental values from Ma and others (Reference Ma, Hideki and Qin1995) are lower than those from the present tests because the snow they used was highly deteriorated and aged in the field, whereas the snow used in this experiment was obtained by compaction of natural snow. Compared with the natural snow samples, the highly deteriorated snow samples present decreases in several mechanical parameters, including apparent shear strength. Schweizer and others (Reference Schweizer1998) conducted experiments using alpine snow from Mount Rogers. This snow was also highly metamorphosed and had a relatively low density. Their tests revealed that the ductile-to-brittle transition range under these conditions is between 10−4 and 10−3 s−1. The difference is likely related to differences in the test methods and preparation of snow samples.

Figure 8. Relationships between the apparent shear strength and strain rate in different studies.
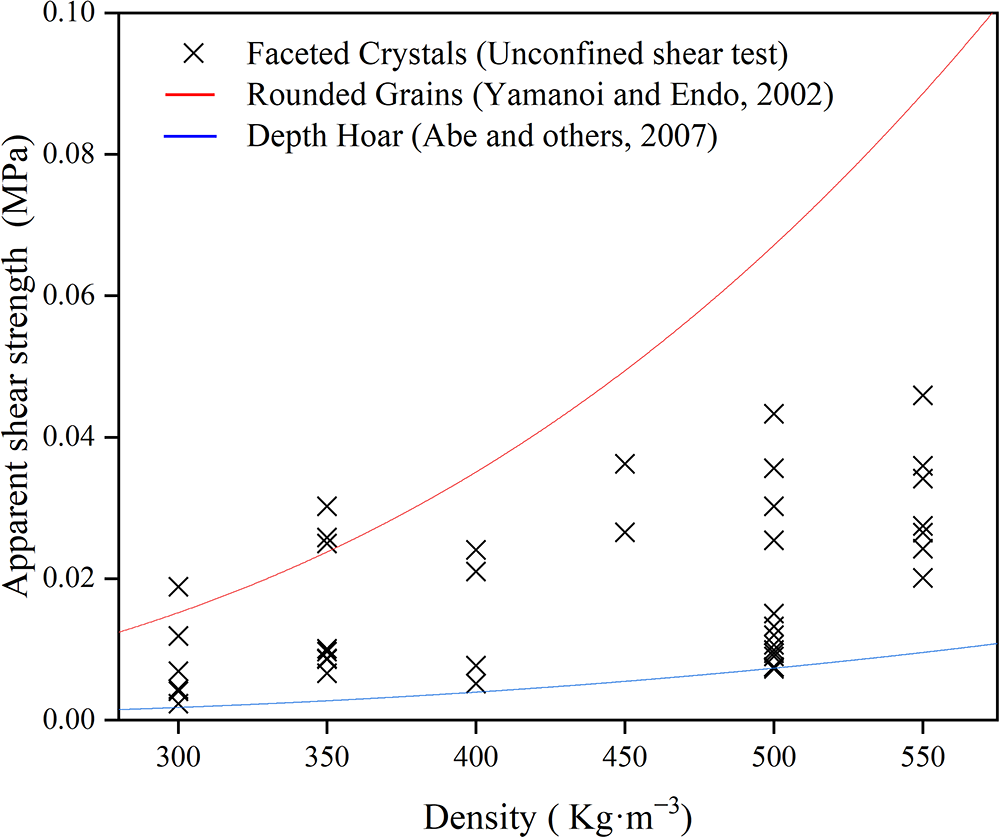
We compared the test results with the apparent shear strength determined using a shear frame. Figure 9 shows the apparent shear strength S RG (Yamanoi and Endo, Reference Yamanoi and Endo2002) of rounded grains and the apparent shear strength S DG (Abe and others, Reference Abe, Mochizuki, Hirashima and Sato2007) of depth hoar calculated using Eqns (3) and (4). In the shear frame test, the strain rate of the snow samples was ∼10−3, and the test temperature was −10°C. Therefore, we also selected test results within this range, with the screened strain rate range being 1.3 × 10⁻³–8.9 × 10⁻³ s−1 and the snow temperature range being −14.2°C to −7.6°C. In the following equation, ρ represents the snow density (kg·m−3).
 \begin{equation}{s_{{\text{RG}}}} = 9.4 \times {10^{ - 7}} \times {\rho ^{2.91}}\end{equation}
 \begin{equation}{s_{{\text{DH}}}} = 2.3 \times {10^{ - 7}} \times {\rho ^{2.78}}\end{equation}
Figure 9. Relationship between the snow density and apparent shear strength (ε: 1.3 × 10⁻³–8.9 × 10⁻³ s−1; T: −14.2°C to −7.6°C).
We used these experimental data as comparative data for fitting and obtained the following equation (5) for the apparent shear strength of faceted crystals as a function of density, with R 2 = 0.25 and P = 1.72 × 10−46.
 \begin{equation}{s_{{\text{FC}}}} = 4.8 \times {10^{ - 7}} \times {\rho ^{1.71}}\end{equation}
As shown in Fig. 9, the values obtained in this experiment lie between those for S RG and S DG, reflecting the variation in apparent shear strength caused by differences in snow crystal morphology. Furthermore, the DSM factor C can be determined using Eqn (6) (Hirashima and others, Reference Hirashima, Abe, Sato and Lehning2009):
 \begin{equation}C = \frac{{{s_{{\text{RG}}}} - {s_{{\text{FC}}}}}}{{{s_{{\text{RG}}}} - {s_{{\text{DH}}}}}}\end{equation}
This value reflects the metamorphic stages of snow grains from rounded grains to depth hoar. After calculation, the average C value in Fig. 9 is 0.73, and the apparent shear strength decreases to approximately one-third of that of rounded grains. However, the specific strength differences between compacted snow and naturally metamorphosed snow still need to be studied. We hope that these values will be helpful in future studies on the snow crystal morphology in the metamorphosis of compacted snow.
The relationships between the snow density and ultimate apparent shear strength are both significant and highly correlated, as shown by the curves fitted for the three different temperature ranges in Fig. 10. When the snow density is between 300 and 400 kg·m−3, the ultimate compressive strength increases more slowly. However, as the density increases from 400 to 500 kg·m−3, a marked and steep increase in the shear capacity occurs. Beyond this range, when the snow density is further elevated to 550 kg·m−3, the increase in the apparent shear strength stabilizes, and the strength reaches a relatively flat plateau. This pattern of change in the ultimate apparent shear strength with increasing density is consistent across all the temperature conditions examined.

Figure 10. Relationship between the density and unconfined apparent shear strength of compacted snow and ice.
The snow density could not be increased without limit by artificial tamping. Therefore, we compared the test results with the ultimate apparent shear strength of granular ice at −17.5°C to −5°C, as shown in Fig. 10 (Lou and Wu, Reference Lou and Wu2022; Zhang and others, Reference Zhang, Zhang, Guo and Cui2022). The ultimate compressive strength becomes similar to that of ice with increasing snow density. The comparison of the pink dots and trend lines in Fig. 10 reveals a divergence from the results obtained by Mellor (Reference Mellor1975), who employed a shear framework to demonstrate that the ultimate apparent shear strength varies with the snow density as a power function. Notably, Mellor’s results in the low-density range are significantly lower than those observed in the present experiment. This discrepancy can be attributed to Mellor’s use of low-density snow sourced from mountain snow pits, which were formed by the accumulation of blizzards throughout the winter season. Over months of metamorphism, these snow crystals transformed into depth hoar, markedly differing from the snow crystals tested in this study. Furthermore, Mellor’s testing method involved direct measurement via blades and boxes in snow pits (Keeler and Weeks, Reference Keeler and Weeks1968), a technique shown to be insufficient for reaching the critical loading rate necessary for snow to undergo the ductile-to-brittle transition (Keeler, Reference Keeler1969). Consequently, the apparent shear strength of low-density snow measured in Mellor’s study was only one tenth of that measured in this experiment at a density of 300 kg·m−3. Snow can be considered a special form of ice, and the shear properties of the two are similar but different. The ductile-to-brittle transition rate of ice is around 10−3 s−1 (Jia and others, Reference Jia, Li, Han, Yu and Gu2015; Han and others, Reference Han, Huang, Jia and Li2016); this value is higher than that of snow because the porosity of ice is much lower than that of snow. High-density snow and granular ice have similar structures and the same internal structural changes under shear. Shear can cause melting of the ice contacts, leading to the formation and breakage of freeze bonds (Patil and others, Reference Patil, Zhaka, Sand, Laue and Cwirzen2022), and this process is nearly identical to the breaking and reformation of intergranular bonds in snow during sintering. These results indicate that the mechanical properties of both snow and ice are affected by microstructural reactions. Future research could examine snow mechanics via snow ontological relationships.
Moreover, direct shear strength remains one of the fundamental mechanical properties of materials. Given the simultaneous occurrence of compression and shear during this test, we compared the numerical relationships between snow under direct shear conditions and the compacted snow from this test under identical operational conditions. Specifically, we selected values for ductile failure under different normal stresses from McClung’s (Reference McClung1977) experiment and compared them with those from this experiment under similar conditions (ρ = 350, 400 kg·m−3, ε < 10−4, T = −10°C to −5°C). Their average values are plotted in Fig. 11 with error bars. For brittle failure, we compared snow from this test (density 350 kg·m−3, ε > 10−4) with Mede and others (Reference Mede, Chambon, Nicot and Hagenmuller2020) numerical examples. It is evident that, regardless of ductile or brittle failure, the apparent shear strength test values consistently exceed those of direct shear. For ductile failure, the apparent shear strength is 5.3 times the direct shear value, while for brittle failure, it is 2.1 times. The primary cause of this phenomenon is that compressive deformation of snow under lateral loading, without vertical normal stress constraints, enhances its strength. During brittle failure, the rapid loading process results in a short compression time, thereby limiting the compaction effect within the snow structure. Consequently, the strength increase relative to ductile failure is lower. It is worth noting that the ratio of apparent shear strength to direct shear strength varies accordingly due to differences in direct shear test conditions.

Figure 11. Relationship between nominal shear strength and direct shear strength under different normal stresses.
4.2. Damage analysis
The previous section offers a detailed analysis of how each variable influences the snow apparent shear strength, yet it lacks a quantitative depiction of the ultimate damage pattern. To address this gap, we explored the impact of shear deformation on snow samples. In this study, we employed a post-damage analysis method, as outlined by De Biagi and others (Reference De Biagi, Barbero, Barpi, Borri-Brunetto and Podolskiy2019), alongside the DEM to simulate the mechanical response of snow crystal particles. The model parameters were optimized on the basis of field observations, with a focus on particle contact properties (rolling/torsional resistance) and bond strength, as described by Jiang and others (Reference Jiang, Shen and Wang2015), Shen and others (Reference Shen, Jiang and Wan2016) and Huo and others (Reference Huo, Hu, Li, Yang and Jia2023), and calibrated on the basis of parameters from An and others (Reference An, Ling, Geng, Li and Zhang2018). Refer to Appendix C and Table S1 for specific parameter details. The simulated load‒displacement curves demonstrate an error of <10% compared with the test data (Fig. 12), confirming the reliability of the model. While the model reasonably captures brittle damage mechanisms, it may over-represent ductile damage owing to the exclusion of pressure sintering-induced dynamic adjustment of the snow crystal structure (Kabore and Peters, Reference Kabore and Peters2020a). In the experimental context, pressure sintering is a dominant factor in snow crystal remodelling during the ductile phase, exerting a significantly stronger influence than diffusion sintering (Kabore and Peters, Reference Kabore and Peters2020b). Under prolonged shear conditions, pressure sintering increases the contact area between particles, thereby diminishing the accuracy of the model in predicting ductile deformation. Therefore, an adjustment to account for this phenomenon is necessary in future iterations.

Figure 12. Parameter calibration results under ductile and brittle failure.
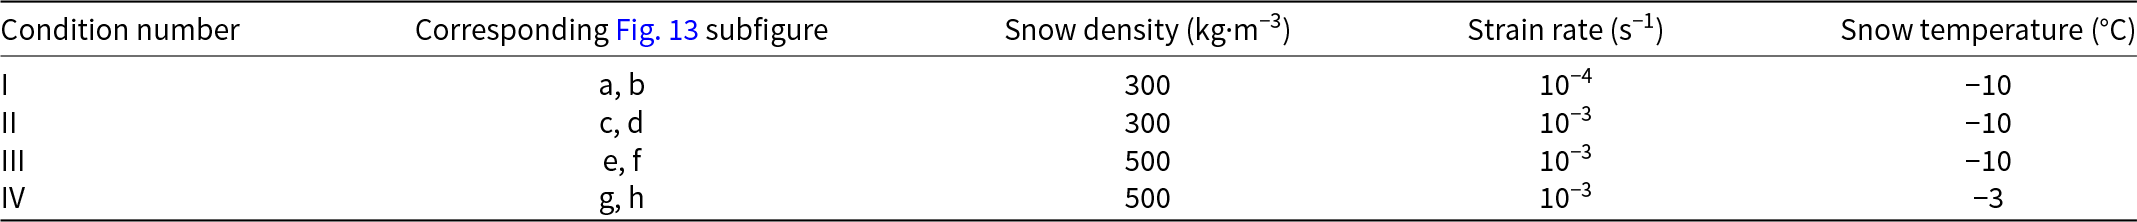
The model state after loading can be analysed by monitoring particle displacement and the formation of cracks following deformation (Gaume and others, Reference Gaume, van Herwijnen, Chambon, Birkeland and Schweizer2015). We identified four typical forms of damage, and their specific working conditions are detailed in Table 1. Figure 13a, c, e and g shows the displacement of the particles in the snow model after damage from the simulated shear test, whereas the corresponding actual test site images are shown in Fig. 13b, d, f and h. In these images, the cracks are highlighted with red dashed lines. Upon examination, the fracture and compression patterns observed in the simulation closely align with those from the actual test. This alignment demonstrates that the DEM effectively captures the mechanical properties of compacted snow during shear deformation.

Figure 13. Density of 300 kg·m−3, strain rate of 10−5 s−1 and snow temperature of −10°C: (a) particle displacement and (b) snow sample after experimental destruction. Density of 300 kg·m−3, strain rate of 10−3 s−1 and snow temperature of −10°C: (c) particle displacement and (d) snow sample after experimental destruction. Density of 500 kg·m−3, strain rate of 10−3 s−1 and snow temperature of −10°C: (e) particle displacement and (f) snow sample after experimental destruction. Density of 500 kg·m−3, strain rate of 10−3 s−1 and snow temperature of −3°C: (g) particle displacement and (h) snow sample after experimental destruction.
Table 1. Parameter values corresponding to the working conditions of the calculation example.

When low-density snow samples under Condition I undergo shear failure at low strain rates, the upper snow mass in direct contact with the shear box experiences direct compression and convergence (Schultz and others, Reference Schultz, Muller, Gross and Humbert2021). During this process, the pore size of the snow in this region gradually decreases, and its density continuously increases, ultimately being compacted into a dense, hard, semicircular disc-shaped body. The continuous, progressive compression and densification observed in snow during shear failure are similar to the densification process observed in unconfined compression tests of compacted snow at low strain rates (Wang and others, Reference Wang, Fu, Han, Liu, Xiao and Leng2021), both of which ultimately result in a dense state resembling ice. Notably, only the snow near the moving end of the shear box experiences displacement, as depicted in Fig. 13a. The displacement is more pronounced closer to the shear box, whereas the remainder of the snow sample remains largely immobile. Notably, owing to the very low strain rate, the snow sample undergoes internal morphological changes. These changes are attributed to the sintering of snow crystals during extrusion by the shear box. This phenomenon aligns with the early stages of the simulation results, although it diverges from actual conditions when significant changes in snow crystal size occur after prolonged loading.
When the strain rate is increased while the other conditions remain constant, the snow sample exhibits the damage pattern illustrated in Fig. 13c for Case II. At this stage, two cracks appear in the cross section of the snow sample, and the snow surface at their intersection is displaced. These cracks constitute 85.5% of the total length in the longitudinal direction and 61.5% in the transverse direction. Consequently, the snow sample experiences significant damage in the transverse direction, accompanied by joint damage in the upper weak section. Notably, substantial displacement occurs at the top end of the toppled snow layer, whereas the snow particles in the lower section remain stationary.
As the density increases, the damage patterns of the snow samples evolve, leading to deformation, as observed in Case III and shown in Fig. 13e and f. Under these conditions, internal cracking occurs, often accompanied by a crisp sound, yet the snow surface remains flat. During this phase, the shear box displaces most of the snow particles from their original positions. The internal cracks form a V shape, and the cracks account for 67.4% of the total length in the longitudinal direction and 52.1% in the transverse direction. Under elevated temperatures, as in Case IV (Fig. 13g and h), the deformation of the snow sample becomes more pronounced than that under the low-temperature conditions of Case III. In Case IV, the cracks significantly expand and constitute 97.5% of the total length in the longitudinal direction and 72.7% in the transverse direction. This extensive cracking is attributed to the reduction in the bond strength and facilitates the development and propagation of cracks.
4.3. Limitations and uncertainties
In this study, the apparent shear strength of unconfined snow at depth was explored using experimental and numerical analysis methods. The deformation characteristics of compacted snow under shear action were also obtained. However, owing to technical conditions and other factors, both the research process and conclusions are subject to certain limitations. The following section will explain these limitations and the uncertainties associated with storing snow in outdoor environments from the perspectives of failure modes, experimental test conditions and the integrity of numerical simulations.
First, snow is an extremely fragile material, and owing to its strain-induced softening properties, snow samples inevitably undergo mixed deformation under shear stress (Mede and others, Reference Mede, Chambon, Nicot and Hagenmuller2020). Similar to many previous shear tests, the unconfined shear tests in this study exhibited a mixed failure mode driven by both shear and nonshear (compression) components during failure (Gaume and others, Reference Gaume, Gast, Teran, van Herwijnen and Jiang2018). While we did not distinguish the proportion of shear components in the mixed deformation during failure, instead treating all values as the unconfined apparent shear strength, this approach was a reasonable choice under the experimental conditions to ensure the consistency and comparability of the data.
Second, there was a time interval between sample preparation and testing. We made every effort to expedite the sample preparation process; however, sintering during this period still results in increased apparent shear strength and some uncontrollable outcomes. In addition, the temperature differences during the preparation process of different batches of samples further exacerbate the uncertainty caused by the temperature during the compaction process. While conducting experiments in a temperature-controlled low-temperature laboratory is ideal, this standard is difficult to meet because of the constraints of fieldwork. Furthermore, sintering occurs more slowly at higher densities, and under these conditions, the effects of sintering are further minimized.
Third, the strain rate experienced by the samples is significantly influenced by ductile deformation processes at the machine–sample interface (Schöttner and others, Reference Schöttner2025). There remains a discrepancy between the shear box and snow sample rates, stemming from local crushing at the sample‒shear box interface and the ductile–brittle deformation of the layers. This phenomenon is unavoidable, but we minimized the resulting errors by using displacement sensors for accurate recording. Future studies could incorporate real-time measurement techniques such as digital image correlation for calibration (Turner and others, Reference Turner, Crozier and Reu2015) to achieve greater precision.
Fourth, the results of the numerical model still need to be further extended. Specifically, the discrete element model used in this study is based on previous research on the evolution of compacted snow under unconfined uniaxial compaction, and further improvements are required in the treatment of sintering and the contact law when operating conditions change. While addressing these issues would require methods focused more on numerical calculations, which is beyond the scope of this study, the current model effectively supports the experimental conclusions within the established research framework.
Finally, as the snow samples were exposed to the outdoor environment, even when stored beneath canvas where atmospheric forcing was relatively low, deterioration was unavoidable. Furthermore, the external temperature field was uncontrollable, meaning the temperature variations in these samples resulted from passive changes imposed by the surrounding environment. Conclusions regarding temperature may be more applicable to the practical scenarios of long-term outdoor storage and sampling, which may differ from results obtained from snow samples tested after being maintained at a constant temperature. This introduces numerical uncertainty into the results of snow temperature testing.
5. Conclusion
In this study, the unconfined shear mechanical properties and deformation damage mechanisms of artificially compacted natural snow were examined across a broad spectrum of densities, temperatures and strain rates. The effects of density (300–550 kg·m−3), temperature (−17.4°C to 0°C) and strain rate (1.3 × 10⁻⁵–3.8 × 10⁻² s−1) were comprehensively considered in the experiments and simulations. Apparent shear strength data were obtained through mechanical loading experiments, and the micromechanical behaviour at the snow crystal scale was analysed via a discrete element model.
The test results reveal that the unconfined apparent shear strength of compacted snow exhibits a nonlinear response of first increasing and then decreasing with increasing strain rate. The density greatly influences the strength, which tends to approach that of granular ice when the density is increased. Reducing the temperature enhances the strength of low-density snow (<300 kg·m−3) more significantly. Discrete element simulation further reveals fine-scale differences in the damage modes: during ductile deformation, the snow crystal stacking structure maintains its integrity without obvious cracks; under brittle damage, localized cracking occurs within high-density snow, whereas through-cracks are formed in low-density snow, and the temperature affects crack extension by regulating the intercrystal bonding force.
In this study, we quantified the influences of the strain rate, temperature and density on the mechanical behaviour of compacted snow and proposed a critical strain rate (10−4 s−1) that provides a key threshold for evaluating the stability of compacted snow, which can help guide avalanche prediction and snow-resistant designs of infrastructure in cold regions. In addition, the finding that metamorphosed snow is weaker than natural snow helps fill the gap in knowledge concerning the decay of mechanical properties during snow metamorphosis. Future research should focus on three aspects: (1) establishing a grain-scale viscoelastic‒ductile ontological model to analyse the mechanical mechanism of intergranular bond breakage‒reformation, (2) introducing micro-computed tomography three-dimensional reconstruction technology to nondestructively track the sintering evolution of the snow microstructure after deformation and (3) quantifying the effect of time-dependent metamorphism on the mechanical properties, overcoming the limitations of field tests. Breakthroughs in these directions will promote the prediction of the mechanical behaviour of snow in complex environments from single-factor analysis to multifield coupled modelling.
Supplementary material
The supplementary material for this article can be found at https://doi.org/10.1017/jog.2025.10118.
Acknowledgements
We thank the editor Alec van Herwijnen, Jakob Schöttner and one further anonymous reviewer for their constructive feedback. This research was funded by the National Natural Science Foundation of China (42320104004), the National Natural Science Foundation of China (42276242), the National Natural Science Foundation of China (42406244), the National Natural Science Foundation of China (W2521033), the Postdoctoral Fellowship Program of CPSF (GZB20230102) and the Joint Funds of the National Natural Science Foundation of Liaoning Province (2023-BSBA-021).


 Open access