


Highlights
-
• Spanish dialects from around the world reveal significant lexical differences.
-
• In lexical decision, Chileans respond faster to general and Chilean Spanish words.
-
• Multilink+ simulations support Chilean differences in Spanish lexical usage.
-
• Word ratings outperform frequency databases for region-specific lexical items.
-
• Frequency measures for Spanish should be tailored to specific user populations.
1. Introduction
When Google Translate is asked for the Spanish translation of “popcorn,” it returns three different translations: palomitas, rosetas, and ñaco. Remarkably, palomitas is only used in Spain, Mexico, and parts of Central America, but rosetas and ñaco are not used in any country! In fact, rosetas is an artificial word used in books and movies that are translated to Spanish for the Latin American market. In real life, at least 12 different terms are used for this one concept throughout Hispanoamerica. In Chile, for example, the word for popcorn is cabritas, and in Colombia, it is crispetas.
The various language variants spread out over the Spanish speaking world are usually referred to by the common term “Spanish,” but they are in fact distinct dialects (Sorenson, Reference Sorenson2021). Dialects are defined as mutually intelligible versions of a language associated with a particular group of speakers, characterized by distinct features in pronunciation, grammar, and vocabulary (Pullum, Reference Pullum, Konopka and Wöllstein2017).
Dialects mainly differ in terms of pronunciation, syntax, and vocabulary. Differences in pronunciation include rhythm, intonation, and the way specific letters or letter combinations are pronounced. Examples are differences in the pronunciation of the letter “s,” called seseo (Boyd-Bowman, Reference Boyd-Bowman1956), and the letter combination “ll,” called yeismo (Rost Bagudanch, Reference Rost Bagudanch2017). Variation in syntax includes different preferences in word order, use of pronouns, and verb conjugation, for example, the use of vos instead of tú in Argentina and Uruguay (Penny, Reference Penny2000; Weinberg & Beatriz, Reference Weinberg and Beatriz1977). Vocabulary differences probably contribute most to dialectal differences (Eddington, Reference Eddington2021) arising from colonization and migration (González & Barrios, Reference González and Barrios2023), linguistic factors (Shea, Reference Shea2022), and sociolinguistic factors (Jucks & Paus, Reference Jucks and Paus2013).
The study of Spanish dialects reveals considerable linguistic variation across syntactic, pragmatic, and lexical domains. Toribio (Reference Toribio2000) highlights parametric differences in subject licensing across dialects, illustrating rich syntactic diversity. Gallego (Reference Gallego2019) further analyzes variation in phenomena such as word order and differential object marking. Pragmatic variation is also evident: Márquez Reiter (Reference Márquez Reiter2022) contrasts indirect requests in Peninsular and Uruguayan Spanish, showing how social norms influence indirectness. Orozco (Reference Orozco2018), examining Colombian and New York City Spanish, shows how migration shapes linguistic convergence. Eddington (Reference Eddington2022) applies computational methods to classify dialect regions based on lexical and grammatical traits, reinforcing the global complexity of Spanish variation. These studies demonstrate the interplay of linguistic and social factors in shaping dialectal diversity.
Complementing these structural approaches, perceptual dialectology reveals how speakers perceive similarities and differences among Spanish varieties. Alfaraz (Reference Alfaraz, Moreno-Fernández and Caravedo2022) links perceptual judgments to historical, sociological, and cognitive dimensions, showing how dialect perception reflects broader sociolinguistic contexts. Moreno-Fernandez (Reference Moreno-Fernandez, Jeppesen and Lindschouw2015) found that Spanish speakers perceive Latin American varieties as relatively homogeneous, with Spain seen as more distant; Chile, grouped within the Latin American cluster, showed perceptual variation tied to age and origin. Similarly, Quesada Pacheco (Reference Quesada Pacheco2014) identified perceptual clusters among American Spanish speakers, noting that Chilean Spanish is sometimes viewed as distinct due to isolation and indigenous lexical influence. These studies highlight how subjective beliefs often shape dialect classifications, influencing how lexical variation is understood in daily communication.
Few empirical studies systematically differentiate Spanish dialects, partly due to their number and overlap. Spanish is official in 21 countries (Eddington, Reference Eddington2021), but shared media sources complicate dialect-specific data collection. This lack of clear differentiation affects both public understanding and scholarly analysis. To identify what words people actually use, it is crucial to examine frequency databases.
Lipski (Reference Lipski, Hualde, Olarrea and O’Rourke2012, Reference Lipski, Boberg, Nerbonne and Watt2017) has contributed extensively to this field, aiming to map dialectal boundaries through lexical data. His research emphasizes the cultural and historical context of vocabulary, for example, African-language influences in Caribbean Spanish (Delgado-Díaz, Reference Delgado-Díaz2018) and lexical borrowing from indigenous languages in Mexico and the Caribbean. Although Lipski’s main focus is phonology and grammar, his work sets the stage for vocabulary-centered studies. Goodrich and Lonigan (Reference Goodrich and Lonigan2018) show how dialectal exposure affects vocabulary development in bilingual children, underscoring the role of dialects in shaping lexical knowledge. Figure 1, adapted from Lipski (Reference Lipski, Hualde, Olarrea and O’Rourke2012), provides a general overview of Spanish dialects, where color coding indicates similarities and distinctions across regions. This map serves as a useful starting point for our investigation and inspires hypotheses regarding lexical divergence.

Figure 1. Distribution of Spanish dialects across the world according to Lipski (Reference Lipski, Hualde, Olarrea and O’Rourke2012).
In the present study, we focus specifically on vocabulary differences between Spanish dialects. Dialects may use different words with the same form but different meanings or use entirely different words for the same concept. An example of the first type is carro, which can mean “car” or “cart” depending on the country. An example of the second type includes frutilla and fresa, both meaning “strawberry” but used in different regions.
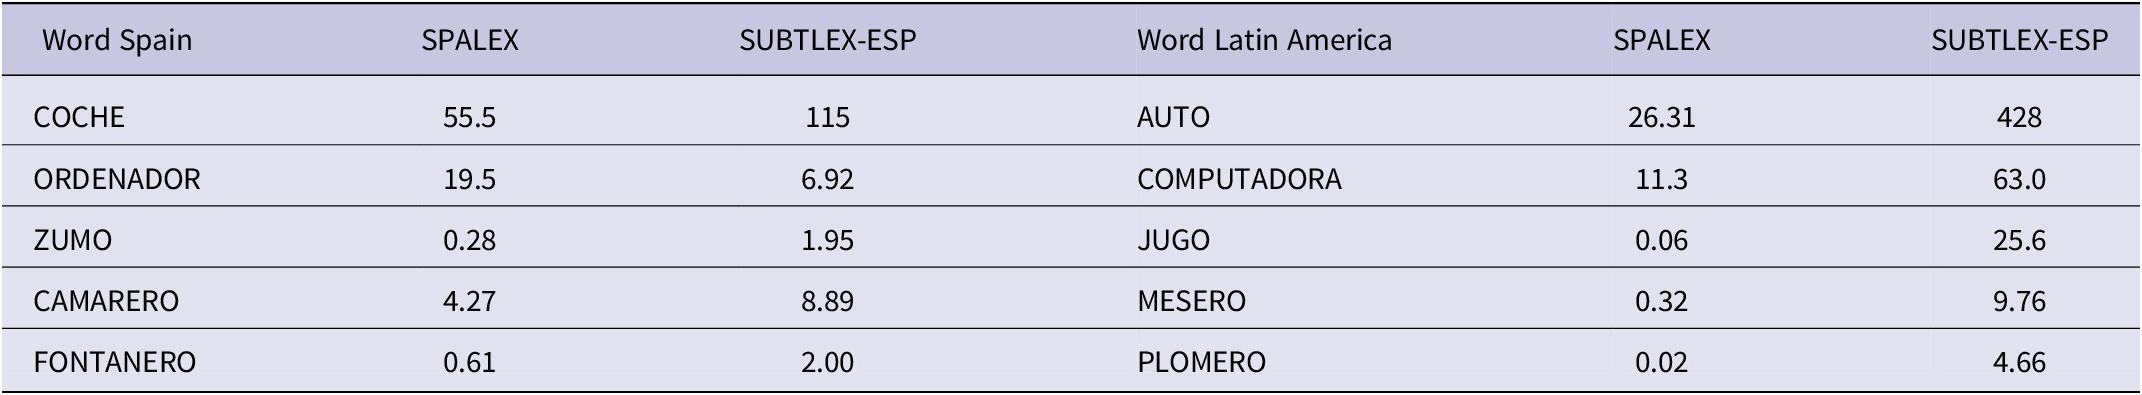
Dialects often differ not only in lexical choice but also in the frequency with which particular terms are used. Word frequency databases capture this information by quantifying word usage across language corpora such as newspapers or movie subtitles (New et al., Reference New, Brysbaert, Veronis and Pallier2007). These databases are constructed through different methodologies, but all rely on counts from written or spoken sources. For example, the SPALEX database (Aguasvivas et al., Reference Aguasvivas, Carreiras, Brysbaert, Mandera, Keuleers and Duñabeitia2018), developed through collaboration among institutions in Spain, Belgium, and the Netherlands, contains reaction times alongside word frequencies and was the first crowdsourced lexical decision mega-study in Spanish. A close look at SPALEX reveals that most of its source data come from Spain. This regional bias becomes evident in Table 1, where word frequencies favor Spanish forms over their Latin American equivalents, even though most Spanish speakers live in Latin America.
Table 1. SPALEX and SUBTLEX-ESP occurrences per million (OPM) for typical words from Spain and Latin America

The second database, SUBTLEX-ESP (Cuetos et al., Reference Cuetos, González-Nosti, Barbón and Brysbaert2011), also aims to represent the Spanish language as a whole. Released in 2011 and comprising 41.5 million words, it was designed to improve upon existing databases. SUBTLEX-ESP used subtitles from 3,523 movies (20,253,754 words) and 257 TV series (21,323,919 words), sourced from three websites: (a) www.argenteam.com, (b) www.subdivx.com, and (c) www.solosubtitulos.com. Although it is hard to determine the exact dialectal representation, user traffic suggests that the primary sources are Argentina, Chile, and Mexico.
These data support the assumption that dialectal origin influences frequency representation. Words common in Argentina or Latin America appear more frequently, yet other dialects remain underrepresented.
Overall, it is misleading, even incorrect, to treat a diverse language like Spanish as a monolith within a single database. Dialects differ in phonetic realization, prosody, and lexical distribution, and using a single frequency source can hinder accurate dialect classification (Hansen & Liu, Reference Hansen and Liu2016). The lack of lexical distinction among Spanish varieties can skew psycholinguistic findings. For instance, Martin et al. (Reference Martin, Garcia, Potter, Melinger and Costa2016) showed that dialect-specific vocabulary affects processing: Listeners adjust to the phonological and lexical cues of dialectal speakers. Ignoring these nuances risks flawed interpretations of comprehension and cognitive function. From both scientific and sociolinguistic perspectives, developing dialect-specific frequency databases appears necessary.
This approach has precedent. English-language research has long distinguished between British and American variants, with separate usage norms and even academic writing guidelines (Biber, Reference Biber1987; Scott, Reference Scott1993). Similar divisions exist in French (European, Canadian, and African). Yet Spanish dialects remain comparatively underexamined. This study seeks to address that gap by focusing on vocabulary variation across Spanish dialects, a dimension still insufficiently represented in the literature.
1.1. Present research
Our research is structured into several key stages, each designed to address distinct aspects of lexical variation in Spanish across different regions. We begin by examining lexical distinctions between European Spanish and various Latin American Spanish dialects, with a focus on differences in both word meaning and frequency of use. This initial analysis aims to determine whether a word frequency database constructed from subjective word frequencies offers a more accurate representation of a specific language variant compared with currently available generalized databases.
Previous evidence has shown that the construction of word frequency databases based on subjective word frequencies can indeed offer a more accurate representation of specific language variants compared with generalized databases. For instance, Shade and Altmann (Reference Shade and Altmann2023) argue that the representation of text through vocabulary and word frequency distributions can reveal significant statistical regularities that are sensitive to the context in which the language is used. Generalized databases often fail to capture the nuances of specific dialects, which can lead to misrepresentations of how frequently certain words are used in particular communities. Additionally, Gimenes and New (Reference Gimenes and New2016) argue that subjective database reflecting actual use in everyday communication within a dialect can enhance the validity of psycholinguistic studies by ensuring that the stimuli reflect the actual language experience of the participants.
If such a database proves more representative, it would support the case for developing dialect-specific frequency resources. Conversely, if existing generalized databases are found sufficient, separate dialectal databases may be unnecessary.
To explore this, we will first conduct an international survey to assess the frequency of Spanish word usage across different dialects (Experiment 1). The data gathered from this survey will be analyzed to identify differences among the Spanish dialects of the participating countries. This analysis will highlight cross-dialectal vocabulary differences, particularly at the group level rather than between individual dialect pairs.
Following the survey analysis, we will categorize the words based on regional usage, which will allow us to examine variations in responses, with a special focus on Chilean participants. Building on these initial findings, we will conduct an expanded version of the survey, concentrating exclusively on Chilean respondents (Experiment 2).
Subsequently, the same Chilean participants will engage in a Spanish Lexical Decision task involving all the words from the survey (Experiment 3). This will enable us to convert subjective word ratings from Chile into frequency measures, which we will then apply in computational model simulations using Multilink+ (Dijkstra et al., Reference Dijkstra, Wahl, Buytenhuijs, Halem, Al-Jibouri, de Korte and Rekké2019, Reference Dijkstra, Peeters, Hieselaar and van Geffen2023; Dijkstra & Peeters, Reference Dijkstra and Peeters2023), a model designed for monolingual and multilingual word retrieval. These simulations (Experiment 4) will allow us to compare the predictive accuracy of frequency measures derived from SPALEX and SUBTLEX-ESP with those obtained from subjective word ratings.
In summary, our research aims to achieve two main objectives. The first is to determine whether subjective word frequency measures can better predict Chilean reaction times (RTs) than existing databases such as SUBTLEX-ESP and SPALEX. We hypothesize that word frequencies based on subjective ratings will outperform both databases, as they more accurately reflect the language use of our study participants. The second objective of our study is to investigate how Chilean participants respond to words from different Spanish dialects and assess the extent to which Multilink+ can predict these responses. We expect that Chilean participants will respond faster and more accurately to words aligned with their own dialect and that Multilink+, when using subjective frequency inputs, will effectively capture this pattern.
2. Experiment 1: Survey of Spanish dialects
In Experiment 1, we used a survey to quantify word frequency differences between Spanish dialects. The survey assessed subjective ratings of word use and should be sensitive to geographical dialect differences. Following the earlier mentioned study by Lipski (Reference Lipski, Hualde, Olarrea and O’Rourke2012, Reference Lipski, Boberg, Nerbonne and Watt2017), we predicted that a north–south division would show up.
2.1. Method
The online survey was conducted using Google Forms and was open to all native Spanish speakers. It was divided into two sections: (1) collected background information, with the exact questions detailed in the Appendix, and (2) word frequency data. The word list used for the experiment consisted of handpicked words, half of which were likely to have different frequencies in different countries and half of which likely to have similar frequencies in different countries. Participants rated these words based on their personal usage frequency, with a scale from 1 (“practically never”) to 5 (“very often”). The entire survey, including texts, questions, and answers, was formulated in Spanish.
2.2. Results
Data analysis was conducted using Python (Version 3.10) and the Pandas library (Version 1.4). Initially, 600 participants submitted responses to the survey. To ensure data quality, data from participants exhibiting abnormal response patterns were excluded from the analysis. Abnormal patterns included consistently rating all words with a score of 1 or displaying recurring patterns across responses. Additionally, data from participants who did not provide ratings for 10 or more words were removed. Following these exclusions, the dataset comprised 590 participants.
Outlier detection was performed at the word level. The overall mean rating across all words was 3.48 (standard deviation [SD] = 1.01). No words were identified as outliers, because the mean ratings for all words fell within 3 SDs of the overall mean. Data were collected for the dialects in the following countries (number of participants in parentheses): Spain (185), Uruguay (90), Chile (66), Argentina (48), Mexico (44), Costa Rica (41), Venezuela (33), Colombia (20), and Peru (20).
To compare dialects and potentially group them, we calculated the mean rating for each word in each dialect, excluding zero values. Outlier analysis for each word for each country was performed. As a result, 380 individual entries were removed, as they were more than 3 SD from the mean.
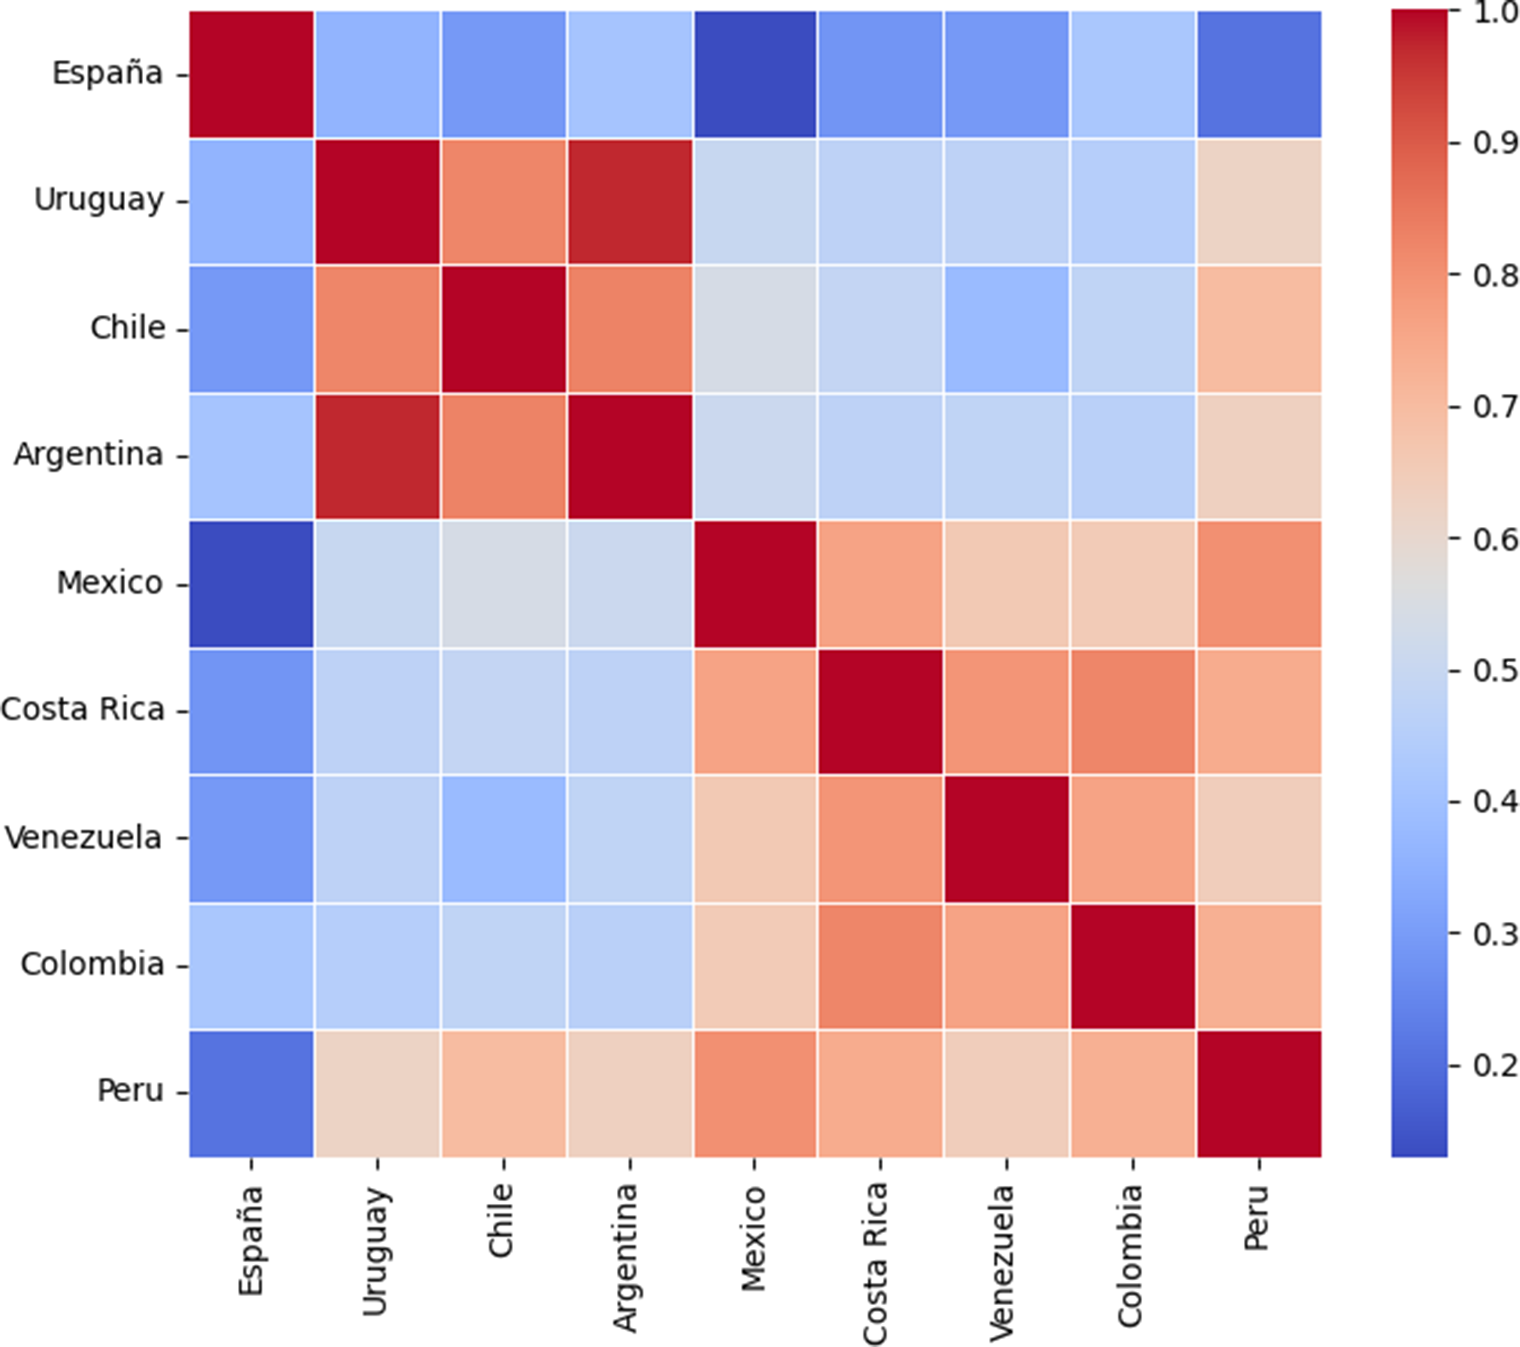
The next step was to divide the array for each dialect into two parts: (a) words expected to have similar usage frequencies across all dialects and control words (LOWDIF array) and (b) words expected to be unique to certain dialects or have different meanings in different dialects (HIGHDIF array). For HIGHDIF words, considering colloquialisms or dialect-specific words, the calculations resulted in Table 2. Note that all regression numbers are absolute, as the direction of the correlation was irrelevant. The table can also be visualized as a heatmap (Figure 2).
Table 2. Correlations between dialects for HIGHDIF words

Note: All correlations not involving Spain are significant at p < .005.

Figure 2. A heatmap of the correlation matrix for all dialect pairs in the survey.
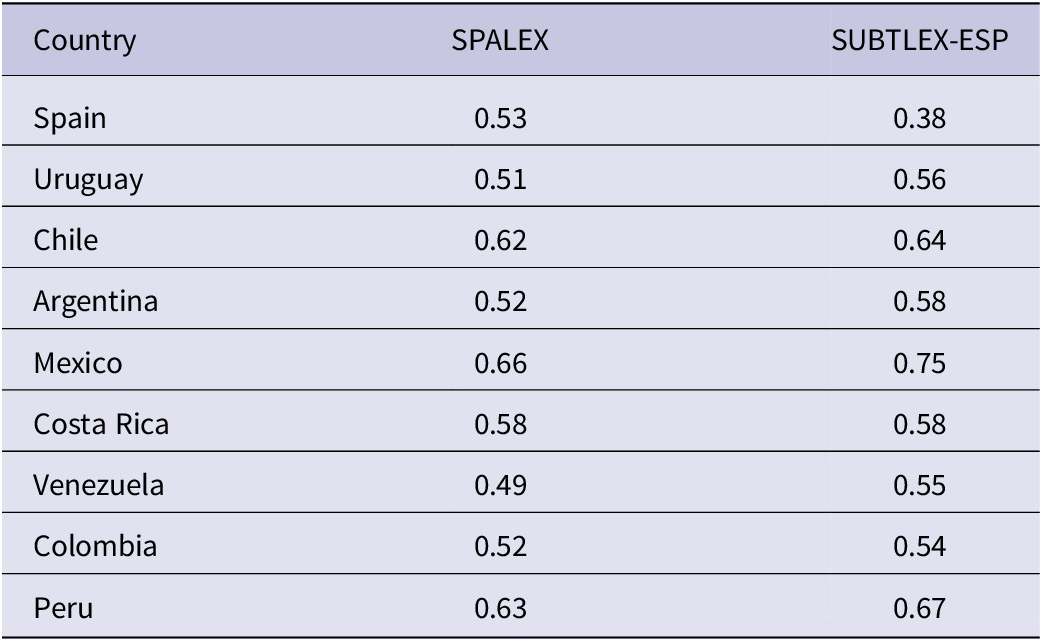
We then compared the survey’s results to existing collections of word frequency measures, in particular the SPALEX (Aguasvivas et al., Reference Aguasvivas, Carreiras, Brysbaert, Mandera, Keuleers and Duñabeitia2018) and SUBTLEX-ESP (Cuetos et al., Reference Cuetos, González-Nosti, Barbón and Brysbaert2011) databases. We calculated correlations between the collected word ratings from the survey and their respective log frequencies from SPALEX and SUBTLEX-ESP to determine which database best reflected word use in each country. These correlations are presented in Table 3.
Table 3. Correlations between country ratings and log word frequencies from SPALEX or SUBTLEX-ESP

Note: All correlations are significant at p < .001.
2.3. Discussion
We hypothesized that our results would reveal a north–south division similar to that observed in Lipski’s (Reference Lipski, Hualde, Olarrea and O’Rourke2012) dialectal map (see Figure 1). The heatmap in Figure 2 supports this hypothesis and also shows that the Spanish dialect from Spain is significantly different from all others. The highest correlation for Spain was .42 with Colombia, whereas its correlations with Peru (p = .12) and Mexico (p = .37) were not statistically significant at p < .05.
Within Latin America, distinct dialectal clusters emerged, with some correlations as low as .38. However, all correlations within Latin America were statistically significant (p < .005). The data indicate two major dialect clusters: (1) Uruguay, Chile, and Argentina, and (2) Mexico, Venezuela, Costa Rica, and Colombia, consistent with Lipski’s (Reference Lipski2008) classification of Spanish dialects into clusters based on phonological features, vocabulary usage, and syntactic structure. Peru demonstrated high correlations with both groups but slightly stronger alignment with the northern cluster (.73 vs. .65), consistent with prior linguistic research (Gallego, Reference Gallego2019).
These findings not only reinforce the concept of regional dialects but also raise questions about how to define dialectal boundaries. Dialects do not conform to national borders, suggesting that regional groupings may be more appropriate than country-based classifications. Given that some Spanish-speaking countries are significantly larger than Spain, substantial internal dialectal variations are to be expected (Orozco, Reference Orozco2018). Future research should explore more fine-grained regional distinctions to improve our understanding of dialect variation.
The primary objective of Experiment 1 was to examine dialectal differences between Spanish from Spain and Latin America and advocate for a more formal classification of these dialects. Our findings reveal substantial discrepancies in vocabulary and word frequency, with the most pronounced divergence between the Spanish spoken in Spain and that spoken in Latin America. These results align with previous corpus-based studies that consistently report systematic lexical and phonetic divergences between Peninsular and Latin American Spanish (Eddington, Reference Eddington2021; Lipski, Reference Lipski, Boberg, Nerbonne and Watt2017).
Furthermore, the findings provide strong motivation for expanding surveys to estimate word frequencies in specific dialects in greater detail. Future work should explore spoken language data, which may further elucidate dialectal divergence beyond written word frequencies (González & Barrios, Reference González and Barrios2023). The observed correlations and regional divisions suggest that linguistic models and frequency databases should incorporate dialect-specific frequency norms to improve their accuracy and applicability to real-world language use.
The findings lead us to conclude that there are substantial dialectal differences between Spanish spoken in distinct Hispanoamerican countries, in particular between countries in the north versus the south of Latin America. This geographic distinction provides a strong motivation for a more extensive survey to estimate word frequencies in specific dialects in greater detail.
3. Experiment 2: Extended survey of Chilean words
Building on the insights gained from our survey of Spanish dialects (Experiment 1), we turned our attention to the Chilean dialect. Notable for its unique vocabulary and reputation as one of the more challenging dialects for speakers of other Spanish variants to understand (Vivanco Rojas, Reference Vivanco Rojas2018), Chilean Spanish serves as a compelling focus for further investigation. This phase of the study was conducted in collaboration with the Millennium Nucleus for the Science of Learning in Talca, Chile.
Experiment 1 demonstrated the validity of using surveys as a general measure of word frequency. Accordingly, Experiment 2 employed an updated version of the previous survey, tailored specifically to Chilean participants. Given the presence of a substantial overlap in word materials (discussed later), we anticipated a strong correlation between the newly collected Chilean ratings and those obtained in Experiment 1. Furthermore, Chilean ratings were also compared with ratings from other Spanish-speaking countries, namely Argentina, Mexico, and Spain. Based on lexical and cultural proximities, we predicted the highest correlation to be with ratings from Argentina (.8–.9), followed by Mexico (.7–.8), and finally Spain (below .5). Categorizing the presented word materials into several groups based on their Chilean usage contexts relative to other countries, provided further insight into the size and nature of the differences between Chilean and other Spanish dialects. Although Spanish dialectal variation cannot be reduced to a simple north–south geographical division, the clustering observed here reflects an empirical pattern emerging from our dataset rather than a general claim about Spanish lexical isoglosses.
A major aim of Experiment 2 was to obtain subjective frequency data that can be compared with human lexical decision responses to be collected in Experiment 3 and computational model data simulated in Experiment 4. The obtained survey data allowed us to assess whether word frequencies derived from subjective ratings, focused on the Chilean dialect, can outperform SPALEX and SUBTLEX-ESP databases in experiments and simulations of human word processing. Due to the presence of different types of items in the survey, it provided critical data for evaluating the utility of subjective word ratings in capturing dialect-specific lexical nuances.
3.1. Method
The stimulus list for this survey was an extended version of the previous list, now including more words typically used in Chile. The total number of words increased from 80 to 153, divided into five categories: (a) General – common words in almost all Spanish dialects; (b) Spain – typical words from Spain; (c) Chile – typical words from Chile; (d) Latin America – words used in other countries of Latin America but not in Chile; and (e) Meaning – words with clearly different meanings in different countries. This categorization was designed to create usage-based lexical groupings that would differ in regional association and frequency, rather than representing strict geographical boundaries. It was expected that Chilean participants would react differently to each category, with higher mean word ratings anticipated for categories General and Chile than for Spain, Latin America, and Meaning. Participants were not informed about the word categories to avoid bias.
To avoid suggesting categorical dialect boundaries, we note that Spanish lexical isoglosses form overlapping continua rather than discrete regions. Consequently, some items classified as “Chile,” “Spain,” or “Latin America” may also occur outside their dominant region. Such cross-regional distributions are inherent to Spanish lexical variation and were therefore not treated as errors, but as part of the empirical phenomenon under study. Because this overlap introduces variability rather than artificial structure, any observed category differences are likely to be conservative rather than inflated.
Stimulus selection was conducted in two stages. First, candidate items were identified using available lexical resources and Chilean/Spanish frequency lists, focusing on words for which there was prior indication of either (a) relative stability across dialects or (b) cross-dialectal variation in usage or association. Second, these candidates were structured so that approximately half of the list consisted of words predicted to vary in regional frequency or usage (Spain, Chile, and Latin America categories), and half consisted of words predicted to be stable across dialects (General category), with an additional set targeting semantic variation (Meaning category). This two-stage selection process ensured that the stimulus set included both frequency-stable and frequency-variable lexical items, allowing direct comparison of their effects within the same participant sample. Items with rare, technical, or highly ambiguous orthography were excluded. Throughout this article, the term “Latin America” is used as a heuristic label referring to non-Peninsular Spanish usage patterns and does not imply homogeneity across Latin American varieties.
A total of 37 participants took part in the survey, each presented with the same 153 words. The survey, conducted digitally through Google Forms, began with background questions followed by the rating of each word in random order. The mean age of the participants was 22.13, ranging from 18 to 31. Of the participants, 67% were female, 30% male, and 3% preferred not to specify. All participants were from Chile and had Spanish as their first language, with 49% also speaking English and 42% not speaking any other language. All participants were either university graduates or current students. These participants also took part in the RT study reported in Experiment 3, which ensured consistency across subjective ratings and behavioral data.
3.2. Results
After all surveys were completed, the participants’ subjective ratings were averaged. As in the previous survey, submissions were checked for odd response patterns, such as only using scores of 1 or 5 or recurring patterns. None of these issues were observed among the 37 participants, allowing all data to be included in further analyses.
Next, including only words present in both lists, our new Chilean word ratings were correlated with the previously collected ratings, serving as a validation step to verify consistency. Because the two sets of ratings were based on different participants, some rating differences might be expected. We expected the highest correlation with previous Chilean results. Furthermore, in the original survey, Argentina’s dialect was grouped with Chile, while Mexico’s was in a different Latin American group, and Spain’s was most different from Latin American dialects. We therefore expected lower correlations of the new results from Chile with other Latin American countries, and a minimal correlation with Spain.
The resulting scatterplots are shown in Figure 3. The pattern of correlations supports our hypotheses, as all correlations except for Spain are significant at p < .0001. For Spain, no significant correlation was obtained.

Figure 3. Scatterplots of current Chilean word ratings versus previous ratings (freq_survey) from (a) Chile (r = .95), (b) Argentina (r = .86), (c) Mexico (r = .70), and (d) Spain (r = .14).
We also computed the correlation between the survey ratings and actual word frequencies from SPALEX and SUBTLEX-ESP using log frequencies. This analysis aimed to identify which database our ratings resembled most closely, with an expectation for SUBTLEX-ESP based on literature. This information is crucial for the simulation study (Experiment 4). In Figure 4a, b, SUBTLEX-ESP scores higher with a correlation of .70 compared with SPALEX’s .55. SUBTLEX-ESP aligns better with these word ratings, consistent with earlier findings. This is in line with our hypothesis, and SUBTLEX-ESP word frequencies will be used as the basis for the simulation study presented later.

Figure 4. Scatterplots of Chilean survey word ratings versus log word frequencies from (a) SPALEX (r = .55) and (b) SUBTLEX-ESP (r = .70) and of lexical decision reaction times (rt_LD) versus log word frequencies from (c) SPALEX (r = −.54) and (d) SUBTLEX-ESP (r = −.69). All significances at p < .0001.
3.3. Discussion
In this experiment, we examined how Chilean participants rated Spanish words across various categories. We hypothesized that the new survey results would show a strong correlation with previous Chilean ratings, a slightly lower correlation with Argentinian ratings, a moderate correlation with Mexican ratings, and a very low correlation with Spanish ratings.
The results aligned with our expectations. Correlation analysis between the new ratings and those from the original survey revealed a very high correlation of .95 (p < .0001) with previous Chilean ratings, indicating high consistency despite individual differences. The correlation with Argentinian ratings was also strong (.86, p < .0001), reflecting the close lexical relationship between Chilean and Argentinian Spanish (Lipski, Reference Lipski, Boberg, Nerbonne and Watt2017). The Mexican ratings showed a moderate correlation of .70, likely due to shared Latin American vocabulary (Gallego, Reference Gallego2019). Finally, Spanish ratings had a negligible correlation of .14, underscoring the substantial differences between Chilean and European Spanish (Orozco, Reference Orozco2018).
The participant sample in this survey primarily consisted of individuals from a similar age group and region in Chile, potentially limiting the generalizability of findings to older populations or other areas of the country. However, comparisons with a previous dataset, which included greater age and geographic diversity, revealed that intracountry variation was minimal compared with intercountry differences (Eddington, Reference Eddington2021). This suggests that regional lexical variation within Chile is substantially smaller than variation between Chile and other Spanish-speaking countries.
The newly added Chilean-specific words were excluded from the correlation calculations but remain integral to the subsequent phases of this study. These words will be particularly relevant in Experiments 3 and 4, which focus on lexical decision tasks and computational modeling.
Mean ratings per category revealed clear patterns. Participants demonstrated greater familiarity with words from the General and Chilean categories, reflecting widespread usage across Spanish-speaking populations and strong regional representation (González & Barrios, Reference González and Barrios2023). Words from Spain and other Latin American countries received lower familiarity ratings, further validating regional lexical divergence (Sadowsky & Martínez-Gamboa, Reference Sadowsky and Martínez-Gamboa2012). Words with different meanings across dialects exhibited high variance, reinforcing the need for further linguistic distinction (Lipski, Reference Lipski, Hualde, Olarrea and O’Rourke2012). These results provide converging evidence that subjective familiarity ratings capture meaningful lexical-distributional differences across dialects.
A key limitation of this classification scheme is that Spanish lexical variation does not form discrete blocks, but rather overlapping continua shaped by historical, sociolinguistic, and media-related influences. Several words classified as “Chile,” “Spain,” or “Latin America” may therefore also be known or used outside their dominant region. Importantly, such overlap introduces noise rather than artificial structure and thus would be expected to attenuate rather than exaggerate category contrasts. Consequently, the differences observed in the present study are likely to be conservative estimates of true regional lexical divergence.
Although the number of words per category varied, this distribution mirrors natural lexical usage patterns across Spanish dialects. This enhances the representativeness of our dataset for future linguistic research. Despite category size differences, the results consistently highlight the distinctiveness of the Chilean dialect and its divergence from other Spanish variants (Rogers & Face, Reference Rogers and Face2024). Future studies should test whether these patterns generalize to spoken language processing and whether continuous measures of dialectal lexical probability may offer an even more precise framework than discrete category labels.
4. Experiment 3: Lexical decision study
In our surveys, we explored how word frequencies and word ratings can measure an individual’s familiarity with a word. Reaction times (RTs) provide a more direct and objective measure of word use in a lexical decision experiment. The speed and accuracy of a lexical decision reflect how well a word is represented in the participant’s mental lexicon and how fast it can be retrieved from there.
In Experiment 3, we examined whether the subjective word ratings obtained in the surveys align with reaction time (RT) patterns in a lexical decision task. A participant’s reaction times for the same word set will differ between Spanish dialects, as word usage frequency varies across dialects. To obtain accurate behavioral measures of word retrieval, we collected RT data for 153 words included in the extended survey from the same group of Chilean participants (see the Appendix for stimulus materials). These RT data will also serve later as a comparison measure to validate predictions from simulations that mimic the human word retrieval process in detail. Such predictions are generated by the Multilink+ model, detailed in Experiment 4.
We hypothesized that Chilean RTs would differ significantly from SPALEX RTs, reflecting dialect-specific variations in word use. This hypothesis was tested by correlating RTs from the two sources. If they are highly correlated, Chilean Spanish may not differ much from other Spanish variants.
Two primary analyses of RTs were conducted. The first examined the entire dataset, comparing RTs to various word metrics collected previously. Additionally, survey word ratings were correlated with RTs to evaluate their predictive value. The second analysis explored the influence of word categories (General, Spain, Chile, and Latin America) on predictive accuracy. We anticipated faster and more accurate responses for words in the General and Chile categories compared with those in the Spain and Latin America categories.
Finally, because words with different meanings across Spanish-speaking countries could confound results, they were excluded from the analysis. Detailed information on word characteristics for the various categories can be found in the Supplementary Material.
4.1. Method
Participants were the same 37 undergraduate students who participated in Experiment 2. Stimuli included 153 words from Experiment 2, categorized based on regional usage: (1) General (n = 58; e.g., casa, “house,” common across dialects); (2) Spain (n = 18; e.g., coche, “car,” predominant in Peninsular Spanish); (3) Chile (n = 41; e.g., cabritas, “popcorn,” Chilean-specific); (4) Latin America (n = 28; e.g., crispetas, “popcorn,” used elsewhere in Latin America); and (5) Meaning (n = 8; excluded in analyses to avoid semantic confounds, e.g., carro, “car” or “cart,” varying by dialect). Categories were informed by dialectal corpora (Eddington, Reference Eddington2021; Lipski, Reference Lipski, Boberg, Nerbonne and Watt2017) and validated by native Chilean linguists to mitigate biases in perceived exclusivity (Quesada Pacheco, Reference Quesada Pacheco2014). Words were controlled for length (M = 6.4 letters, SD = 1.7) and OLD20 neighborhood density (M = 1.8, SD = 0.5; Duchon et al., Reference Duchon, Perea, Sebastián-Gallés, Martí and Carreiras2013). Nonwords (n = 153) were generated via Wuggy (Keuleers & Brysbaert, Reference Keuleers and Brysbaert2010), matched for length and Spanish phonotactics, with Levenshtein distances >2 from real words to ensure discriminability. All words and nonwords can be found in the Appendix.
During the task, letter strings were shown in black Courier New 18-point font on a white background, with presentation controlled by PsychoPy 2022.1.0 (Peirce, Reference Peirce2007). Each trial began with a 500-ms fixation cross, followed by a 400-ms blank screen, then a letter string presented for 2 s or until a response was made. Participants were instructed to respond quickly and accurately as they could by pressing a “yes” or a “no” button key if a presented item was an existing Spanish word or a nonword letter string, respectively. They completed 10 practice trials before the experiment, and reaction time was recorded in milliseconds. Including instructions, each session took no longer than 25 min.
4.2. Results
The data underwent a detailed cleaning procedure, beginning with the removal of responses to nonwords and the exclusion of four participants who did not adhere to the instructions. These participants either used the wrong input method or mixed up the keys throughout the experiment. Outlier identification led to the exclusion of one additional participant who had a mean reaction time significantly higher than 2.5 SDs above group average. This left data from 32 participants for further analysis. The dataset was then checked for outliers in both accuracy and reaction time, with problematic items and individual responses being removed.
In the following comparisons, the cleaned data were analyzed overall and per category. The first comparison involved word frequencies from SPALEX and SUBTLEX-ESP to determine which better predicts the RT data. To do this, lexical decision reaction times were correlated with word frequencies from both databases. Based on our previous findings and analysis, SUBTLEX-ESP was expected to show a higher correlation than SPALEX. As shown in Figure 4c, d the findings were in line with this expectation: SUBTLEX-ESP scores a correlation of −.69 compared with SPALEX’s −.54. Both correlations are negative, as expected in RT and word frequency comparisons (higher RTs correlate with lower frequencies). Note that in this analysis, log frequencies were used.
Next, correlation scores were calculated between the SPALEX RTs and the RTs obtained in this experiment, as well as between word ratings and the new RTs. These correlations provided further insights into the RT patterns. The correlation between SPALEX RTs and the new RTs was expected to be below .75, given the significant differences between the sources of these two sets. The correlation between word ratings and the new RTs was expected to be high, over .70, indicating that it might outperform word frequencies from SPALEX and SUBTLEX-ESP. Note that all analyses mentioned so far were conducted on the entire cleaned dataset. The following two plots in Figure 5a, b display the correlations between SPALEX RTs and new RTs and between word ratings and new RTs. All mentioned correlations are statistically significant at p < .005.

Figure 5. Scatterplots of lexical decision reaction times (LD RTs) versus (a) SPALEX RTs (r = .62), (b) survey word ratings (r = −.75), (c) cycle times from combined converted frequencies (r = .84), and (d) SUBTLEX-ESP frequencies (r = .73). All significances at p < .0001.
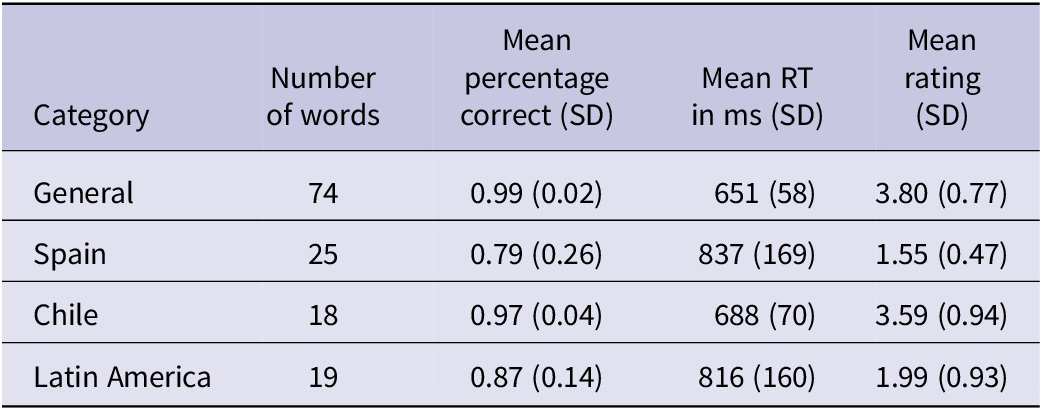
The total error rate over all words, before removing errors, was 6.8 %. The resulting mean RT over all words, after cleaning, was 713 ms with an SD of 133 ms. This leads to a 95% confidence interval for the mean RT of [690.31–735.69]. The mean subjective frequency was 3.12. The nonwords had a mean RT of 919 ms and an error rate of 0.18. Table 4 shows the most important statistics calculated over the identified categories mentioned before. These will be relevant for Experiment 4.
Table 4. Summary statistics for all word categories in Experiment 3 (lexical decision)

Note: Standard deviations (SDs) are given in parentheses.
4.3. Discussion
Our lexical decision study tested two primary hypotheses. First, we expected SUBTLEX-ESP word frequencies to better predict the newly obtained reaction times than those of SPALEX. Second, we expected the new Chilean RTs to differ significantly from SPALEX RTs.
Our results were in line with the first hypothesis: Scatter plots indicated that Chilean RTs correlate more strongly with SUBTLEX-ESP than with SPALEX log word frequencies. Although both datasets contained outliers, SPALEX displayed more variance and a larger number of extreme values, reinforcing the conclusion that SUBTLEX-ESP is a more reliable predictor of Chilean RTs (Cuetos et al., Reference Cuetos, González-Nosti, Barbón and Brysbaert2011).
Regarding the second hypothesis, Chilean RTs showed a correlation of only .62 with SPALEX RTs. This relatively modest correlation for “the same words in the same language” underscores the necessity of region-specific Spanish lexical decision RTs, further supporting the distinctiveness of Spanish dialects (Aguasvivas et al., Reference Aguasvivas, Carreiras, Brysbaert, Mandera, Keuleers and Duñabeitia2018).
Interestingly, subjective word ratings demonstrated an even stronger correlation with RTs than either SPALEX or SUBTLEX-ESP word frequencies. This suggests that subjective ratings provide a highly reliable estimate of lexical accessibility, likely because both measures were obtained from the same participant group, thus capturing properties of their mental lexicon (Balota et al., Reference Balota, Pilotti and Cortese2001).
Category-specific analyses further supported these conclusions. General and Chilean words exhibited higher accuracy (0.99 and 0.97), lower mean RTs (651 and 688 ms), and higher mean ratings (3.80 and 3.59). In contrast, Spanish and Latin American words excluding Chile showed lower accuracy (0.79 and 0.87), higher mean RTs (837 and 816 ms), and lower mean ratings (1.55 and 1.99), consistent with participants’ relative unfamiliarity with these words (Eddington, Reference Eddington2021).
These differences were statistically significant (p < .005), despite variations in word count across categories. The observed disparities in word distribution reflect natural lexical variations across Spanish dialects. The robustness of these category effects underscores the importance of incorporating region-specific frequency measures in lexical decision studies (Lipski, Reference Lipski, Hualde, Olarrea and O’Rourke2012).
In conclusion, this study highlights the necessity of subjective word ratings and region-specific RT norms in psycholinguistic research. Experiment 4 will further evaluate the predictive value of these measures with respect to human language processing through a computational simulation using the Multilink+ model.
5. Experiment 4: Simulation study
The frequency counts in databases like SUBTLEX-ESP and the subjective ratings collected in Experiments 1 and 2 reflect the frequency of word use in a larger population and a specific group of language users, respectively. A reaction time, such as that collected in Experiment 3, can be seen as the frequency-sensitive duration of the psychological processes of word retrieval and identification (Thul et al., Reference Thul, March, Dijkstra and Conklin2024). These processes are themselves characterized and implemented by the computational Multilink+ model. Going beyond a verbal account, its computations not only allow a qualitative but also a quantitative test of the assumptions expressed in the underlying psycholinguistic theory. This theory defines various lexical representations and processes in multilinguals, how processing is adapted to the task at hand, and what temporal patterns will result for different conditions. The cycle times that Multilink+ produces for different types of words reflect the constraints proposed by the underlying theory. The extent to which the complex interwoven series of constraints assumed in the model is similar to those in human word recognition is reflected in the correlations between model cycle times and empirical RTs. Correlations will be high when the model follows correctly and precisely, step-by-step, the human multistage word recognition process.
However, every model, including Multilink+, by necessity represents a simplified version of the subdomain it simulates. Non-implemented processes will lead to differences between simulation and empirical results. In human lexical decision, reaction times are influenced not only by lexical and sublexical processing but also by a range of additional factors such as attentional fluctuations (e.g., due to fatigue), individual response criteria, and meta-judgments. As a consequence, perfect correlations between simulation and empirical results cannot be reached. In light of this observation, the high correlations that Multilink+ generally produces (see Dijkstra et al., Reference Dijkstra, Wahl, Buytenhuijs, Halem, Al-Jibouri, de Korte and Rekké2019, Reference Dijkstra, Peeters, Hieselaar and van Geffen2023) are impressive. They indicate that Multilink+ does an excellent job in capturing key aspects of human word recognition. As such, it is a useful tool to test predictions about how different variants of Spanish are processed. In the present paper, the model tests the hypothesis that various types of Spanish words are used more frequently or less frequently depending on item type and the variant of Spanish that is considered, with RT-patterns for item types reflecting such variant-dependent processing.
To test our hypotheses about how Spanish word recognition would be sensitive to dialectal differences, we conducted simulation Experiment 4. Various simulations were performed, involving the use of lexicon files with SPALEX frequencies, SUBTLEX-ESP frequencies, and word frequencies derived from word ratings. To assess whether word ratings outperform existing database frequencies, we compared Multilink+’s cycle times in all cases to the reaction times, expecting the rating-based frequencies to significantly outperform both SUBTLEX-ESP and SPALEX.
As specified below, the word ratings from the extended survey were converted into frequencies to simulate and predict RT patterns across different item conditions in line with the research questions from Experiment 1. The conversion is necessary, because the Multilink+ model, just like the corpus data, represents (log) frequency of word use in terms of occurrence counts. However, ratings reflect participants’ perceptions of frequency in a different, nonlinear fashion that is also sensitive to the rating scale used. As a reference basis for the conversion of the subjective ratings collected in the surveys, SUBTLEX-ESP frequencies were used, because they were proven to be more appropriate for Chilean Spanish than SPALEX frequencies.
This analysis was done across all cleaned RT data and within specific item categories. We anticipated that the converted frequencies will be the best predictor overall, especially for words from the categories Chile and Latin America, where differences in reaction times between Chileans and other Latin Americans are likely to be most evident.
5.1. Method
In order to apply subjective word ratings in Multilink+, they must first be converted into word frequencies to match database scales. Three methods to do so were tested.
(1) SD Conversion: Ratings were converted based on their distance from their mean in SD, mapped onto the corresponding SD range of SUBTLEX-ESP frequencies. Simply said, this involved mapping the rating distribution on the frequency distribution by turning the mean rating into a mean frequency, and adapting the SD of ratings to the SD of frequencies. However, this linear mapping approach limited the distribution of the frequencies based on ratings (0.91–258 vs. the usual 0.01–500+) and led to unwanted results for specific words. For instance, argolla had a below-average rating of 2.6, but after conversion received a disproportionately high frequency (8.70 vs. 0.22 in SUBTLEX-ESP).
(2) Factor Method: Ratings were converted by calculating their factor relative to the mean and applying it to the SUBTLEX-ESP log frequency. For example, billete has a mean rating of 4.25 and a SUBTLEX-ESP log frequency of 1.028. With the rating mean at 3.07, the rating of 4.25 is 1.384 times the mean. This factor was multiplied by the log frequency of the word, resulting in a log frequency of 1.423. This nonlinear mapping approach better aligned conversions with original word frequencies but restricted expressiveness: The value multiplied with log frequency could never be higher than 5 (max rating)/3.07 (average rating) = 1.629 times the original rating.
(3) Combined Conversion Method: Frequencies from SD Conversion and Factor Method were averaged, balancing distribution and expressiveness. The stimulus list with newly generated frequencies was added to the existing lexicon file and fed into Multilink+, which generated a cycle time (CT) for each word. Any CT value of 0, indicating that Multilink+ did not recognize the word within the limit of 40 CTs, was replaced with a value of 40. This adjustment is reasonable as such words are likely to have higher RTs, corresponding to higher CTs. Finally, analogous simulations with the same words were performed using their SPALEX and SUBTLEX-ESP frequencies.
5.2. Results
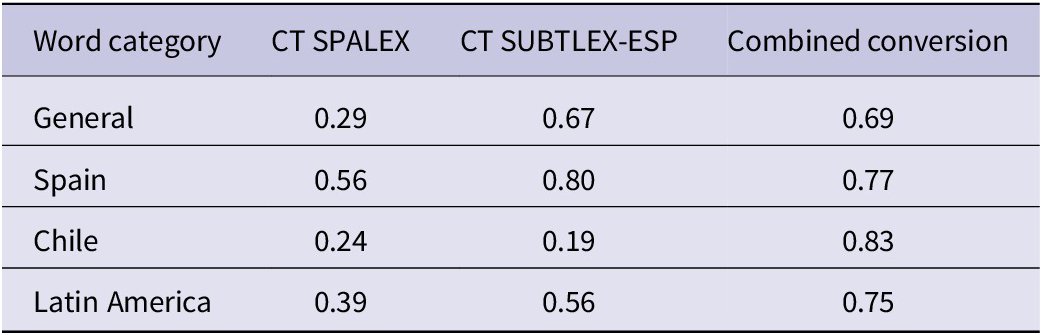
The three resulting lists of cycle times were correlated with the corresponding RTs from the Chilean lexical decision study (Experiment 3). Separate correlations per category were calculated, with Table 5 as a result.
Table 5. Correlations between lexical decision reaction times (RTs) and cycle times (CTs) based on different word frequency sources

5.3. Discussion
In Experiment 4, we used Multilink+ to test predictions for item reaction times based on subjective ratings. We hypothesized that using subjective ratings would outperform frequency measures from SUBTLEX-ESP and SPALEX, in correlations between cycle times (CTs) and RTs, both overall and within specific item categories.
Our results were in line with these hypotheses. Consistent with prior findings, SUBTLEX-ESP outperformed SPALEX as a predictor of RTs for Chilean participants, with correlations of .73 versus .52. When subjective ratings were integrated into Multilink+, the model achieved an even higher correlation of .84, considerably surpassing SUBTLEX-ESP. This pattern confirms that subjective familiarity ratings provide a more dialect-sensitive estimate of lexical accessibility than frequency norms derived primarily from Peninsular Spanish sources (Brysbaert & Cortese, Reference Brysbaert and Cortese2011; Gimenes & New, Reference Gimenes and New2016; Kuperman & Van Dyke, Reference Kuperman and Van Dyke2013).
As emphasized in Experiment 2, Spanish lexical variation does not consist of discrete dialectal blocks but of overlapping continua shaped by historical, sociolinguistic, and media-driven processes. Consequently, some words classified as “Chile,” “Spain,” or “Latin America” may also be known or occasionally used outside their dominant region. This overlap does not undermine the categorization logic, which is based on relative dominance rather than lexical exclusivity. Instead, such cross-regional overlap introduces natural variability that would attenuate, rather than inflate, observed differences. The strong category effects and model–human correlations observed here therefore likely represent conservative estimates of true regional lexical divergence.
We further examined how different frequency measures predicted RTs of Chilean speakers and Multilink+ CTs across item categories. CTs using SPALEX consistently showed weak correlations with RTs, reinforcing that SPALEX is not well suited to predicting Chilean lexical access. This pattern was expected, given that SPALEX primarily reflects Peninsular Spanish input and therefore lacks sensitivity to Latin American lexical distributions (Cuetos et al., Reference Cuetos, González-Nosti, Barbón and Brysbaert2011; Meneses et al., Reference Meneses, Uccelli, Santelices, Ruiz, Acevedo and Figueroa2018)
Considering CTs based on SUBTLEX-ESP and converted subjective frequencies, both performed better than SPALEX. However, for item categories General and Spain, the differences between the two predictors were minimal, whereas Chile and Latin America showed significant discrepancies. This likely reflects the fact that SUBTLEX-ESP aggregates lexical input from multiple Latin American regions, which makes it a reasonably good estimator for words common across dialects, but insufficiently precise for dialect-specific lexical patterns characteristic of Chilean Spanish (Eddington, Reference Eddington2021; Meneses et al., Reference Meneses, Uccelli, Santelices, Ruiz, Acevedo and Figueroa2018).
This distinction became evident when analyzing category-specific correlations. Words common across all Spanish dialects (General) and words from Spain yielded similar correlations between SUBTLEX-ESP and subjective ratings (.67 vs. .69 and .80 vs. .77, respectively). However, significant differences arose between words from Chile and from other countries in Latin America. The correlation for Chilean words was significantly higher when using subjective ratings (.83 vs. .19), while Latin American words not used in Chile correlated better with SUBTLEX-ESP than subjective ratings (0.75 vs. 0.56). These differences were statistically significant at p < .01. This divergence demonstrates that the predictive accuracy of frequency measures depends heavily on whether their underlying corpora capture the relevant dialectal distribution for the target population.
Overall, simulated word frequencies based on subjective ratings captured human lexical retrieval dynamics, as expressed by Multilink+, more effectively than existing databases. These findings underscore the limitations of using a single, pan-dialectal frequency measure to represent a language spoken across diverse regions. Unlike SPALEX and SUBTLEX-ESP, subjective ratings provide a more accurate representation of lexical access in dialect-specific speakers frequencies (Brysbaert & Cortese, Reference Brysbaert and Cortese2011; Gimenes & New, Reference Gimenes and New2016; Kuperman & Van Dyke, Reference Kuperman and Van Dyke2013), reinforcing the importance of regionalized linguistic resources for psycholinguistic research (González & Barrios, Reference González and Barrios2023). Future studies should investigate how additional linguistic variables, such as phonological neighborhood density, semantic richness, contextual usage patterns, and continuous measures of dialectal lexical probability, can be integrated into computational models to further refine predictions of region-specific lexical access.
6. General discussion
This study examined the variation among Spanish dialects and evaluated the efficacy of subjective word ratings as an alternative to conventional word frequency databases. Across four experiments, our findings underscore that Spanish is far from uniform; instead, dialectal variation exerts systematic and measurable effects on lexical processing and computational modeling.
In Experiment 1, we documented substantial vocabulary differences among Spanish dialects, with interdialect correlations as low as .13. These differences were strongly mediated by geographic location. While some dialects showed a closer alignment with SPALEX frequency data, others were better predicted by SUBTLEX-ESP. This dissociation likely reflects differences in corpus composition and participant demographics, highlighting that frequency norms inherit the regional biases of their underlying data sources (Aguasvivas et al., Reference Aguasvivas, Carreiras, Brysbaert, Mandera, Keuleers and Duñabeitia2018; Cuetos et al., Reference Cuetos, González-Nosti, Barbón and Brysbaert2011).
Experiment 2 expanded our focus on Chile by augmenting the stimulus list and categorizing words into four groups: General, Spain, Chile, and Latin America. The new ratings exhibited an exceptionally high correlation with the Chilean ratings from Experiment 1 (r = .95), underscoring their reliability. Moreover, the Chilean ratings corresponded more closely with SUBTLEX-ESP than with SPALEX, affirming SUBTLEX-ESP’s greater relevance for Latin American dialects (Eddington, Reference Eddington2021). The highest familiarity ratings for General and Chilean words further indicate that lexical accessibility is shaped by both pan-dialectal familiarity and local usage, supporting the need for dialect-sensitive frequency norms (Brysbaert & Cortese, Reference Brysbaert and Cortese2011; Gimenes & New, Reference Gimenes and New2016; Kuperman & Van Dyke, Reference Kuperman and Van Dyke2013).
Experiment 3 provided further insights by demonstrating that subjective ratings were superior predictors of Chilean lexical decision times compared with both SPALEX and SUBTLEX-ESP. Words in the General and Chile categories were recognized more quickly and accurately, highlighting the pivotal role of dialect familiarity and contextualized lexical experience in word recognition (Balota et al., Reference Balota, Pilotti and Cortese2001).
Building on these findings, Experiment 4 employed the Multilink+ model to simulate lexical retrieval using subjective ratings. The model achieved a strong correlation with observed RTs (r = .84), outperforming simulations based on SUBTLEX-ESP frequencies (r = .73). This convergence between behavioral and computational evidence demonstrates that subjective ratings capture dialectal nuances that objective corpora often underrepresent, strengthening the case for integrating dialect-specific information into computational models of word recognition (Gimenes & New, Reference Gimenes and New2016).
6.1. Implications for linguistic research
Our findings challenge the prevailing assumption that Spanish can be treated as a monolithic language in linguistic research. Even modest lexical differences between dialects produce measurable shifts in familiarity ratings, reaction times, and computational cycle times, revealing a level of variation with major implications for psycholinguistic modeling. For instance, although Argentina and Uruguay exhibit high lexical similarity, considerable variation is evident when considering the broader Spanish-speaking world (Lipski, Reference Lipski, Boberg, Nerbonne and Watt2017). Given the magnitude of Spanish’s global population, treating it as a uniform linguistic system risks masking genuine cross-regional differences that are relevant to both theory and practice.
The superior performance of Chilean-tuned frequencies in our simulations highlights the importance of developing region-specific linguistic resources. Future studies should replicate Experiments 3 and 4 in other Latin American regions to test whether subjective ratings outperform corpus-based frequencies across dialects and whether dialect regions differ in the degree to which corpora represent their lexical environments (Orozco, Reference Orozco2018). Similarly, applying this approach to other languages with significant dialectal variation, such as French, could yield valuable insights.
6.2. Practical applications
Tailored word frequency databases that reflect specific dialects and regions have wide-ranging practical applications. They can enhance the validity of psycholinguistic stimulus selection, improve natural language processing tools such as speech recognition, predictive text, and machine translation, and support lexicographic and pedagogical efforts. Moreover, subjective ratings offer a viable method for capturing the nuances of real-world language use, especially in scenarios where traditional frequency databases fall short in accounting for regional variation (Thul et al., Reference Thul, March, Dijkstra and Conklin2024). This is particularly relevant in languages where corpora are composed disproportionately of media or formal registers that do not reflect everyday lexical experience.
From an educational standpoint, acknowledging and incorporating dialectal diversity has profound implications. Language instruction tailored to local dialects may improve comprehension, reduce cognitive load, and support more realistic expectations of learner vocabulary. This dialect-sensitive approach might also facilitate the teaching of foreign languages, such as English, by drawing informative parallels between dialect-specific structures and second-language grammar (cf. Wheeler & Swords, Reference Wheeler and Swords2006).
Furthermore, developing dedicated dialect databases can illuminate cultural distinctions within Latin America. Regional terms – for example, crispetas in Colombia and pochoclo in Argentina for “popcorn” – reflect unique cultural identities. Similarly, the tendency among Chileans to refer to their language as Chileno rather than Español underscores the deep connection between dialect and national identity (Sadowsky & Martínez-Gamboa, Reference Sadowsky and Martínez-Gamboa2012).
7. Conclusion
In conclusion, our study demonstrates that treating Spanish as a homogeneous entity obscures significant dialectal differences with both theoretical and practical ramifications. Subjective word ratings provide a powerful, cost-effective tool for developing dialect-specific frequency norms and yield more accurate predictions of lexical processing than existing databases for millions of speakers. For over 500 million native Spanish speakers, and millions of language learners, embracing dialectal diversity is not merely descriptive but also essential. Integrating regional variation into linguistic research, computational models, and educational practice enriches scientific understanding and reflects the lived linguistic reality of Spanish-speaking communities worldwide.
Supplementary material
The supplementary material for this article can be found at http://doi.org/10.1017/S1366728925100941.
Data availability statement
Data and materials for the project are openly available at http://doi.org/10.1017/S1366728925100941.
Funding statement
This work was supported by Agencia Nacional de Investigación y Desarrollo (ANID), Chile (Millennium Science Initiative Program – NCS2022_026). It did not receive any specific grant from funding agencies in the public, commercial, or not-for-profit sectors. Open access funding provided by Radboud University Nijmegen.
Ethical standard
This study received ethical approval from the Ethics Committee at Universidad Católica del Maule, Chile. All procedures contributing to this work comply with the ethical standards of the relevant national and institutional committees on human experimentation and with the Helsinki Declaration of 1975, as revised in 2008.
Competing interests
The authors declare none.
Appendix: Stimulus materials for Experiment 3 (lexical decision)
Words


 Open access