

Introduction
Part of the contemporary backlash against established elites, parties and institutions – including retreat from the democratic institutions themselves – may be provoked by a common view that nominally representative political institutions have not in practice been very responsive to large parts of the public. The intuition is that parties and governments have pushed unpopular policies down the throats of citizens, while accommodating the demands of the rich. A substantial body of research empirically assessing substantive representation – the degree to which a political system takes positions and enacts policies that reflect the preferences of the governed – has found systematic patterns of representation that bear‐out such intuition. Studies focused mainly on the US context (Bartels, Reference Bartels2016; Gilens, Reference Gilens2012), but also some studies focused on or comparing other political settings (Elsässer et al., Reference Elsässer, Hense and Schäfer2020; Peters & Ensink, Reference Peters and Ensink2015), have found strong signs of unequal representation: the expressed policy preferences of richer voters tend to get mirrored in actual policy changes, while the preferences of poorer voters tend not to show up in policy changes.
Such portraits of unequal substantive representation, however, are incomplete in terms of both their breadth and depth, in ways that leave ambiguous the extent of the representation problem and mechanisms underlying it. In terms of breadth, the studies remain modest in terms of the cross‐country and over‐time exploration of substantive representation – with the few studies providing meaningful comparison across national settings focused on particular, limited policy areas (Peters & Ensink, Reference Peters and Ensink2015; Schakel et al., Reference Schakel, Burgoon and Hakhverdian2020). This makes it unclear whether the unequal responsiveness that was revealed in the few countries studied in multi‐issue terms, such as the United States, applies to a broader palette of institutional settings providing in principle stronger footholds for more equal representation of the poor, for a range of political issues.
In terms of depth, the focus on correlational links between policy changes and policy preferences leaves unclear what the basis of unequal responsiveness might be. The candidate mechanisms are many, including party‐political representation of the wealthy rather than the poor (Bartels, Reference Bartels2016), or interest‐group lobbying and money‐in‐politics by and for the wealthy, not the poor (Gilens, Reference Gilens2012). Systematic exploration of any of these possibilities has been thin, however, particularly in cross‐country and over‐time settings, making it unclear what the basis of the responsiveness problem is and hence where to potentially focus one's energies to work towards more equal representation.
This paper is an attempt to provide a broadening and deepening of our understanding of substantive representation by exploring the extent to which political preferences of rich and poor voters are reflected in subsequent party platforms on various policy areas in a wide range of democracies. Given the nominal role of political parties in promoting political representation in most democracies, exploring responsiveness in party positioning should clarify the links between opinion and policy outputs – and is an obvious place to nurture substantive representation.
Focused on links between party positioning and public attitudes, the paper develops several hypotheses. First, and most broadly, we hypothesise that the instrumental and structural privileges that wealthier voters command in a polity should lead to a pattern where parties on average respond more to the wants of wealthier than of poorer voters. Second, we expect that left‐oriented parties will more strongly take up or mirror the wants of poorer than of richer voters, whereas right‐oriented parties can be expected to more strongly champion the wants of richer than poorer voters. Even if differences in party families do not manifest themselves in such strong contrasts, we expect that any privileged representation of richer voters (poorer voters) should be more modest (stronger) among left than among right parties.
We test these expectations by matching data on individual‐level public opinion to country‐year data on party platforms. The former is measured using multiple waves of the International Social Survey Program (ISSP), Comparative Study of Electoral Systems (CSES) and AsiaBarometer Survey (ABS); for the latter, we use the Manifesto Project Database (MPD). The resulting dataset covers a substantial period of time, 1985–2017, in a substantial swath of 39 countries – a larger empirical sample than virtually all studies of unequal representation (cf. Lupu & Warner, Reference Lupu and Warner2020).
This investigation provides substantial empirical support for both sets of expectations. We find that the average weight of public opinion tends to be taken up or at least mirrored in the electoral positions of parties, averaged across parties and issues. We also find, however, that party systems mirror or take up the preferences of wealthier respondents more than those of poorer respondents. Focusing on patterns across party families, we find clear differences in responsiveness of left‐wing parties compared to right‐wing parties. Both left‐ and right‐wing parties appear to respond or mirror more closely the preferences of wealthier than poorer respondents. But left‐wing parties more closely mirror the preferences of poorer respondents, and less closely mirror preferences of richer respondents, than do their right‐wing counterparts. Finally, we show that party positions predict policy changes, based on a systematic comparison of substantive changes in the welfare state, suggesting that the unequal responsiveness of party platforms matters for downstream policy representation.
These findings are consistent with various micro‐level processes that plausibly produce unequal representation. They are consistent with purely ‘supply‐side’ mechanisms, such as biases in descriptive representation or interest group mobilisation that colour the policy appeals parties make. But our findings could also be explained by differences in electoral participation between rich and poor citizens that would influence which positions gain footholds during elections. Regardless of such differences, we show that the platforms with which parties enter parliament are biased towards a minority of the electorate. Hence, even if representation in the next stages of the policy process – from pledges to policy changes – is perfect, this results in unequal policy responsiveness. Altogether, then, this study provides important evidence that there is a navigable party road to substantive representation, but that road has fast and (very) slow lanes for wealthier and poorer citizens, respectively.
Theory and hypotheses
Scholars and commentators of contemporary democracy have been carefully studying and debating substantive representation, the extent to which policymaking and governance in nominally democratic polities are in practice responsive to the political demands of the governed. One hotly debated question is whether income inequalities translate into political inequalities. A long tradition of left‐wing critiques of pluralism has explored the extent to which income and wealth confer political privilege (Mills, Reference Mills1956; Domhoff, Reference Domhoff1978). This tradition has recently been revived in empirical scholarship focused on the United States, uncovering income biases in many policy outcomes on the national level (Gilens, Reference Gilens2012) and state level (Rigby & Wright, Reference Rigby, Wright, Enns and Wlezien2011), and in roll‐call votes in the Senate (Bartels, Reference Bartels2016) and House of Representatives (Ellis, Reference Ellis2013). There the rich get their way more than do poor or middle‐class citizens in many policy areas, at least where poor and rich citizens are divided in their attitudes. While this finding has been challenged by some studies suggesting more pluralist politics (e.g., Enns, Reference Enns2015; Branham et al., Reference Branham, Soroka and Wlezien2017), the evidence for unequal representation in the United States is strong and mounting.
Yet, many important questions about substantive representation remain unanswered. We know little about the generalisability of the dominant finding based on patterns in the United States to other polities, and about the causal mechanisms that underlie unequal representation. In other words, the current literature is limited in breadth and depth. In terms of breadth, some empirical studies explore political inequality outside of the United States, for instance, focusing on Germany (Elsässer et al., Reference Elsässer, Hense and Schäfer2020), the Netherlands (Schakel, Reference Schakel2021), Switzerland (Rosset, Reference Rosset2013) or on cross‐country patterns (Peters & Ensink, Reference Peters and Ensink2015; Schakel et al., Reference Schakel, Burgoon and Hakhverdian2020). However, an important limitation of these studies remains their modest empirical breadth: some studies analyse many policy areas within one country, while others analyse one policy area in many countries. These hamper the external validity of claims, but also constrain internal validity by limiting the ability to address confounding factors and boundary conditions relevant to claims. A better empirical basis for inferences about unequal representation is more breadth: analyses covering many policy areas and many country‐years, improving the validity of claims about how public attitudes link‐up to political representation.
Existing studies also have important limitations in terms of depth. The focus on correlational links between political outcomes and policy preferences leaves theoretically and empirically ambiguous what the basis of unequal substantive representation might actually be. The candidate mechanisms are many, including skews in political participation (Erikson, Reference Erikson2015), unequal access to mass media (Winters & Page, Reference Winters and Page2009) and structural power over investment decisions that favour the wealthy (Lindblom, Reference Lindblom1982). The few studies to have explored mechanisms have posited and found evidence for party‐political representation of the wealthy rather than poor (Bartels, Reference Bartels2016), descriptive representation (Butler, Reference Butler2014; Carnes, Reference Carnes2013) and interest‐group lobbying and money‐in‐politics that take place by and for richer citizens (Hacker & Pierson, Reference Hacker and Pierson2010). These studies, however, have focused on US experience (cf. Schakel, Reference Schakel2021), while cross‐national studies of substantive representation give little systematic attention to possible mechanisms. This lack of depth with respect to identifying and empirically exploring mechanisms obscures the basis of a given responsiveness problem.
Parallel to the literature on unequal representation is a substantial body of research on party responsiveness. The latter has explored many important questions, key among which is whether parties in the aggregate respond to citizens’ policy preferences and priorities. Here, many studies have presented supporting evidence for such responsiveness (e.g., Adams et al., Reference Adams, Clark, Ezrow and Glasgow2004; Dalton, Reference Dalton1985; Miller et al., Reference Miller, Pierce, Thomassen, Herrera, Holmberg, Esaisson and Wessels1999). Subsequent studies have explored various factors that condition the level of responsiveness (e.g., Dalton, Reference Dalton2017; Iversen, Reference Iversen1994; Spoon & Klüver, Reference Spoon and Klüver2014).
However, this literature says little about the possibility of economic‐based inequality of responsiveness. The conceptualisation of opinion has rarely, for instance, considered how economic inequality might elicit party (non‐)responsiveness. Partial exceptions include Giger et al. (Reference Giger, Rosset and Bernauer2012), Lehmann et al. (Reference Lehmann, Regel, Schlote, Merkel and Kneip2018), Lesschaeve (Reference Lesschaeve2016) and Rosset and Kurella (Reference Rosset and Kurella2020), though these studies provide limited reach over time and countries. Equally important is the fact that several focus on left–right placements for party positions, which makes it unclear what congruence means for actual policy positions, and faces the real possibility that different people interpret the meaning of ‘left’ and ‘right’ in different ways (Bauer et al., Reference Bauer, Barberá, Ackermann and Venetz2017).Footnote 1
In this study, we combine insights from both of these literatures to explore representation via party responsiveness to wealthy versus poor citizens. Analysing the link between voters and parties clarifies the electoral pathway of (unequal) representation. This reveals how citizens’ positions are taken up by parties. We are not just interested in all election pledges, but – by weighting parties by their seat share – particularly in the promises that are prevalent in parliament. Such a focus can be seen as capturing a legislature's centre of gravity.Footnote 2
We take this approach for a number of reasons. In practical terms, the widespread availability of party platforms which can be matched to citizen preferences allows us to achieve breadth in countries, years and policy issues. In substantive terms, electoral selection mechanisms are often suggested as a source of political inequality (Jacobs et al. Reference Jacobs, Kim, Barber and Mettler2004), but – while they are certainly plausible – they have rarely been tested. Moreover, while our analysis cannot reveal the exact processes at play, it does indicate whether scholars, citizens and policymakers should look more closely at electoral selection as a source of biased representation.
We hasten to point out that such a clarification of the party road to (unequal) representation is only part of the full story. It does not cover the non‐electoral pathways or post‐electoral pathway from parties to policy outputs after election day. In other words, we cover one of the broad ‘roads’ of representation (Becher & Stegmueller, Reference Becher and Stegmueller2021; Powell, Reference Powell2004). Importantly, however, the electoral pathway is consistent with a number of other (often narrower) mechanisms producing political inequality, as we discuss below. More importantly, if the positions that parties express as they enter parliament already gravitate towards a minority of the electorate, then even a perfect translation of positions to policies in the post‐electoral stage would produce unequal representation. Of course, there are good reasons to expect inequalities to enter this latter stage of the policy process. Once parties enter the parliamentary or the governmental arena, their actions become much less public, as backdoor lobbying can more easily take place and politicians may be more directly aided or frustrated by rich individuals or interest groups in designing and implementing policy. These lobbying practices may not be equally present at all times and places, and may offer access to groups that represent the demands of the poor. Still, if we find evidence of unequal representation in party platforms, this will likely be amplified in the policy process.Footnote 3 This all points to the limited but important political representation stakes of our focus on whether party positions are biased towards the preferences of the rich. And it should be noted, finally, that understanding possible biases in party responsiveness is intrinsically worth studying to clarify party politics.
We can hence turn to what we expect to emerge from such a focus on party positions. While different parties have different electorates and potentially different motives, we expect that the positions advanced by all parties in the aggregate should respond more strongly to the wealthy than to the poor. The rich possess more resources that can be expected to help parties win a favourable election outcome. This is most obvious in settings where citizens with high incomes can donate money to political campaigns (Rigby & Wright, Reference Rigby and Wright2013). Even in more egalitarian settings, however, wealthier citizens tend to have more opportunities to participate in elections and often vote more in line with their policy preferences (Gallego, Reference Gallego2007; Rosset & Kurella, Reference Rosset and Kurella2020). On the side of representatives, their personal backgrounds – often from higher social classes – affect which positions they consider important and feasible (Butler, Reference Butler2014; Carnes, Reference Carnes2013). Likewise, powerful interest groups can influence parties’ appeals by lending their support to those parties that espouse their favoured views. In sum, our expectation is consistent with a number of ‘demand‐side’ and ‘supply‐side’ mechanisms behind unequal representation.
In line with our empirical approach, biases in how citizens’ preferences influence party positions can take place either through adaptation, selection, or a combination of the two. Parties may consciously adapt their election platforms to appeal to rich voters, as the latter provide more resources to parties than do middle‐ and low‐income voters. But party responsiveness can also take place via parties being replaced or replacing other parties that hold different positions, analogous to the Stimson et al. (Reference Stimson, Mackuen and Erikson1995) notions of rational anticipation and electoral replacement. This means that unequal responsiveness is compatible with vote‐, office‐ and policy‐seeking motives by parties, since purely policy‐seeking parties never changing their positions may be replaced by other policy‐seeking parties.
Furthermore, responsiveness can take place within specific sections of the electorate. Studies of general responsiveness have shown that some parties respond more to their own supporters than to the median voter (Ezrow et al., Reference Ezrow, De Vries, Steenbergen and Edwards2010). By extension, a party's biased responsiveness might favour its own supporters. For example, a socialist party may listen only to their own base of supporters but listen more to high‐income than to low‐income segments of such supporters. Both segments of such a socialist voter base may be below the median income in a given country‐year, but if this same bias applies to most parties, then party platforms in the aggregate reflect views of the rich more than of the poor.
These considerations underlie our first hypothesis, of income inequality of representation in party position‐taking of all parties on average:
H1: Party platforms generally tend to mirror more strongly the policy wants of wealthier than of poorer voters.
This first hypothesis is relevant to how a party system generally can be expected to react to the wants of rich and poor citizens. But such a net or bottom‐line portrait paints over differences between particular parties that surely colour the substantive representation in the position‐taking of parties. Our second set of hypotheses, hence, focuses on responsiveness of particular party families. We expect that left and right party families take up the expressed demands of some voters more than others, reflecting their respective constituencies. The difference between party families, and indeed between any given party and election cycle, is a complex matter, belying attempts to pigeon‐hole a party family. Broad and basic cleavages, however, can be identified, and these matter for understanding the party‐political road to representation.
Left and right party families can be expected to have different constituencies with respect to positions along the polity's income spectrum. The character and potential multi‐dimensionality of left and right positioning of voters and parties in advanced democracies continues to fascinate comparativists (Hooghe et al., Reference Hooghe, Bakker, Brigevich, De Vries, Edwards, Marks, Rovny, Steenbergen and Vachudova2010; Kriesi et al., Reference Kriesi, Grande, Lachat, Dolezal, Bornschier and Frey2006; Van der Brug & Van Spanje, Reference Van der Brug and Van Spanje2009). Surviving polarisation and convergence, and cross‐cutting cleavages and dimensionality, key differences should still cleave left and right parties and their representation across the socio‐economic spectrum. On the economic dimension, egalitarianism and pro‐state interventionism to promote economic equality remains a central dividing line between left and right (Boix, Reference Boix1998; Castles & Mair, Reference Castles and Mair1984; Korpi, Reference Korpi1983). Left‐wing voters and parties embrace interventionist government policies, both macro‐ and micro‐economic, to regulate and humanise market economies and promote egalitarianism and well‐being of the poor (Bobbio, Reference Bobbio1996; Fehr et al., Reference Fehr, Naef and Schmidt2006). Right‐wing voters and parties, meanwhile, tend to reject such egalitarianism or the needs of the poor, and to be sceptical about the efficacy and equity of statist economic intervention. On the more cultural and nationalist–cosmopolitan dimension, furthermore, (mainstream) left‐ and right‐wing parties can be expected to differ on immigration, integration, cultural nationalism and status roles with respect to gender, class, ethnicity and sexuality (Burgoon, Reference Burgoon2013; Hooghe et al., Reference Hooghe, Bakker, Brigevich, De Vries, Edwards, Marks, Rovny, Steenbergen and Vachudova2010; Rooduijn et al., Reference Rooduijn, Burgoon, Van Elsas and Van de Werfhorst2017; Van Elsas & Van der Brug, Reference Van Elsas and Van der Brug2015).
At the same time, the differences between left‐ and right‐wing parties – also in their implications for unequal representation – continue to be debated. Some authors posit that different party families have converged upon a common position, with pressures emanating from economic globalisation often invoked as the source of this convergence (Ezrow & Hellwig, Reference Ezrow and Hellwig2014). This ambiguity over differences between party families is reflected in studies of US unequal representation. While several studies find that the Democratic party better represents the poor relative to the rich than does the more right‐wing Republican party (Bartels, Reference Bartels2016; Ellis, Reference Ellis2013), some analyses find the opposite pattern (Gilens, Reference Gilens2012, pp. 178−192; Rigby & Wright, Reference Rigby and Wright2013).
We expect that the traditional differences between left‐ and right‐wing parties should colour their substantive responsiveness. Left‐oriented parties – including most obviously social–democratic, socialist and green variants – should mirror the wants of poorer voters, indeed championing egalitarian goals through the policy spectrum with respect to economic, social and political policy areas. Conversely, right‐oriented parties – including liberal, conservative and nationalist parties – can be expected to focus on the needs of wealthier constituents, to champion the wants of these voters throughout the range of policy realms on which parties take stances. Even if differences in party families do not manifest themselves in strong contrasts, however, we expect that any privileged representation of richer voters (poorer voters) should be more modest (stronger) among social democratic than among conservative/right parties. Such reasoning supports three complementary hypotheses about left‐ and right‐wing party families. The first is the most general and addresses the relative differences between left‐ and right‐wing parties in the representation of income groups:
H2a: Left‐wing parties should have platforms that express less privileged responsiveness to richer voters (and less under‐responsiveness of poorer voters) than do right‐wing parties.
One can also deduce stronger versions of this hypothesis focused on starker differences in the responsiveness of left‐ versus right‐oriented parties. H2a posits, here, that left‐wing parties are less biased towards the rich than are right‐wing parties, but allows that both types of parties may privilege the rich over the poor. Stronger variants of our second hypothesis argue that left‐wing parties represent the poor better than the rich, while right‐wing parties represent the rich better than the poor. These are our final two expectations:
H2b: Left‐oriented parties can be expected to more strongly respond to the wants of poorer than of richer voters.
H2c: Right‐oriented parties can be expected to more strongly respond to the wants of richer than of poorer voters.
Many additional hypotheses are conceivable. One might expect differences between party families within our broad categories of ‘left’ and ‘right’. Perhaps the latter is the more ambiguous, particularly given the presence of populist‐nationalist parties, whose welfare chauvinist policies might target the middle class more than mainstream‐conservative parties do (Oesch & Rennwald, Reference Oesch and Rennwald2018). For this reason, our analysis will also pay attention to differences between party families.
In addition, one might anticipate differences in unequal responsiveness between policy fields. For instance, inequality could be least pronounced for welfare state policy, given its high salience and given some findings from the United States (Gilens, Reference Gilens2012, p. 101). Additionally, combining variation between parties and policy areas, one might expect that left parties are more distinctly responsive to the poor on socioeconomic issues than they are on sociocultural issues (Kriesi et al., Reference Kriesi, Grande, Lachat, Dolezal, Bornschier and Frey2006). While these additional dimensions should be explored thoroughly, they each raise distinct methodological challenges necessitating research designs different than that most suited to our focus on the general patterns here. Importantly, the empirical possibilities of the kind sketched above do not contradict, but instead extend, our hypotheses about such general patterns. With this in mind, we take our hypotheses as key starting points to better understand unequal representation via parties.
Data and estimation strategy
To analyse the above hypotheses, we match multiple datasets on citizen attitudes towards specific policies to data on party positions towards such policies. The resulting dataset provides leverage to judge our hypotheses on party‐system responsiveness and on left and right party families across time, space and policy areas.
The observations in our data are country‐year‐issues. As shown in Tables A1 and A2 of the Supporting Information, our data include 39 countries. Most of these were included in several survey waves (each matched to manifesto data), resulting in 113 country‐years. Each country‐year contains four or six issues (depending on the survey, see below), which gives us a total of 617 country‐year‐issues.
Independent variables
Our main independent variables are the preferences of citizens in a country‐year towards an issue. Given our theoretical interest, we link all citizens (at a given income level) to parties in that country‐year. In separate analyses, explained below, we also match left voters to left parties and right voters to right parties.
Citizen attitudes are gathered from several sources, the most prominent of which is the ISSP (2020), in particular its repeated Role of Government modules, included in five waves so far (in 1985, 1990, 1996, 2006 and 2016). These modules contain questions on various policy preferences. The most relevant questions ask respondents whether they want more or less government spending in different areas.Footnote 4 From this, we use the questions focusing on culture and the arts, defence, education, the environment, law and order and the welfare state. The same questions were included in the fourth wave of the CSES (2018), conducted between 2011 and 2016, and the 2003 wave of the AsiaBarometer (2007). These were also added to our dataset whenever they could be matched to our dependent variable (see below).
Two points about the policy issues in the survey questions should be noted. First, the CSES does not contain items on culture and the environment, so we only match the remaining four items to our dependent variable. Second, there is no single, overarching question on spending preferences with regard to the welfare state, but instead three questions that cover three aspects of the welfare state: health care, pensions and unemployment. For this outcome, we use the unweighted mean of the three items as measures of welfare state preferences.
These repeated questions have several benefits for our exploration. They yield broad coverage across time and space. The questions also address well‐defined arenas of policy about which citizens can be expected to have opinions, and are phrased in terms of changes relative to a status quo: whether respondents want more or less spending. While the nominal focus of the questions is on spending, not problematic for our purposes, responses to the questions likely express more than spending preferences. For instance, we expect lay citizens to make simple judgements of whether they prefer more or less policy in a certain area rather than express a particular fiscal calculation of spending.Footnote 5
To gauge preferences for more or less policy among citizens, we first recoded a given respondent's answer categories so that strongly agreeing to an increase in spending got a score of 1, agreeing became 0.5, neither agreeing nor disagreeing became 0, disagreeing became −0.5 and strongly disagreeing became −1. Next, we calculate scores at various percentiles by regressing the recoded questions on household income and its squared term (using probability weights), taking the resulting predicted scores at different points in the income distribution. This approach follows Gilens (Reference Gilens2012, pp. 61−62), and is used to harmonise the different income categorisations across countries. We use the 10th income percentile as a measure of low incomes and the 90th percentile as a measure of high incomes. To test the consistency of our findings, we also present models using the preferences of the lowest and highest income quintiles.Footnote 6
Dependent variables
Our dependent variables consist of party positions on the same issues discussed above. For this, we turn to the MPD (Volkens et al., Reference Volkens, Burst, Krause, Lehmann, Matthieß, Merz, Regel, Weßels and Zehnter2020). The MPD uses content analysis to code the percentage of quasi‐sentences in party manifestos devoted to a range of topics. We focus on the percentages devoted to issues of culture, defence, education, the environment, law‐and‐order and the welfare state that closely match the independent variables.Footnote 7 While some parts of party programs reflect upon past developments, they are mostly prospective (Dolezal et al., Reference Dolezal, Ennser‐Jedenastik, Müller, Praprotnik and Winkler2018; Müller, Reference Müller2021). The MPD not only records direct mentions of spending increases in each area, but also more general increases in policy activity, like protection of natural resources under environmental policy. Hence, the MPD maps onto our measures of public opinion: both the independent and dependent variables are measured in terms of levels, but they measure demands for, and plans for, future changes.
For three of the six issues – defence, education and the welfare state – the MPD codes positive references (e.g., more spending) as well as negative references (e.g., less spending). In those cases, our dependent variable subtracts the negative references from the positive ones. Negative references are, however, rare on these three issues, making little difference to our measures. For the other three areas, in any event, only positive references are recorded.
For our main dependent variable of a party's substantive political perspective on a given country‐year issue, we have considered a range of specifications. We first calculate the average attention devoted to each policy issue in each country‐year. For our baseline models, we weighted these by the seat share of the parties to take account of representation of an issue in a given legislative setting, though we also considered unweighted stances (see robustness below). Within each party, we use linear interpolation to estimate how relative attention shifts between elections, though we also consider and report non‐interpolated data. The interpolation involves changes in party positions, not changes in seat shares, since only the former can be expected to change gradually during a legislative term. We then take the natural logarithm of this average and subtract the natural logarithm of the negative attention whenever available (adding 0.5 to both to avoid zeroes) (see Lowe et al., Reference Lowe, Benoit, Slava and Laver2011). The same dependent variable is also calculated separately for left‐wing parties and right‐wing parties. Left‐wing parties are those grouped under the social democratic, socialist and ecologist party families in the MPD, while liberal, conservative and nationalist parties are right‐wing. In the baseline models, finally, these dependent variables are measured one year after the survey.
As control variables, we focus on factors that plausibly shape both citizen attitudes and party positions. Such factors include GDP per capita (constant 2010 US dollars), annual growth in GDP per capita, unemployment rate and dummies for both the issues and survey years. Descriptive statistics for the dependent, independent and control variables are in Table A1 of the Supporting Information.
Using these measures, our baseline estimator is a two‐level random intercept regression, with country‐year‐issues as units and countries as clusters.Footnote 8 We test for unequal representation by focusing in our baseline estimations on the roles of low‐ and high‐income attitudes in separate models and also combined, so as to consider their relative influence on subsequent party positions. For all these models, the coefficients are ordinary least squares, with robust‐cluster standard errors (clustered by country, the level‐two variable) to address remaining country‐specific correlation and heteroskedasticity of errors. We use the same setup to explore differences between left‐ and right‐wing parties. Including and beyond the examples already indicated, our analysis considers many alternatives to our baseline specifications, which we discuss below and present more fully in the Supporting Information.
Findings
Before presenting our main analysis, we note that the preferences of citizens in general, captured by focusing the average attitudes of all respondents or attitudes of those with median incomes, do correlate with party platforms on a given issue. In supplementary analyses, a one‐standard‐deviation increase in preferences leads to an increase in party attention of one‐third of a standard deviation (p < 0.01).Footnote 9 This corroborates previous work on party representation, discussed above, that many party systems provide party responsiveness to median voter preferences. As to our main results on possible inequalities, we begin with the baseline results before moving to a discussion of robustness and extensions of those results.
Baseline models
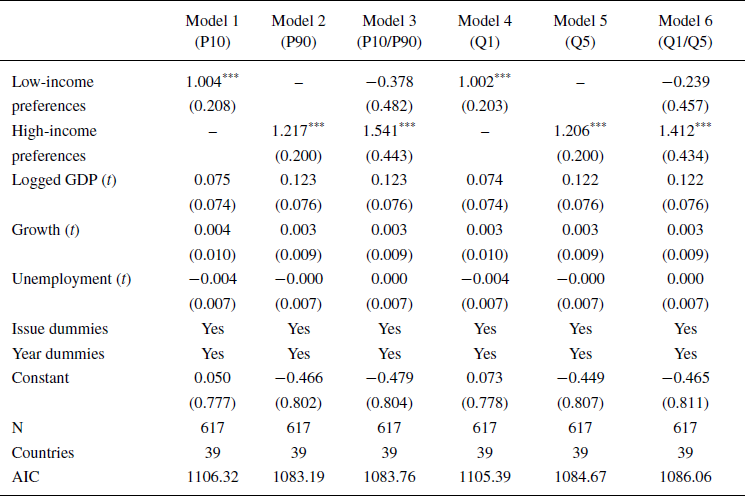
Table 1 introduces our main results testing H1 – that party positions on issues will tend to be more responsive to the wants of rich than of poor voters. The table summarises the baseline models with two different measurements of low and high incomes: the 10th and 90th percentiles (Models 1–3) and the 1st and 5th quintile (Models 4–6). The general picture emerging from both is the same: both low‐ and high‐income preferences are associated with party attention, but this effect is stronger for the latter than the former. Crucially, when both income groups are included in the same model, the effect stays significant for high incomes but disappears for low incomes. This shows a clear income bias in party representation, in line with H1.
Table 1. Random intercept models of logged party attention, t + 1

*p < 0.10;
**p < 0.05;
***p < 0.01 (two‐tailed).
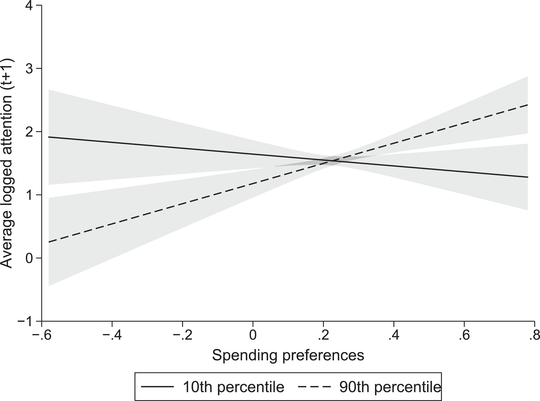
Figure 1 displays the marginal effects of the 10th and 90th income percentiles, corresponding to Model 3 in Table 1 (P10/P90). Other variables are held at their means. This shows that preferences of low‐income respondents have no independent influence on the dependent variable, while the preferences of high‐income respondents do have a strong effect.

Figure 1. Predicted values of party attention by spending preferences of low‐ and high‐income groups (shaded areas indicate 95% confidence intervals).
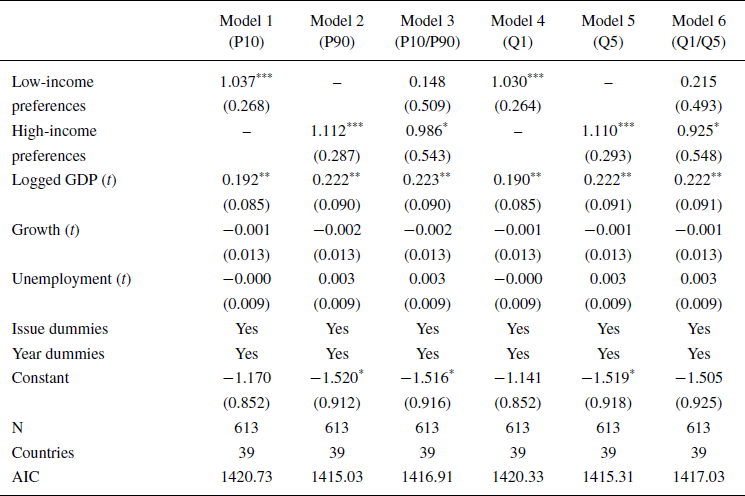
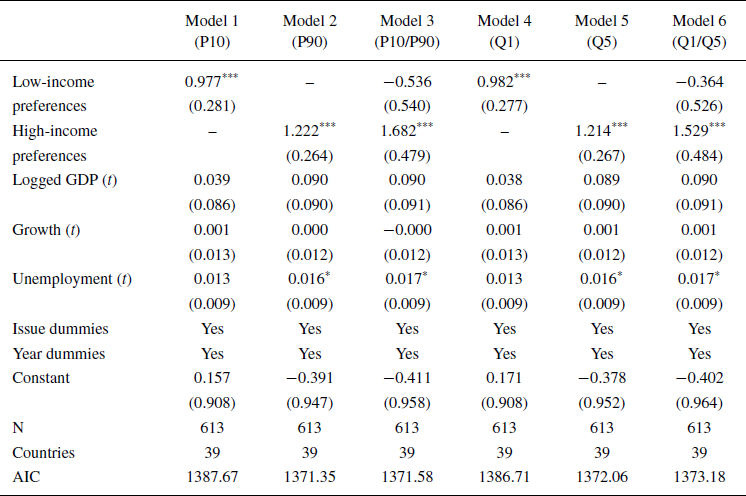
Tables 2 and 3 split‐out the baseline models by left‐ and right‐wing parties.Footnote 10 Responsiveness among left‐wing parties is similar for low and high incomes, at least in the separate models. When the two predictors are included in the same models, however, a similar pattern emerges as before: the coefficient of high incomes stays positive, verging on statistical significance, while the coefficient of low incomes is negligible. Nevertheless, this contrasts with Table 3, which shows a larger gap between the effects of low and high incomes. These findings provide support for H2a and 2c, but not 2b.
Table 2. Random intercept models of logged attention by left‐wing parties, t + 1

*p < 0.10;
**p < 0.05;
***p < 0.01 (two‐tailed).
Table 3. Random intercept models of logged attention by right‐wing parties, t + 1

*p < 0.10;
**p < 0.05;
***p < 0.01 (two‐tailed).
Interestingly, and in line with our discussion in the theoretical framework, we also find some unequal responsiveness to parties’ own voters. If we regress attention by right‐wing parties on the preferences of voters of right‐wing parties with high incomes and the preferences of voters of right‐wing parties with low incomes, the former has a stronger effect than the latter (Table A4 of the Supporting Information). However, there is no discernible bias among left‐wing parties if we compare rich and poor left‐wing voters (Tables A5 and A6 of the Supporting Information).
The preceding analyses says little about the relative influence of low and high incomes compared to the middle incomes. Given the primacy of the median voter in conventional democratic theory, one may expect that the latter is best represented. To test this, we first estimate party attention as a function of preferences of the low, middle and high incomes. We find a strong, positive effect for the highest incomes and non‐significant effects for both the middle and lowest incomes, but these estimates are quite unstable as a result of extreme collinearity and correlated measurement error. We therefore also estimate models where we regress party attention on the preferences of various income groups separately. This substitutes omitted variable bias for collinearity (and is a reason to consider specification alternatives discussed momentarily), but it nevertheless provides insight into the groups’ relative representation.
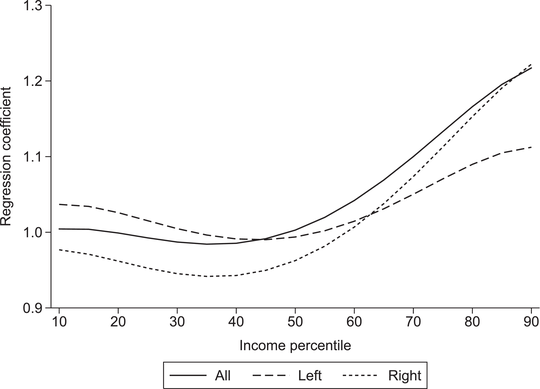
Figure 2 summarises the results, displaying the slope coefficients from regression models that are identical to the baseline specification presented in Table 1 but with each model including a different income percentile as the main predictor.Footnote 11 We again split out responsiveness by left and right parties. Figure 2 reinforces our previous analyses in several ways. First, both left and right parties display unequal responsiveness, as indicated by the positive slope of income. Second, this unequal responsiveness is stronger for right parties, given the steeper slope of income. Third, the effect of income appears to be non‐linear, with the effect for the middle being much closer to the bottom of the income distribution than to the top.

Figure 2. Effects of spending preferences at various income percentiles on responsiveness for all, left and right parties.
Robustness
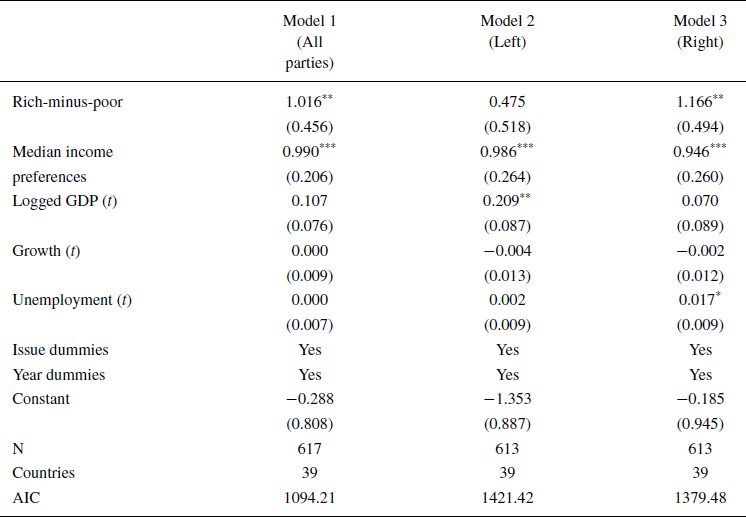
Our next set of results explores important robustness and sensitivity checks. For reasons of brevity, the full results are relegated to the Supporting Information. The first robustness check involves an alternative method to assess the relative influence of low and high incomes by simply taking the difference between the 90th and 10th percentile attitudes, rich‐minus‐poor, in a given country‐topic‐year. Here, more positive (more negative) values capture situations where high‐income voters want more (less) spending than do low‐income voters. If the rich are more influential than the poor, higher values of rich‐minus‐poor should correlate positively with party attention. This specification is particularly useful for circumventing the problem of multi‐collinearity present in our data, particularly in models that include more than one preference parameter.
Table 4 summarises results testing this possibility for all parties (Model 1), left‐wing parties (Model 2) and right‐wing parties (Model 3). All three models control for the preferences of the 50th income percentile. For all parties combined, the rich‐minus‐poor variable has a strong positive effect, corroborating H1b. Strikingly, Models 2 and 3 indicate that the income gap in representation is largely driven by right‐wing parties, with Model 3's coefficient twice as large as Model 2's.Footnote 12 The overall picture, then, is that right‐wing parties are strongly biased towards the rich, while this bias is much smaller or non‐existent among left‐wing parties. However, since they are not biased towards the poor and hence do not cancel out the bias of the right, the overall pattern is still one where the rich come out on top.
Table 4. Random intercept models of logged party attention with preference gaps

*p < 0.10;
**p < 0.05;
***p < 0.01 (two‐tailed).
In line with Figure 2, calculating rich‐minus‐middle preferences and using this to predict party attention produces much the same findings. We find a significant positive effect for all parties verging on significance for left parties, and a highly significant positive effect for right parties (see Table A7 of the Supporting Information). Even compared to the middle, then, the rich are better represented.
Second, to further address possible endogeneity, including lagged dependent variables to our baseline models does not affect the significance of the main coefficients (Table A8 of the Supporting Information). We should note here that we control for party attention at t – 2. This is already strongly correlated with party attention at t + 1 (0.87), and using a shorter lag leaves very little room for any other variable to have any effect.Footnote 13 In a similar vein, controlling for government spending as a percentage of GDP in the six policy areas, measured at t, does not affect the main results (Table A9 of the Supporting Information). Moreover, controlling for micro‐level sources of potential omitted variable bias, particularly education (Schakel & Van der Pas, Reference Schakel and Van der Pas2021), yields similar results to the baseline (Table A10 of the Supporting Information).
Third, we can relax key assumptions informing the baseline dependent variable. If the analysis is limited to country‐years where an election took place in the year following the survey, we find the same pattern of general but unequal responsiveness (Table A11 of the Supporting Information). The story is similar for estimates without interpolation, focusing instead on average attention of parties at the next election, regardless of how many years this took place after the survey, while controlling for party attention at the time of the survey (Table A12 of the Supporting Information). Focusing on unweighted party positions also yields findings very much in line with the baseline results (Table A13 of the Supporting Information). Including Christian‐Democratic parties with the parties on the right has no substantive effect on the findings regarding our second set of hypotheses (Table A14 of the Supporting Information). The same holds if the dependent variable is limited to parties in the ruling coalition or current government, either as raw scores or weighted by seat shares or cabinet portfolios (Tables A15 and A16 of the Supporting Information).
Fourth, the baseline results stand up to alternative estimators. This applies to random intercept models with alternative embedding: alternative two‐level models using country‐topic and country‐year as clusters (Tables A17 and A18 of the Supporting Information); and three‐level models involving country, topic and year (Table A19 of the Supporting Information). It also applies to OLS with country fixed effects or with jack‐knifed standard errors (Tables A20 and A21 of the Supporting Information).
Extension
Finally, we present a number of preliminary findings which go beyond our hypotheses and point to interesting areas for future research.
First, splitting our analyses by policy area reveals that our findings are mainly driven by the issues of welfare, law and order and culture, which show much stronger inequalities than education and the environment (Table A22 of the Supporting Information). However, we are careful about such inferences, given limitations of the data, and given that we have no strong priors to explain this pattern. Hence, an important topic for future research is to explore how unequal responsiveness varies between policy areas.
In the same vein, a next set of analyses considers the major party families in our data in separate models (Table A23 of the Supporting Information). Here, too, direct comparisons require caution, since party families are not always present in the same country‐years. Nevertheless, our findings suggest that socialist parties are not clearly biased towards the preferences of the rich, while social democratic parties do display such a bias. Christian Democratic parties show similar results to the latter. At the same time, all three party families are less unequally responsive than conservative and liberal parties. Nationalist parties constitute an intriguing exception to this pattern, as they appear to be slightly more responsive to lower and middle incomes than to affluent citizens. The fact that our hypotheses are supported even with the inclusion of nationalist parties among the right, then, attests to the robustness of our findings.
Finally, our previous analyses focus on how public preferences affect party platforms, but these platforms are significant for substantive representation insofar as they correlate with actual party behaviour and, eventually, policy change. Previous research has found evidence for such correlation (Klingemann et al., Reference Klingemann, Hofferbert and Budge1994; Thomson et al., Reference Thomson, Royed, Naurin, Artés, Costello, Ennser‐Jedenastik, Ferguson, Kostadinova, Moury, Pétry and Praprotnik2017), and our own data afford some leverage to supplement this research. Most relevant is to focus on party platforms and subsequent policy change with regard to the welfare state, since this is the policy area that most divides the rich and poor, that receives the most manifesto attention (most government spending) and that is subject to the most detailed, comparable coding across time and space due to the Comparative Welfare Entitlements Dataset (Schakel et al., Reference Schakel, Burgoon and Hakhverdian2020; Scruggs et al., Reference Scruggs, Jahn and Kuitto2017). The full results are relegated to the Supporting Information (see Tables A24 and A25 and accompanying text), but our main finding is that the position of coalition parties in a given country‐year is a statistically and substantively significant, positive predictor of changes in welfare generosity in the years following the election. A one‐standard‐deviation increase in the independent variable leads to an increase of around a quarter of a standard deviation in the dependent variable (p < 0.01).Footnote 14 We infer from these patterns that responsiveness in party manifestos is likely a meaningful step in the process of substantive representation.
Conclusion
This paper has sought to navigate a major road to substantive representation: to see whether individual‐level preferences of the rich and poor on a range of policy areas translate into party‐political stances. The reason to do so is to broaden and deepen our understanding of the politics of unequal representation: broadening with respect to the number of country‐issue‐years providing a basis to judge (key aspects of) substantive responsiveness in democratic polities; and deepening with respect to unearthing an important political–institutional pathway of interest‐aggregation and representation in democratic polities that links high incomes to policy change or stagnation.
With this ambition, the paper hypothesised and found substantial evidence supporting that democracies are characterised by unequal representation in electoral platforms. Party platforms tend to take up the direction of preferred policy on a range of issues that citizens express as their wants, but this mirroring or responsiveness is much stronger with respect to the wants of richer than poorer citizens. Also in line with expectations, left and right party families differ in who they most (or least) represent. Contrary to one of our hypotheses, left parties, not just right parties, tend to respond more closely to wealthier than to poorer societal preferences as expressed in survey instruments. But left parties are much less skewed than their right party–family counterparts in such overrepresentation of the rich; and right parties listen much to wealthy respondents while ignoring the wants of poorer respondents. The significance of these findings is strengthened by our final analysis showing, in line with previous studies, that party positions are a meaningful step on the road to actual policy representation.
One qualification of the baseline findings is that preferences of the rich and poor are strongly correlated, such that party platforms may reflect the wishes of the poor even if they are mainly, perhaps solely, written in response to demands by the rich. While this is partly true, there are also numerous country‐years where the rich and poor do disagree on many issues, and where unequal responsiveness has very real consequences for the direction of policy. Furthermore, our findings suggest that low‐income citizens have no independent influence on parties and are hence only represented ‘by coincidence’, a tenuous and problematic basis for democratic representation.
The current findings, while qualified, are major results for understanding substantive representation. While biased representation may be ‘rational’ in a narrow sense for parties in pursuit of voters with valuable resources, this has large implications, both practical and normative. Practically, the fact that parties tend to drown‐out the voices of the less‐affluent may stoke political discontent among such citizens. In a normative sense, the bias we have documented is arguably incompatible with basic notions of political equality.
To be sure, we need further exploration of legislative and party‐political representation, sensitive to the possible moderating effects of institutions, party and interest‐group conditions, or to the vagaries of particular issue areas. As hinted above, our results invite further analysis of the specific mechanisms that produce bias in the electoral pathway in the policy process. Beyond this, the present findings are particularly suggestive regarding variation between policy issues and party families. Regarding the latter, the preliminary result that right‐nationalist parties may be more equally responsive compared to other right‐wing parties could explain their growing appeal among Western electorates. These and other possibilities surely deserve fuller scrutiny.
Additionally, we need more evidence to clarify how this particular road to substantive representation ends. While evidence focused on social policy generosity suggests that unequal party responsiveness yields unequal policy representation, fuller and more multi‐issue exploration is certainly important. And we hypothesise that unequal representation via party responsiveness may be further exacerbated in subsequent stages of the policy process, a suspicion that also mandates future research. Finally, we need to understand how the party‐political road to representation compares and relates to alternative paths – from lobbying patterns in post‐electoral politics to direct voting patterns that might circumvent the party‐political road.
Acknowledgements
Previous versions of this paper were presented at the University of Amsterdam, University of Geneva and the General Conference of the European Consortium for Political Research. We thank seminar participants, as well as Armen Hakhverdian, Simon Hug, Noam Lupu, Daphne van der Pas, Jonas Pontusson, Nils Steiner, the editors and referees of the European Journal of Political Research and all other contributors to this symposium for their helpful comments and suggestions.
Online Appendix
Additional supporting information may be found in the Online Appendix section at the end of the article:
Table A1. Summary statistics.
Table A2. Country‐years in survey and manifesto data.
Table A3. Random intercept models of logged party attention, t + 1 (general responsiveness).
Table A4. Random intercept models of logged attention by right‐wing parties to right‐wing voters, t + 1.
Table A5. Random intercept models of logged attention by left‐wing parties to left‐wing voters, t + 1.
Table A6. Random intercept models of logged attention by left‐ and right‐wing parties to their own voters, t + 1, with preference gaps.
Table A7. Random intercept models of logged party attention with preference gaps (rich‐minus‐middle).
Table A8. Random intercept models of logged party attention, t + 1 (with lagged dependent variable, t – 2).
Table A9. Random intercept models of logged party attention, t + 1 (controlling for government spending).
Table A10. Random intercept models of logged party attention, t + 1 (controlling for education).
Table A11. Random intercept models of logged party attention, t + 1 (limited to country‐years with an election in t + 1).
Table A12. Random intercept models of logged party attention, next election (no interpolation).
Table A13. Random intercept models of logged party attention, t + 1 (non‐weighted dependent variable).
Table A14. Random intercept models of logged attention by right‐wing parties, t + 1 (including Christian‐Democratic parties).
Table A15. Random intercept models of logged coalition party attention, t + 1 (weighted by seat shares).
Table A16. Random intercept models of logged coalition party attention, t + 1 (weighted by cabinet posts).
Table A17. Random intercept models of logged party attention, t + 1 (with country‐topics as clusters).
Table A18. Random intercept models of logged party attention, t + 1 (with country‐years as clusters).
Table A19. Random intercept models of logged party attention, t + 1 (with countries and years as clusters).
Table A20. Linear regression models of logged party attention, t + 1 (with country fixed effects).
Table A21. Linear regression models of logged party attention, t + 1 (with jack‐knifed standard errors by country).
Table A22. Random intercept models of logged attention, separate party families, t + 1.
Table A23. Random intercept models of logged party attention, t + 1 (split out by policy area).
Table A24. Effect of party positions on 2‐year changes in welfare generosity.
Table A25. Effects of party positions on changes in welfare generosity.
Supplementary material


 Open access