


Introduction
Persistence of the patent ductus arteriosus (PDA) in preterm infants is associated with significant haemodynamic disturbances and potential adverse outcomes. Reference Backes, Hill and Shelton1 Despite extensive research into the PDA, there remains a limited understanding of how the preterm myocardium adapts differently in the presence or absence of a haemodynamically significant PDA and how this adaptation may be influenced by treatment response.
Cardiac remodelling due to PDA-related volume loading has been shown to emerge early, peak around 4 weeks of life, and then return to control values. Reference de Waal, Phad, Collins and Boyle2 However, it is not yet clear whether this process is reversible across all infants or whether failure to achieve ductal closure results in persistent morphological and functional changes. Notably, previous studies describing PDA-associated cardiac remodelling have not stratified infants according to PDA severity or accounted for differences in treatment response. As a result, the interplay between haemodynamic burden, myocardial adaptation, and therapeutic success remains insufficiently characterised.
In this study, we aimed to compare serial echocardiographic changes in three distinct groups of preterm infants, stratified by PDA status and treatment response using the EL-Khuffash Patent Ductus Arteriosus Severity Score (PDAsc) Reference El-Khuffash, James and Corcoran3 : high-risk infants who successfully closed their PDA following medical treatment, high-risk infants with a persistent PDA despite medical treatment, and low-risk infants who did not meet the criteria for medical treatment. We hypothesised that infants with treatment success would demonstrate echocardiographic trajectories indicative of improved myocardial adaptation, while treatment failure would be associated with persistent haemodynamic and structural alterations. Low-risk infants were expected to show stable echocardiographic parameters over time, reflecting minimal haemodynamic impact of their PDA.
This study aims to provide new insights into the role of PDA severity and treatment response in shaping myocardial adaptation in preterm infants and to highlight the need to support the development of more tailored haemodynamic management strategies in this cohort.
Material and method
Study design and study population
This was a prospectively designed cohort study performed in the Rotunda Hospital neonatal ICU (NICU), a level three NICU, Dublin, Ireland, between July 2020 and July 2024. All procedures were performed in compliance with relevant laws and institutional guidelines. The study was approved by the Hospital Research Ethics Committee (REC) of the Rotunda Hospital (reference: RAG-2022-018, 23 June 2022). The REC deemed that informed consent was not required as echocardiographic screening of infants was already part of standard unit protocol.
Infants born < 29 weeks’ gestation were considered for inclusion. The cohort was divided into three groups, stratified by the EL-Khuffash PDAsc and subsequent response to medical therapy. The PDAsc, as described in our previous work, is a validated tool that quantifies the haemodynamic significance of a PDA by incorporating markers of pulmonary overcirculation and left ventricular diastolic function. It is calculated using a weighted scoring system that includes four echocardiographic parameters measured on day two of age, in addition to gestational age: PDA diameter (mm), maximum shunt velocity (m/s), left ventricular output (LVO) (mL/kg/min), and left ventricular late diastolic wave velocity (a′ wave) measured via tissue Doppler imaging. The score ranges from 0 (low risk) to 13 (high risk), with a threshold of ≥ 5 identifying infants at high risk for the adverse outcomes of chronic lung disease or death before discharge. Reference El-Khuffash, James and Corcoran3 The three groups in this study consisted of low-risk infants (untreated infants with a PDAsc < 5), high-risk treatment-failure infants (infants with a PDAsc ≥ 5 whose duct remained open directly following medical therapy), and high-risk treatment-success infants (infants with a PDAsc ≥ 5 who successfully closed their duct following medical therapy).
Exclusion criteria
Neonates were excluded from the study if they had a congenital cardiac abnormality present other than a PDA, patent foramen ovale, or an incidental finding of a small ventricular septal defect, if they did not obtain an initial screening echocardiogram due to either death within the first 24 hours following birth or haemodynamic clinician unavailability, or if there was evidence of pulmonary hypertension (bidirectional or right-to-left shunt) on the initial assessment echocardiogram.
Echocardiography assessment
Echocardiograms were performed using the VividTM Echocardiography System (GE HealthCare, Milwaukee, USA) with a neonatal cardiology multi-frequency 12 MHz probe. Pre-warmed sterile, single-use ultrasound gel sachets were used for scanning. Non-pharmacological oral sucrose was used when deemed necessary to optimise infant comfort. Echocardiography image acquisition was compliant with recently published guidelines from McNamara et al. (2024). Reference McNamara, Jain and El-Khuffash4 Standard neonatal echocardiography windows included subcostal, parasternal long-axis, parasternal short-axis, apical, high parasternal, aortic arch, ductal, and suprasternal views. A thorough evaluation of myocardial structure and function was carried out for all echocardiograms, including a formal assessment for CHD during the first echocardiogram.
Each infant had an echocardiogram at three timepoints: day 2, 2 weeks, and 36 weeks PMA. The day 2 echocardiogram was the initial assessment scan, which was performed at 24–48 hours. The EL-Khuffash PDAsc was applied at the time of this echocardiogram. Reference El-Khuffash, James and Corcoran3 Only one echocardiogram was used per infant per timepoint, even when more than one study was available. In such cases where there was more than one echocardiogram available, the echocardiogram temporally closest to the predefined timepoint was selected for analysis. Infants with a score of ≥ 5 were categorised as high risk and were treated with medical therapy for their PDA. If the duct remained open after a first course of treatment, a repeat course of treatment was given. The 2-week echocardiogram was the repeat echo, which was performed 24 hours after the last dose of medical treatment (either the 1st or 2nd course, whichever came last). Infants who had a duct that remained open on echocardiographic assessment following the final course of medical treatment were categorised as “treatment failure.” This classification was based solely on echocardiographic evidence of persistent ductal patency, irrespective of clinical signs; infants who had a duct that closed following treatment were categorised as “treatment success.” Thus, infants were classified as “treatment failure” if the ductus remained patent on the echocardiogram performed 24 hours after the final course of ibuprofen (either the first or second course), corresponding to the 2-week timepoint. Infants with a score of < 5 were categorised as low-risk and were not treated. This group had a repeat echocardiogram at 2 weeks of age. All infants had a repeat echocardiogram at 36 weeks PMA, or prior to discharge (whichever came first).
We collected the following measurements from each echocardiogram: PDA parameters: mean PDA diameter (mm), PDA systolic:diastolic velocity ratio; left-sided echocardiographic measurements: LVO (mL/kg/min), left atrial to aortic root (LA:Ao) ratio, E/e’ ratio, left ventricular end-diastolic diameter (LVEDD) indexed to weight (mm/kg); interventricular septal thickness at end-diastole, left ventricular posterior wall diameter at end-diastole; coeliac artery assessment: coeliac artery systolic velocity (m/s), coeliac artery end-diastolic velocity (EDV) (m/s), coeliac artery velocity time integral (VTI) (cm); pulmonary hypertension parameters: pulmonary artery acceleration time (PAAT) (ms), indexed PAAT (PAAT:right ventricular ejection time [RVET]) ratio, left ventricular eccentricity index (LVEI); left ventricular strain: left ventricular (LV) global longitudinal strain (GLS) (%) (recorded as absolute value), LV GLS rate (1/s); right ventricular strain: right ventricular (RV) GLS (%), RV longitudinal strain rate (1/s). The following cardio-respiratory parameters were collected during each echocardiogram: heart rate (beats per minute [BPM]), systolic blood pressure (BP) (mmHg), and diastolic BP (mmHg). A detailed description of how measurements were performed is published elsewhere Reference McNamara, Jain and El-Khuffash4 .
Echocardiograms were analysed offline using Echopac software by one investigator only (RM).
Medical treatment
Infants with a PDAsc of ≥ 5 were categorised as high risk and were treated with ibuprofen at an initial dose of 10 mg/kg intravenously (IV), followed by two additional doses of 5 mg/kg IV every 24 hours. If the PDA remained open after the first course of treatment, a second course was administered following the same dosing schedule. If ibuprofen was contraindicated due to factors such as a low platelet count (< 50/mm Reference de Waal, Phad, Collins and Boyle2 ), elevated creatinine (> 100 µmol/L), low urine output (< 1 ml/kg/h), grade 3 or 4 intraventricular haemorrhage (IVH), or gastrointestinal or pulmonary haemorrhage, infants were treated instead with paracetamol, administered at 15 mg/kg IV every 6 hours for a total of 12 doses. A second course of paracetamol was also given with the same dosing schedule, if required. If the duct remained open after two courses of treatment, referral for PDA device closure was performed on a case-by-case basis, for example, if the infant still required mechanical ventilation at 2 weeks.
Statistical analysis
Continuous data were tested for normality using the Shapiro–Wilk test and a histogram representation of the data and were summarised as means (standard deviation) or medians [interquartile range], as appropriate. Categorical data were summarised as counts (percentage (%)). Three-group analyses were conducted using one-way ANOVA. The post hoc analyses were used to determine which specific groups differed from each other if a p-value of < 0.05 was obtained following one-way ANOVA. Bonferroni adjustment was used for multiple comparisons of continuous variables. SPSS version 25 was used to conduct the analyses. Statistical significance was considered to be achieved with a p-value < 0.05.
Results
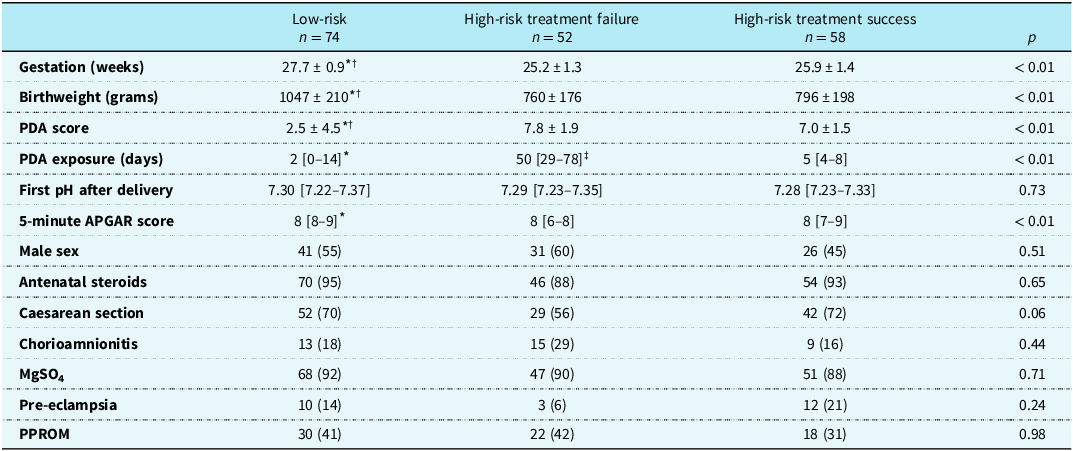
Two hundred and thirty-one infants were considered for inclusion. Forty-seven infants were excluded from consideration of early treatment (no screening was performed in 27 infants due to echocardiographer unavailability, and early pulmonary hypertension [defined as a right-to-left shunt or bidirectional shunt on the day 2 echocardiogram] was detected in 20). Of the remaining 184 infants, 110 were identified as high-risk and treated medically. Of these, 58 responded to treatment (treatment success) and 52 failed treatment (treatment failure). Seventy-four infants were categorised as low risk and did not receive PDA treatment. Clinical characteristics for the three groups are summarised in Table 1.
Table 1. Clinical characteristics of infants included in longitudinal echocardiographic data. Values are presented as means ± standard deviation, median [interquartile range], or count (percentage (%)). Bonferroni adjustment was used for multiple comparisons of continuous variables

PDA = patent ductus arteriosus; MgSO4 = magnesium sulphate; PPROM = preterm prelabour rupture of membranes.
* p < 0.05 low-risk versus high-risk treatment failure.
† p < 0.05 low-risk versus high-risk treatment success.
‡ p < 0.05 high-risk treatment failure versus high-risk treatment success.
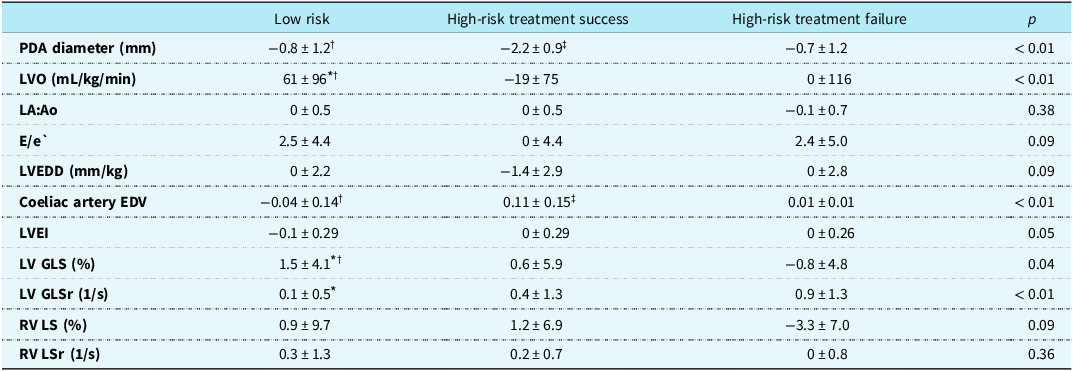
All infants included in the cohort underwent echocardiographic assessment at three standardised timepoints: day 2, at a median age of 42 hours [IQR 33–50], 2 weeks, at a median of 28 weeks PMA [IQR 26–31], and 36 weeks PMA [IQR 35–36]. Due to differences in gestational ages at birth, the timing of the 2-week scan varied slightly across gestational ages but was performed within 24–48 hours of the 14-day postnatal mark. A comparison of the change in key echocardiographic parameters between day 2 and week 2 is presented in Table 2. Infants in the treatment-success group demonstrated a reduction in PDA diameter and LVO, accompanied by an increase in coeliac artery EDV. In contrast, treatment-failure infants had persistently elevated markers of volume loading, including minimal change in PDA diameter (Δ = −0.7 mm ± 1.2) and a sustained LVO (Δ = 0 mL/kg/min ± 116). Low-risk infants showed minimal changes across most parameters.
Table 2. Change in echocardiographic parameters between day 2 and week 2 in the three groups. Values are presented as means ± standard deviation, median [interquartile range], or count (percentage (%)). Bonferroni adjustment was used for multiple comparisons of continuous variables

PDA = patent ductus arteriosus; LVO = left ventricular output; LA:Ao = left atrial to aortic root ratio; E/e′ = early mitral inflow velocity to early diastolic mitral annular velocity ratio; LVEDD = left ventricular end-diastolic diameter; EDV = end-diastolic velocity; LV GLS = left ventricular global longitudinal strain; GLSr = global longitudinal strain rate; LVEI = left ventricular eccentricity index; RV GLS = right ventricular global longitudinal strain; RV GLSr = right ventricular strain rate.
* p < 0.05 low-risk versus high-risk treatment failure.
† p < 0.05 low-risk versus high-risk treatment success.
‡ p < 0.05 high-risk treatment failure versus high-risk treatment success.
Supplementary Figures S1 and S2 show trends in heart rate and BP at the time of echocardiograms. Heart rate was highest in the treatment-failure group on day 2 (165 ± 14 versus 160 ± 13 in treatment success and 159 ± 13 BPM in low-risk groups, p = 0.02). Systolic and diastolic BP were higher in the low-risk group throughout.
Markers of pulmonary overcirculation are shown in Figure 1. LVO was highest in the treatment-failure group on day 2 (233 ± 75 versus 208 ± 66 in treatment success and 170 ± 63 mL/kg/min in low-risk groups, p < .01), with a modest decline by 2 weeks. The treatment-success group demonstrated a marked drop in LVO following PDA closure, whereas LVO in the low-risk group remained relatively stable. The LA:Ao ratio was highest in the treatment-failure group on day 2 (1.72 ± 0.6 versus 1.4 ± 0.5 in treatment success and 1.4 ± 0.4 in low-risk groups, p = .01).

Figure 1. Markers of pulmonary overcirculation. The top graph depicts left ventricular output (mL/kg/min). The bottom graph depicts the LA:Ao ratio. All measurements plotted at three timepoints. LA = left atrium; Ao = aortic root.
Figure 2 outlines left-sided functional parameters. The E/e′ ratio was elevated in the treatment-failure group in week 2 (14 ± 4 versus 11 ± 4 in treatment success and 12 ± 5 in low-risk groups, p = .03) but showed convergence between groups by 36 weeks PMA. LVEDD (indexed to weight) was lower in the treatment-success group when compared with the treatment-failure group by 2 weeks (12.7 ± 2.1 versus 13.5 ± 3.4 mm/kg, p = .11), while remaining elevated in the treatment-failure group (although not statistically significant). These differences reversed at 36 weeks PMA, demonstrating a smaller LV cavity in the treatment-failure group.

Figure 2. Left-sided echocardiographic parameters. The top graph depicts the E/e’ ratio. The bottom graph depicts the LVEDD indexed to weight (mm/kg). All measurements plotted at three timepoints. LVEDD = left ventricular end diastolic diameter.
Figure 3 displays coeliac artery flow parameters. The low-risk group showed the most favourable coeliac artery velocities and VTI at day 2, while the treatment-failure group demonstrated lower values. These differences persisted through 36 weeks PMA, with the treatment-success group showing recovery in coeliac EDV at 2 weeks.

Figure 3. Coeliac artery assessment. The top graph depicts the coeliac artery systolic velocity (m/s). The middle graph depicts the coeliac artery end diastolic velocity (m/s). The bottom graph depicts the coeliac artery velocity time integral (cm). All measurements plotted at three timepoints.
Markers of raised pulmonary pressure are shown in Figure 4. PAAT was higher in the low-risk group on day 2. The indexed PAAT (PAAT:RVET) did not differ significantly between groups. LVEI was significantly higher in the treatment-failure group at 36 weeks PMA (1.33 ± 0.29 versus 1.20 ± 0.13 in treatment success and 1.22 ± 0.18 in low-risk groups, p = .03).

Figure 4. Markers of raised pulmonary pressure. The top graph depicts the PAAT (ms). The middle graph depicts the indexed PAAT (PAAT:RVET ratio). The bottom graph depicts the LVEI = All measurements plotted at three timepoints. PAAT = pulmonary artery acceleration time; RVET = right ventricular ejection time; LVEI = left ventricular eccentricity index.
LV strain trends are shown in Figure 5. GLS was highest in the treatment-failure group on day 2. Strain rate was also elevated in this group at 2 weeks, potentially indicating increased contractile effort in the face of a persistent left-to-right shunt. By 36 weeks PMA, LV GLS had declined in the treatment-failure group while increasing in the low-risk group, reflecting differing trajectories of myocardial adaptation. There were no significant differences in RV GLS or strain rate between groups at any timepoint (Figure S3), consistent with a more left-heart dominant PDA effect.

Figure 5. Left ventricular strain. The top graph depicts the LV global longitudinal strain (%). The bottom graph depicts the LV global longitudinal strain rate (1/s). All measurements plotted at three timepoints. LV = left ventricular.
Discussion
This study is the first to describe longitudinal echocardiographic trajectories in preterm infants stratified by PDA status and response to medical treatment. By comparing three distinct groups: low-risk infants with spontaneous closure, high-risk infants with treatment success and high-risk infants with treatment failure, we describe differing patterns of myocardial adaptation in preterm infants that unfold over time.
As expected, infants in the treatment-failure group had larger PDA diameters, elevated LVO, and signs of increased volume loading at all timepoints. These findings reflect the ongoing haemodynamic burden of a persistently high-risk PDA and align with established pathophysiological models. Reference El-Khuffash, Levy, Gorenflo and Frantz5 However, our study provides novel insight into the temporal evolution of these findings, showing that haemodynamic differences extend well beyond the early neonatal period and persist in the absence of ductal closure.
Although statistically significant, the observed difference in heart rate is small and unlikely to have clinical significance. Infants who responded to treatment had an early reduction in PDA diameter and LVO, as well as improvements in coeliac perfusion indices. These changes suggest a dynamic haemodynamic response to successful ductal closure. Conversely, the persistence of abnormal parameters, such as reduced coeliac flow in the treatment-failure group, may represent maladaptive myocardial and systemic consequences of prolonged shunting. These changes were not observed in the low-risk group, who demonstrated stable echocardiographic profiles throughout the duration of surveillance. Immediate correction in flow alteration in the coeliac artery has been previously shown in studies following PDA ligation, Reference Hoodbhoy, Cutting, Seddon and Campbell6 and coeliac artery EDV has also been shown to be associated with increased ductal diameter and indices of left heart loading. Reference Keusters, Purna and Deshpande7
The treatment-failure group demonstrated higher LV GLS values at day 2 and 2 weeks. Rather than indicating superior myocardial performance, this likely reflects increased preload and myocardial stretch secondary to left-to-right shunting. This is supported by the parallel rise in LV strain rate, which may represent compensatory myocardial effort to maintain forward flow under suboptimal loading conditions. Loading conditions affect strain but not strain rate, which is more reflective of intrinsic myocardial contractility. Reference Bussmann and El-Khuffash8 By 36 weeks PMA, strain metrics declined in the treatment-failure group and improved in the low-risk group, again suggesting divergent trajectories of myocardial adaptation. A previous cohort study found a higher LV GLS and strain rate over the first week of life in a group of preterm infants who had an open compared to a closed PDA. Reference Bussmann, Franklin, McCallion, McNamara and El-Khuffash9
Although the association between a persistent PDA and cardiac remodelling is well recognised Reference de Waal, Phad, Collins and Boyle2 , prior studies have typically examined this relationship in unstratified cohorts or at a single timepoint. Our analysis is unique in that it captures serial changes in both structure and function and accounts for PDA severity and treatment response. This offers a more nuanced understanding of how echocardiographic parameters might evolve following medical intervention and how different subgroups of preterm infants may adapt over time.
Our findings may have potential implications for clinical care, particularly in terms of guiding management decisions for preterm infants with persistent haemodynamic abnormalities following failed medical treatment, who may represent a subgroup at higher risk of long-term adverse cardiovascular outcomes. Serial echocardiography, especially in the first weeks after birth, may help in identifying the infants who are developing adverse remodelling trajectories and to support decision-making around alternative treatment strategies for these infants, such as device closure or ongoing surveillance. While these observations are promising, our hypothesis requires further validation through randomised studies, ideally including comparisons of definitive closure strategies such as early transcatheter PDA closure versus expectant management, in order to fully differentiate intrinsic physiological factors from true PDA effects.
Limitations
There are several limitations to this study. First, this was an observational, single-centre study, and while protocols were standardised in our unit, the results may not be generalisable to other settings. Infants were not randomised to PDA treatment but rather received treatment based on a risk-based assessment that followed a standardised unit-specific algorithm, which may have introduced treatment bias. It was beyond the scope of this study to account for all potential confounders which could in part influence cardiac adaptation, such as duration of mechanical ventilation, exposure to surfactant, exposure to postnatal steroids, anaemia of prematurity or development of chronic lung disease. Furthermore, the potential haemodynamic impact of atrial level shunting via a patent foramen ovale was also not addressed. As this was an observational study, we cannot exclude the possibility that divergent echocardiographic trajectories reflect underlying intrinsic differences between infants rather than solely treatment effects. Finally, clinical outcome data, such as rates of bronchopulmonary dysplasia, necrotising enterocolitis, or IVH, are not included in this manuscript but are presented separately in a related publication. Reference Mullaly, Smith and Murphy10
Conclusion
In summary, this study highlights how PDA severity and treatment response may shape myocardial adaptation in preterm infants. While many of the observed haemodynamic differences are physiologically expected, the demonstration of their persistence or resolution over time provides new insight into the impact of PDA treatment response on cardiac remodelling. Our findings lay the groundwork for future studies that might combine physiological data with clinical outcomes. These insights may ultimately support a more individualised approach to PDA management but require validation through larger, prospective studies.
Supplementary material
The supplementary material for this article can be found at https://doi.org/10.1017/S1047951125110767.
Acknowledgements
None.
Financial support
The first author received a grant from the Irish Research Council in the form of a PhD stipend (grant number GOIPG/2023/3889).
Competing interests
None.
Ethical standard
The authors assert that all procedures contributing to this work comply with the ethical standards of the Health Products Regulatory Authority and the Irish Department of Health’s National Guidelines on Human Research Ethics, as well as with the Helsinki Declaration of 1975, as revised in 2008. The study was approved by the Research Ethics Committee of the Rotunda Hospital, Dublin, Ireland.


 Open access