


1. Introduction
As healthcare systems worldwide face rising demand, constrained budgets, and increasingly complex disease profiles (Mossialos et al., Reference Mossialos, Wenzl, Osborn and Sarnak2016), the application of actuarial expertise in health economic modelling is both timely and essential. While health economics has traditionally been shaped by economic and public health perspectives, actuaries bring a unique and complementary skill set to the field. These include advanced proficiency in demographic modelling, survival analysis, and understanding population-level risk dynamics, all of which are central to projecting disease burden, evaluating treatment pathways, and informing long-term health system planning (Wang’ombe, Reference Wang’ombe2024). The profession’s grounding in stochastic modelling, uncertainty quantification, and scenario testing allows for the development of robust, data-driven and transparent models that can accommodate heterogeneous populations and imperfect data (Carroll, Reference Carroll1985; Embrechts and Wüthrich, Reference Embrechts and Wüthrich2022). These conditions are often the norm in real-world healthcare settings. These capabilities position actuaries to contribute meaningfully to cost-utility analysis, health technology assessment, and value-based care initiatives; especially in resource-constrained environments where population need and funding trade-offs must be carefully balanced (Espinosa et al., Reference Espinosa, Drummond, Russo, Williams and Wix2025; Lieberthal et al., Reference Lieberthal, Amos and Lopatto2014).
Globally, healthcare systems (whether in low- and middle-income countries or high-income settings such as the UK) are confronting a shared set of challenges: ageing populations, growing prevalence of chronic disease, and increasing demand for accountability in healthcare spending (Abbing, Reference Abbing2016). These realities have accelerated the need for evidence-based resource allocation models, which must also account for equity, demographic variation, and clinical complexity. In this landscape, actuarial methods offer a powerful toolkit for enhancing the rigour and relevance of health economic evaluations (Wang’ombe, Reference Wang’ombe2024).
A widely used metric in such evaluations is the Incremental Cost-Effectiveness Ratio (ICER), particularly within cost-utility analysis frameworks. In these models, the ICER quantifies the cost per quality-adjusted life year (QALY) gained (Neumann et al., Reference Neumann, Willke and Garrison2018; Taylor, Reference Taylor2016), using the standard formulation:
 $$ICER = {{{{C_1} - {C_0}}}\over{{{E_1} - {\rm{\;}}{E_0}}}}$$
where C 1 and E 1 represent the costs and effects of the intervention, and C 0 and E 0 represent those of the comparator or standard of care. Costs are measured in monetary units, while effects are typically measured in QALYs, which combine life expectancy and health-related quality of life into a single metric.
Despite its appeal as a unified framework, the QALY model has recognised limitations. Utility weights used to estimate QALYs can vary depending on the instrument, valuation method, and underlying population (Taylor, Reference Taylor2016). Furthermore, most systems assume that all QALYs are valued equally, regardless of who receives them or when. This assumption ignores known demographic and psychosocial differences in how individuals perceive and report health status (Hanspal & Devasagayam, Reference Hanspal and Devasagayam2017; Steptoe et al., Reference Steptoe, Deaton and Stone2015). Health status perception is inherently subjective, suggesting that systematic heterogeneity in utility valuations exists across and within populations.
From an actuarial perspective, this introduces a key modelling challenge: utility weights are not fixed constants but may vary significantly across subpopulations, introducing bias into ICER estimates if heterogeneity is ignored. This is particularly important in pluralistic or inequitable healthcare systems, where baseline health states, treatment access, and societal preferences differ across groups.
In South Africa (used here as an illustrative case study) health economic modelling is not yet governed by consistent regulation, and local utility weights or cost-effectiveness thresholds have not been formally adopted (Ranchod et al., Reference Ranchod, Adams, Burger, Carvounes, Dreyer, Smith, Stewart and Biljon2017; Siriram & Harris, Reference Siriram and Harris2024). Yet, like many other nations, the country is moving toward value-based care models and a National Health Insurance (NHI) framework that demands rigorous evaluation of treatment value (Gopal et al., Reference Gopal, Suter-Crazzolara, Toldo and Eberhardt2019). These developments make the case for actuarial involvement in constructing robust, localised models that can inform resource allocation in complex, data-constrained environments.
This paper demonstrates how actuarial and analytics techniques can be employed to derive locally representative utility curves using patient-reported outcomes data from a South African cohort of individuals with non-small cell lung cancer (NSCLC). While the empirical data are drawn from a specific context, the modelling approach is intended to be generalisable across jurisdictions; particularly for actuarial professionals tasked with building valuation models, informing reimbursement strategies, or conducting population health forecasting in the face of heterogeneity and uncertainty.
2. Background
2.1. Health Technology Assessment (HTA): Limitations and Opportunities for Actuarial Input
HTA plays a central role in informing healthcare resource allocation across global health systems (Siriram & Harris, Reference Siriram and Harris2024). While traditionally the remit of economists and policy professionals, there is a growing need for greater technical rigour, demographic precision, and predictive accuracy. HTA processes typically rely on cost-effectiveness frameworks using the ICER as a central metric (Zhang et al., Reference Zhang, Bao, Lang, Fu, Kimber, Levine and Xie2022). But, as many countries, including the UK, shift toward value-based care and population-specific contracting, there is increasing scrutiny of the limitations inherent in traditional HTA approaches (Neumann & Cohen, Reference Neumann and Cohen2017).
Three such limitations are particularly relevant from an actuarial perspective:
-
(1) Subjectivity in QALY estimation: The ICER often uses QALYs as the outcome measure, yet QALYs themselves rely on utility weights that are sensitive to the measurement instrument, valuation method, and characteristics of the respondent (Taylor, Reference Taylor2016; Hanspal & Devasagayam, Reference Hanspal and Devasagayam2017; Steptoe et al., Reference Steptoe, Deaton and Stone2015). Existing frameworks do not adequately reflect the fact that individual preferences and behaviours, shaped by age, language, and socio-economic status, may yield different utility curves even for the same health states (Kaplan & Camacho, Reference Kaplan and Camacho1983).
-
(2) Limited consideration of real-world budget constraints: Traditional ICER-based comparisons evaluate marginal differences between treatment options, but do not explicitly account for fixed resource constraints that health systems face (Buchanan, Reference Buchanan2008). Actuarial methods, with their foundations in constrained optimisation and scenario analysis, are well-suited to address this limitation by embedding budgetary feasibility directly into decision frameworks (Eichler et al., Reference Eichler, Kong, Gerth, Mavros and Jönsson2004).
-
(3) Narrow scope of cost inclusion: Many HTA models evaluate only the immediate cost and benefit of a treatment intervention, often neglecting downstream cost implications across the full patient journey (Taylor, Reference Taylor2016). A system-wide actuarial perspective encourages broader costing, including practitioner fees, diagnostics, consumables, and follow-up services.
This paper primarily addresses the first two limitations through the development of population-specific utility curves using advanced analytics. These methods are applicable not only in South Africa, but also in the UK and other high-income nations where demographic diversity, budget pressures, and heterogeneity in patient preferences present similar challenges (Abbing, Reference Abbing2016).
2.2. Modelling Frameworks in Resource-Constrained Systems
While the issue of constrained healthcare budgets is acute in African health systems, the broader modelling principles are universally applicable. Countries like the UK face increasing costs from ageing populations and rising chronic disease prevalence, prompting renewed interest in cost-utility thresholds and personalised value metrics (Abbing, Reference Abbing2016). In both contexts, there is a need to account for variation in health outcomes, patient experiences, and utility valuations.
Current decision frameworks, though abundant, often operate in a piecemeal fashion and fail to fully integrate patient-reported preferences and behaviours (Paris & Belloni, Reference Paris and Belloni2013; Taylor, Reference Taylor2016). Additionally, most methods do not incorporate the entire patient journey, nor do they align cost-effectiveness decisions with system-level budget constraints (Taylor, Reference Taylor2016; Hanspal & Devasagayam, Reference Hanspal and Devasagayam2017).
Advanced analytics, including supervised and unsupervised modelling approaches, present an opportunity to bridge this gap (Siriram & Harris, Reference Siriram and Harris2023, Reference Siriram and Harris2024). Actuarial professionals are well-positioned to deploy these tools to uncover relationships between patient demographics, reported health states, and utility scores ultimately generating more nuanced, context-aware utility functions.
2.3. Demographic Drivers of Utility Perception: Local Case, Global Relevance
This study applies these techniques to a real-world dataset of South African NSCLC patients, considering key demographic factors (age, gender, race, language, and household composition) alongside self-reported health indicators (mobility, self-care, usual activities, pain/discomfort, and anxiety/depression). These traits are known to influence perceived health status and are therefore important determinants of utility weights (Bernstein et al., Reference Bernstein, Karhade, Bono, Schwab, Harris and Tobert2022; Myers et al., Reference Myers, Koch, Johnson and Harker2022).
While race has historically served as a proxy for socio-economic status in South Africa (Charasse-Pouélé & Fournier, Reference Charasse-Pouélé and Fournier2006; Lalloo et al., Reference Lalloo, Smith, Myburgh and Solanki2004), recent literature suggests it is becoming less effective over time (Myburgh et al., Reference Myburgh, Solanki, Smith and Lalloo2005). Language, however, has emerged as a more stable proxy, with English home-language status strongly associated with employment and income potential (Cornwell & Inder, Reference Cornwell and Inder2008). Similar patterns may be observed in other multilingual societies, including the UK, where language fluency intersects with health access, literacy, and economic opportunity.
The modelling implications of these findings are broad: by capturing utility heterogeneity tied to demographic traits, actuaries can construct models that better represent the preferences and experiences of real-world populations, enhancing both equity and predictive accuracy.
2.4. The EQ-5D-5L Framework and Analytical Integration
The EQ-5D is among the most widely used instruments for eliciting health-related quality of life and deriving utility values. It has been endorsed for use in clinical trials, population studies, and cost-effectiveness evaluations across jurisdictions, including the UK’s NICE and the US Washington Panel (Bharmal & Thomas, Reference Bharmal and Thomas2006; Devlin & Krabbe, Reference Devlin and Krabbe2013; Janssen et al., Reference Janssen, Pickard, Golicki, Gudex, Niewada, Scalone, Swinburn and Busschbach2013; Noyes & Edwards, Reference Noyes and Edwards2011). The updated EQ-5D-5L version provides finer granularity across five dimensions: mobility, self-care, usual activities, pain/discomfort, and anxiety/depression, with five levels of severity per dimension (Herdman et al., Reference Herdman, Gudex, Lloyd, Janssen, Kind, Parkin, Bonsel and Badia2011).
While crosswalks from the three-level version (EQ-5D-3L) provide interim valuation sets, there is growing recognition of the need for directly elicited EQ-5D-5L value sets that reflect local population preferences (Devlin & Krabbe, Reference Devlin and Krabbe2013). This opens the door to analytical approaches that can model such preferences empirically using population data (Brazier et al., Reference Brazier, Roberts and Deverill2002).
In this study, we demonstrate how clustering and regression-based analytical techniques can augment the standard EQ-5D framework by incorporating demographic stratification, thus enhancing its utility for actuarial modelling and health policy applications. This approach holds value not only in emerging health systems but also in mature, data-rich environments like the UK where sub-population modelling and equity concerns are gaining prominence.
3. Methodology
3.1. Instrumentation: Augmented EQ-5D-5L and VAS
This study employed the EQ-5D-5L instrument, a validated and widely adopted generic measure of health-related quality of life (HRQoL) (Herdman et al., Reference Herdman, Gudex, Lloyd, Janssen, Kind, Parkin, Bonsel and Badia2011). The instrument comprises five dimensions – mobility, self-care, usual activities, pain/discomfort, and anxiety/depression, each scored on a five-level scale, resulting in 243 distinct health states (Balestroni & Bertolotti, Reference Balestroni and Bertolotti2012; Devlin & Brooks, Reference Devlin and Brooks2017; Van Hout et al., Reference Van Hout, Janssen, Feng, Kohlmann, Busschbach, Golicki, Lloyd, Scalone, Kind and Pickard2012).
In addition to standard EQ-5D-5L responses, patients completed a Visual Analogue Scale (VAS), ranging from 0 (worst imaginable health) to 100 (best imaginable health), providing a self-rated measure of perceived overall health (Janssen & Szende, Reference Janssen and Szende2014).
To capture heterogeneity in health perception, the instrument was augmented to include key demographic and socio-economic variables: home language, age, gender, race, and household structure. Socio-economic status was proxied through indicators such as household size, financial dependency, and primary breadwinner status, consistent with earlier demographic frameworks applied in South African health research (Defo, Reference Defo2014; Myers et al., Reference Myers, Koch, Johnson and Harker2022).
This enhancement enables testing of whether such characteristics are statistically significant predictors of utility perception and facilitates the development of differentiated utility curves relevant for cost-utility modelling in diverse populations.
3.2. Study Population: Advanced NSCLC Patients
The empirical analysis focuses on patients with advanced-stage (Stage IV) NSCLC and PD-L1 expression <50%, a group representing approximately two-thirds of the available sample. NSCLC accounts for 80% of global lung cancer diagnoses and includes histological subtypes such as adenocarcinoma, squamous cell carcinoma, and large cell carcinoma (Ettinger et al., Reference Ettinger, Akerley, Borghaei, Chang, Cheney, Chirieac, D’Amico, Demmy, Ganti, Govindan and Grannis2012; Zarogoulidis et al., Reference Zarogoulidis, Zarogoulidis, Darwiche, Boutsikou, Machairiotis, Tsakiridis, Katsikogiannis, Kougioumtzi, Karapantzos, Huang and Spyratos2013). The stage of disease is a critical determinant of treatment strategy and prognosis (Osmani et al., Reference Osmani, Askin, Gabrielson and Li2018; Gu et al., Reference Gu, Tian, Tian and Zhang2015), and Stage IV patients are typically candidates for resource-intensive palliative interventions (Ohtsuka et al., Reference Ohtsuka, Ohnishi, Fujiwara, Kishino, Matsushima, Furuyashiki, Takei, Koshiishi, Goya and Watanabe2007; Tsim et al., Reference Tsim, O’dowd, Milroy and Davidson2010).
This population was selected due to its clinical significance, treatment complexity, and suitability for illustrating the application of demographic-adjusted utility estimation within constrained health system environments (Taherdoost, Reference Taherdoost2016).
3.3. Site Selection and Data Collection
Four metropolitan regions in South Africa – Johannesburg, Pretoria, Cape Town, and Durban -were selected for broad demographic representation. Participating centres were private oncology Centres of Excellence with high patient volumes and robust data capture infrastructure.
Eligible patients were retrospectively identified through clinical records. Inclusion criteria required a diagnosis of Stage IV NSCLC with PD-L1 <50%. Data were collected via telephone-administered surveys following informed consent. No exclusion criteria based on demographic characteristics were applied.
Sampling aimed to ensure representativeness across race, language, gender, age, household size, and family composition. These variables were identified as potentially relevant modifiers of health perception based on prior national health studies (Shisana et al., Reference Shisana, Rehle, Simbayi, Zuma, Jooste, Zungu, Labadarios and Onoya2014; Moultrie & Timæus, Reference Moultrie and Timæus2003).
Sample size was determined based on minimum subgroup thresholds required for valid statistical inference across categorical variables (Dixon & Leach, Reference Dixon1977), while balancing logistical constraints (Balk et al., Reference Balk, Deichmann, Yetman, Pozzi, Hay and Nelson2006).
3.4. Statistical Approach: Generalised Linear Modelling
The primary objective was to model patient-perceived health status (VAS score) as a function of both EQ-5D-5L health states and demographic covariates. Given the bounded, continuous nature of the VAS score and the presence of non-normal error structure, Generalised Linear Models (GLMs) were employed (Nelder & Wedderburn, Reference Nelder and Wedderburn1972; Dobson & Barnett, Reference Dobson and Barnett2018). GLMs extend linear regression to allow for non-Gaussian response distributions. The model takes the form:
 $$E\left( {Y{\rm{|}}X} \right) = \mu = {g^{ - 1}}\left( {X\beta } \right)$$
where Y is the VAS score, Xβ is the linear predictor, and g is a specified link function. The conditional variance is defined as:
 $$Var\left( {Y{\rm{|}}X} \right) = \phi V\left( \mu \right)$$
where V(μ) is a variance function specific to the distributional family (e.g., Gaussian, Gamma, inverse Gaussian), and ϕ is a scale parameter. The model parameters β were estimated using maximum likelihood estimation.
Candidate models using alternative link functions and distributional families were evaluated using the Akaike Information Criterion (AIC) and the Bayesian Information Criterion (BIC), as well as graphical and statistical residual diagnostics.
3.5. Variable Specification
The model incorporated both health status indicators from the EQ-5D-5L instrument and a range of demographic and socio-economic covariates, selected for their hypothesised influence on perceived health status.
The five EQ-5D-5L dimensions -mobility, self-care, usual activities, pain or discomfort, and anxiety or depression – were each treated as categorical variables reflecting the five severity levels described in the instrument. These dimensions collectively captured the functional and emotional domains of health status as reported by patients at the time of survey.
Demographic characteristics were included to assess their potential explanatory power in modelling heterogeneity in VAS scores. These comprised race and home language (both treated as nominal variables), age (treated as an ordinal variable), and gender (categorical). Socio-economic characteristics were proxied through household size (entered as a continuous numeric variable), a binary indicator denoting whether the respondent was the primary income earner in the household, and another binary indicator capturing the presence of financial dependants.
The dependent variable was the VAS score, measured on a continuous scale from 0 to 100 and representing the respondent’s self-rated perception of their current health. Given its bounded nature and the distributional characteristics observed in the data, the VAS score was modelled using a generalised linear framework with appropriate link and variance functions.
The full set of independent variables was initially included in the model. Backwards stepwise selection was subsequently employed to identify the subset of predictors that achieved the optimal balance of parsimony and explanatory power, based on information criteria and statistical significance. This allowed for a structured assessment of whether and to what extent demographic and socio-economic variables contributed to variation in patient-perceived health beyond the EQ-5D-5L dimensions (Zhang, Reference Zhang2016).
3.6. Data Description
The analytical dataset comprised thirteen variables: eight demographic or socio-economic indicators and five health-related variables derived from the EQ-5D-5L instrument. The demographic variables included race, home language, age group, gender, household size, primary breadwinner status, and financial dependency. These were selected to reflect both individual-level characteristics and household socio-economic context.
Race was classified into two categories: White and Other. Home language was grouped as English versus Other. Age was captured in three ordinal bands: 18–45 years, 46–55 years, and 56 years and older. Gender was binary (male or female), and household size was dichotomised as fewer than three versus three or more individuals. Socio-economic indicators included binary variables indicating whether the respondent was the primary breadwinner and whether they supported financial dependants.
The EQ-5D-5L instrument contributed five categorical health state indicators: mobility, self-care, usual activities, pain or discomfort, and anxiety or depression. Each of these dimensions was recorded on a five-level scale ranging from “no problems” to “extreme problems” or “unable to perform”. In addition, respondents provided a score on the Visual Analogue Scale (VAS), a continuous measure from 0 (representing the worst health imaginable) to 100 (the best health imaginable), indicating their self-assessed health status on the day of the survey. These data were collected in a consistent format across all participating sites, enabling harmonised analysis of categorical and continuous predictors of perceived health status.
3.7. Limitations
Two key limitations should be acknowledged in relation to the dataset and modelling approach. First, while the sampling strategy aimed to ensure broad demographic representation across the South African NSCLC Stage IV patient population, the sample size of 148 respondents does not permit national representativeness in a strict statistical sense. Nevertheless, the sample is comparable to foundational studies such as Malik et al. (Reference Malik, Gu, Hussain, Saleem, Purba and Al Sayah2022), who applied a similar patient-reported outcomes framework in a Pakistani context using a sample of 100 adults from a population exceeding 220 million. As in this study and other pilots, the present research is positioned as a proof-of-concept, demonstrating methodological feasibility and highlighting areas for further research at scale.
Second, the set of demographic and socio-economic variables included in the model was based on prior empirical studies of social stratification in South Africa, with language and race used as proxies for socio-economic status. While these proxies are supported by historical and economic literature (e.g., Cornwell & Inder, Reference Cornwell and Inder2008; Shisana et al., Reference Shisana, Rehle, Simbayi, Zuma, Jooste, Zungu, Labadarios and Onoya2014), it is recognised that more granular variables (such as education, employment status, or household income) may further improve the explanatory power and specificity of the derived utility curves. Future research could refine the demographic modelling by incorporating these additional dimensions, subject to data availability and ethical approval.
It should also be noted that the budget impact analysis (BIA) is hypothetical and intended to illustrate the feasibility and decision-making relevance of actuarial utility modelling, pending validation with real-world economic data.
4. Results and Model Fit
4.1. Descriptive Summary
The final dataset is comprised of 148 observations. Each respondent provided responses to the EQ-5D-5L instrument and demographic variables including race, home language, age group, gender, household size, primary breadwinner status, and financial dependency. Health state responses spanned all five EQ-5D-5L domains. Notably, distributions within some categories were skewed, particularly for mobility and pain/discomfort where most respondents reported moderate to extreme difficulties, consistent with the clinical severity of the cohort.
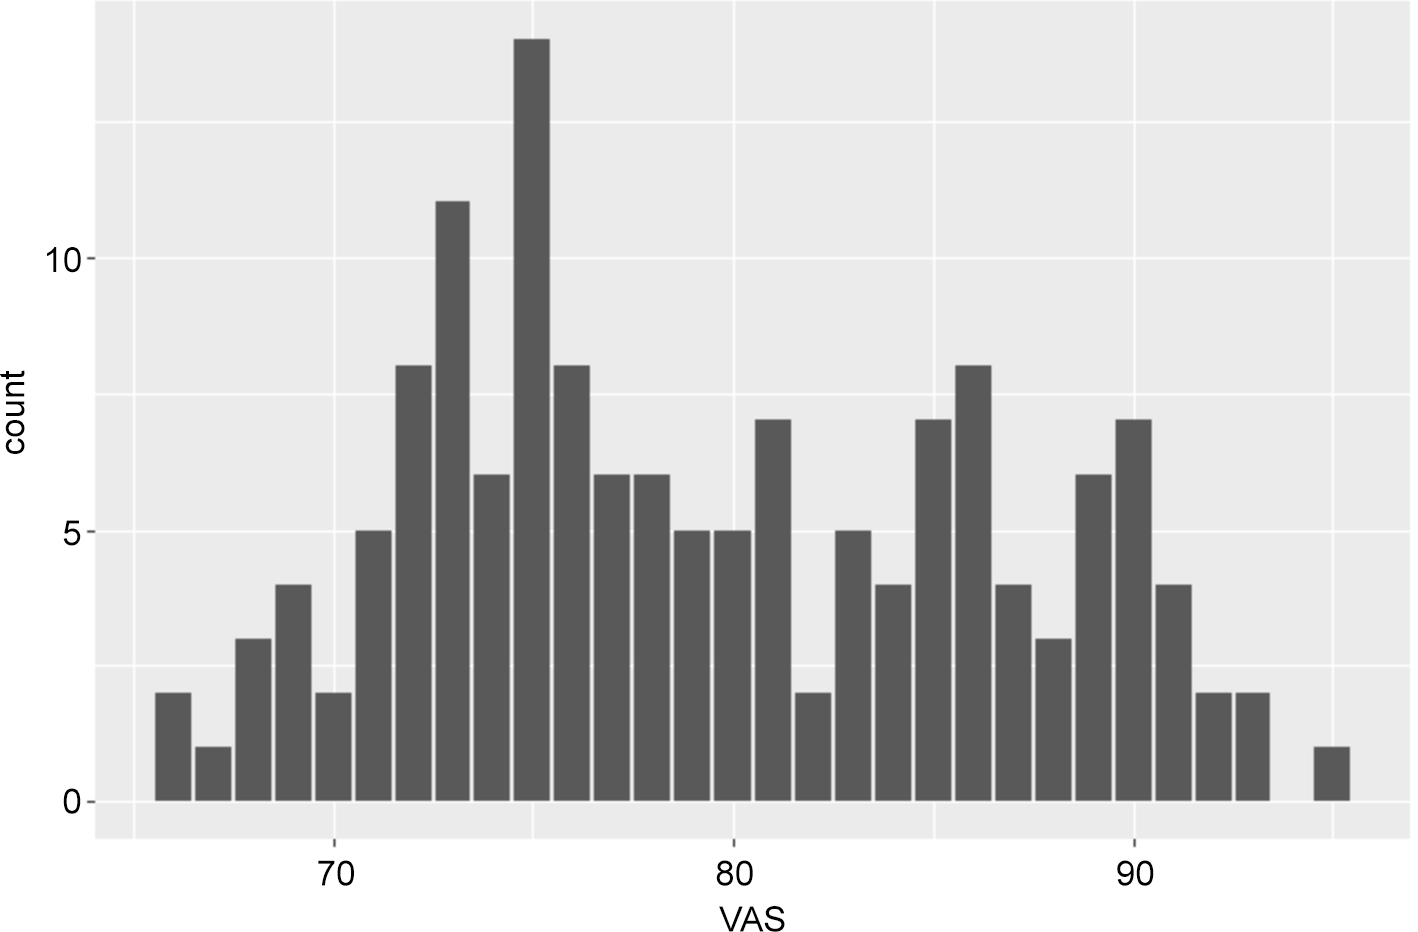
The Visual Analogue Scale (VAS), used as the dependent variable, exhibited a slight rightward skew (Figure 1), suggesting non-normality (Ahsanullah et al., Reference Ahsanullah, Kibria and Shakil2014).

Figure 1. VAS score by count exhibiting non-normality.
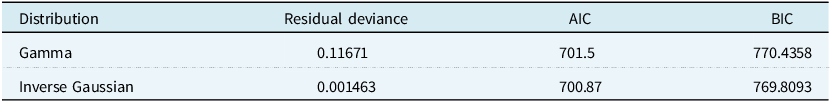
Given its continuous, bounded nature, the VAS was evaluated for model fit using both Gamma and inverse Gaussian distributions. Preliminary comparisons based on residual deviance, AIC, and BIC indicated that the inverse Gaussian model provided superior fit (Table 1), consistent with literature recommending its use in right-skewed continuous health outcomes (Wedderburn, Reference Wedderburn1974; Zuur et al., Reference Zuur, Ieno, Walker, Saveliev, Smith, Zuur, Ieno, Walker, Saveliev and Smith2009).
Table 1. Gamma and inverse Gaussian link model comparison

Although the AIC and BIC values for the Gamma and inverse Gaussian candidates were extremely close (AIC: 701.50 vs 700.87; BIC: 770.41 vs 769.81), this is expected given that both models were fitted to the same dataset with identical covariates and similar parameterisation. Small differences in AIC/BIC are typical when two exponential-family models have comparable likelihood structure. In this context, model choice should not rely solely on information criteria but also on distributional fit. The inverse Gaussian model produced a substantially lower residual deviance (0.00146 vs 0.11671 for the Gamma), indicating materially better alignment with the observed VAS distribution. Diagnostics further favoured the inverse Gaussian specification: residual plots showed improved variance stability, no overdispersion was detected, and bootstrap validation demonstrated stronger predictive robustness. Taken together, these features provide additional justification for selecting the inverse Gaussian distribution despite the marginal difference in AIC/BIC, as it more accurately reflects the skewness and dispersion characteristics of VAS responses in this cohort
4.2. Model Selection and Variable Significance
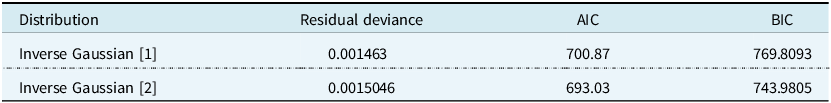
All variables were initially included in a full model using an inverse Gaussian specification. A backward stepwise selection process was applied to retain only statistically significant predictors at the 5% and 10% levels.
The refined model (presented in Table 2 as inverse Gaussian [2]) demonstrated improved parsimony with a lower AIC and BIC compared to the full specification.
Table 2. Gamma model comparison following backwards selection

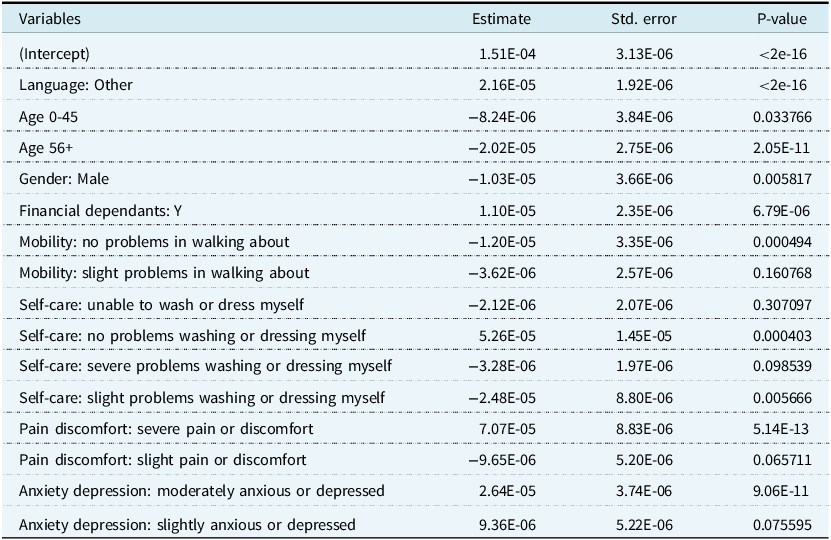
Key predictors retained in the final model included home language, age group, gender, financial dependency, and several EQ-5D-5L domains. Full model coefficients and p-values are provided in Table 3 (final model).
Table 3. Model Coefficients for inverse Gaussian [2] following backwards selection, where $\lambda = 0.0001150068$

These findings confirm that demographic characteristics play a significant role in explaining variation in self-reported health, alongside physical and psychological functioning. In particular, respondents who were females aged between 45 and 56 and financially responsible for others consistently rated their VAS scores higher, suggesting the existence of distinct utility perceptions tied to demographic and socio-economic conditions.
4.3. Diagnostic Evaluation
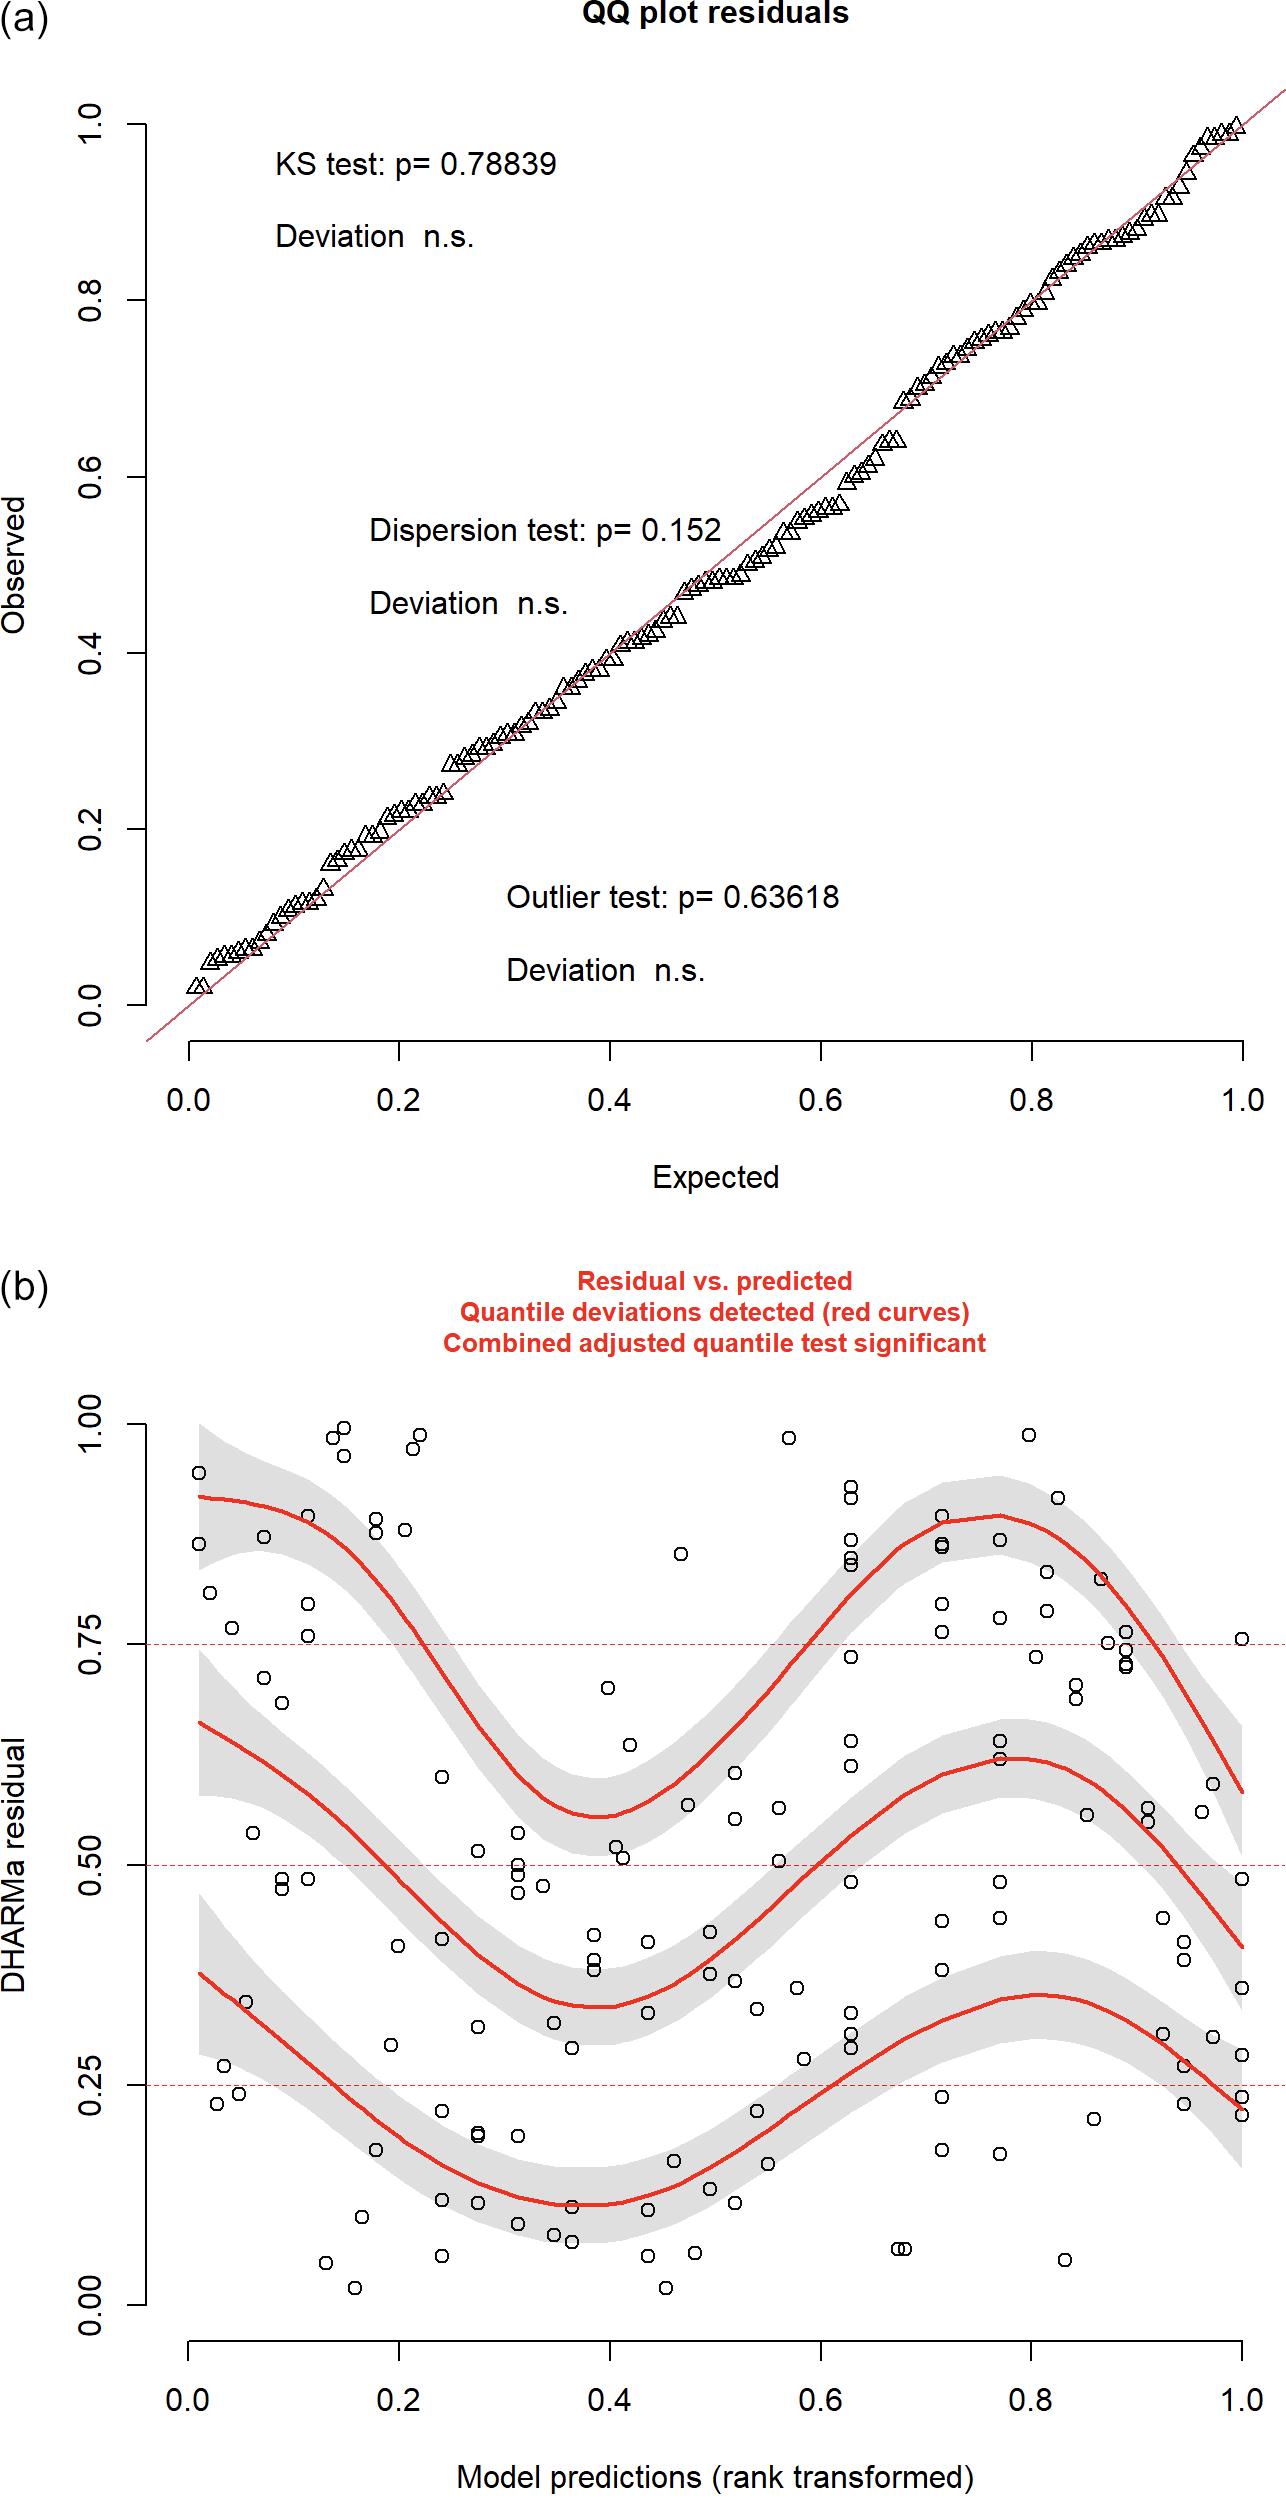
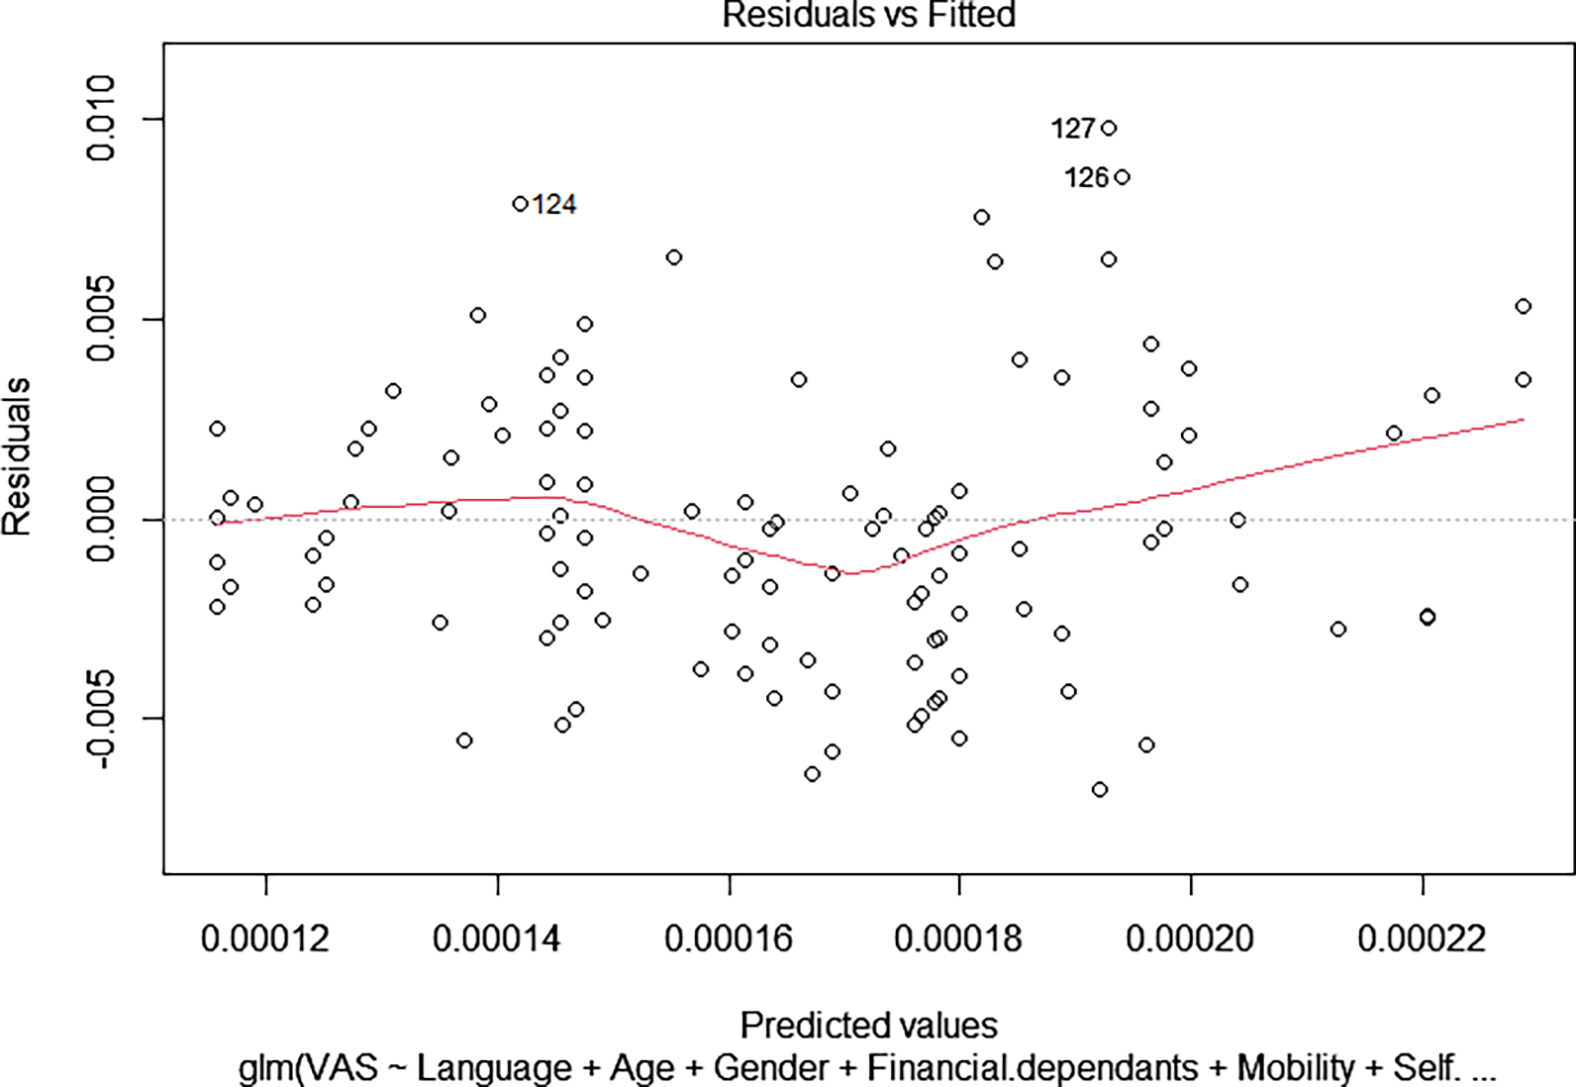
Following model selection, a suite of diagnostics was conducted to assess the robustness and validity of the final inverse Gaussian Generalised Linear Model (GLM). Residual analyses, visualised through QQ plots and residuals versus fitted values (Figure 2), indicate approximate normality and acceptable model fit (Carruthers et al., Reference Carruthers, Lewis, McCue and Westley2008). Some banding patterns are visible in the residuals, suggesting potential unexplained variance, yet no strong violations of linearity or systematic heteroscedasticity were detected (Zheng, Reference Zheng2000).

Figure 2. R plot of DHARMa residuals showing (a) QQ plot residuals and (b) residuals vs predicted Values with light banding.
The Kolmogorov–Smirnov (K–S) test failed to reject the null hypothesis that residuals follow an inverse Gaussian distribution, supporting the appropriateness of the selected error structure (Berger & Zhou, Reference Berger and Zhou2014).
The model also passed tests for dispersion and outlier sensitivity: the deviance-to-degrees-of-freedom ratio was 0.0000114, well below 1, confirming the absence of overdispersion and validating the assumption of variance proportionality inherent in the inverse Gaussian family (Sakate & Kashid, Reference Sakate and Kashid2014).
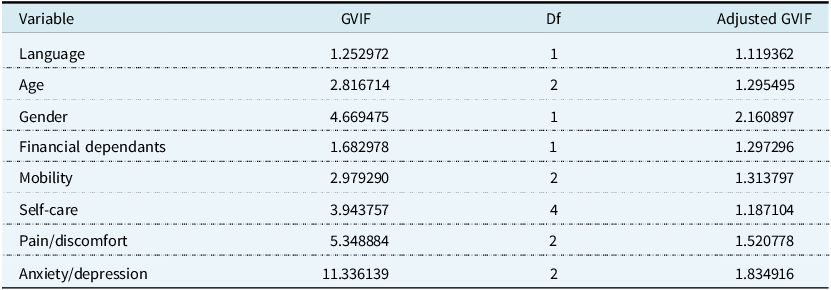
To assess predictor independence, Variance Inflation Factors (VIFs) were computed. All adjusted GVIF values fell well below the commonly accepted threshold of 5, with the highest being 1.83 for the anxiety/depression domain (likely attributable to its multi-level categorical nature) as shown in Table 4. This indicates no evidence of problematic multicollinearity (Dormann et al., Reference Dormann, Elith, Bacher, Buchmann, Carl, Carré, Marquéz, Gruber, Lafourcade, Leitão and Münkemüller2013).
Table 4. Variance Inflation Factor results showing no evidence of problematic multicollinearity

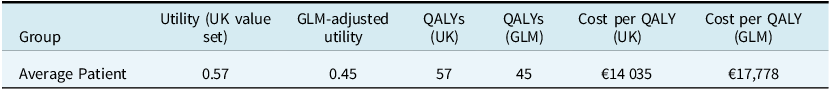
Table 5. Applied use case for QALY estimation using standard UK value set and GLM-adjusted utility

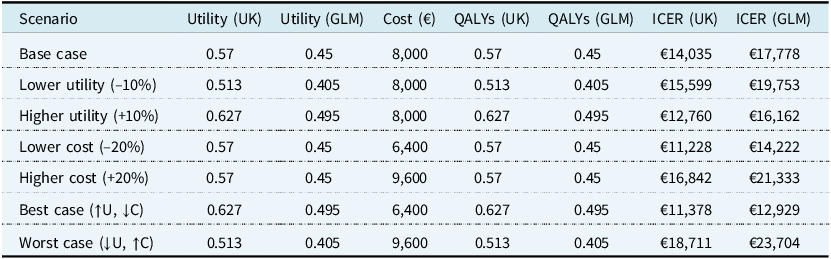
Table 6. Sensitivity analysis conducted on utility scores and cost

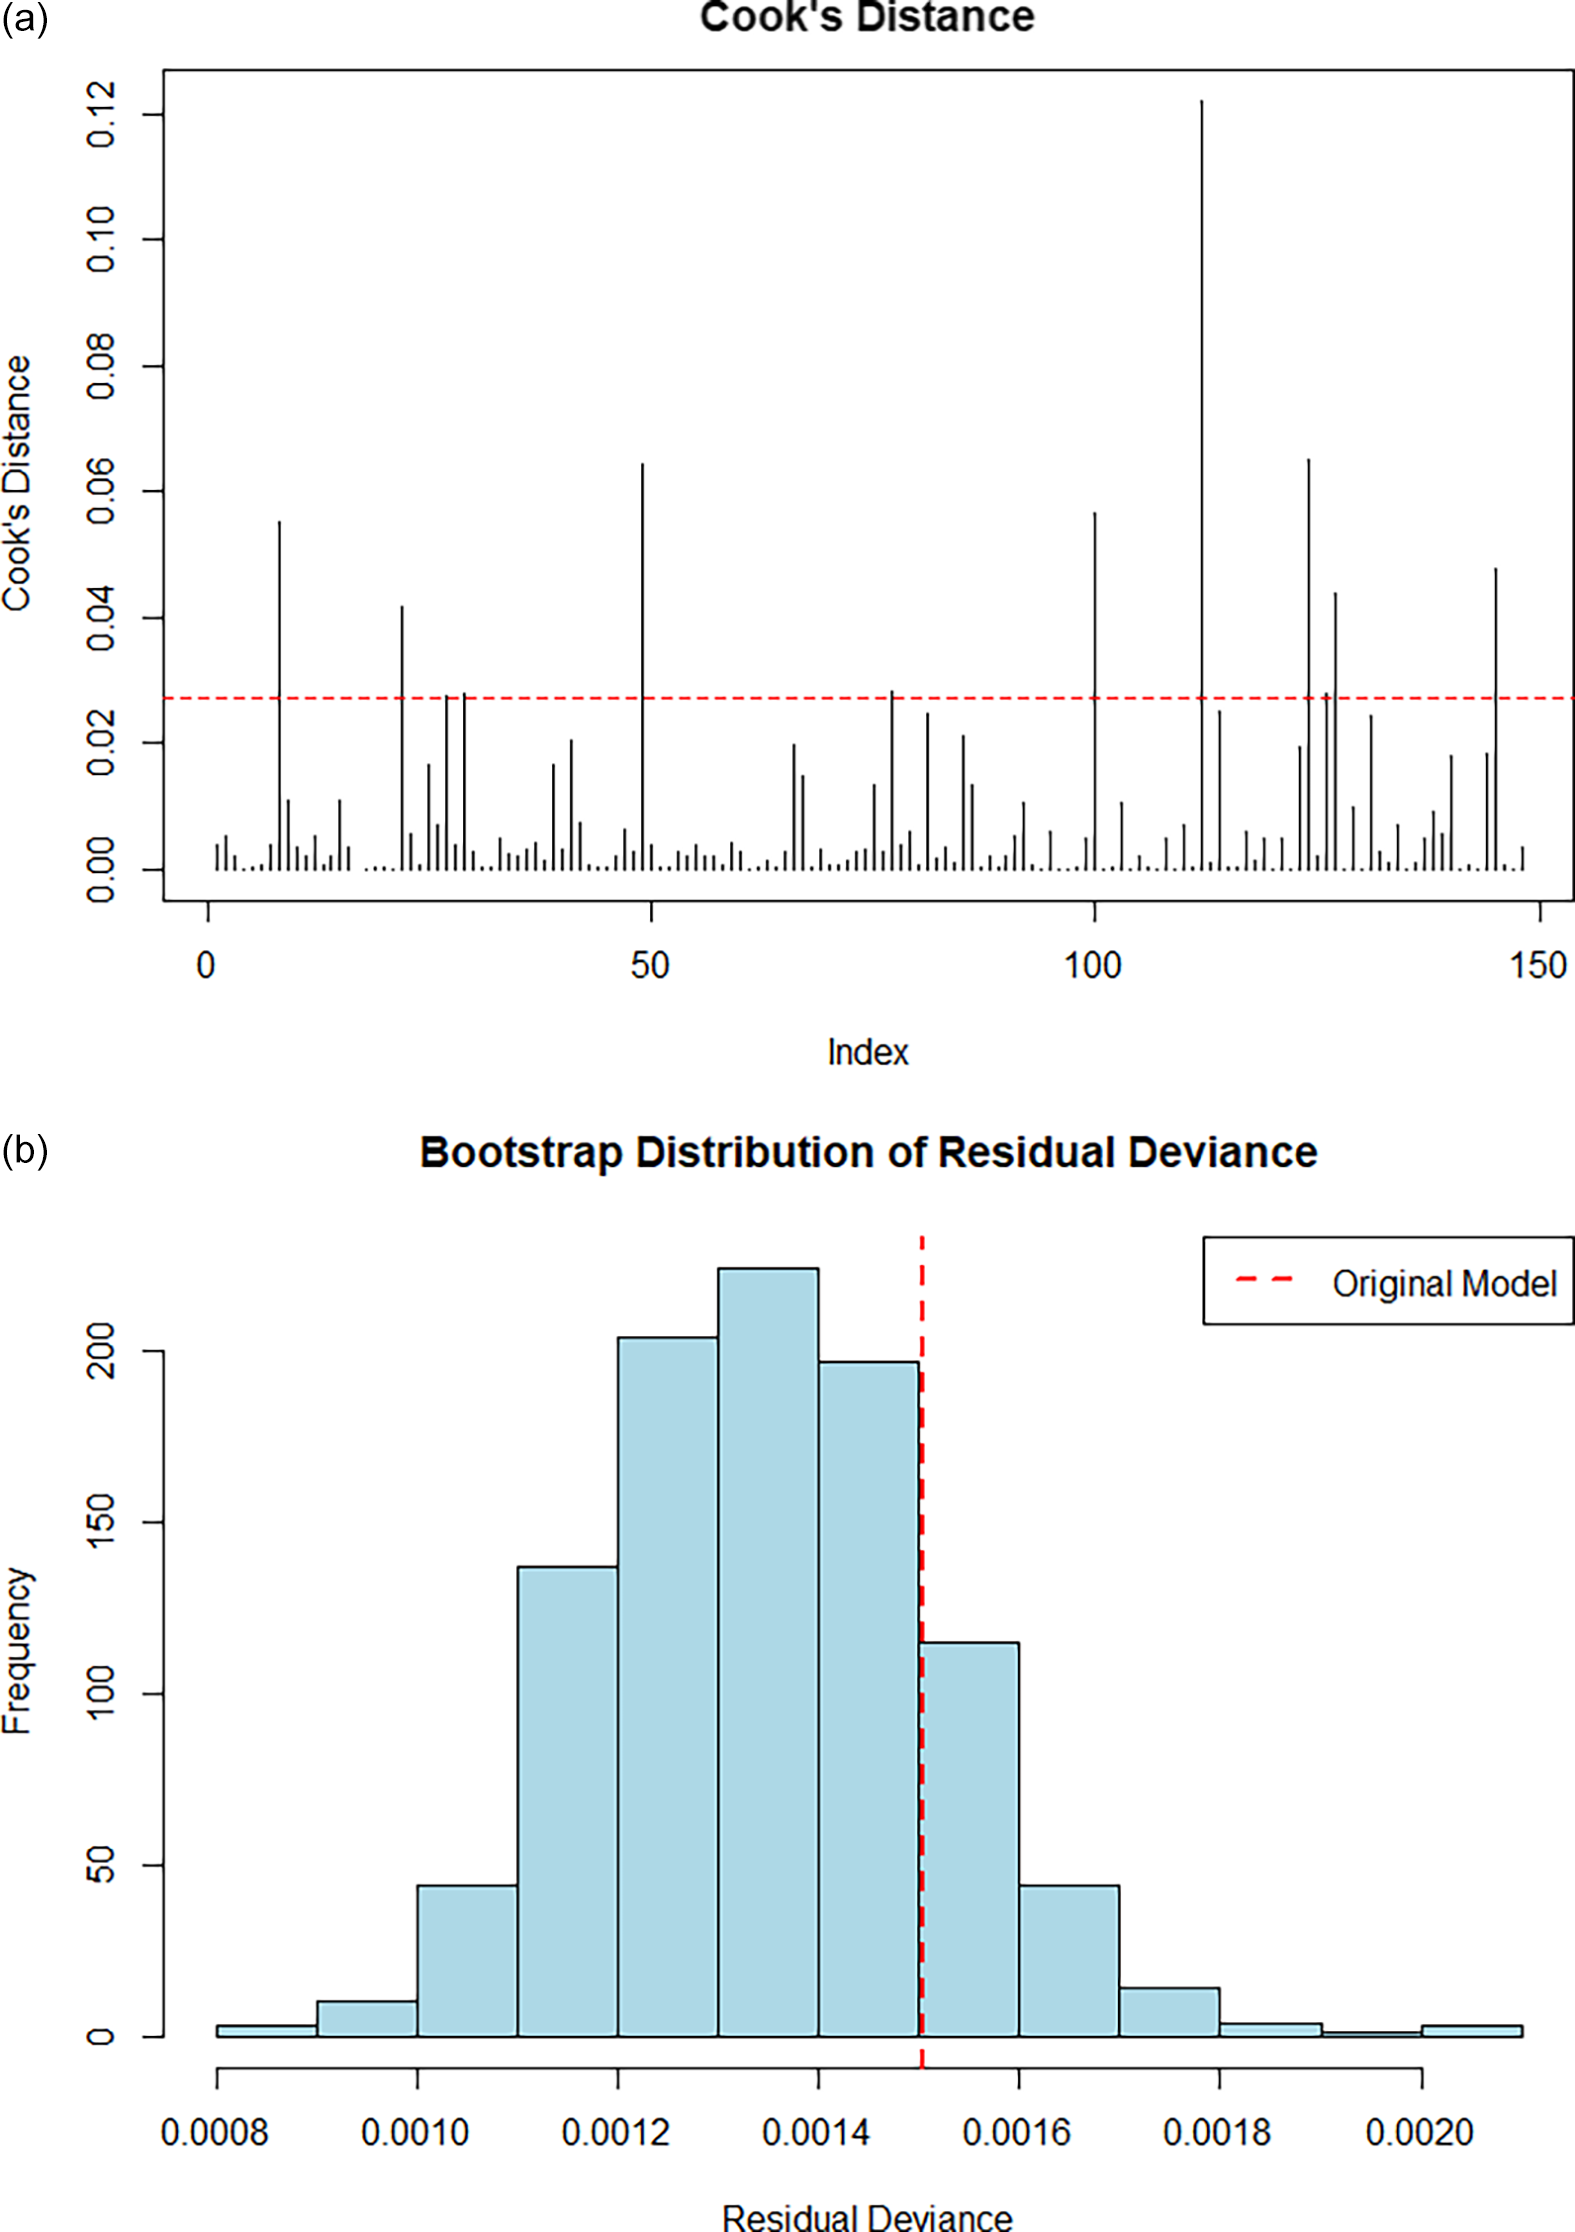
Figure 3 shows Rplot residuals compared against fitted values highlighting approximate normality and model fit. Figure 4(a) shows a Cook’s distance analysis conducted to identify potentially influential data points. No observations approached a critical influence threshold (D > 0.5), and only a few exceeded the conventional 4/n limit (0.027), suggesting that model coefficients are not unduly influenced by individual data points (Kim & Storer, Reference Kim and Storer1996).

Figure 3. Rplot residuals versus fitted values showing approximate normality and acceptable model fit.

Figure 4. (a) Cook’s Distance Rplot showing model coefficients not unduly influenced by individual data points and (b) Bootstrap distribution of residual deviance indicating model not overly sensitive to sampling variation.
Model robustness was further evaluated via non-parametric bootstrapping shown in Figure 4(b). A distribution of residual deviances from 1,000 bootstrap replicates confirmed that the observed deviance lies comfortably within the central region of the empirical distribution. The bell-shaped, symmetric spread supports the inference that the model is not overly sensitive to sampling variation (Sillabutra et al., Reference Sillabutra, Kitidamrongsuk, Viwatwongkasem, Ujeh, Sae-Tang and Donjdee2016).
The link test confirmed the adequacy of model specification: the predicted value was statistically significant (p < 0.001), whereas its squared term was not (p = 0.175), suggesting no material omitted non-linear relationships (Pregibon, Reference Pregibon1980). The residual deviance (0.00149) and AIC (665.14) from the auxiliary regression further reinforce model soundness.
Finally, a pseudo R-squared was estimated using log-likelihood ratios between the full and null models, yielding a value of 0.338. This implies that the model accounts for approximately 34% of the variation in log-likelihood, which is considered reasonable for patient-reported health data using GLMs (McFadden, Reference McFadden1987).
Overall, the diagnostics affirm the statistical credibility and practical stability of the selected inverse Gaussian model. The combination of low multicollinearity, strong distributional fit, acceptable explanatory power, and bootstrapped robustness suggest that the model is appropriately specified and suitable for applications such as cost-effectiveness or budget impact modelling.
4.4. Interpretation and Actuarial Relevance
These results demonstrate that utility valuation is not uniform across populations but rather it is influenced by underlying socio-demographic traits. This has direct implications for cost-effectiveness modelling, premium rating, and risk adjustment. For actuaries involved in health system design, these findings support the case for stratified utility modelling, enabling more equitable allocation frameworks and more precise predictive tools for health valuation under budget constraints.
The inverse Gaussian [2] model can be used to generate predicted VAS scores across any combination of demographic and EQ-5D-5L states, forming the basis for segmented utility curves. Such curves can feed directly into ICER calculations and health economic evaluations, especially in systems where equity and demographic diversity are central policy concerns (such as in South Africa and increasingly in the UK).
5. Applied Use Case: Budget Impact of Utility Variation in NSCLC Patients
To demonstrate the practical relevance of stratified utility estimation, we present a simplified BIA using the utility curves generated in this study. The goal is to illustrate how incorporating demographic-adjusted utility values can influence treatment valuation and funding decisions for stage IV NSCLC patients.
We assume a fixed cohort of 100 patients with PD-L1 <50% treated with a first-line immunotherapy regimen. For simplicity, we model two scenarios:
-
Scenario A: Standard utility weight of 0.57 is applied to all patients (reflecting UK-derived EQ-5D-3L utility commonly used in global HTAs for NSCLC).
-
Scenario B: Utility weights are adjusted using the GLM-derived VAS scores stratified by key demographics (as per the inverse Gaussian [2] model).
Assume:
-
Treatment cost per patient (annual): €45,000
-
Standard of care cost: €37,000
-
Incremental cost: €8,000
-
Time horizon: 1 year
-
QALYs = Utility × 1 year
-
Cost-effectiveness threshold: €15,000 per QALY
Under traditional utility assumptions (Scenario A), the intervention appears borderline cost-effective at €14,035 per QALY. However, using the GLM-based VAS predictors (Scenario B), reflecting lower self-perceived health in the target cohort, the intervention appears less cost-effective at €17,778 per QALY.
The budgetary implications are even more significant when stratifying by demographic group. For example:
-
Patients aged over 56, with a mean adjusted utility of, say, 0.40, would incur an estimated cost per QALY of €20,000.
-
Patients with financial dependants, reporting higher perceived utility (say 0.52), would show a more favourable cost per QALY of €15,385.
This example illustrates how demographic-adjusted utility modelling can meaningfully alter cost-effectiveness results, particularly in systems with limited budgets and heterogeneous populations. In actuarial applications, such models can support differentiated pricing, equity-weighted resource allocation, or population segmentation for value-based funding decisions. Such stratified utility analysis could enhance reimbursement policy design and inform premium loading strategies in risk-rated private health markets or risk equalisation models.
5.1. Applied Sensitivity Analysis: Budget Impact of Utility Variation in NSCLC Patients
To further demonstrate the practical actuarial application of GLM-adjusted utility estimates, a univariate sensitivity analysis was conducted. This analysis varied both treatment cost and utility values for Stage IV NSCLC patients with PD-L1 <50%, comparing the conventional UK EQ-5D-3L crosswalk utility weights with the demographically adjusted values derived from this study’s GLM model.
The base case assumed a treatment cost of €45,000 and comparator cost of €37,000, resulting in an incremental cost of €8,000. Using the UK value set utility (0.57) yielded a cost per QALY of €14,035. In contrast, the GLM-adjusted utility (0.45) resulted in a cost per QALY of €17,778. These values illustrate how utility specification can materially affect cost-effectiveness conclusions (Table 5).
Sensitivity testing was performed in Table 6 by varying utility values by ±10% and treatment costs by ±20%. A best-case scenario (higher utility, lower cost) produced cost per QALY figures of €11,378 (UK) and €12,929 (GLM), whereas a worst-case scenario (lower utility, higher cost) resulted in €18,711 (UK) and €23,704 (GLM). These findings reinforce the importance of robust, context-sensitive utility functions in accurately estimating health economic outcomes.
From an actuarial perspective, this modelling approach highlights how demographic-adjusted utilities can materially impact value-for-money thresholds. It supports the inclusion of structured population risk modelling in healthcare evaluations, which is particularly valuable for budget impact modelling, benefit design, and policy recommendations in both public and private payer environments.
6. Discussion and Conclusions
This paper illustrates how actuaries can enhance health economic models through statistically grounded utility estimation and scenario-based budget impact modelling, offering decision-relevant outputs for HTA and payer policy. This study demonstrates the application of an enhanced EQ-5D-5L framework, incorporating demographic and socio-economic characteristics into the modelling of self-reported health status among a cohort of patients with advanced NSCLC in South Africa. Using a generalised linear modelling approach with an inverse Gaussian specification, the analysis provides empirical evidence that variables such as age, home language, financial dependency, and gender significantly influence patient-perceived health, as measured by the Visual Analogue Scale (VAS).
From a methodological standpoint, the inverse Gaussian distribution was selected as the best-fitting model based on deviance, AIC, and BIC. The resulting regression model permits the generation of predicted utility values for any combination of EQ-5D-5L and demographic inputs, thereby enabling the construction of demographically stratified utility curves. This is particularly relevant for cost-utility analyses, where the assumption of a homogeneous utility function across all population segments may distort estimates of treatment value or misguide funding decisions.
The integration of demographic factors into utility estimation aligns with a growing recognition internationally that patient preferences are shaped by social context, access to care, and cultural perceptions of health. While the present analysis is based on a South African cohort, the modelling framework is generalisable to other jurisdictions, including the UK, where the NHS increasingly prioritises equity-informed health technology assessments (HTAs) and outcome-based commissioning. The methodology is particularly well-suited to health systems with diverse, multi-ethnic populations, where uniform valuation of health states may obscure meaningful variation in health-related quality of life.
For actuaries engaged in healthcare financing, reimbursement design, or public sector modelling, these findings underscore the value of incorporating heterogeneity into utility modelling. Such models can inform ICER calculations, risk adjustment protocols, and benefit-cost analyses where distributional fairness and resource optimisation must be balanced. The actuarial profession, with its strengths in modelling population risk and uncertainty, is well-positioned to contribute meaningfully to the evolution of HTA methodologies.
This research should be viewed as proof-of-concept or a pilot study. While the sample size is modest and limited to a specific disease stage, the analytical structure and empirical findings are promising. Future work could build upon this by extending the sample, incorporating additional socio-economic variables (e.g., education or income), or validating the model in other clinical settings. Similarly, further exploration of alternative link functions or mixed models may yield additional insight into the non-linear dynamics of health perception.
In conclusion, this study advances the case for demographic-adjusted utility estimation within actuarial models of health economics. It highlights both the feasibility and necessity of integrating social and behavioural dimensions into health valuation frameworks, particularly in systems where equity, affordability, and evidence-based resource allocation are fundamental goals. The proposed methodology contributes to the growing actuarial literature on health utility modelling and offers a scalable approach for supporting value-based care strategies across global health systems.
6.1. Future Research
Several opportunities exist to extend this work. The inclusion of additional socio-economic covariates such as income, education, employment status, or urban/rural location may enhance the model’s explanatory power and enable more granular stratification. As the sample expands, the introduction of regional indicators could allow for spatially segmented models, capturing variation in utility that correlates with provincial differences in wealth, service access, and population composition.
Another important next step is to incorporate these segmented utility functions into full cost-utility analyses, allowing for estimation of QALYs that are sensitive to population subgroup characteristics. This would enable a more equitable and realistic calculation of ICERs and support budget impact assessments that are aligned with the realities of public and private healthcare funding.
Moreover, the methodology outlined in this paper can be extended to simulate entire treatment journeys, incorporating multiple interventions, comorbidities, and patient transitions. Such lifecycle models could significantly enhance the actuarial modelling of disease burden, intervention sequencing, and system-wide cost-effectiveness.
Finally, the EQ-5D-5L dataset developed here provides a foundational platform for health economic modelling in the South African context. It may be used to inform both private sector funding decisions and the emerging design of the country’s proposed NHI scheme. More broadly, it offers a template for actuaries seeking to integrate statistical modelling, population demographics, and patient preferences into health valuation frameworks across global settings.
Acknowledgements
Portions of the text, particularly in the formulation of technical explanations, were developed with the assistance of OpenAI’s ChatGPT (version GPT-4, accessed via ChatGPT Pro at https://chat.openai.com, June 2025). The tool was used to support editing for clarity and tone, and refining methodological descriptions consistent with publication standards. No text or data were submitted to the model beyond anonymised and de-identified statistical summaries, and all analysis and interpretation were conducted independently by the authors. The AI tool was not used to generate original ideas or conclusions, and all content has been reviewed and verified by the authors. Data availability statement
This study received ethical clearance from the Human Research Ethics Committee (Non-Medical) at the University of the Witwatersrand for the project titled “Adaptation of Global HTA Models for Application in South Africa Using Analytics Techniques”. Approval was granted under protocol number H22/04/30 in accordance with the Declaration of Helsinki, with clearance valid from April 2022 to 23 October 2025. The ethical waiver was formally granted on 22 April 2022.
Data and code can be made available on request.
Funding statement
No funding was received to complete this research.
Competing interests
The authors are not aware of any competing interests.


 Open access