Nomenclature
- A
-
area (m2)
- b
-
wing span (m)
- C L
-
lift coefficient (-)
- c p
-
specific heat of air (J/(kg×K))
- D i
-
lift-induced drag (N)
- E
-
Oswald efficiency factor (-)
- H
-
flight altitude (km)
- h
-
heat transfer coefficient (W/(m2×K))
- k
-
thermal conductivity (W/(m×K))
- L
-
lift (N)
- M
-
Mach number (-)
- P
-
pressure (N/m2)
- q
-
wall heat flux (W/m2)
- T
-
temperature (K)
- V
-
velocity (m/s)
- Vol
-
volume (m3)
- Vol 1
-
volume of geometry without TPS (m3)
- Vol 2
-
volume of TPS when direction of thickness is outside (m3)
- Vol 3
-
volume of TPS when direction of thickness is inside (m3)
- Vol 4
-
inner volume of vehicle geometry when direction of thickness of TPS is inside (m3)
- x
-
distance along SBLE of vehicle (m)
- x a
-
distance along axis of vehicle from forward stagnation point (m)
- x b
-
distance along vehicle body from forward stagnation point (m)
- $\bar{x}$
-
dimensionless distance along SBLE (-)
- y
-
distance in y-direction (m)
- y b
-
distance along contact wall starting from inlet of fluid domain (m)
Greek symbols
- $\varepsilon$
-
emissivity (-)
- $\mu$
$\mu$
-
viscosity (kg/m-s)
- $\rho$
-
density (kg/m3)
- $\varLambda$
-
sweep-back angle (deg.)
Subscripts
- drag-min
-
drag minimised
- HT-min
-
heat transfer minimised
- s
-
surface
- w
-
wall
- ∞
-
free stream
Abbreviations
- AOA
-
angle-of-attack
- AR
-
aspect ratio
- HV
-
hypersonic vehicle
- PICA
-
phenolic-impregnated-carbon-ablator
- RHV
-
reusable hypersonic vehicle
- SBLE
-
swept-back leading edge
- SIRCA
-
silicone-impregnated-reusable-ceramic-ablator
- TPS
-
thermal protection system
1.0 Introduction
Reusable hypersonic vehicles (RHV) experience high temperatures due to the aerodynamic heating, as they fly at high speed (M
![]() $_{\infty}$
$_{\infty}$
![]() $\gt$
5) [Reference Smith and Asker1]. Aerodynamic heating is mainly a result of friction between the outer surface of the vehicle body and flowing air [Reference Thornton2]. Aerodynamic drag experienced by the vehicle is proportional to the square of free stream velocity, but aerodynamic heat generated is proportional to the cube of free stream velocity [Reference Anderson3]. Radiation cooling is insufficient for tackling heat generated due to friction at hypersonic velocity, so active cooling was studied to ensure the survivability of vehicles from high-temperature rise [Reference Ferraiuolo, Riccio, Gigliotti, Tescione, Gardi and Marino4]. As RHV flies at hypersonic velocity for most of its path, aerodynamic heating becomes a critical parameter while designing the configuration and thermal protection system (TPS) for RHV. Passive TPS materials are divided into ablative and insulative, depending on the method to resist heat flow to the body of the vehicle. The ablative TPS is mostly employed in stagnation and SBLE regions, as it absorbs a considerable amount of heat through a phase transition. But in case of RHV, ablator is used as reusable material as temperature of TPS does not exceed the melting point of ablator material. In the case of RHV, reusable ablative TPS materials such as phenolic-impregnated carbon ablator (PICA) [Reference Tran, Johnson, Rasky, Hui, Hsu and Chen5] and silicone-impregnated reusable ceramic ablator (SIRCA) [Reference Tran, Rasky and Esfahani6] are employed. The combination of Saffil and PICA as insulative and ablative TPS materials gives better results in resisting the heat received by vehicles [Reference Kumar and Mahulikar7].
$\gt$
5) [Reference Smith and Asker1]. Aerodynamic heating is mainly a result of friction between the outer surface of the vehicle body and flowing air [Reference Thornton2]. Aerodynamic drag experienced by the vehicle is proportional to the square of free stream velocity, but aerodynamic heat generated is proportional to the cube of free stream velocity [Reference Anderson3]. Radiation cooling is insufficient for tackling heat generated due to friction at hypersonic velocity, so active cooling was studied to ensure the survivability of vehicles from high-temperature rise [Reference Ferraiuolo, Riccio, Gigliotti, Tescione, Gardi and Marino4]. As RHV flies at hypersonic velocity for most of its path, aerodynamic heating becomes a critical parameter while designing the configuration and thermal protection system (TPS) for RHV. Passive TPS materials are divided into ablative and insulative, depending on the method to resist heat flow to the body of the vehicle. The ablative TPS is mostly employed in stagnation and SBLE regions, as it absorbs a considerable amount of heat through a phase transition. But in case of RHV, ablator is used as reusable material as temperature of TPS does not exceed the melting point of ablator material. In the case of RHV, reusable ablative TPS materials such as phenolic-impregnated carbon ablator (PICA) [Reference Tran, Johnson, Rasky, Hui, Hsu and Chen5] and silicone-impregnated reusable ceramic ablator (SIRCA) [Reference Tran, Rasky and Esfahani6] are employed. The combination of Saffil and PICA as insulative and ablative TPS materials gives better results in resisting the heat received by vehicles [Reference Kumar and Mahulikar7].
1.1 Motivation
It is essential to design TPS for RHV to prevent temperature rise caused by aerodynamic heating from reaching the spacecraft’s interior structure [Reference Ferraiuolo and Manca8]. Aerothermal study of RHV to design the TPS becomes a key aspect for the survivability of the vehicle and to prevent overdesign of the vehicle. In identical environmental conditions, heat received from aerodynamic heating mainly depends on the vehicle’s geometry (nose radius, sweepback angle, radius of SBLE, etc.). The sweepback angle (
![]() $\varLambda$
) of vehicle plays a very important role in aerodynamic heat generation and heat received by vehicle.
$\varLambda$
) of vehicle plays a very important role in aerodynamic heat generation and heat received by vehicle.
Mahulikar (2005) proposed a heat transfer minimised sweepback angle (
![]() $\varLambda$
HT-min
), which is different from drag-minimised sweepback angle (
$\varLambda$
HT-min
), which is different from drag-minimised sweepback angle (
![]() $\varLambda$
Drag-min
) [Reference Mahulikar9]. In the case of
$\varLambda$
Drag-min
) [Reference Mahulikar9]. In the case of
![]() $\varLambda$
Drag-min
, the heat generated due to drag experienced by the vehicle is minimal. However, in the case of
$\varLambda$
Drag-min
, the heat generated due to drag experienced by the vehicle is minimal. However, in the case of
![]() $\varLambda$
HT-min
, heat generated is not at a minimum, although heat received by the vehicle is. So the temperature rise at the outer surface of TPS is minimal for
$\varLambda$
HT-min
, heat generated is not at a minimum, although heat received by the vehicle is. So the temperature rise at the outer surface of TPS is minimal for
![]() $\varLambda$
HT-min
as compared to other
$\varLambda$
HT-min
as compared to other
![]() $\varLambda$
. The RHV design at
$\varLambda$
. The RHV design at
![]() $\varLambda$
HT-min
can potentially reduce TPS’s weight for same payload [human (in future), electronic equipment] capacity case or increase payload capacity for given overall volume case. Weight of TPS material in both cases massively impacts the overall operational cost of RHV for a given trajectory. So this study is focused on the aerothermal study of RHV at two different sweepback angles to observe the potential to reduce the overall weight of TPS and increase payload capacity.
$\varLambda$
HT-min
can potentially reduce TPS’s weight for same payload [human (in future), electronic equipment] capacity case or increase payload capacity for given overall volume case. Weight of TPS material in both cases massively impacts the overall operational cost of RHV for a given trajectory. So this study is focused on the aerothermal study of RHV at two different sweepback angles to observe the potential to reduce the overall weight of TPS and increase payload capacity.
1.2 Background and review
The main consequence of a blunt forebody on supersonic vehicle is extreme drag. Aerodynamic heating has considerable adverse impact on operation of internal electronics (payload) and leads to a reduction in flight range and an increase in fuel consumption due to TPS weight [Reference Wang and Zhang10]. To reduce TPS and drag for blunted waveriders, large number of opposing jets plays a decent role. Compared to a blunted waverider without a jet, the multiple opposing jets blunted waveriders experience 2.5% increase in lift-to-drag ratio [Reference Ji, Liu, Huang, Li, Meng, Yan and Choubey11]. For M
![]() $_{\infty}$
= 6, in combustion-heated hypersonic wind tunnel, authors observed aerodynamic heating parameters of a stainless-steel blunt cone. According to investigation, surface emissivity has a significant impact, although the nozzle inlet turbulence has little bearing [Reference Zhang, Xu, Ye, Li and Liu12]. For hypersonic leading edge, the impact of supercritical CO2 impingement on internal cooling was studied numerically. Linked numerical simulation was carried out by combining internal impingement cooling, external aerodynamics and external heat transfer [Reference Sargunaraj, Otto, Vesely, Fernandez, Kapat and Viti13]. Two separate high-temperature peaks were seen on the smooth wall of the vehicle’s exterior, while only one peak was seen on wavy wall (W
w
). The W
w
is demonstrated to lower q peak by roughly 13.8% [Reference Zhu, Gu, Si, Chen, Zhu and Lee14].
$_{\infty}$
= 6, in combustion-heated hypersonic wind tunnel, authors observed aerodynamic heating parameters of a stainless-steel blunt cone. According to investigation, surface emissivity has a significant impact, although the nozzle inlet turbulence has little bearing [Reference Zhang, Xu, Ye, Li and Liu12]. For hypersonic leading edge, the impact of supercritical CO2 impingement on internal cooling was studied numerically. Linked numerical simulation was carried out by combining internal impingement cooling, external aerodynamics and external heat transfer [Reference Sargunaraj, Otto, Vesely, Fernandez, Kapat and Viti13]. Two separate high-temperature peaks were seen on the smooth wall of the vehicle’s exterior, while only one peak was seen on wavy wall (W
w
). The W
w
is demonstrated to lower q peak by roughly 13.8% [Reference Zhu, Gu, Si, Chen, Zhu and Lee14].
The authors examined lateral jets injected into an RHV’s blending region in a hypersonic flow. The jet technique improved thermal protection performance while reducing overall drag [Reference Meng, Wang, Shen, Huang, Niu and Yan15]. For HV, supercritical nitrogen is used as a heat sink in the authors’s design for thermal management system, which integrated several cooling approaches [Reference Chen, Wang, Li, Lu and Fang16]. The authors proposed a system in which thermoelectric conversion component and regenerative cooling network both reuse aerodynamic heat associated with HV that is transported by network and dissipated by TPS [Reference Gou, Yan, Hu, Gao and Gong17]. Findings indicated that a rise in equivalent heat transfer coefficient (h) will reduce scale of passive TPS. Transpiration, film, regenerative cooling and their combination are main active cooling techniques needed for the cooling process to be successful over the long term reusable applications [Reference Zhang, Li, Zuo, Qin, Cheng, Feng and Bao18].
For the prediction of local heat flux (q) signals as well as temperature, both linked and decoupled conjugate heat transfer approaches were shown to be equally useful [Reference Sahoo, Kulkarni and Peetala19]. Utilising the inverse approach, the Levenberg-Marquardt method is useful for designing a compact passive TPS for an RHV [Reference Kumar and Mahulikar20]. In real flow, especially when flying for long periods of time, neither the isothermal nor the adiabatic conditions in high-speed flow are adequate as wall boundary condition [Reference Liu and Cao21]. Aero-thermal parameters of two distinct configurations of lifting bodies with the same heat capacity were analysed and compared by the authors. The findings demonstrated that the heat transfer-minimised sweepback idea is crucial to conceptual design of HV [Reference Kumar and Mahulikar22]. For hypersonic laminar boundary layers, the authors’ research examined cooling potency of suggested variable transpiration cooling idea on a flat plate, with an emphasis on mass exchanges at surface [Reference Gulli, Maddalena and Hosder23].
If the total coolant mass-flow rate is constant, constant-linear wall velocity distribution reduces wall q to a minimal level [Reference Hollis, Horvath, Berry, Hamilton, Thompson and Alter24]. Predictions for laminar and turbulent aero heating were made under the wind-tunnel test conditions. For the Navier-Stokes approach and engineering code method, the laminar heating distribution comparisons between forecasts and experimental results were typically within 10% and 25%, respectively [Reference Hollis, Horvath, Berry, Hamilton, Thompson and Alter24]. At RHV’s nose-cap (with passive ablative TPS material), the temperature field history was predicted. The potential for weight reduction is greater when PICA and insulated TPS are used for nose cap than when only ablative TPS is used [Reference Mahulikar, Khurana, Dungarwal, Shevakari, Subramanian and Gujarathi25]. For the flow field surrounding hypersonic slender cone, by using a numerical solution of governing fluid flow equations, authors examined impacts of flow M ∞, angle of sideslip, and AOA on aerodynamic characteristics [Reference Huang, Ma, Wang, Pourkashanian, Ingham, Luo and Lei26].
The effects of aerodynamic heating were examined to find appropriate materials and structures to withstand HV conditions. In the high stratosphere, the possibility of long-period missions, giving brief and recurring times of low gravity with a guaranteed expansive sight of Earth, was examined [Reference Savino, Russo, D’Oriano, Visone, Battipede and Gili27]. The design of hypersonic vehicles with spikes results in meaningful easing in drag and aerodynamic heating [Reference Ahmed and Qin28]. Heating-rate history and peak temperatures over the surface along a profile of flight should be determined in order to design TPS for any HV [Reference Wurster, Riley and Zoby29]. At high Mach numbers, to precisely measure the surface temperature, Frendi presented an overview. To find temperature at the surface, it’s necessary to thoroughly describe the heat transfer process along surface [Reference Frendi30]. Frendi also suggested using a mix of surface radiation and localised surface cooling to cool surfaces. Shilwant and Mahulikar studied an RHV geometry at M ∞ = 5 to M ∞ = 9 to observe temperature behaviour along SBLE for different sweepback angles [Reference Shilwant and Mahulikar31]. At M∞ = 6 and an opposing jet pressure ratio of 18, with opposing jets combined with cylindrical and parabolic cavity geometries, Sudarshan et al. [Reference Sudarshan, Srisha, Jagadeesh and Saravanan32] examined the changes in heat transport and the form of shock surrounding a blunt mass. Also noted in parabolic and cylindrical cavity geometries, the opposing jet injection at the cavity base greatly reduces the cavity region heat flux values by around 31% and 80%, respectively. Wang et al. [Reference Wang, Sun, Huang, Li and Yan33] stated that further research is needed to determine the best ways to transport coolant gas for a counterflowing jet and an energy source for energy deposition in practical engineering applications. The authors [Reference Sudarshan, Deep, Jayaram, Jagadeesh and Saravanan34] noted an increase in the total surface mean heat flux reduction and a considerable alteration in the cavity flow field due to heat deposition. The deposition is achieved by the exothermic reaction of a chromium film coated on the cavity surface. The forward-facing cavity and opposing jet combinatorial system make an appropriate TPS for high-speed vehicles that must fly for extended periods of time and under diverse flow conditions [Reference Lu and Liu35]. The authors found that at M∞ = 6, the non-ablative thermal protection system performs well in reducing shockwave drag and providing thermal protection, as observed through a combination of experimental and numerical methods [Reference Liu and Jiang36]. The nose surface region where the heat flux reduction is observed shifts toward the cavity lip as the length-to-diameter ratio increases, resulting in a larger surface area with reduced heat flux [Reference Sudarshan and Saravanan37]. In heat reduction close to the stagnation point, the parabolic configuration and opposing jet idea outperform the single jet approach [Reference Sun, Guo, Huang, Li and Yan38]. Knight [Reference Knight39] proposed that in order to anticipate drag reduction in canonical configurations, a thorough comparison between ideal and real gas simulations is required. In a hypersonic shock tunnel at moderate angles of attack, a blunt cone with an apex angle of 120° and a forward-facing aerospike with a flat-faced aerodisc are found to reduce drag by more than 50% at a flying Mach number of 5.75 [Reference Menezes, Saravanan and Reddy40]. In order to reduce the production of high wave drag, the authors looked into the usage of the active opposing jet idea in conjunction with geometric modifications to the opposing jet nozzle. Divergent nozzle examples show a significant reduction in drag when compared to a simple blunt body with no nozzle [Reference Bibi, Maqsood, Sherbaz and Dala41].
Measuring temperature and heat fluxes in a wind tunnel in the hypersonic range is extremely difficult and does not yield precise data [Reference Weiland, Longo, Gülhan and Decker42]. Aerothermal studies of the RHV are important from the perspective of vehicle’s survivability without exceeding required usual standards. There are still plenty of alternatives, such as integrated fluid thermal analysis [Reference Zhang, Chen and Liu43], based on C++ [Reference Huang, He and Wang44], thermal modal reconstruction [Reference Chen and Zhao45], wind tunnel [Reference Zhang, Xu, Ye, Li and Liu12], and ANSYS-fluent [Reference Kumar and Mahulikar46], to develop suitable techniques for predicting the aerothermal environment for hypersonic vehicles. Numerical tests were conducted using second, fifth and ninth-order reconstruction approaches for hypersonic flows around a blunted-cone-cylinder configuration [Reference Tissera, Drikakis and Birch47]. The free-stream Mach numbers ranged from 5 to 17.8. The findings indicated that weighted essentially nonoscillatory systems can be unstable for Mach number values more than 10, but they appear to be more accurate than second-order approaches for Mach numbers less than 10. The authors analysed unsteady supersonic and hypersonic flows around spiked-blunt materials, including the impact of flow field initialisation on flow findings [Reference Panaras and Drikakis48]. The study found that the initial flow field has a significant impact on the numerically simulated flow for specific geometries. This includes bifurcations caused by hysteresis effects and the formation of unstable flow modes. The authors created a new shock-kinematic boundary condition that works with both the finite-volume approach and input-output analysis [Reference Cook and Nichols49]. This boundary condition allows for an examination of the receptivity of blunt cones to disturbances in the free stream, taking into account linear interactions between tiny disturbances and shocks. The authors found that neither nose shape nor Mach number significantly affects static-pressure distribution at a specific cone angle [Reference Burke and Curtis50]. The author conducted high-resolution numerical simulations and stability assessments to study the transition of a hypersonic boundary layer over a blunt cone at a 6
![]() $^{\circ}$
angle-of-attack [Reference Chen, Dong, Chen, Xu and Yuan51]. The study noticed two unique transition regions: leeward streamwise vortex-based transition and crossflow transition.
$^{\circ}$
angle-of-attack [Reference Chen, Dong, Chen, Xu and Yuan51]. The study noticed two unique transition regions: leeward streamwise vortex-based transition and crossflow transition.
Traditionally, RHVs are designed at
![]() $\varLambda$
Drag-min
because of the conventional belief that minimum drag results in minimum operational cost. However, there is a different sweepback angle responsible for the vehicle’s minimum temperature rise. If temperature rise is minimum, TPS weight required to ensure survivability will be minimal. A decrease in the weight of TPS can reduce lift-induced drag by the vehicle, which can reduce total drag experienced by the vehicle.
$\varLambda$
Drag-min
because of the conventional belief that minimum drag results in minimum operational cost. However, there is a different sweepback angle responsible for the vehicle’s minimum temperature rise. If temperature rise is minimum, TPS weight required to ensure survivability will be minimal. A decrease in the weight of TPS can reduce lift-induced drag by the vehicle, which can reduce total drag experienced by the vehicle.
1.3 Objective and scope
The primary focus of this study is to reduce the vehicle’s weight, increase payload capacity, and reduce lift-induced drag by appropriate selection of sweepback angle for RHV. Simulations in ANSYS 2020 are used to obtain temperature data, which is used to calculate the required TPS thickness to maintain an inner wall temperature of 323K under identical environmental conditions for
![]() $\varLambda$
Drag-min
and
$\varLambda$
Drag-min
and
![]() $\varLambda$
HT-min
configurations. The study is divided into two cases: (i) constant payload capacity (increase in overall volume), where the direction of TPS thickness is outside, leading to differences in the weight of the TPS for
$\varLambda$
HT-min
configurations. The study is divided into two cases: (i) constant payload capacity (increase in overall volume), where the direction of TPS thickness is outside, leading to differences in the weight of the TPS for
![]() $\varLambda$
Drag-min
and
$\varLambda$
Drag-min
and
![]() $\varLambda$
HT-min
configurations. (ii) Constant overall volume (reduced payload volume), where the direction of TPS thickness is inside for both
$\varLambda$
HT-min
configurations. (ii) Constant overall volume (reduced payload volume), where the direction of TPS thickness is inside for both
![]() $\varLambda$
Drag-min
and
$\varLambda$
Drag-min
and
![]() $\varLambda$
HT-min
configurations. In both cases, the difference in TPS thickness impacts the lift-induced drag for
$\varLambda$
HT-min
configurations. In both cases, the difference in TPS thickness impacts the lift-induced drag for
![]() $\varLambda$
Drag-min
and
$\varLambda$
Drag-min
and
![]() $\varLambda$
HT-min
configurations.
$\varLambda$
HT-min
configurations.
1.4 Layout of the paper
Section 2 presents a methodology for solving the problem of configuration design of reusable hypersonic vehilce (RHV) from aerothermal consideration. Section 2 explains the concepts for percentage weight reduction, increase in payload capacity and lift-induced drag reduction associated with design at
![]() $\varLambda$
HT-min
. Temperature variation along SBLE of vehicle and TPS thickness calculations for
$\varLambda$
HT-min
. Temperature variation along SBLE of vehicle and TPS thickness calculations for
![]() $\varLambda$
HT-min
and
$\varLambda$
HT-min
and
![]() $\varLambda$
Drag-min
are discussed in Section 3. Percentage weight reduction, the percentage increase in payload capacity, and the lift-induced drag with design at
$\varLambda$
Drag-min
are discussed in Section 3. Percentage weight reduction, the percentage increase in payload capacity, and the lift-induced drag with design at
![]() $\varLambda$
HT-min
are also discussed in Section 3. Section 4 includes the summary and conclusion based on the results from Section 3.
$\varLambda$
HT-min
are also discussed in Section 3. Section 4 includes the summary and conclusion based on the results from Section 3.
2.0 Methodology
2.1 Geometry to observe wall temperatures along SBLE
Material, construction, aerodynamic heating and intricate aerodynamics, all contribute to the conceptual design of RHV. Following an air launch, RHV speeds up while ascending and cruising to attain an altitude of about 35km at the appropriate hypersonic velocity.
Geometry considered for the research is 3-D with plane of symmetry, including nose and sweptback leading edge (SBLE). The
![]() $\varLambda$
Drag-min
is responsible for minimum heat generation for a given M
$\varLambda$
Drag-min
is responsible for minimum heat generation for a given M
![]() $_{\infty}$
among all other sweepback angles, as drag experienced by the vehicle is minimum [Reference Mahulikar9]. Hypothesised reusable hypersonic vehicle geometry based on
$_{\infty}$
among all other sweepback angles, as drag experienced by the vehicle is minimum [Reference Mahulikar9]. Hypothesised reusable hypersonic vehicle geometry based on
![]() $\varLambda$
Drag-min
for observing temperature variation along SBLE is generated, as shown in Fig. 1. The heat generation decreases along
$\varLambda$
Drag-min
for observing temperature variation along SBLE is generated, as shown in Fig. 1. The heat generation decreases along
![]() $\varLambda$
, achieves its least value at
$\varLambda$
, achieves its least value at
![]() $\varLambda$
= 70°, and increases with an increase in
$\varLambda$
= 70°, and increases with an increase in
![]() $\varLambda$
beyond
$\varLambda$
beyond
![]() $\varLambda$
= 70°.
$\varLambda$
= 70°.
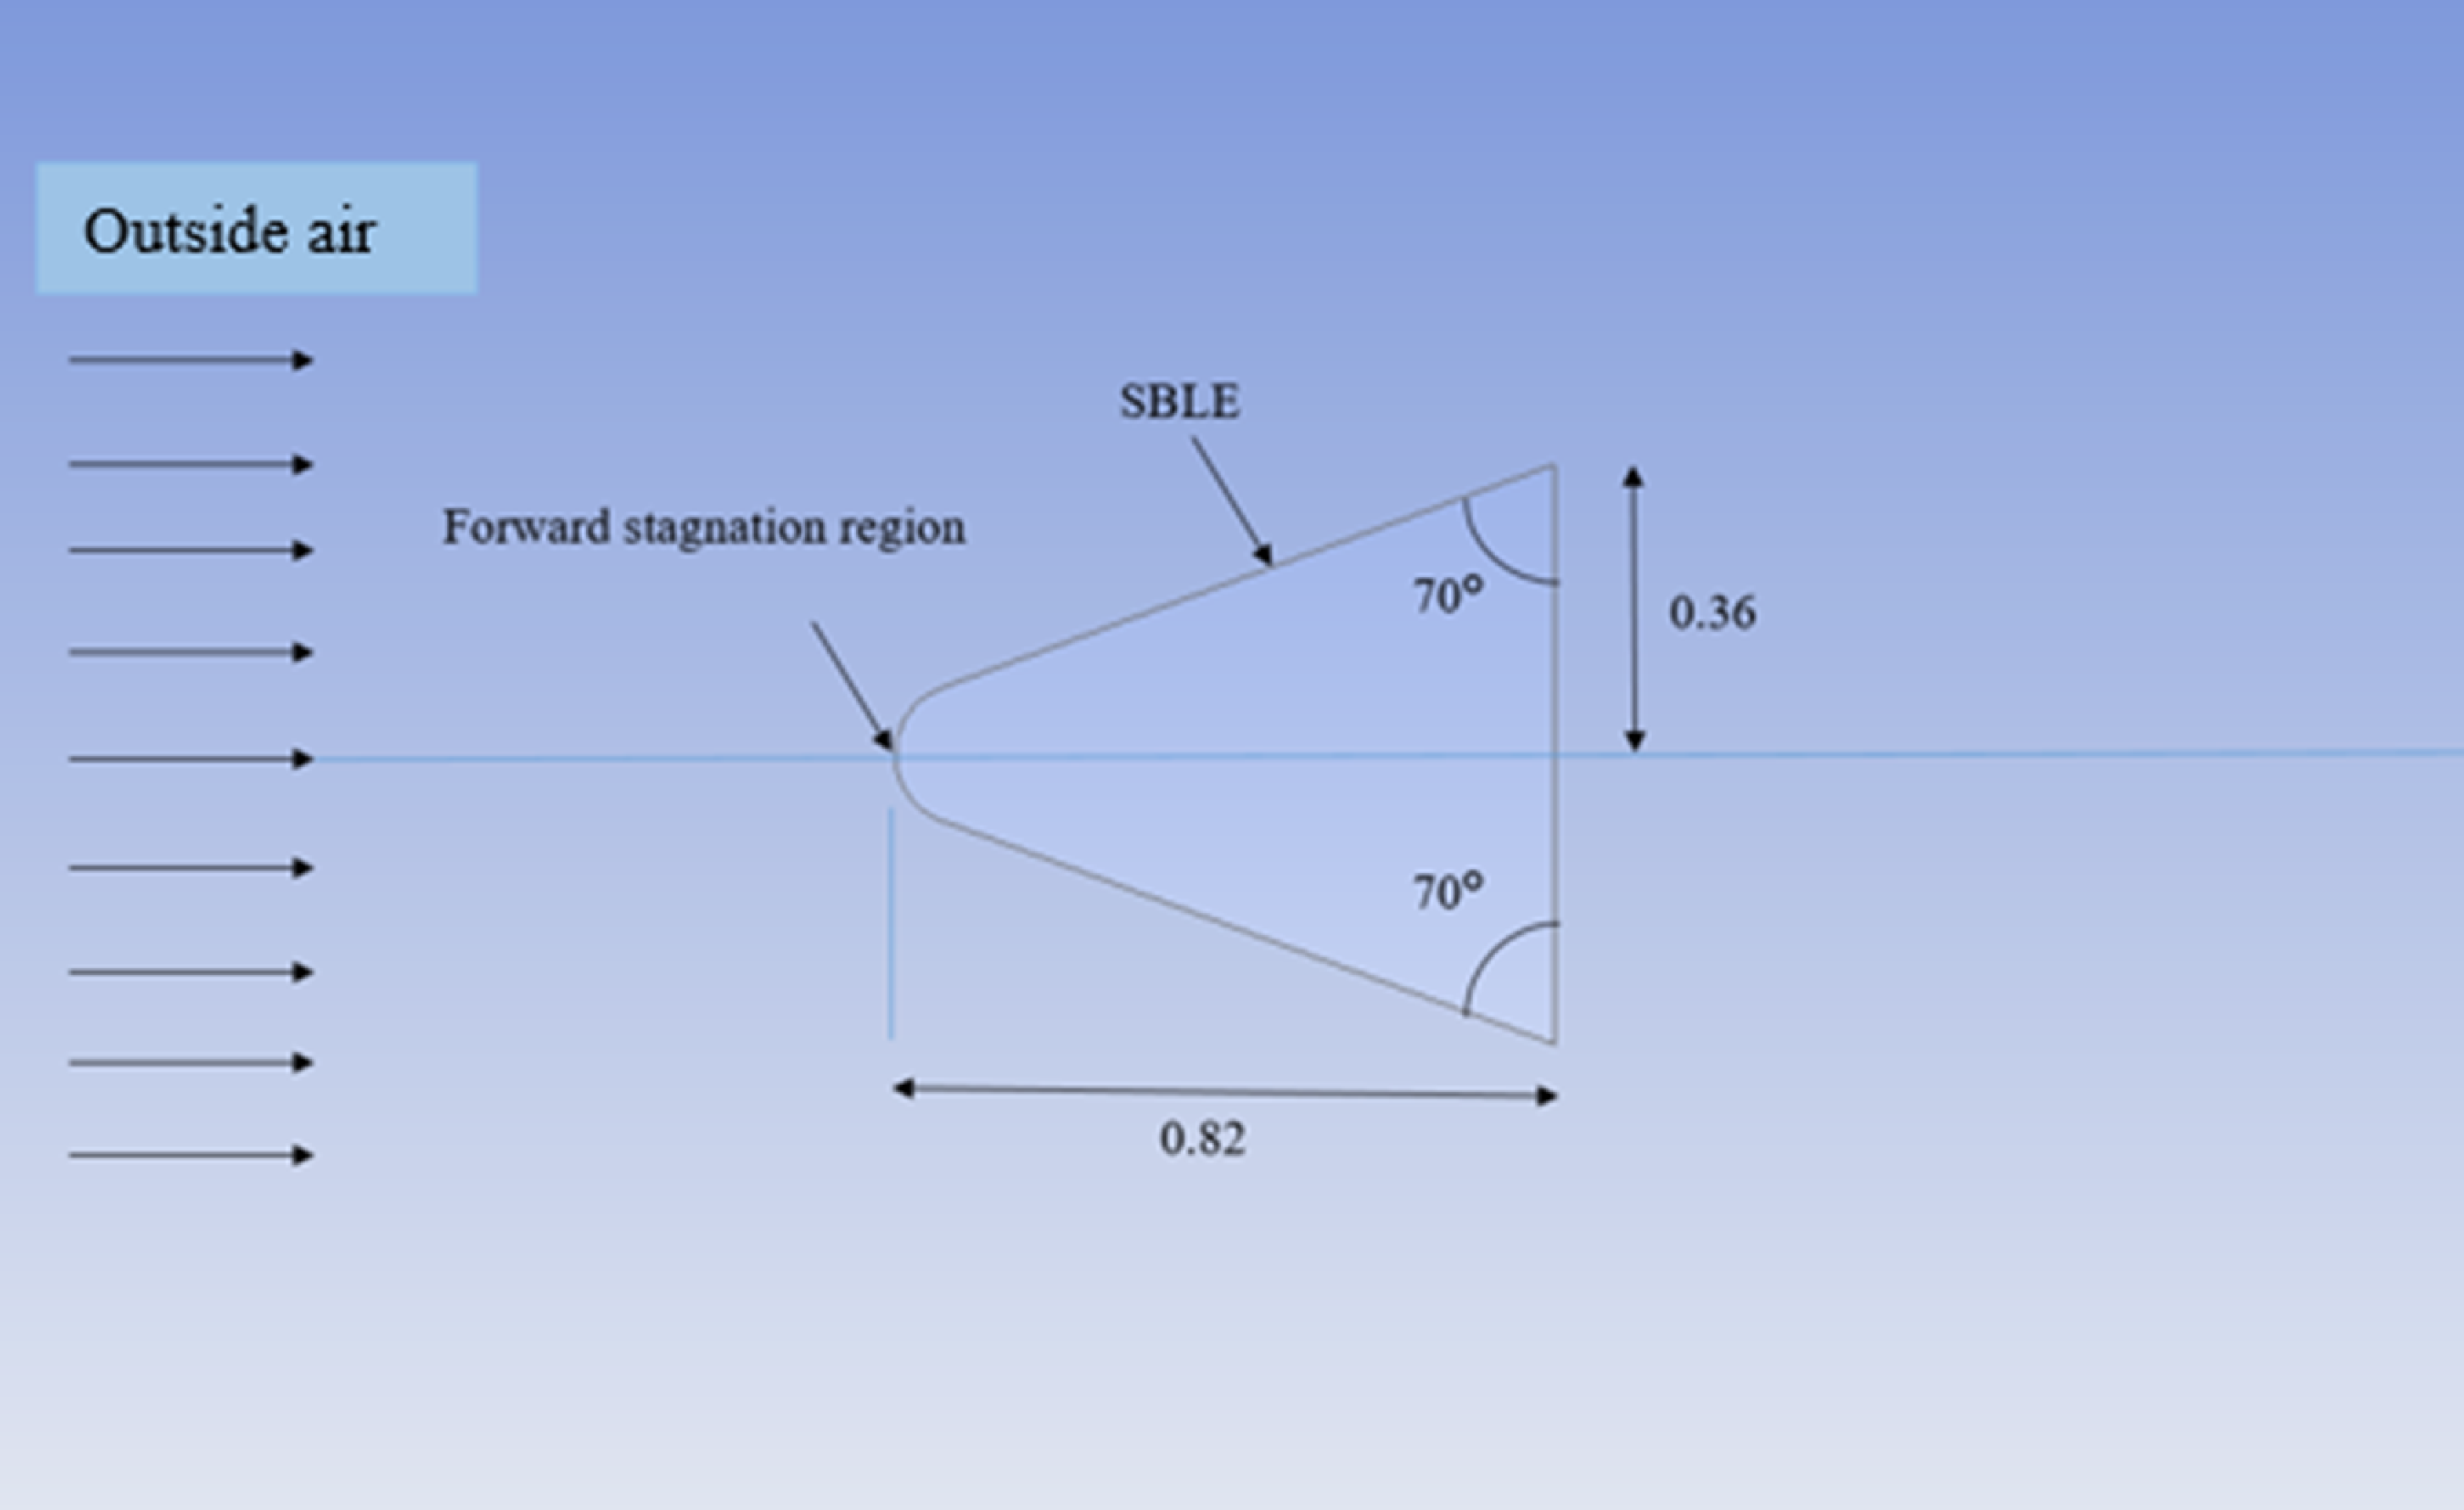
Figure 1. Schematic of hypersonic vehicle based on
![]() $\varLambda$
Drag-min
.
$\varLambda$
Drag-min
.
The second geometry was generated at
![]() $\varLambda$
HT-min
(= 80°). In this case, heat transferr to the vehicle is minimal, so temperature rise of vehicle is also minimal. As temperature rise is minimum for this sweepback angle, it is also considered a temperature minimised sweepback angle (
$\varLambda$
HT-min
(= 80°). In this case, heat transferr to the vehicle is minimal, so temperature rise of vehicle is also minimal. As temperature rise is minimum for this sweepback angle, it is also considered a temperature minimised sweepback angle (
![]() $\varLambda$
Temp-min
). Hypothesised schematic geometry is generated, as shown in Fig. 2.
$\varLambda$
Temp-min
). Hypothesised schematic geometry is generated, as shown in Fig. 2.
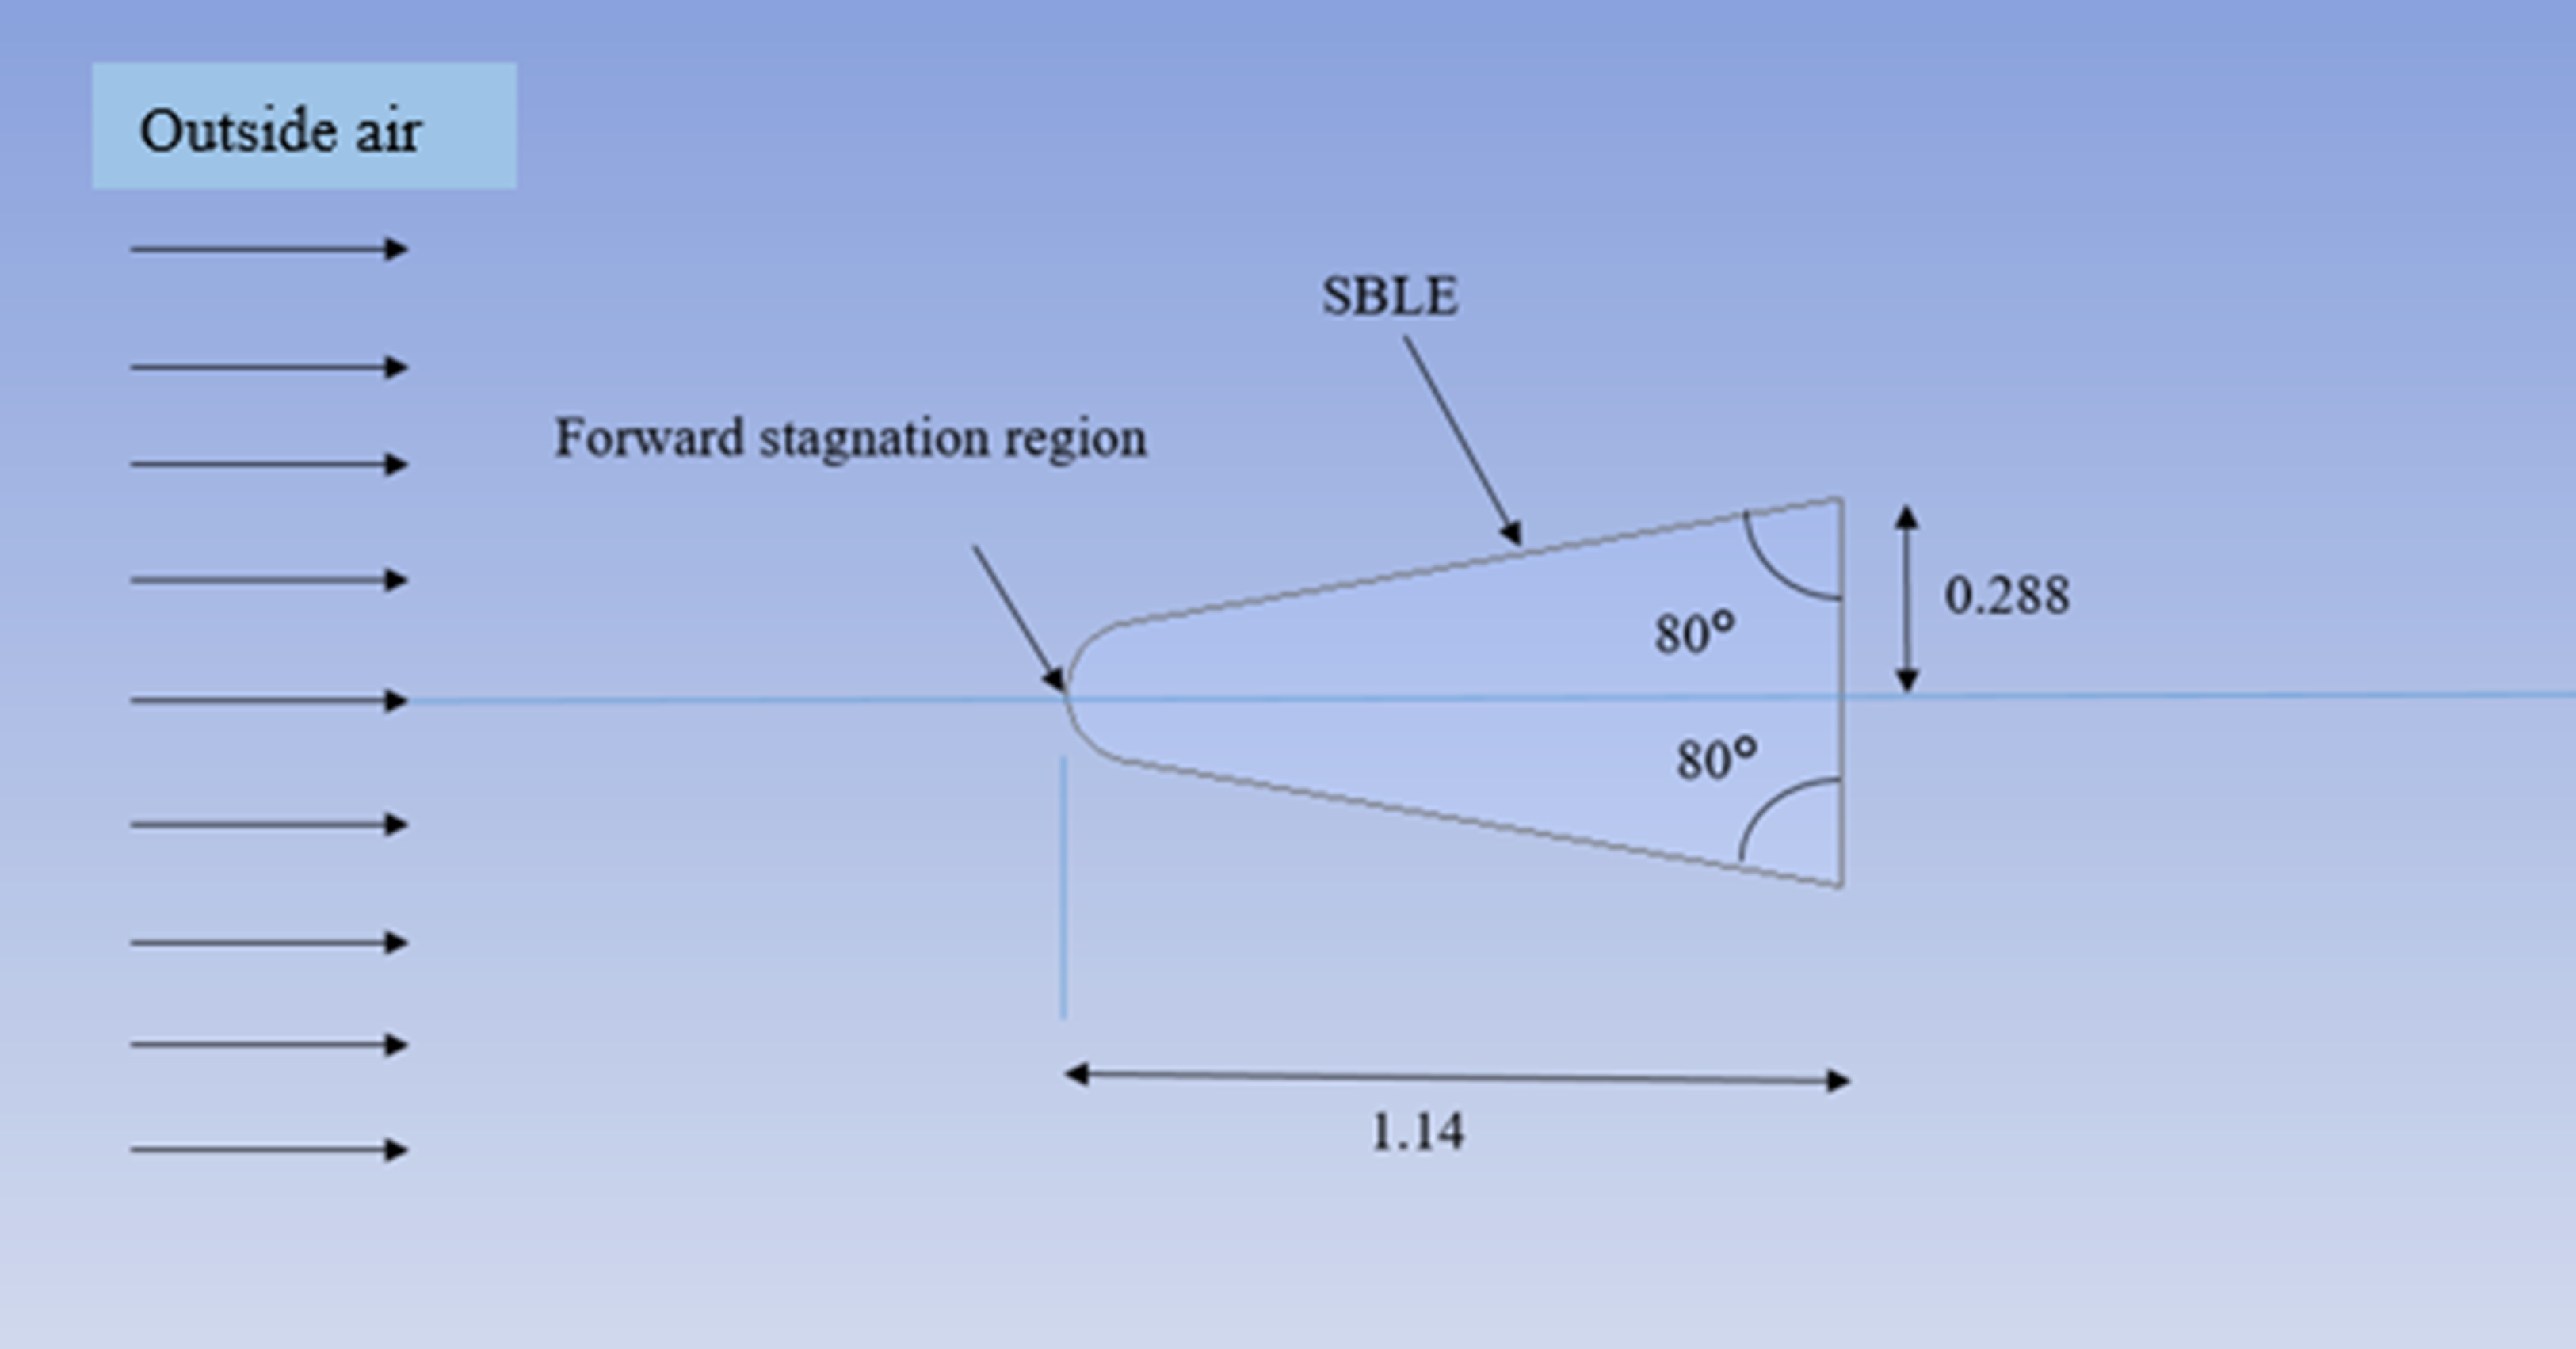
Figure 2. Schematic of the hypersonic vehicle based on
![]() $\varLambda$
HT-min
.
$\varLambda$
HT-min
.
2.2 Aerothermal modeling
In order to keep flow at computational boundary near the free stream condition and impact of walls on the vehicle body to a minimum, the vehicle geometry is confined in fluid domain with appropriate dimensions. In order to simplify computations, only half of the symmetric geometry is modeled with structured and quadratic mesh for vehicle body and fluid domain. The minimum surface grid areas for
![]() $\varLambda$
=70° and 80° are 9.670829 × 10⁻⁵ and 3.002864 × 10⁻⁵m2, respectively. Mesh near SBLE and nose of geometry is kept fine so that results obtained near the SBLE and nose will be more accurate, as shown in Fig. 3.
$\varLambda$
=70° and 80° are 9.670829 × 10⁻⁵ and 3.002864 × 10⁻⁵m2, respectively. Mesh near SBLE and nose of geometry is kept fine so that results obtained near the SBLE and nose will be more accurate, as shown in Fig. 3.
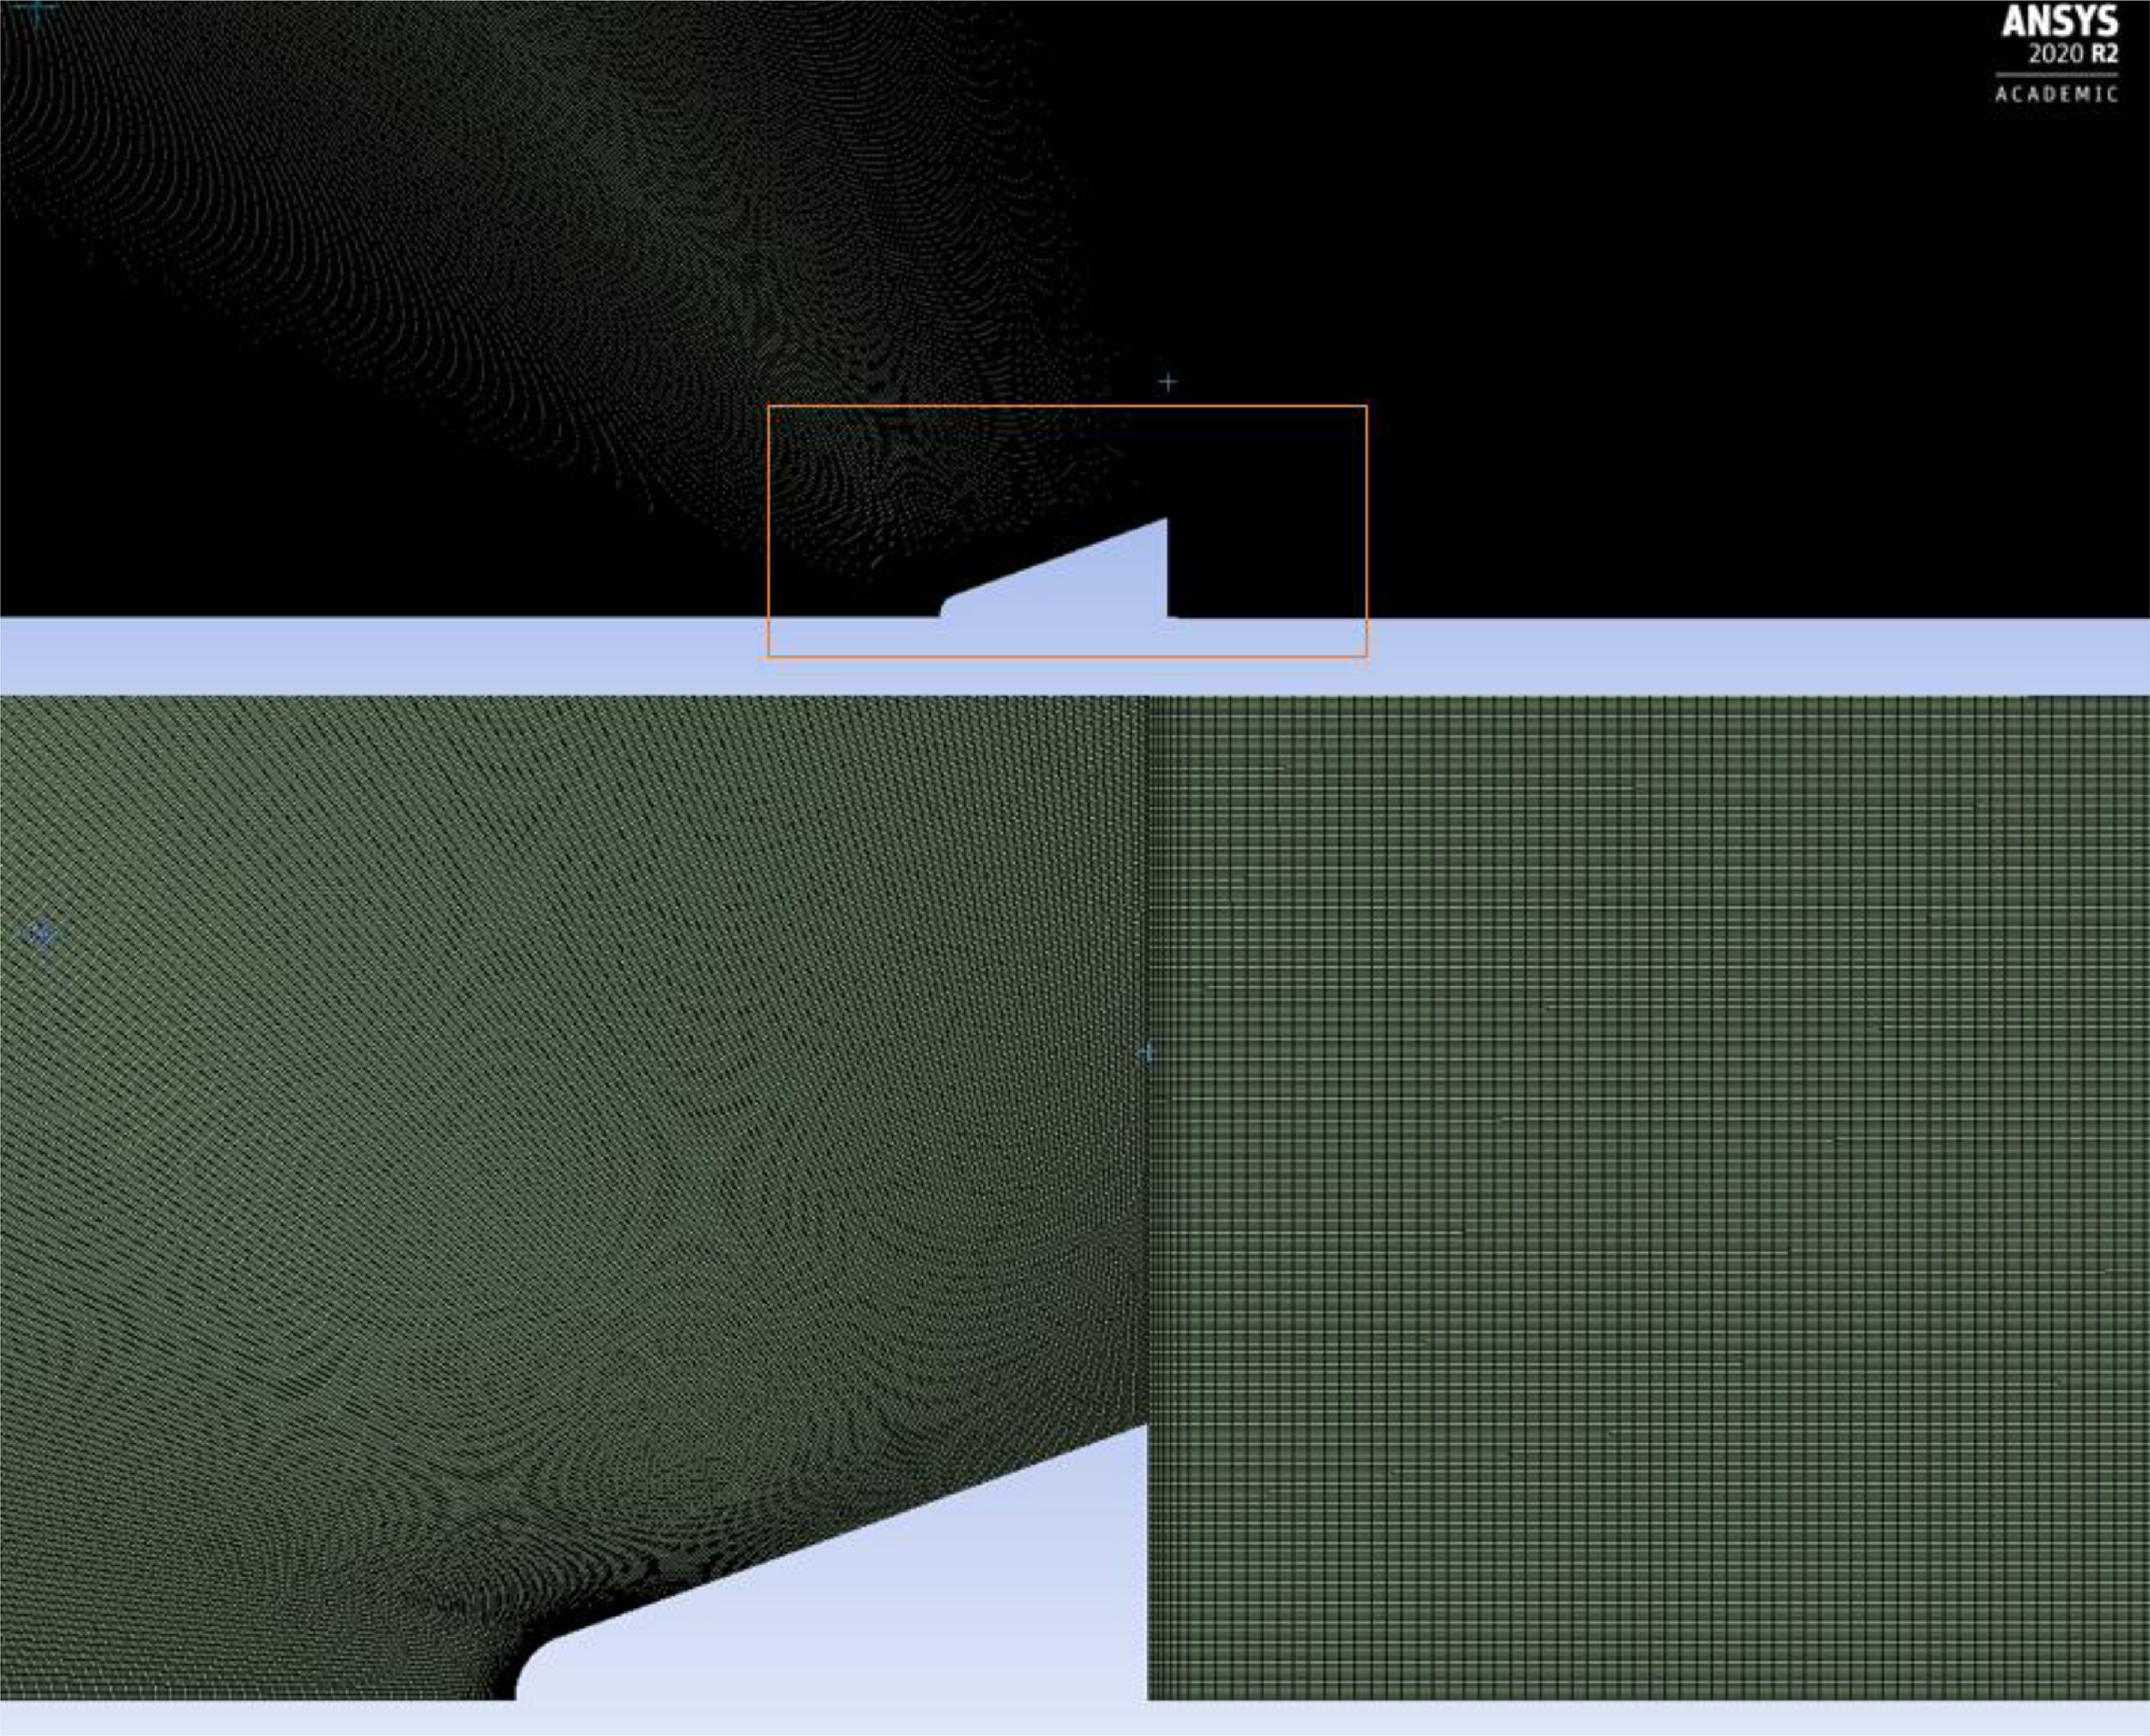
Figure 3. Mesh generated for
![]() $\varLambda$
=70° configuration.
$\varLambda$
=70° configuration.
Pressure far-field conditions were used at the fluid’s inlet, outlet and upper boundary to model the external compressible flow, as wall effects on vehicle are significantly reduced by pressure far-field boundary conditions. The freestream pressure (P
![]() $_{\infty}$
) and temperature (T
$_{\infty}$
) and temperature (T
![]() $_{\infty}$
) for typical cruise of RHV for M
$_{\infty}$
) for typical cruise of RHV for M
![]() $_{\infty}$
(= 7) are 768Pa and 220K, respectively, at altitude of 35km [Reference Kumar and Mahulikar7]. Thermally perfect air is considered for the simulations with consideration of variations in specific heat capacity [C
p
(T)]. For temperatures varying from 273 to 550K, C
p
(T) is considered as a constant of 1,018.2J/kgK. For temperatures varying from 550 to 5,000K, C
p
(T) variation is considered by the equation,
$_{\infty}$
(= 7) are 768Pa and 220K, respectively, at altitude of 35km [Reference Kumar and Mahulikar7]. Thermally perfect air is considered for the simulations with consideration of variations in specific heat capacity [C
p
(T)]. For temperatures varying from 273 to 550K, C
p
(T) is considered as a constant of 1,018.2J/kgK. For temperatures varying from 550 to 5,000K, C
p
(T) variation is considered by the equation,
where, a0, a1, a2, a3, a4 are constant as 874.687, 0.325431, −2.07132 ×10⁻⁵, −6.63386 × 10⁻⁸, −2.66353 × 10⁻¹¹, respectively [Reference Kumar and Mahulikar7].
The variation of thermal conductivity (W/m K) of air is considered with quadratic relation,
To find the wall temperature, heat transfer across vehicle wall is kept at zero by using adiabatic boundary conditions. Wall’s external emissivity is assumed to be fixed (
![]() $\varepsilon$
= 0.84). Air density (
$\varepsilon$
= 0.84). Air density (
![]() $\rho$
) is calculated using the ideal gas law, and the Sutherland rule is taken into account for viscosity (
$\rho$
) is calculated using the ideal gas law, and the Sutherland rule is taken into account for viscosity (
![]() $\mu$
) variation. To simulate hypersonic flow, the density-based, 2D steady-state, realisable k-epsilon, double-precision solver is used. For compressible flow and aerodynamic heating problems, a density-based solver is used. The flow is considered turbulent due to the high Reynolds number. Due to its higher resolution and better computational efficiency, a specific Roe-FDS flux-type solver is employed for current simulations. Spatial discretisation techniques such as second-order upwind for momentum equation are used for the simulations and least-square cell-based for gradients. To solve the interaction and effect of hypersonic flow over geometry, ANSYS Fluent 2020 is used for both geometries, based on
$\mu$
) variation. To simulate hypersonic flow, the density-based, 2D steady-state, realisable k-epsilon, double-precision solver is used. For compressible flow and aerodynamic heating problems, a density-based solver is used. The flow is considered turbulent due to the high Reynolds number. Due to its higher resolution and better computational efficiency, a specific Roe-FDS flux-type solver is employed for current simulations. Spatial discretisation techniques such as second-order upwind for momentum equation are used for the simulations and least-square cell-based for gradients. To solve the interaction and effect of hypersonic flow over geometry, ANSYS Fluent 2020 is used for both geometries, based on
![]() $\varLambda$
HT-min
and
$\varLambda$
HT-min
and
![]() $\varLambda$
Drag-min
.
$\varLambda$
Drag-min
.
2.3 Thickness calculations of TPS
A simple slab with a forced convection problem is considered with an inlet velocity of inside air assumed to be 1.5m/s to calculate the thickness of TPS. A schematic view of the problem is described in Fig. 4, consisting of fluid and solid domains. The fluid domain in thickness calculation problem represents the air inside the vehicle. The generated mesh for the thickness calculation problem is shown in Fig. 5, which shows that the meshing near the contact wall between inside air and solid slab is made fine to get more accurate results. Solid and fluid domains together are divided into 1,062,850 elements. After obtaining wall temperatures in Section 2.2 for
![]() $\varLambda$
HT-min
and
$\varLambda$
HT-min
and
![]() $\varLambda$
Drag-min
, thicknesses are calculated to study the weight reduction percentage and increase in payload capacity in Section 2.4. The insulative TPS material Saffil is used to calculate thicknesses for
$\varLambda$
Drag-min
, thicknesses are calculated to study the weight reduction percentage and increase in payload capacity in Section 2.4. The insulative TPS material Saffil is used to calculate thicknesses for
![]() $\varLambda$
HT-min
and
$\varLambda$
HT-min
and
![]() $\varLambda$
Drag-min
to maintain an inner wall temperature of 323K of TPS.
$\varLambda$
Drag-min
to maintain an inner wall temperature of 323K of TPS.
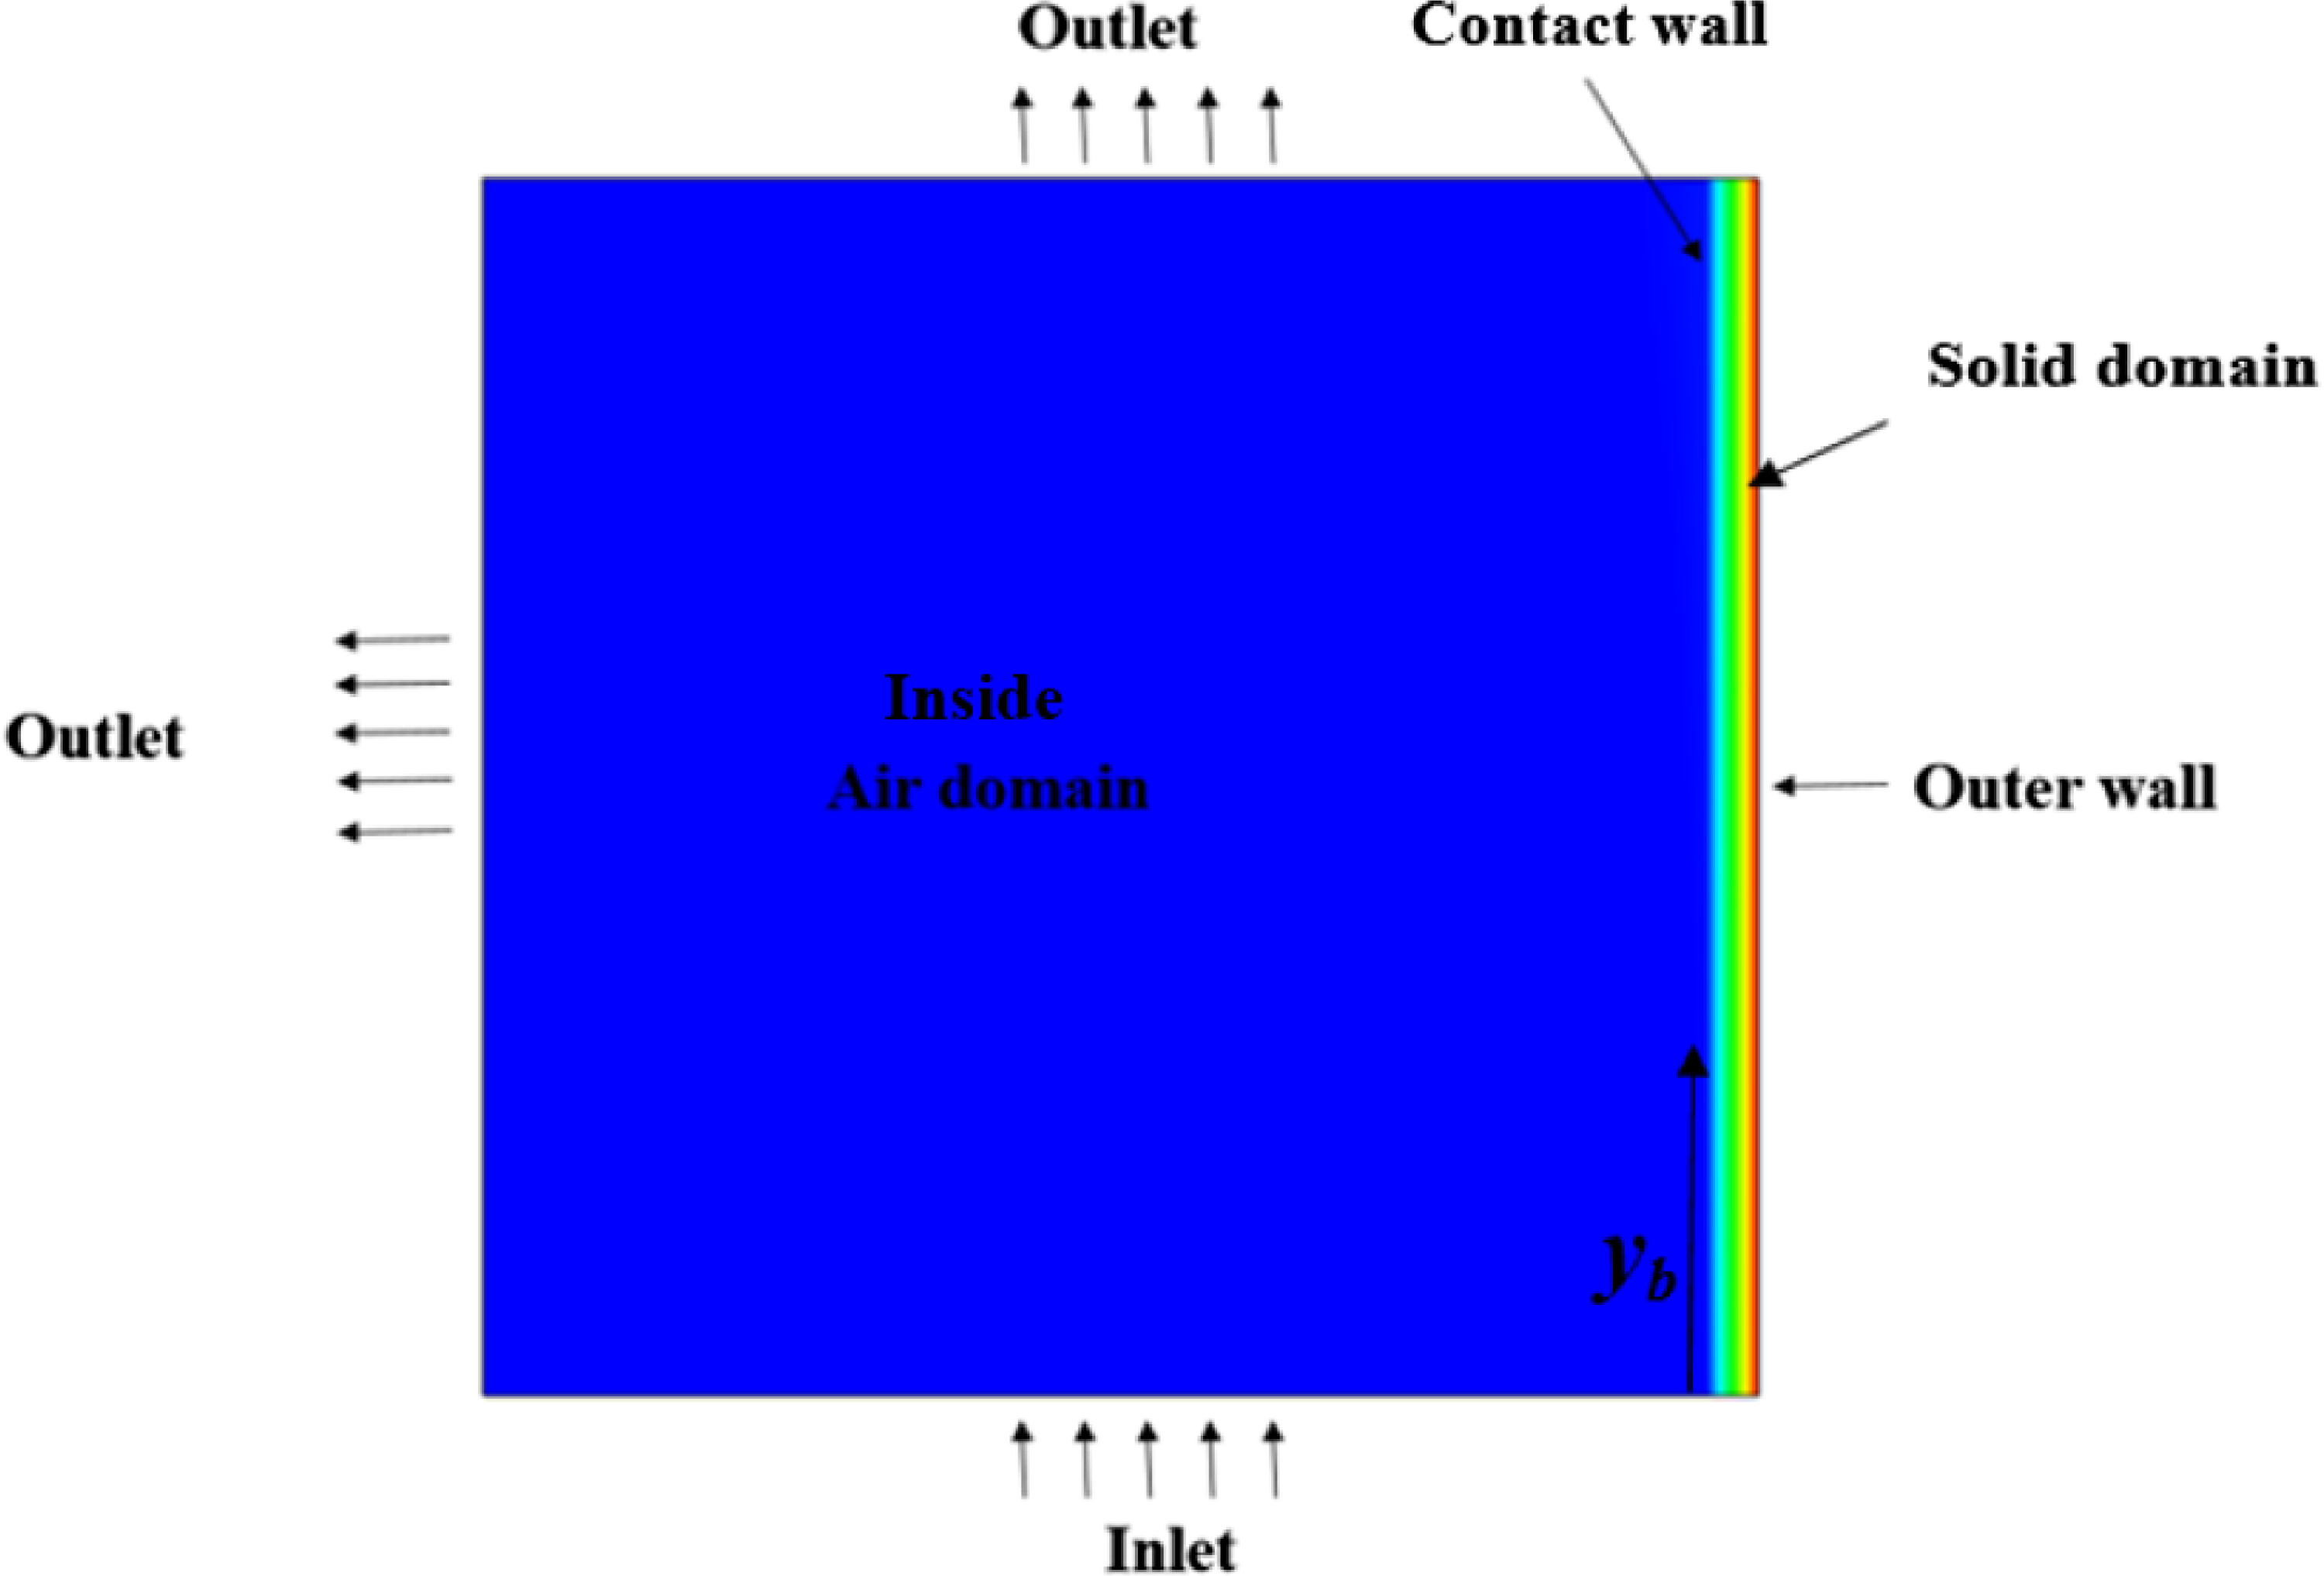
Figure 4. Schematic view to illustrate TPS thickness calculation problem.
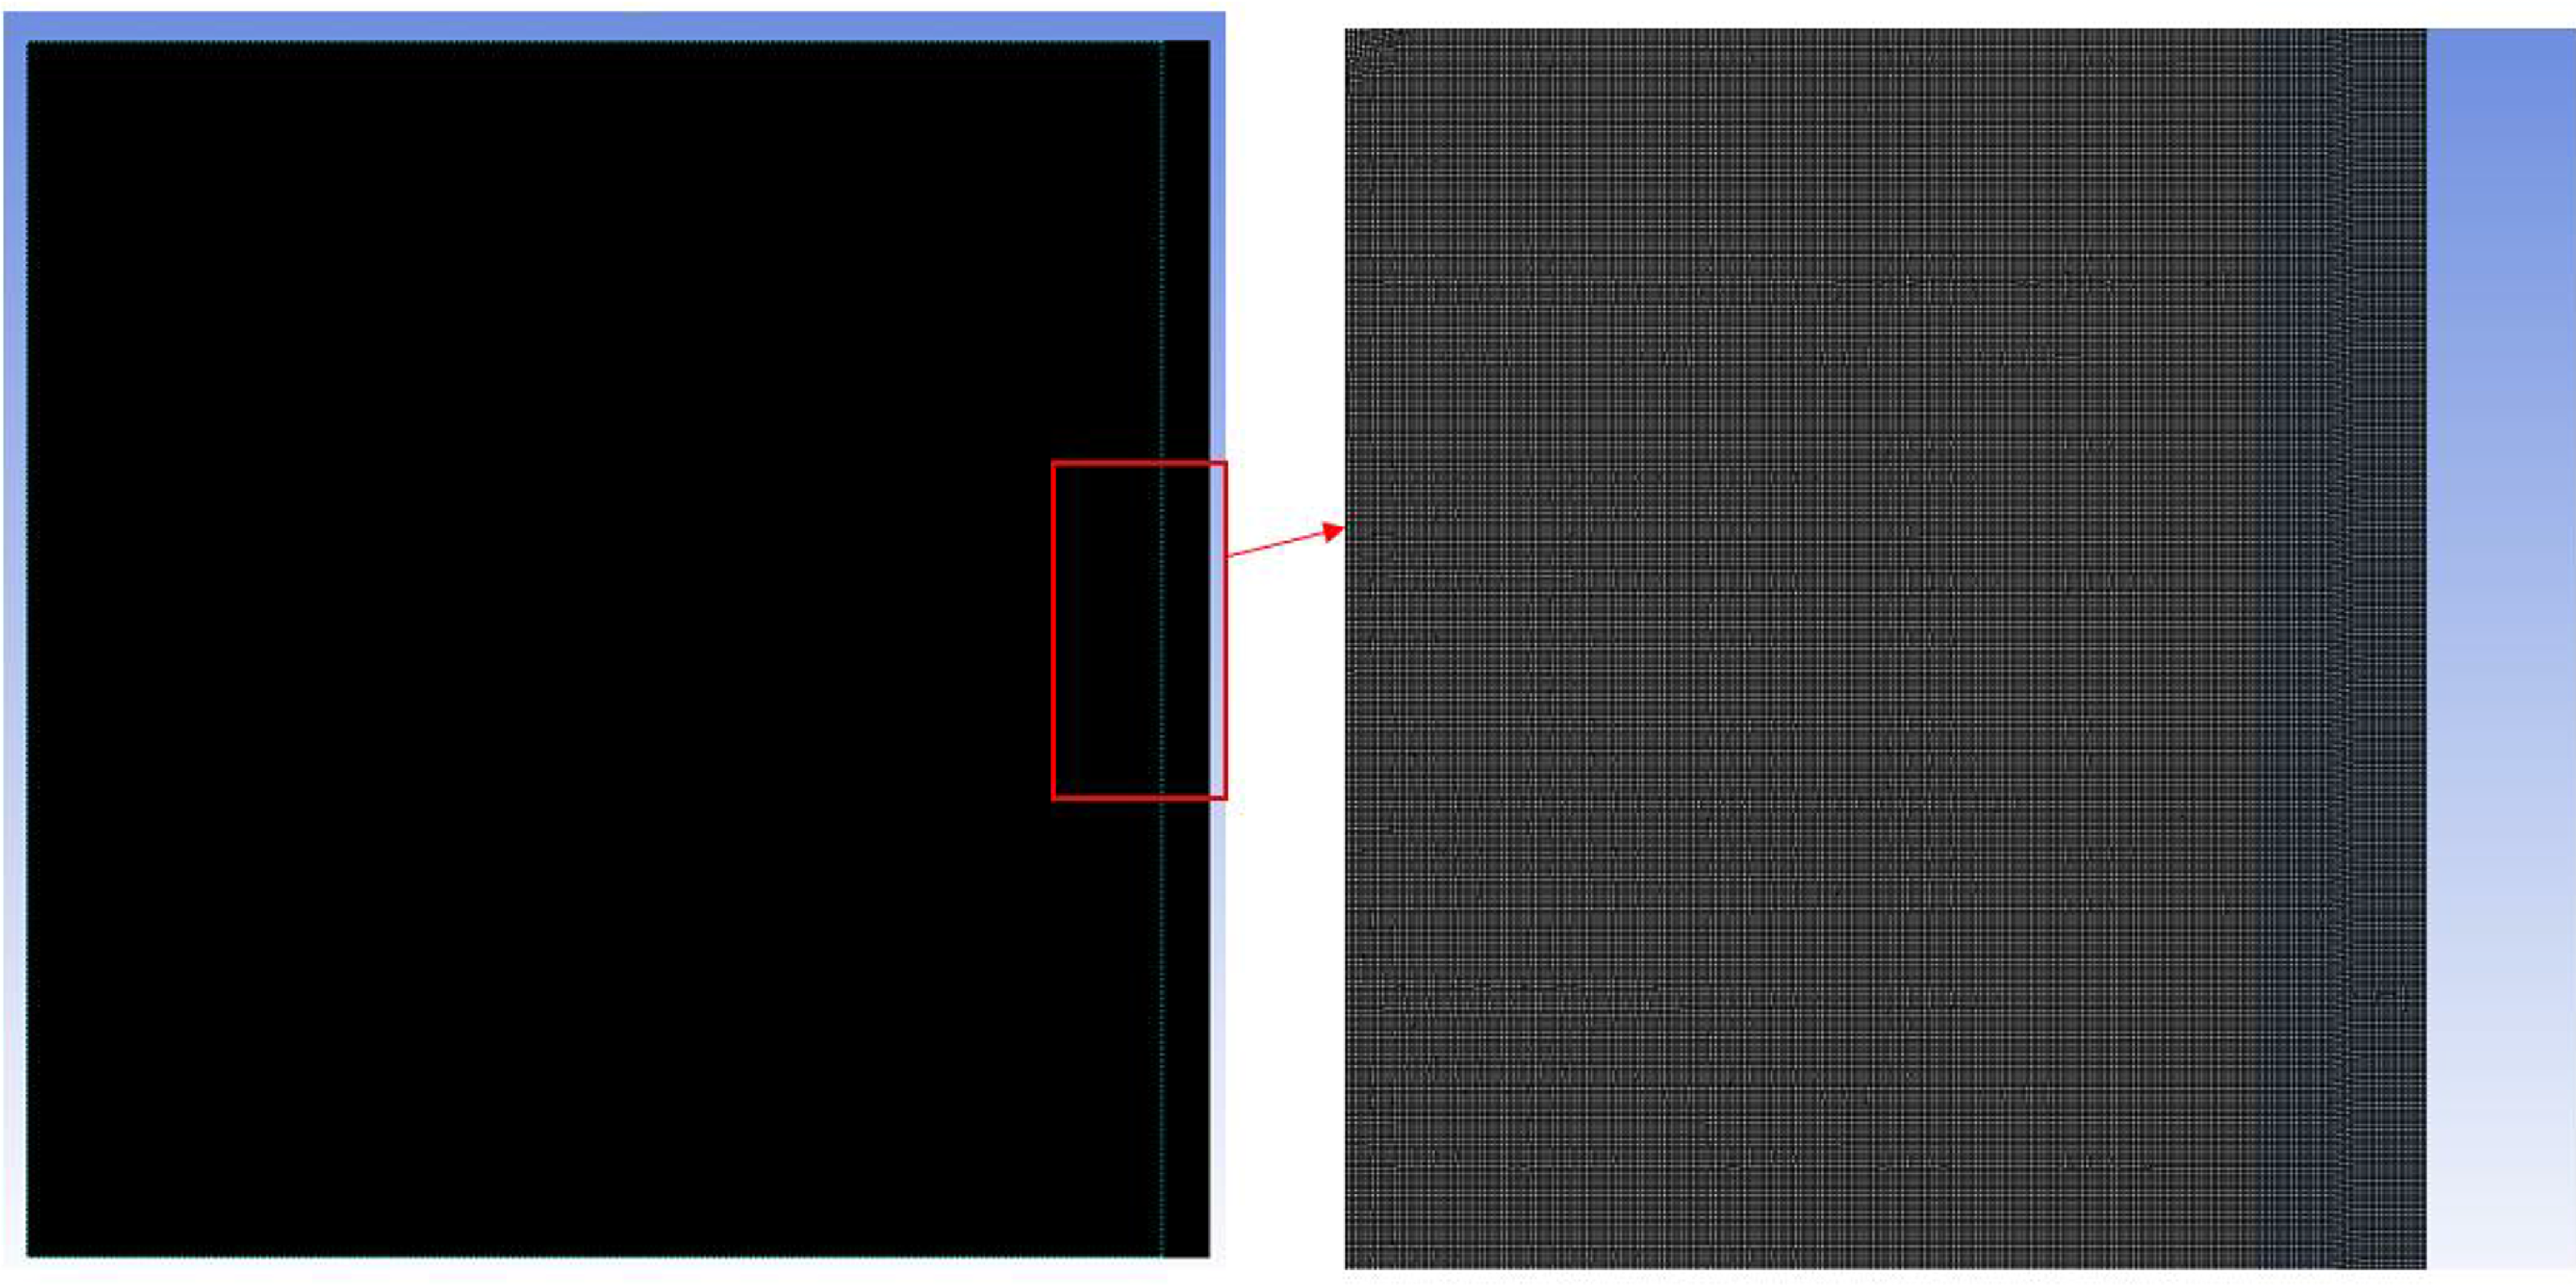
Figure 5. Meshing in TPS thickness calculation problem.
The outer wall temperatures are obtained from simulations in Section 2.2 for respective sweepback angles. The problem of thickness calculation is solved by simulating iteratively in ANSYS 2020 to find the thickness required to maintain an inner wall temperature of 323K, which is permissible for the payload (human body as well as types of vehicle’s electronic equipment).
2.4 Percentage weight reduction and increase in payload capacity with $\varLambda$
HT-min
After getting thickness values in Section 2.3, schematic geometries from Figs. 1 and 2 are revolved around their axes of symmetry to generate a geometry, as shown in Fig. 6. After geometry generation, it is observed that the volume (Vol
1
: without TPS) of the geometry at
![]() $\varLambda$
HT-min
and
$\varLambda$
HT-min
and
![]() $\varLambda$
Drag-min
is the same at 0.266m3. Depending on the direction of thickness given to geometry, the following study is divided into two cases: (i) constant payload capacity (thickness of TPS given in the outside direction of geometry) and (ii) constant overall volume (thickness of TPS given in an inside direction of geometry).
$\varLambda$
Drag-min
is the same at 0.266m3. Depending on the direction of thickness given to geometry, the following study is divided into two cases: (i) constant payload capacity (thickness of TPS given in the outside direction of geometry) and (ii) constant overall volume (thickness of TPS given in an inside direction of geometry).
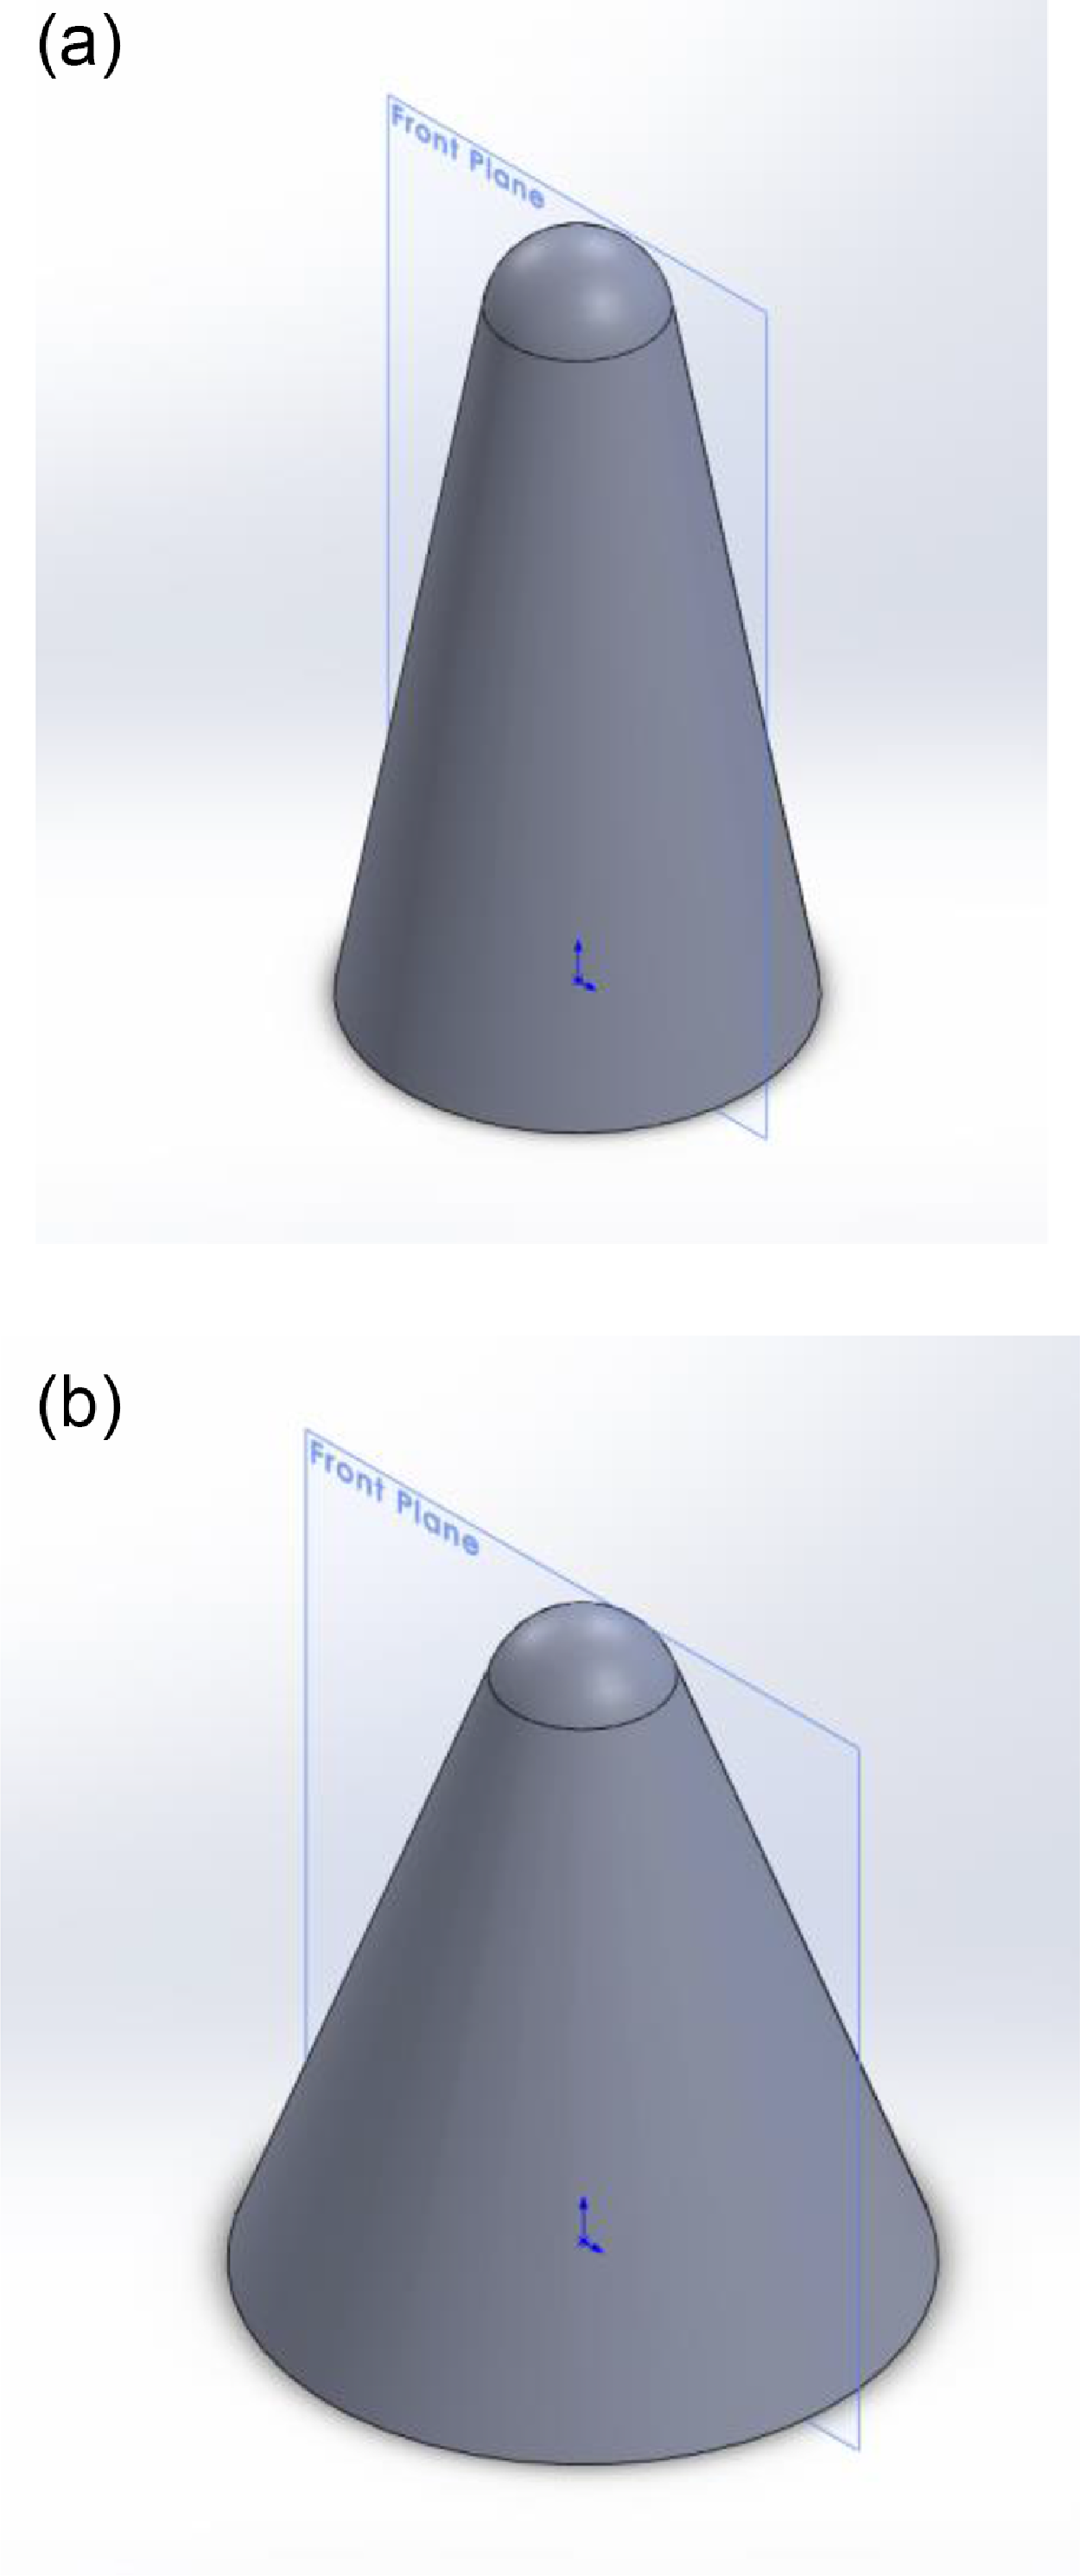
Figure 6. 3D geometry of RHV for (a)
![]() $\varLambda$
HT-min
(b)
$\varLambda$
HT-min
(b)
![]() $\varLambda$
Drag-min
.
$\varLambda$
Drag-min
.
If TPS thickness is given in an outside direction, the inner volume or payload capacity remains unchanged at 0.266m3 for
![]() $\varLambda$
HT-min
and
$\varLambda$
HT-min
and
![]() $\varLambda$
Drag-min
(payload capacity remains constant (case i)). For the constant payload capacity case, overall volume of vehicle is the summation of payload capacity (Vol
1
= 0.266m3) and the volume of TPS after giving thickness in outside direction (Vol
2
). In this constant payload capacity case, volume of TPS is different for
$\varLambda$
Drag-min
(payload capacity remains constant (case i)). For the constant payload capacity case, overall volume of vehicle is the summation of payload capacity (Vol
1
= 0.266m3) and the volume of TPS after giving thickness in outside direction (Vol
2
). In this constant payload capacity case, volume of TPS is different for
![]() $\varLambda$
HT-min
and
$\varLambda$
HT-min
and
![]() $\varLambda$
Drag-min
(as TPS material thicknesses have different values for
$\varLambda$
Drag-min
(as TPS material thicknesses have different values for
![]() $\varLambda$
HT-min
and
$\varLambda$
HT-min
and
![]() $\varLambda$
Drag-min
), so study is performed to observe the percentage weight reduction of TPS (percentage volume reduction of TPS as material used for both
$\varLambda$
Drag-min
), so study is performed to observe the percentage weight reduction of TPS (percentage volume reduction of TPS as material used for both
![]() $\varLambda$
HT-min
and
$\varLambda$
HT-min
and
![]() $\varLambda$
Drag-min
is same) when RHV is designed at
$\varLambda$
Drag-min
is same) when RHV is designed at
![]() $\varLambda$
HT-min
(instead of
$\varLambda$
HT-min
(instead of
![]() $\varLambda$
Drag-min
).
$\varLambda$
Drag-min
).
When the thickness is given in the inside direction, the overall volume of vehicle remains unchanged at 0.266m3 for
![]() $\varLambda$
HT-min
and
$\varLambda$
HT-min
and
![]() $\varLambda$
Drag-min
[constant overall volume case (case ii)]. In constant overall volume case, as thicknesses are different for
$\varLambda$
Drag-min
[constant overall volume case (case ii)]. In constant overall volume case, as thicknesses are different for
![]() $\varLambda$
HT-min
and
$\varLambda$
HT-min
and
![]() $\varLambda$
Drag-min
, inner volume [overall volume of vehicle (Vol
1
= 0.266m3) – volume of TPS (Vol
3
)] of vehicle is different for
$\varLambda$
Drag-min
, inner volume [overall volume of vehicle (Vol
1
= 0.266m3) – volume of TPS (Vol
3
)] of vehicle is different for
![]() $\varLambda$
HT-min
and
$\varLambda$
HT-min
and
![]() $\varLambda$
Drag-min
. So study is performed to observe percentage increase in inner volume (payload capacity) when RHV is designed at
$\varLambda$
Drag-min
. So study is performed to observe percentage increase in inner volume (payload capacity) when RHV is designed at
![]() $\varLambda$
HT-min
instead of
$\varLambda$
HT-min
instead of
![]() $\varLambda$
Drag-min
.
$\varLambda$
Drag-min
.
Case i: Constant payload capacity (increase in overall volume)
The geometries shown in Fig. 6 were thickened with the respective thicknesses calculated in Section 2.3 for
![]() $\varLambda$
HT-min
and
$\varLambda$
HT-min
and
![]() $\varLambda$
Drag-min
in outside direction. The volume of TPS (Vol
2
) for both geometries was obtained from 3D geometries generated in Solidworks. When RHV is designed at
$\varLambda$
Drag-min
in outside direction. The volume of TPS (Vol
2
) for both geometries was obtained from 3D geometries generated in Solidworks. When RHV is designed at
![]() $\varLambda$
HT-min
instead of
$\varLambda$
HT-min
instead of
![]() $\varLambda$
Drag-min
, the percentage weight reduction of TPS or overall weight reduction of RHV was calculated from following formula:
$\varLambda$
Drag-min
, the percentage weight reduction of TPS or overall weight reduction of RHV was calculated from following formula:
Case ii: Constant overall volume (decrease in payload volume)
Similarly, the thicknesses for
![]() $\varLambda$
HT-min
and
$\varLambda$
HT-min
and
![]() $\varLambda$
Drag-min
in the inner direction are determined in Section 2.3 and applied to the geometries depicted in Fig. 6. The inner payload volume (Vol
4
) = [overall volume of vehicle (Vol
1
= 0.266m3) – volume of TPS (Vol
3
)], for both geometries is obtained. When RHV is designed at
$\varLambda$
Drag-min
in the inner direction are determined in Section 2.3 and applied to the geometries depicted in Fig. 6. The inner payload volume (Vol
4
) = [overall volume of vehicle (Vol
1
= 0.266m3) – volume of TPS (Vol
3
)], for both geometries is obtained. When RHV is designed at
![]() $\varLambda$
HT-min
instead of
$\varLambda$
HT-min
instead of
![]() $\varLambda$
Drag-min
, the percentage increase in payload capacity (inner volume) of RHV is calculated from following formula:
$\varLambda$
Drag-min
, the percentage increase in payload capacity (inner volume) of RHV is calculated from following formula:
2.5 Lift-induced drag reduction with design at $\varLambda$
HT-min
The passage of a 3-D wing with aerofoil causes induced drag, which is an unavoidable by-product of lift. Induced drag is experienced by a vehicle due to tilt in the direction of lift (L) to the direction of L
eff
with an induced angle-of-attack (
![]() $\alpha$
i
). The tilt in direction of L is mainly because of the downwash of air along the aerofoil of a 3-D wing.
$\alpha$
i
). The tilt in direction of L is mainly because of the downwash of air along the aerofoil of a 3-D wing.
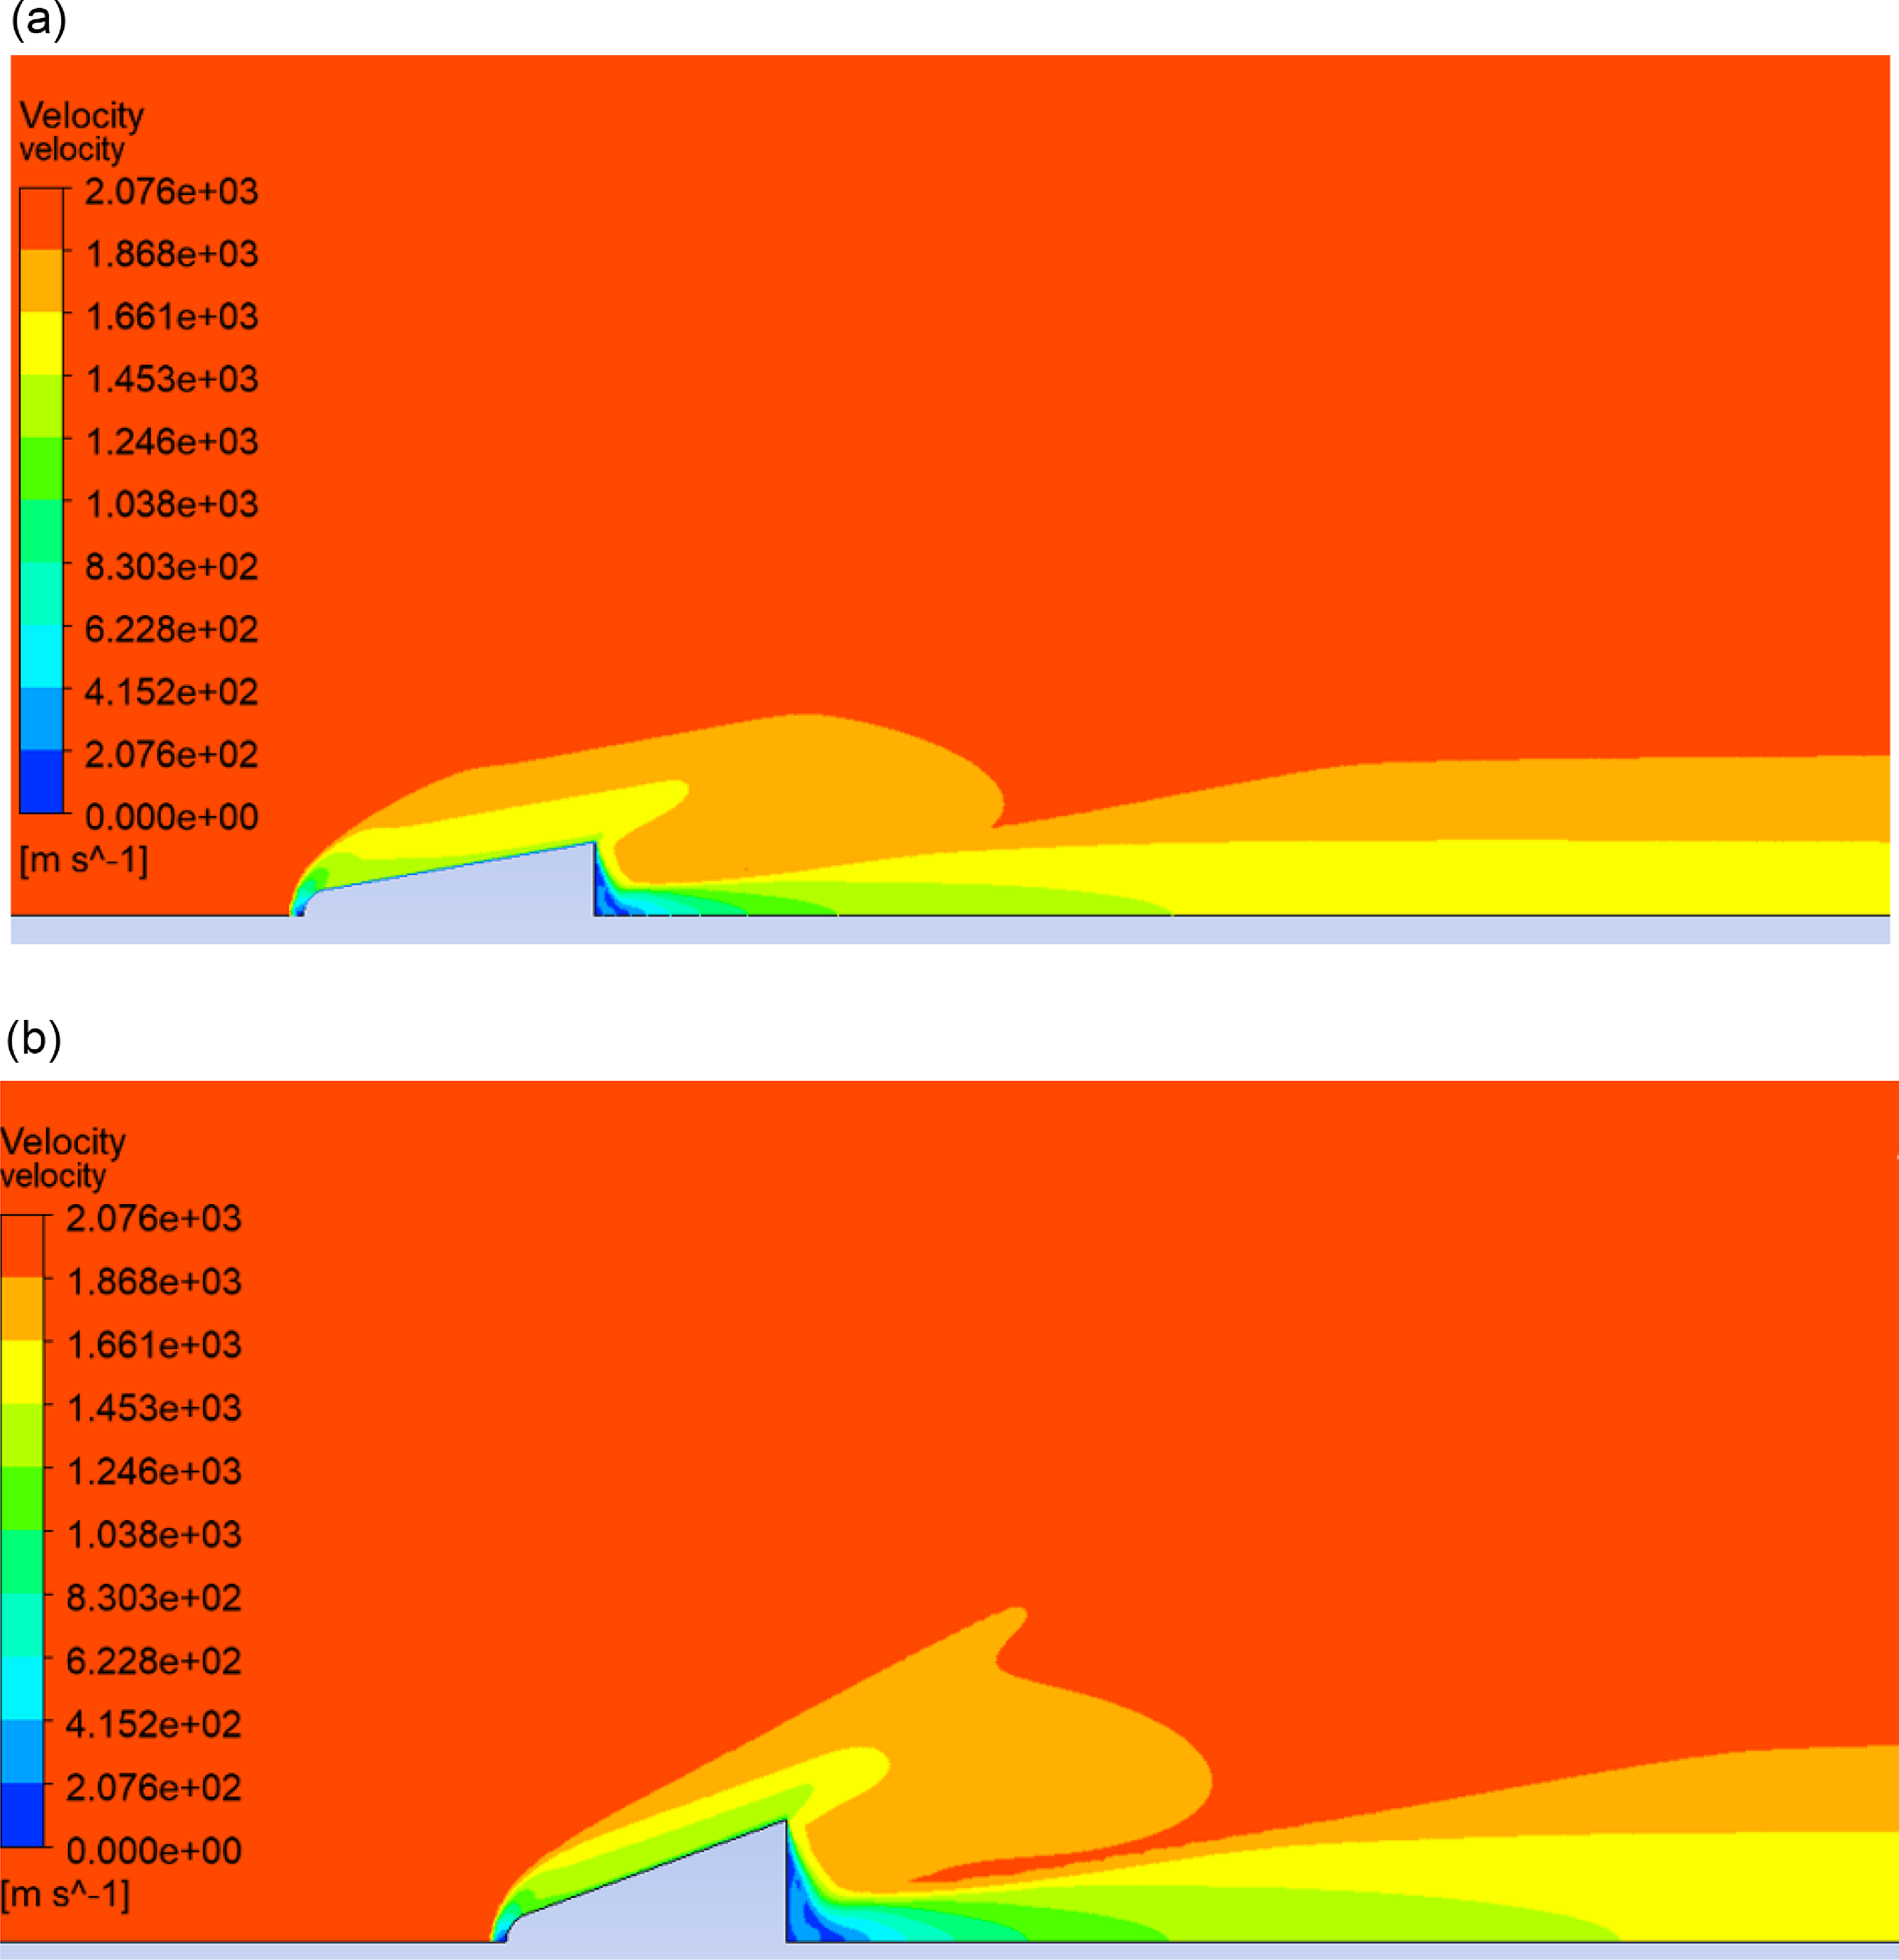
Figure 7. Velocity contour of fluid domain over the vehicle body: (a)
![]() $\varLambda$
HT-min
(b)
$\varLambda$
HT-min
(b)
![]() $\varLambda$
Drag-min
.
$\varLambda$
Drag-min
.
Induced angle-of-attack is given by the following formula [Reference Stengel53],
![]() $\alpha$
i
= C
L
/[π × e ×(AR)]; where C
L
is the coefficient of lift [= L/(0.5
$\alpha$
i
= C
L
/[π × e ×(AR)]; where C
L
is the coefficient of lift [= L/(0.5
![]() ${\rm{\;}}{{{\rho }}_\infty }\;{V_\infty }^2\;{A_s}$
)],
${\rm{\;}}{{{\rho }}_\infty }\;{V_\infty }^2\;{A_s}$
)],
![]() $\rho$
$\rho$
![]() $_{\infty}$
is free stream density (kg/m3), V
$_{\infty}$
is free stream density (kg/m3), V
![]() $_{\infty}$
is free stream velocity (m/s), e is efficiency factor, and AR is an aspect ratio, which is ratio of square of wing span (b
2
) and surface area (A
s
). The correlation of lift-induced drag (D
i
) in terms of lift and induced angle-of-attack is given by D
i
= L × α
i
. After putting value of
$_{\infty}$
is free stream velocity (m/s), e is efficiency factor, and AR is an aspect ratio, which is ratio of square of wing span (b
2
) and surface area (A
s
). The correlation of lift-induced drag (D
i
) in terms of lift and induced angle-of-attack is given by D
i
= L × α
i
. After putting value of
![]() $\alpha$
i
and simplification, the lift-induced drag is obtained from the following formula:
$\alpha$
i
and simplification, the lift-induced drag is obtained from the following formula:
Both body configurations go through the same environmental conditions, so
![]() $\rho$
$\rho$
![]() $_{\infty}$
and V
$_{\infty}$
and V
![]() $_{\infty}$
remain constant in both cases. This study is performed at cruise conditions, so the lift of the vehicle is equal to the weight of vehicle. Wing spans (b) for
$_{\infty}$
remain constant in both cases. This study is performed at cruise conditions, so the lift of the vehicle is equal to the weight of vehicle. Wing spans (b) for
![]() $\varLambda$
HT-min
is 1.07m,
$\varLambda$
HT-min
is 1.07m,
![]() $\varLambda$
Drag-min
is 0.811m, remain constant for both cases (constant payload capacity case and constant overall volume case). The Oswald efficiency factor (e) remains the same for both geometries, as the shape of both geometry wings is the same. The percentage reduction in induced drag is obtained by following formula:
$\varLambda$
Drag-min
is 0.811m, remain constant for both cases (constant payload capacity case and constant overall volume case). The Oswald efficiency factor (e) remains the same for both geometries, as the shape of both geometry wings is the same. The percentage reduction in induced drag is obtained by following formula:
Assuming the density of TPS is not changing:
 \begin{align}\%\; {\rm{ reduction in}}\,\,{D_i} = \frac{{{{\left( {\frac{{{W^2}}}{{{b^2}}}} \right)}_{{\Lambda _{Drag - min}}}} - {{\left( {\frac{{{W^2}}}{{{b^2}}}} \right)}_{{\Lambda _{HT - min}}}}}}{{{{\left( {\frac{{{W^2}}}{{{b^2}}}} \right)}_{{\Lambda _{Drag - min}}}}}} \times 100\end{align}
3.0 Results and discussion
The fluid domain velocity behaviour at sweepback angles of 80° and 70°, respectively, is depicted in Fig. 7(a) and (b). The maximum amount of kinetic energy near the nose area is converted into compression work as velocity is nearly zero, which is responsible for maximum temperature rise. Simulations are performed at same M
∞, so the free stream velocity remains identical for
![]() $\varLambda$
HT-min
and
$\varLambda$
HT-min
and
![]() $\varLambda$
Drag-min
. The velocities near the vehicle wall are lower than the free stream velocity as fluid flow experiences resistance to flow by the vehicle wall.
$\varLambda$
Drag-min
. The velocities near the vehicle wall are lower than the free stream velocity as fluid flow experiences resistance to flow by the vehicle wall.
The temperature contour of the fluid domain over the vehicle body at an 80° sweepback angle is depicted in Fig. 8(a). The minimum temperature is a free stream temperature of 220K, and the corresponding maximum temperature observed near nose of vehicle is 2,106K. Similarly, minimum and maximum temperatures for 70° sweepback angles are 220 and 2,284K, respectively, as shown in Fig. 8(b).
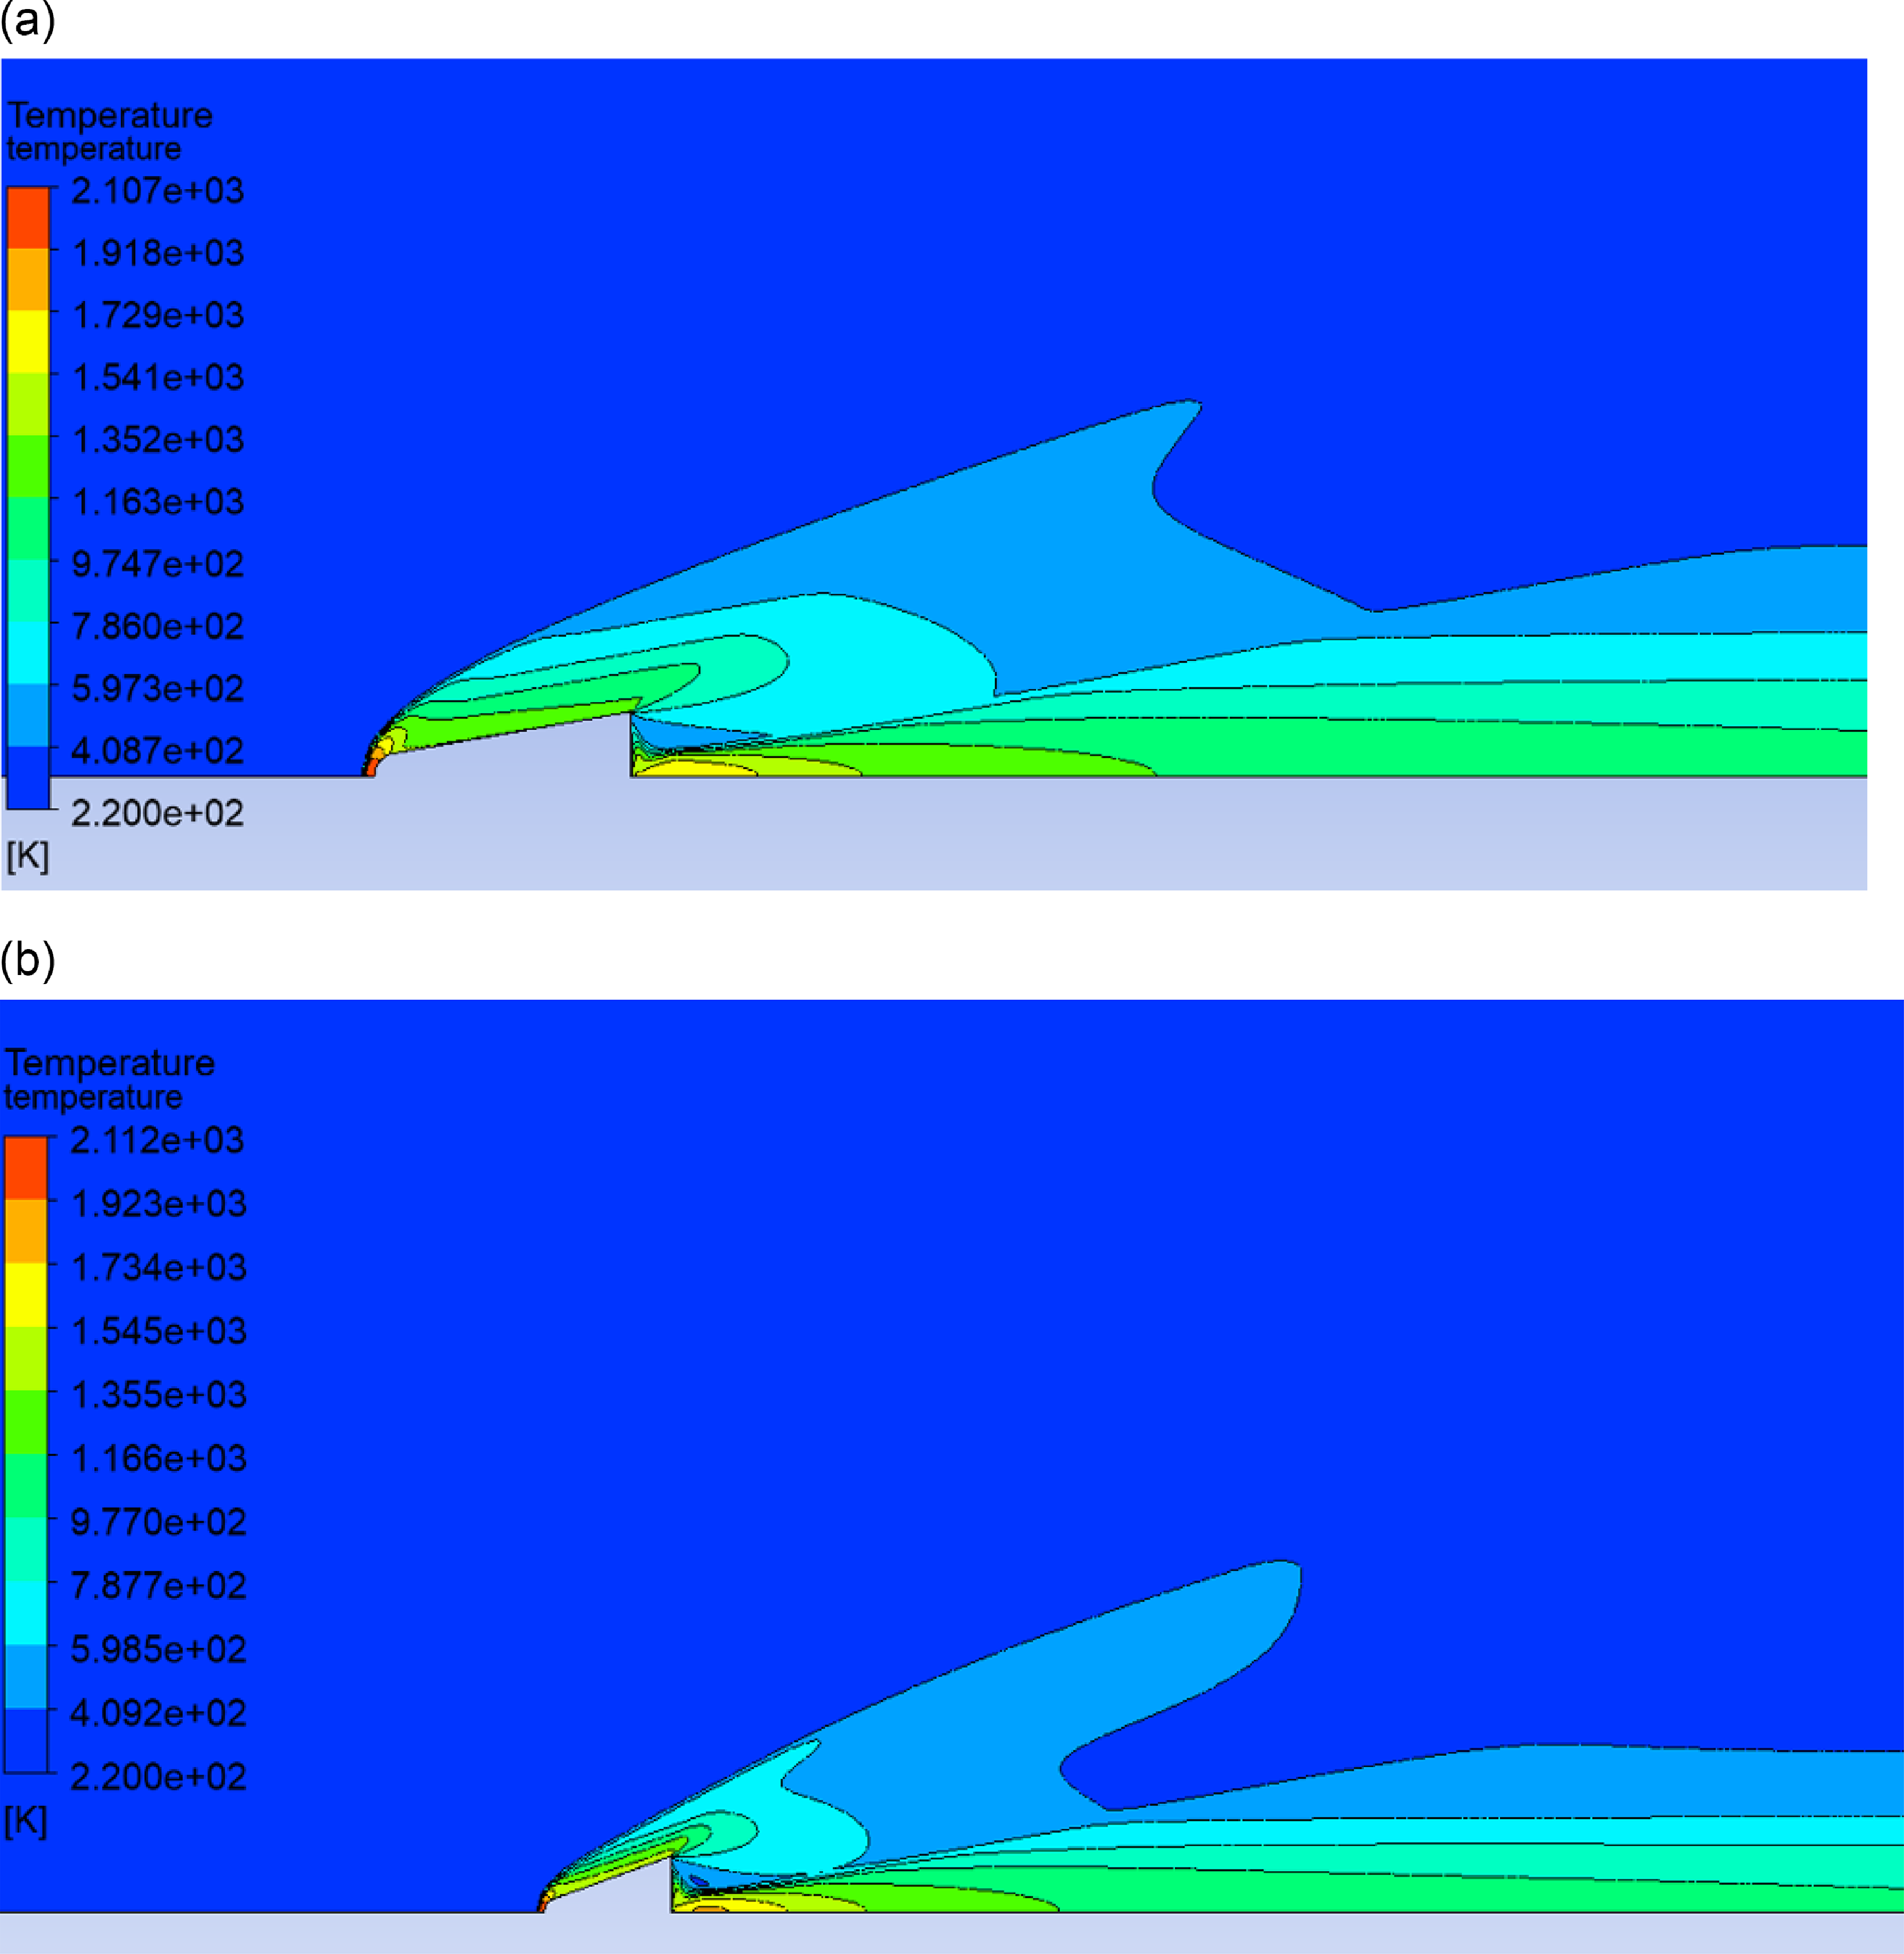
Figure 8. Temperature contour of fluid domain over the vehicle body: (a)
![]() $\varLambda$
HT-min
(b)
$\varLambda$
HT-min
(b)
![]() $\varLambda$
Drag-min.
$\varLambda$
Drag-min.
3.1 Wall temperature variation along SBLE of vehicle at $\varLambda$
HT-min
and $\varLambda$
Drag-min
The temperature variations of SBLE are obtained for M
∞ = 7 at a cruise altitude of 35km and are observed for
![]() $\varLambda$
HT-min
and
$\varLambda$
HT-min
and
![]() $\varLambda$
Drag-min
. The starting point of SBLE serves as a measurement point for the dimensionless distance
$\varLambda$
Drag-min
. The starting point of SBLE serves as a measurement point for the dimensionless distance
![]() $\;\bar x$
(distance along SBLE/total length of SBLE). Figure 9 gives the detailed variation of temperature along SBLE at
$\;\bar x$
(distance along SBLE/total length of SBLE). Figure 9 gives the detailed variation of temperature along SBLE at
![]() $\varLambda$
HT-min
and
$\varLambda$
HT-min
and
![]() $\varLambda$
Drag-min
. The temperature for
$\varLambda$
Drag-min
. The temperature for
![]() $\varLambda$
HT-min
is lower than that for
$\varLambda$
HT-min
is lower than that for
![]() $\varLambda$
Drag-min
at all locations of SBLE. Maximum wall temperatures for
$\varLambda$
Drag-min
at all locations of SBLE. Maximum wall temperatures for
![]() $\varLambda$
Drag-min
and
$\varLambda$
Drag-min
and
![]() $\varLambda$
HT-min
are 1,013 and 970K, respectively.
$\varLambda$
HT-min
are 1,013 and 970K, respectively.
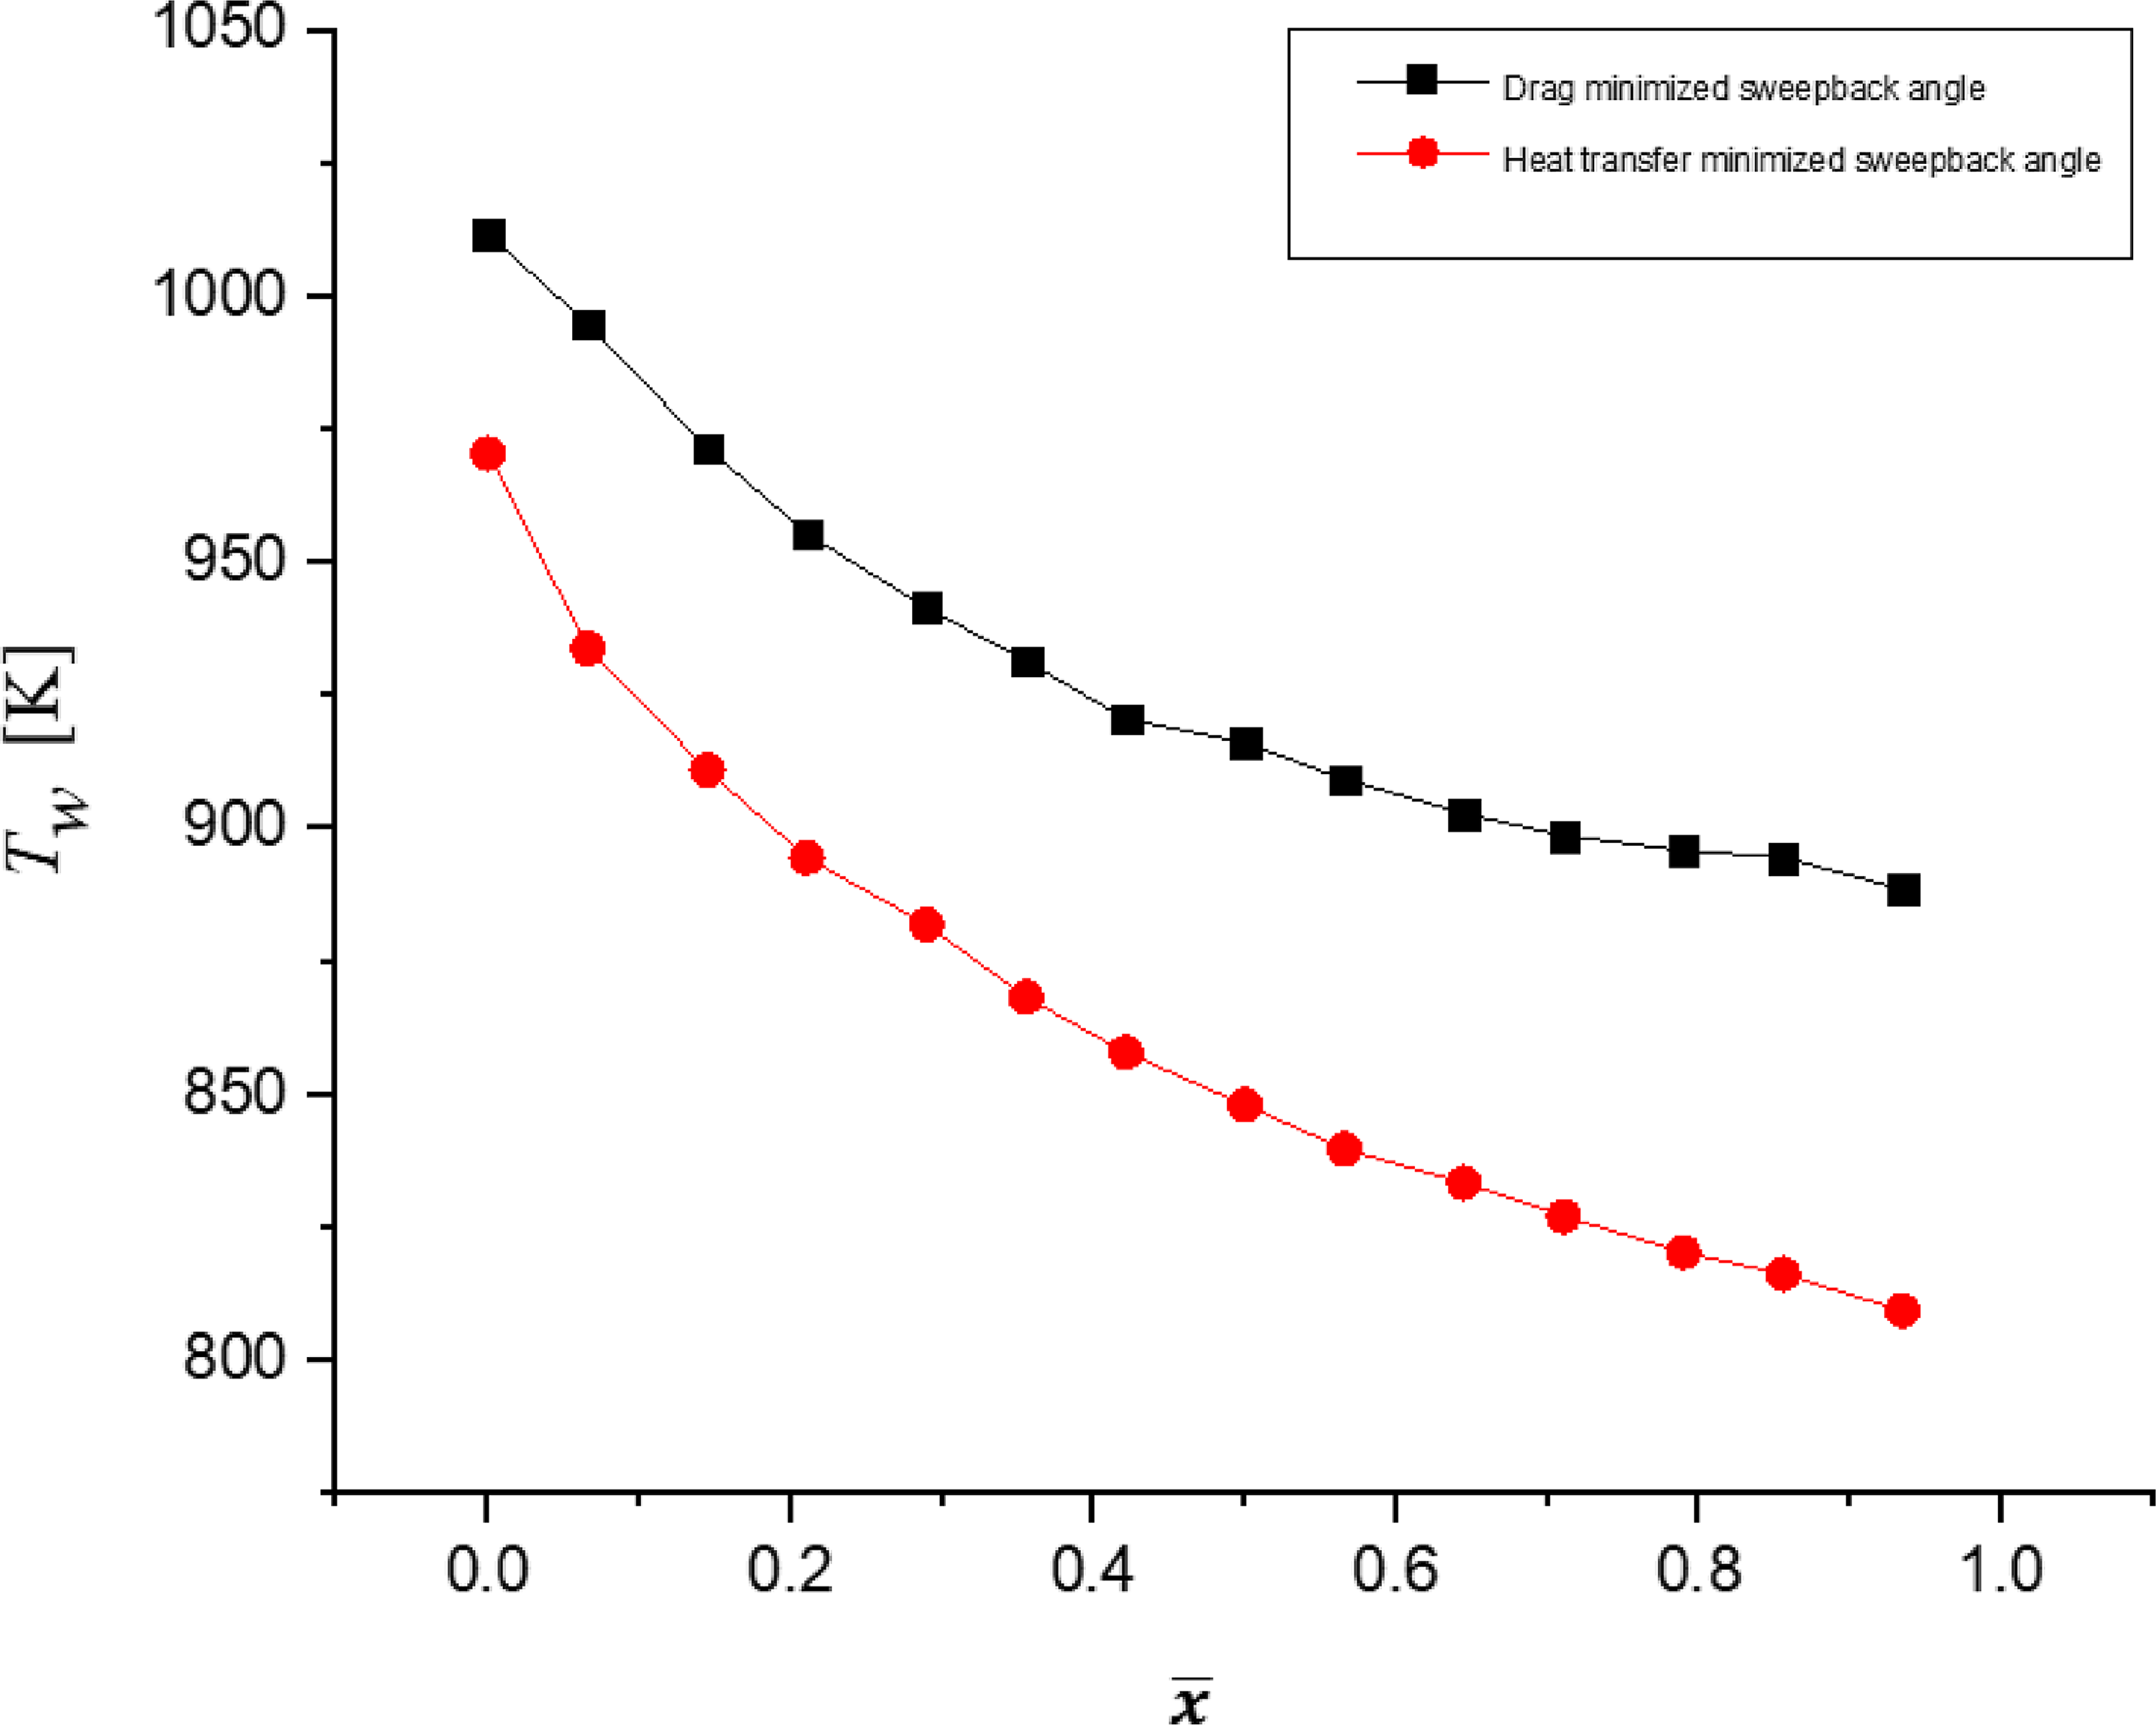
Figure 9. Wall temperature along SBLE for
![]() $\varLambda$
HT-min
and
$\varLambda$
HT-min
and
![]() $\varLambda$
Drag-min
.
$\varLambda$
Drag-min
.
3.1.1 Grid independence study
To determine the ideal number of cells needed, a grid independence analysis for M ∞ = 7 and sweepback angles of 70° and 80° is done. The graph shows variation of wall temperature with dimensionless distance measured along SBLE, as shown in Fig. 10. In order to shorten computation time, 137,436 cells for 70° sweepback angle and 136,985 cells for 80° sweepback angle are taken into consideration for the simulation at M ∞ = 7. The change in wall temperature for 70° (with 273,925 and 137,436 number of elements) and 80° (with 478,599 and 136,985 number of elements) is less than 1%.
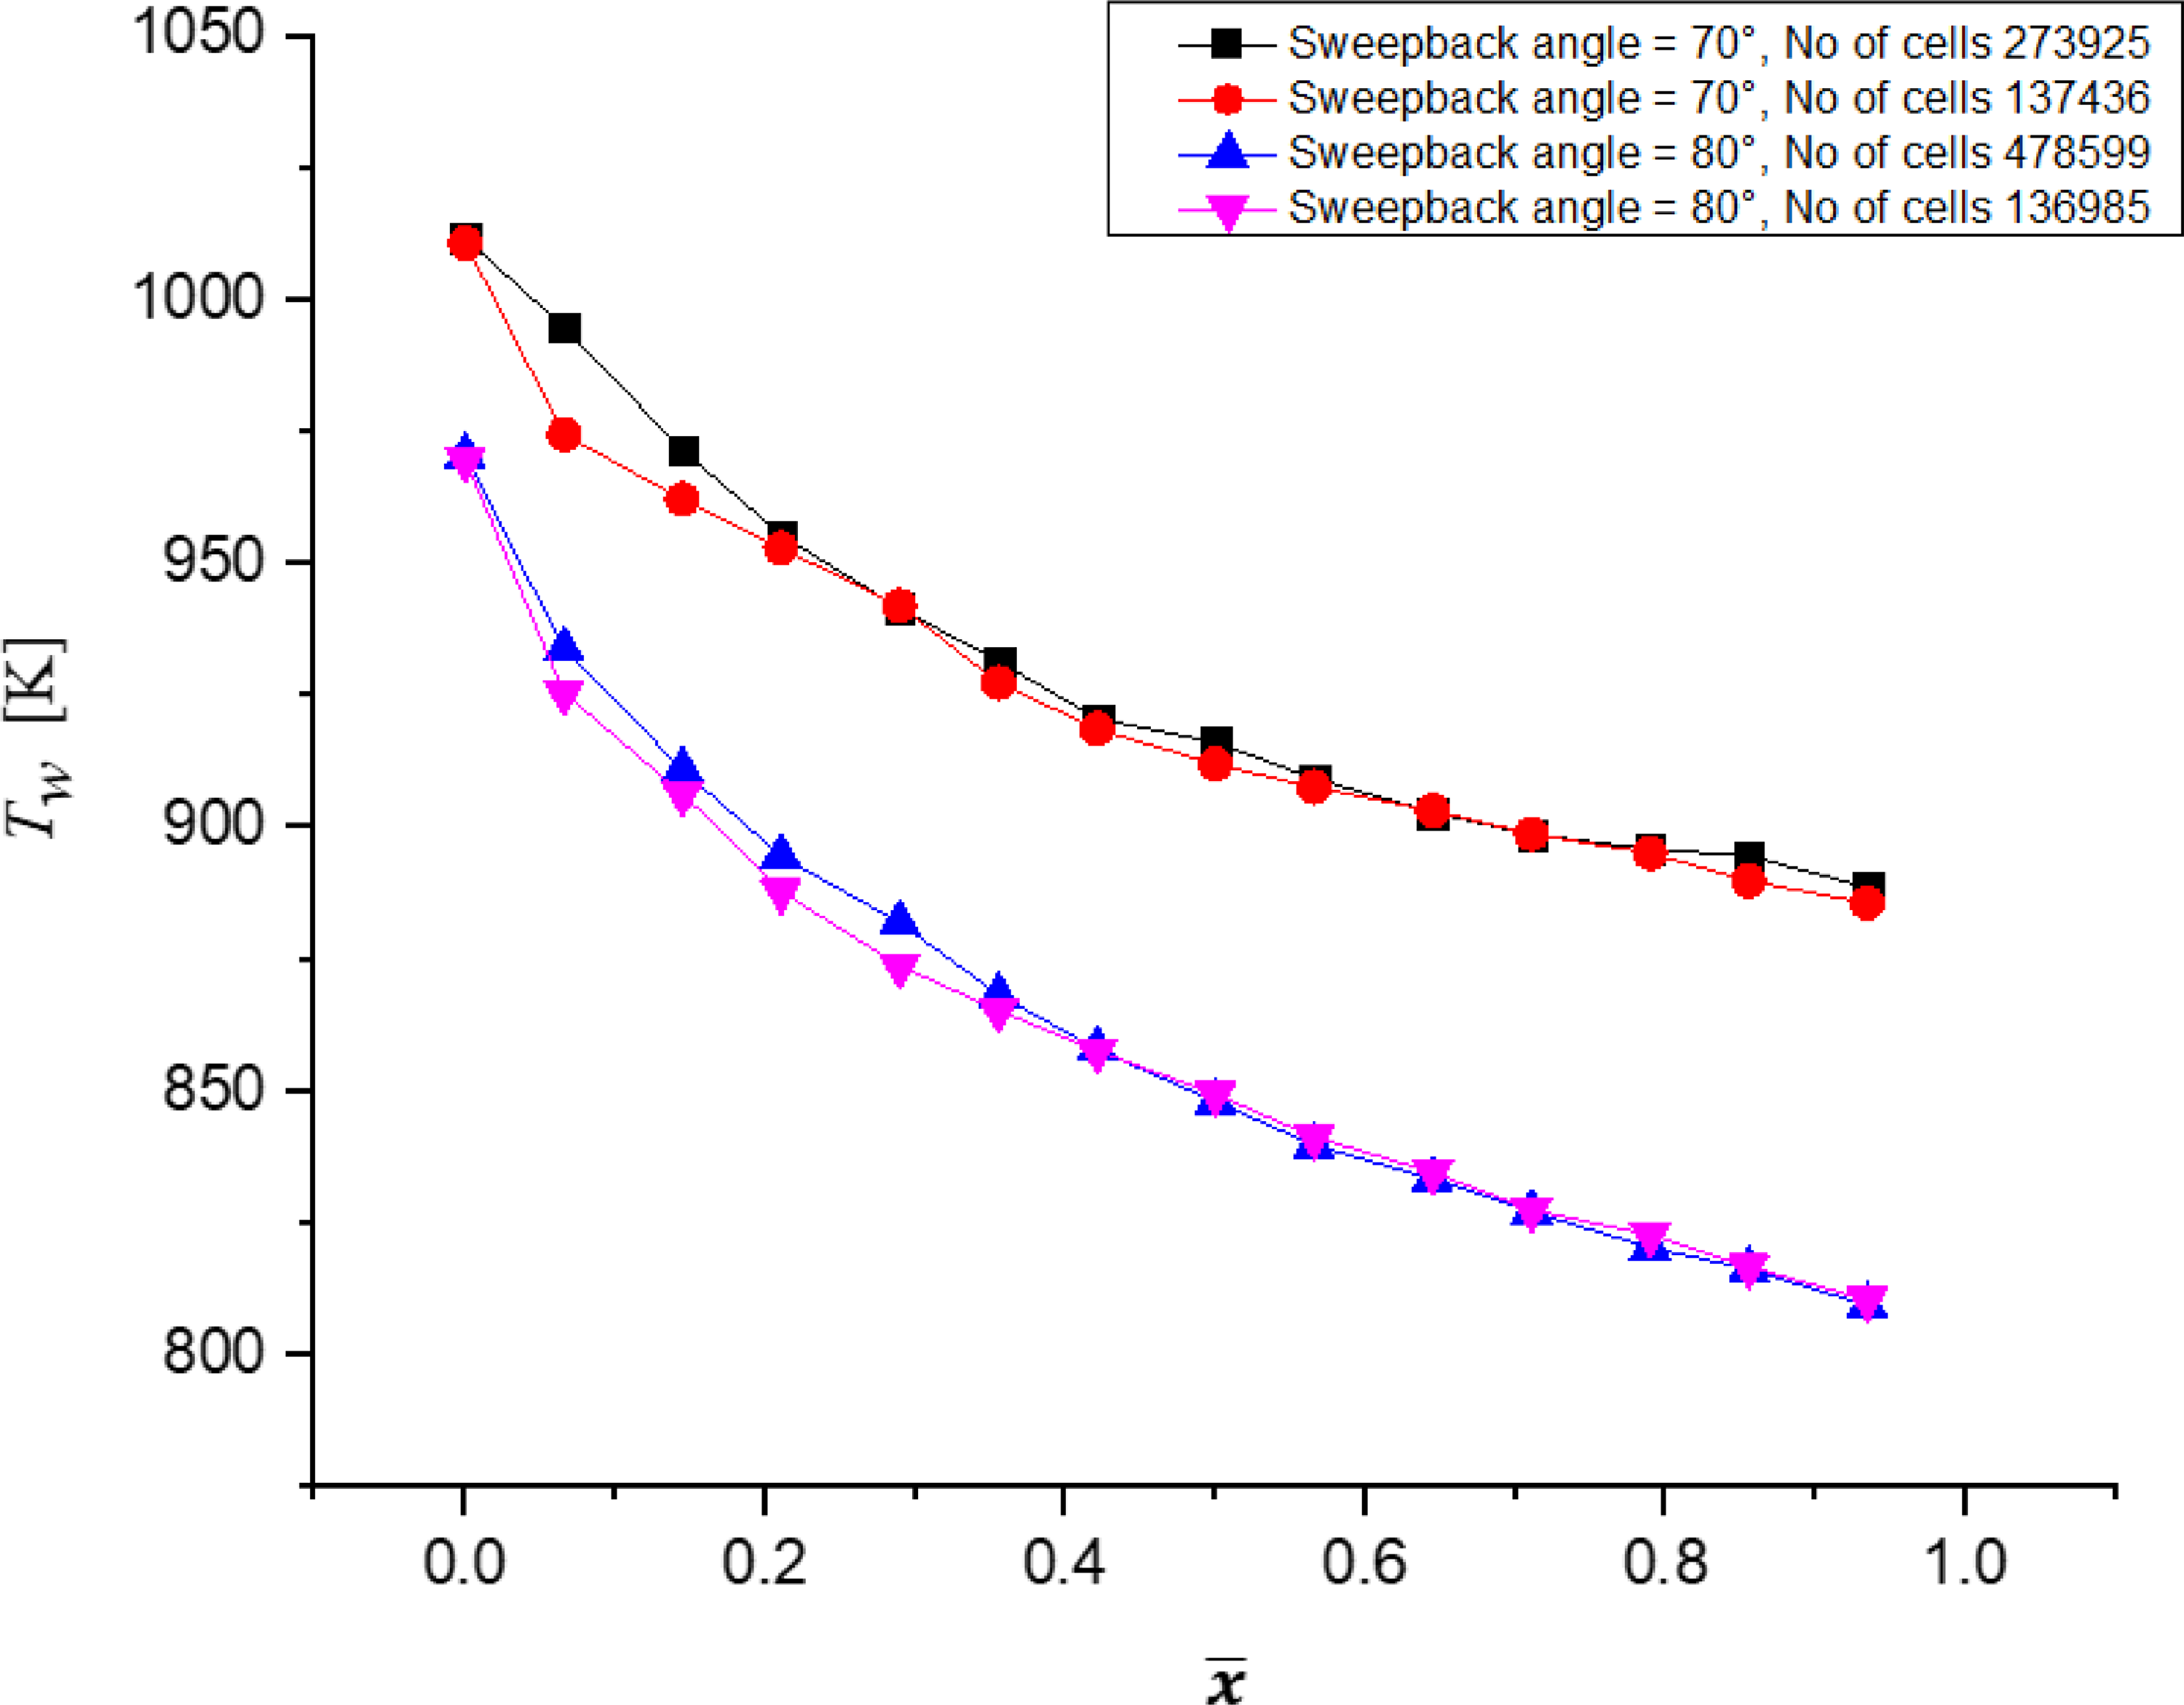
Figure 10. Grid independence test of wall temperature along SBLE for
![]() $\varLambda$
HT-min
and
$\varLambda$
HT-min
and
![]() $\varLambda$
Drag-min
.
$\varLambda$
Drag-min
.
3.2 Thickness of TPS for $\varLambda$
HT-min
and $\varLambda$
Drag-min
The wall temperatures from Section 3.1 became reference temperatures in the TPS’s thickness calculations for
![]() $\varLambda$
HT-min
and
$\varLambda$
HT-min
and
![]() $\varLambda$
Drag-min
. Thickness to maintain inner wall temperature at 323K was calculated by the simulations as, 0.02 and 0.024m, respectively, for
$\varLambda$
Drag-min
. Thickness to maintain inner wall temperature at 323K was calculated by the simulations as, 0.02 and 0.024m, respectively, for
![]() $\varLambda$
HT-min
and
$\varLambda$
HT-min
and
![]() $\varLambda$
Drag-min
.
$\varLambda$
Drag-min
.
3.2.1 Grid independence study
The grid independence study is carried out for finding thickness required for two outer wall temperatures, as shown in Fig. 11. Figure 11 shows the variation of temperature along the contact wall of inside air and solid domain. For 970K outer wall temperature, the number of elements for coarse and fine grids for thickness calculations problem are 659,078 and 1,062,850, respectively. For 1,013K outer wall temperature, the number of elements for coarse and fine grid for thickness calculations problem is 667,668 and 1,075,698, respectively. For coarse and fine grids for both outer wall temperatures, the maximum deviation between coarse and fine grids is not more than 1%.
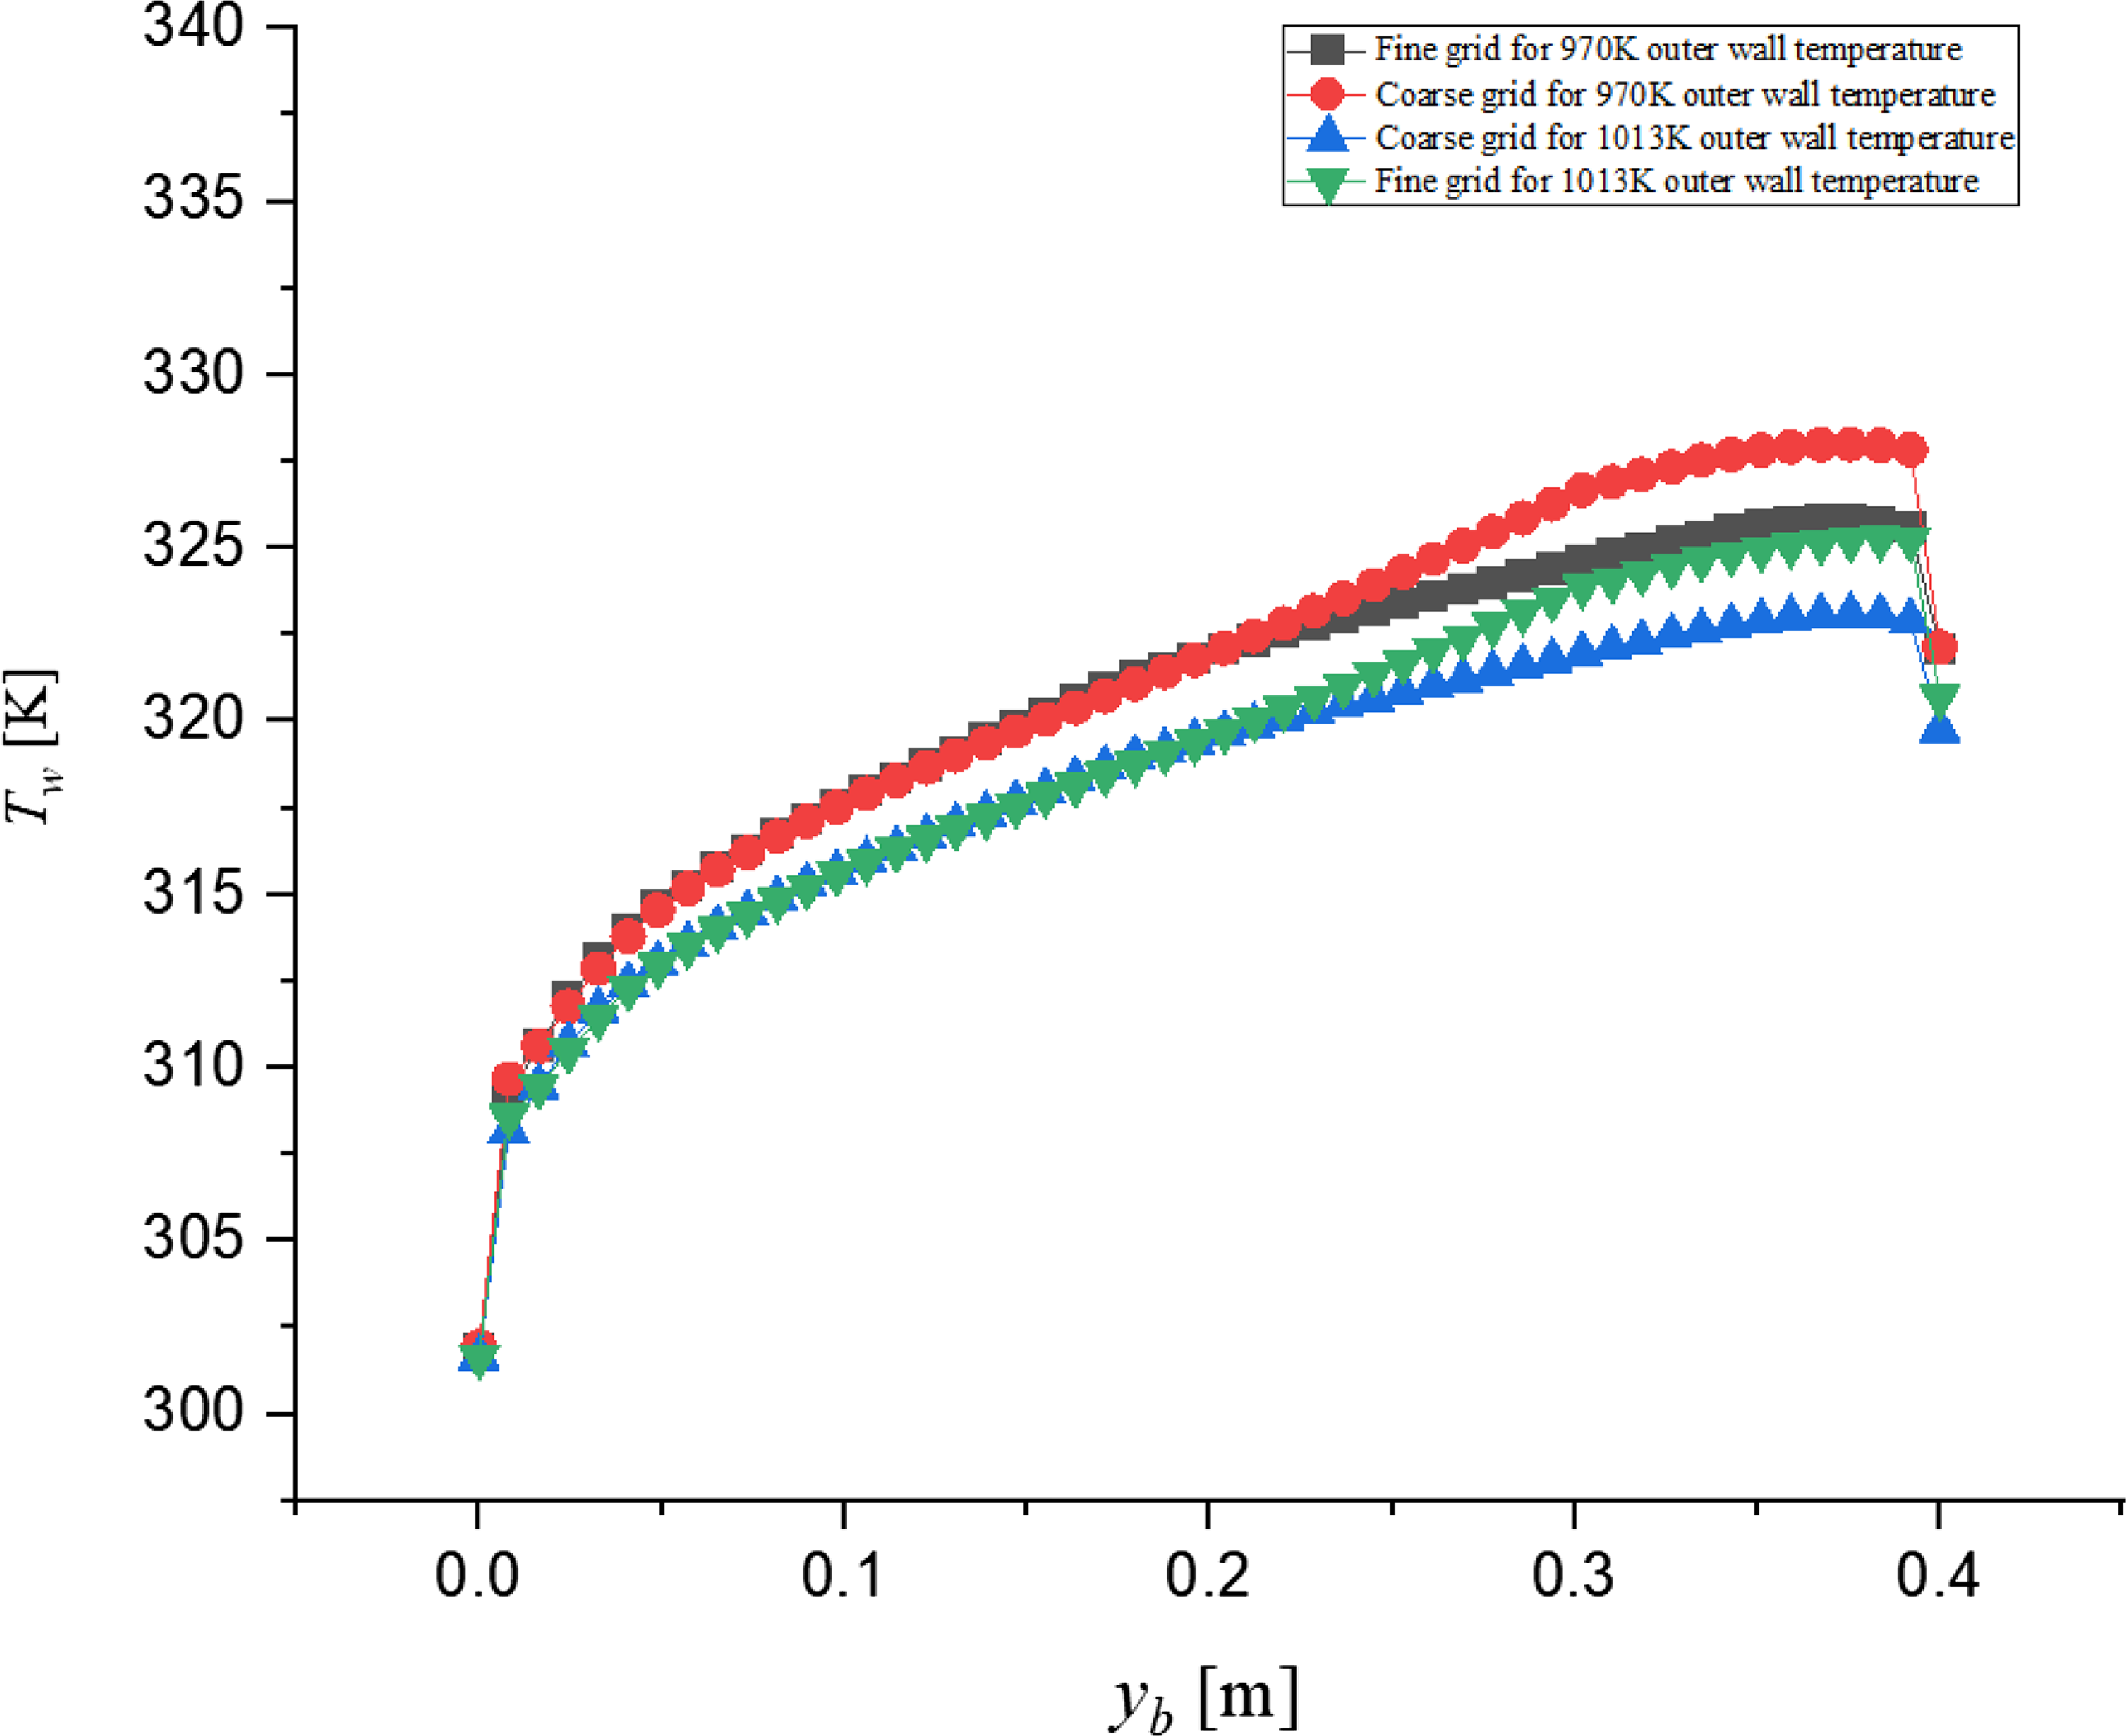
Figure 11. Grid independence study of outer wall temperature: (i) 970K (ii) 1,013K for thickness problem.
3.3 Percentage weight reduction with design at $\varLambda$
HT-min
The volume of TPS (Vol
2
) for
![]() $\varLambda$
HT-min
based geometry is 0.167m3,
$\varLambda$
HT-min
based geometry is 0.167m3,
![]() $\varLambda$
Drag-min
based geometry is 0.175m3, and the internal volume of both
$\varLambda$
Drag-min
based geometry is 0.175m3, and the internal volume of both
![]() $\varLambda$
is same at 0.266m3. The percentage weight reduction for RHV designed at
$\varLambda$
is same at 0.266m3. The percentage weight reduction for RHV designed at
![]() $\varLambda$
HT-min
instead of
$\varLambda$
HT-min
instead of
![]() $\varLambda$
Drag-min
is 4.8%. The weight reduction of the vehicle helps to reduce the total drag experienced by the vehicle.
$\varLambda$
Drag-min
is 4.8%. The weight reduction of the vehicle helps to reduce the total drag experienced by the vehicle.
Before thickening the TPS in outside direction, the upper and lower surface areas for
![]() $\varLambda$
HT-min
and
$\varLambda$
HT-min
and
![]() $\varLambda$
Drag-min
are 1.3 and 1.127m2, respectively. After applying corresponding thickness to geometries, the upper and lower surface areas for
$\varLambda$
Drag-min
are 1.3 and 1.127m2, respectively. After applying corresponding thickness to geometries, the upper and lower surface areas for
![]() $\varLambda$
HT-min
and
$\varLambda$
HT-min
and
![]() $\varLambda$
Drag-min
become 1.47 and 1.326m2, respectively. Similarly, for
$\varLambda$
Drag-min
become 1.47 and 1.326m2, respectively. Similarly, for
![]() $\varLambda$
HT-min
geometry, nose surface area increases from 0.053 to 0.076m2. For
$\varLambda$
HT-min
geometry, nose surface area increases from 0.053 to 0.076m2. For
![]() $\varLambda$
Drag-min
geometry, nose surface area increases from 0.032 to 0.0517m2. After thickening TPS, for
$\varLambda$
Drag-min
geometry, nose surface area increases from 0.032 to 0.0517m2. After thickening TPS, for
![]() $\varLambda$
HT-min
and
$\varLambda$
HT-min
and
![]() $\varLambda$
Drag-min
, the increase in surface area of RHV is 13.07% and 17.65%, and the rise in nose surface area is 43.4% and 61.5%, respectively.
$\varLambda$
Drag-min
, the increase in surface area of RHV is 13.07% and 17.65%, and the rise in nose surface area is 43.4% and 61.5%, respectively.
3.4 Percentage increase in payload capacity with design at $\varLambda$
HT-min
Thicknesses calculated in Section 2.3 are given in inside direction so that the overall volume of vehicle remains constant at 0.266m3 for both geometries at
![]() $\varLambda$
HT-min
and
$\varLambda$
HT-min
and
![]() $\varLambda$
Drag-min
. The surface areas for geometries at
$\varLambda$
Drag-min
. The surface areas for geometries at
![]() $\varLambda$
HT-min
and
$\varLambda$
HT-min
and
![]() $\varLambda$
Drag-min
are 1.3 and 1.127m2, respectively. As direction of thickness is inside for both sweepback angles, the surface areas of geometries remain constant even after thickening with TPS material. Internal volume of geometry with
$\varLambda$
Drag-min
are 1.3 and 1.127m2, respectively. As direction of thickness is inside for both sweepback angles, the surface areas of geometries remain constant even after thickening with TPS material. Internal volume of geometry with
![]() $\varLambda$
HT-min
and
$\varLambda$
HT-min
and
![]() $\varLambda$
Drag-min
are 0.103 and 0.099m3, respectively. The percentage increase in payload capacity with geometry designed at
$\varLambda$
Drag-min
are 0.103 and 0.099m3, respectively. The percentage increase in payload capacity with geometry designed at
![]() $\varLambda$
HT-min
is 4.04%.
$\varLambda$
HT-min
is 4.04%.
3.5 The Lift-induced drag with design at $\varLambda$
HT-min
The percentage reduction in induced drag for constant payload capacity and constant overall volume case will be different as the weight of TPS is different. At
![]() $\varLambda$
HT-min
, for constant payload capacity (higher overall volume) case, volume of TPS is 0.167m3, and for constant overall volume case (lower payload volume), volume of TPS is 0.163m3. At
$\varLambda$
HT-min
, for constant payload capacity (higher overall volume) case, volume of TPS is 0.167m3, and for constant overall volume case (lower payload volume), volume of TPS is 0.163m3. At
![]() $\varLambda$
Drag-min
, for constant payload capacity case, volume of TPS is 0.175m3, and for constant overall volume case, volume of TPS is 0.167m3. Wing spans (b) of RHV at
$\varLambda$
Drag-min
, for constant payload capacity case, volume of TPS is 0.175m3, and for constant overall volume case, volume of TPS is 0.167m3. Wing spans (b) of RHV at
![]() $\varLambda$
HT-min
= 1.07m and for
$\varLambda$
HT-min
= 1.07m and for
![]() $\varLambda$
Drag-min
, b is 0.811m, which remains constant for both, constant payload capacity and constant overall volume case. The percentage reduction in induced drag for constant payload capacity case and constant overall volume case are, 47.68% and 45.27%, respectively.
$\varLambda$
Drag-min
, b is 0.811m, which remains constant for both, constant payload capacity and constant overall volume case. The percentage reduction in induced drag for constant payload capacity case and constant overall volume case are, 47.68% and 45.27%, respectively.
3.6 Validation studies for temperature variation along SBLE and existence of $\varLambda$
HT-min
To validate current study, 2D axisymmetric vehicle body is simulated at M ∞ = 6 at sea level with current study setup, and compared the results with 3D geometry simulation [Reference Zhang, Xu, Ye, Li and Liu12]. Figure 12 shows the temperature variation along the vehicle body starting from forward stagnation point for 2D axisymmetric geometry with current study setup and 3D geometry results. Forward stagnation temperatures for 2D axisymmetric geometry and 3D geometry are 1,556.69 and 1,495K, respectively. The deviation of 2D axisymmetric geometry and 3D geometry temperature values at forward stagnation point is within 5%. Maximum temperature on SBLE for coarse (number of elements = 388,747), medium (number of elements = 637,223), and fine grid (number of elements = 645,178) is 1,586, 1,560, and 1,556K, respectively, which have maximum deviation of 2%, as shown in Fig. 13.
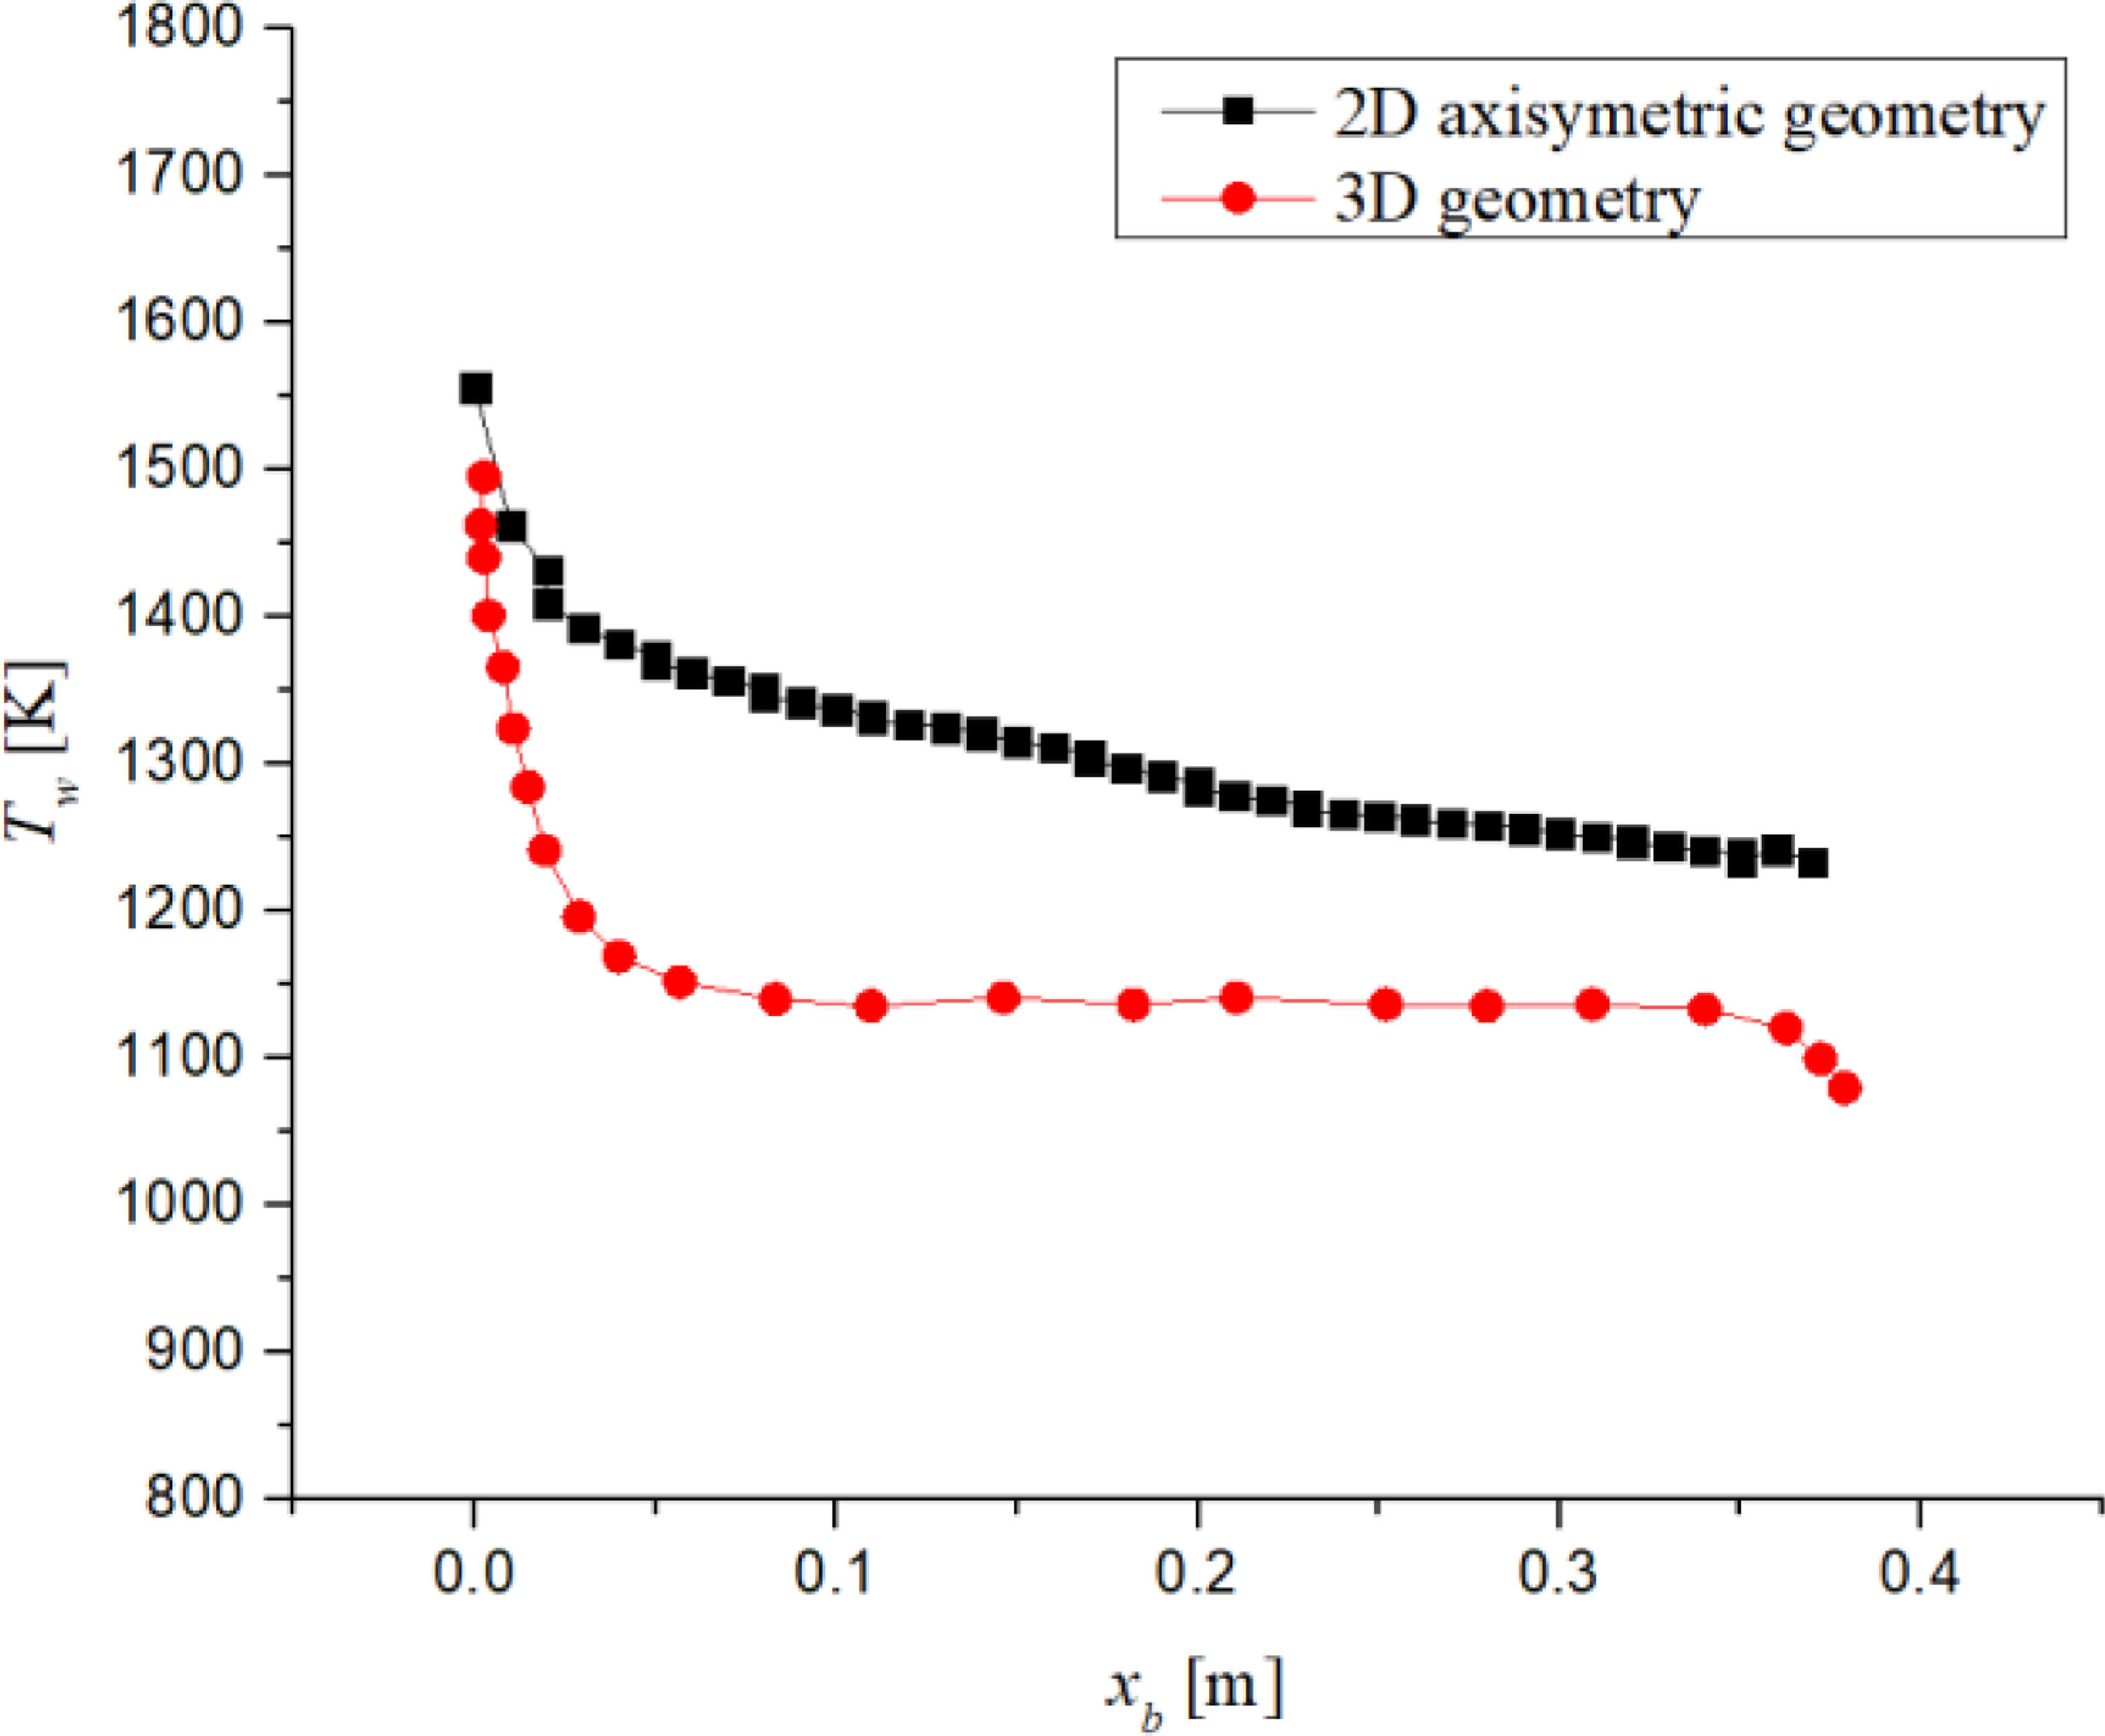
Figure 12. Temperature variation along vehicle started from forward stagnation point at M ∞ = 6.
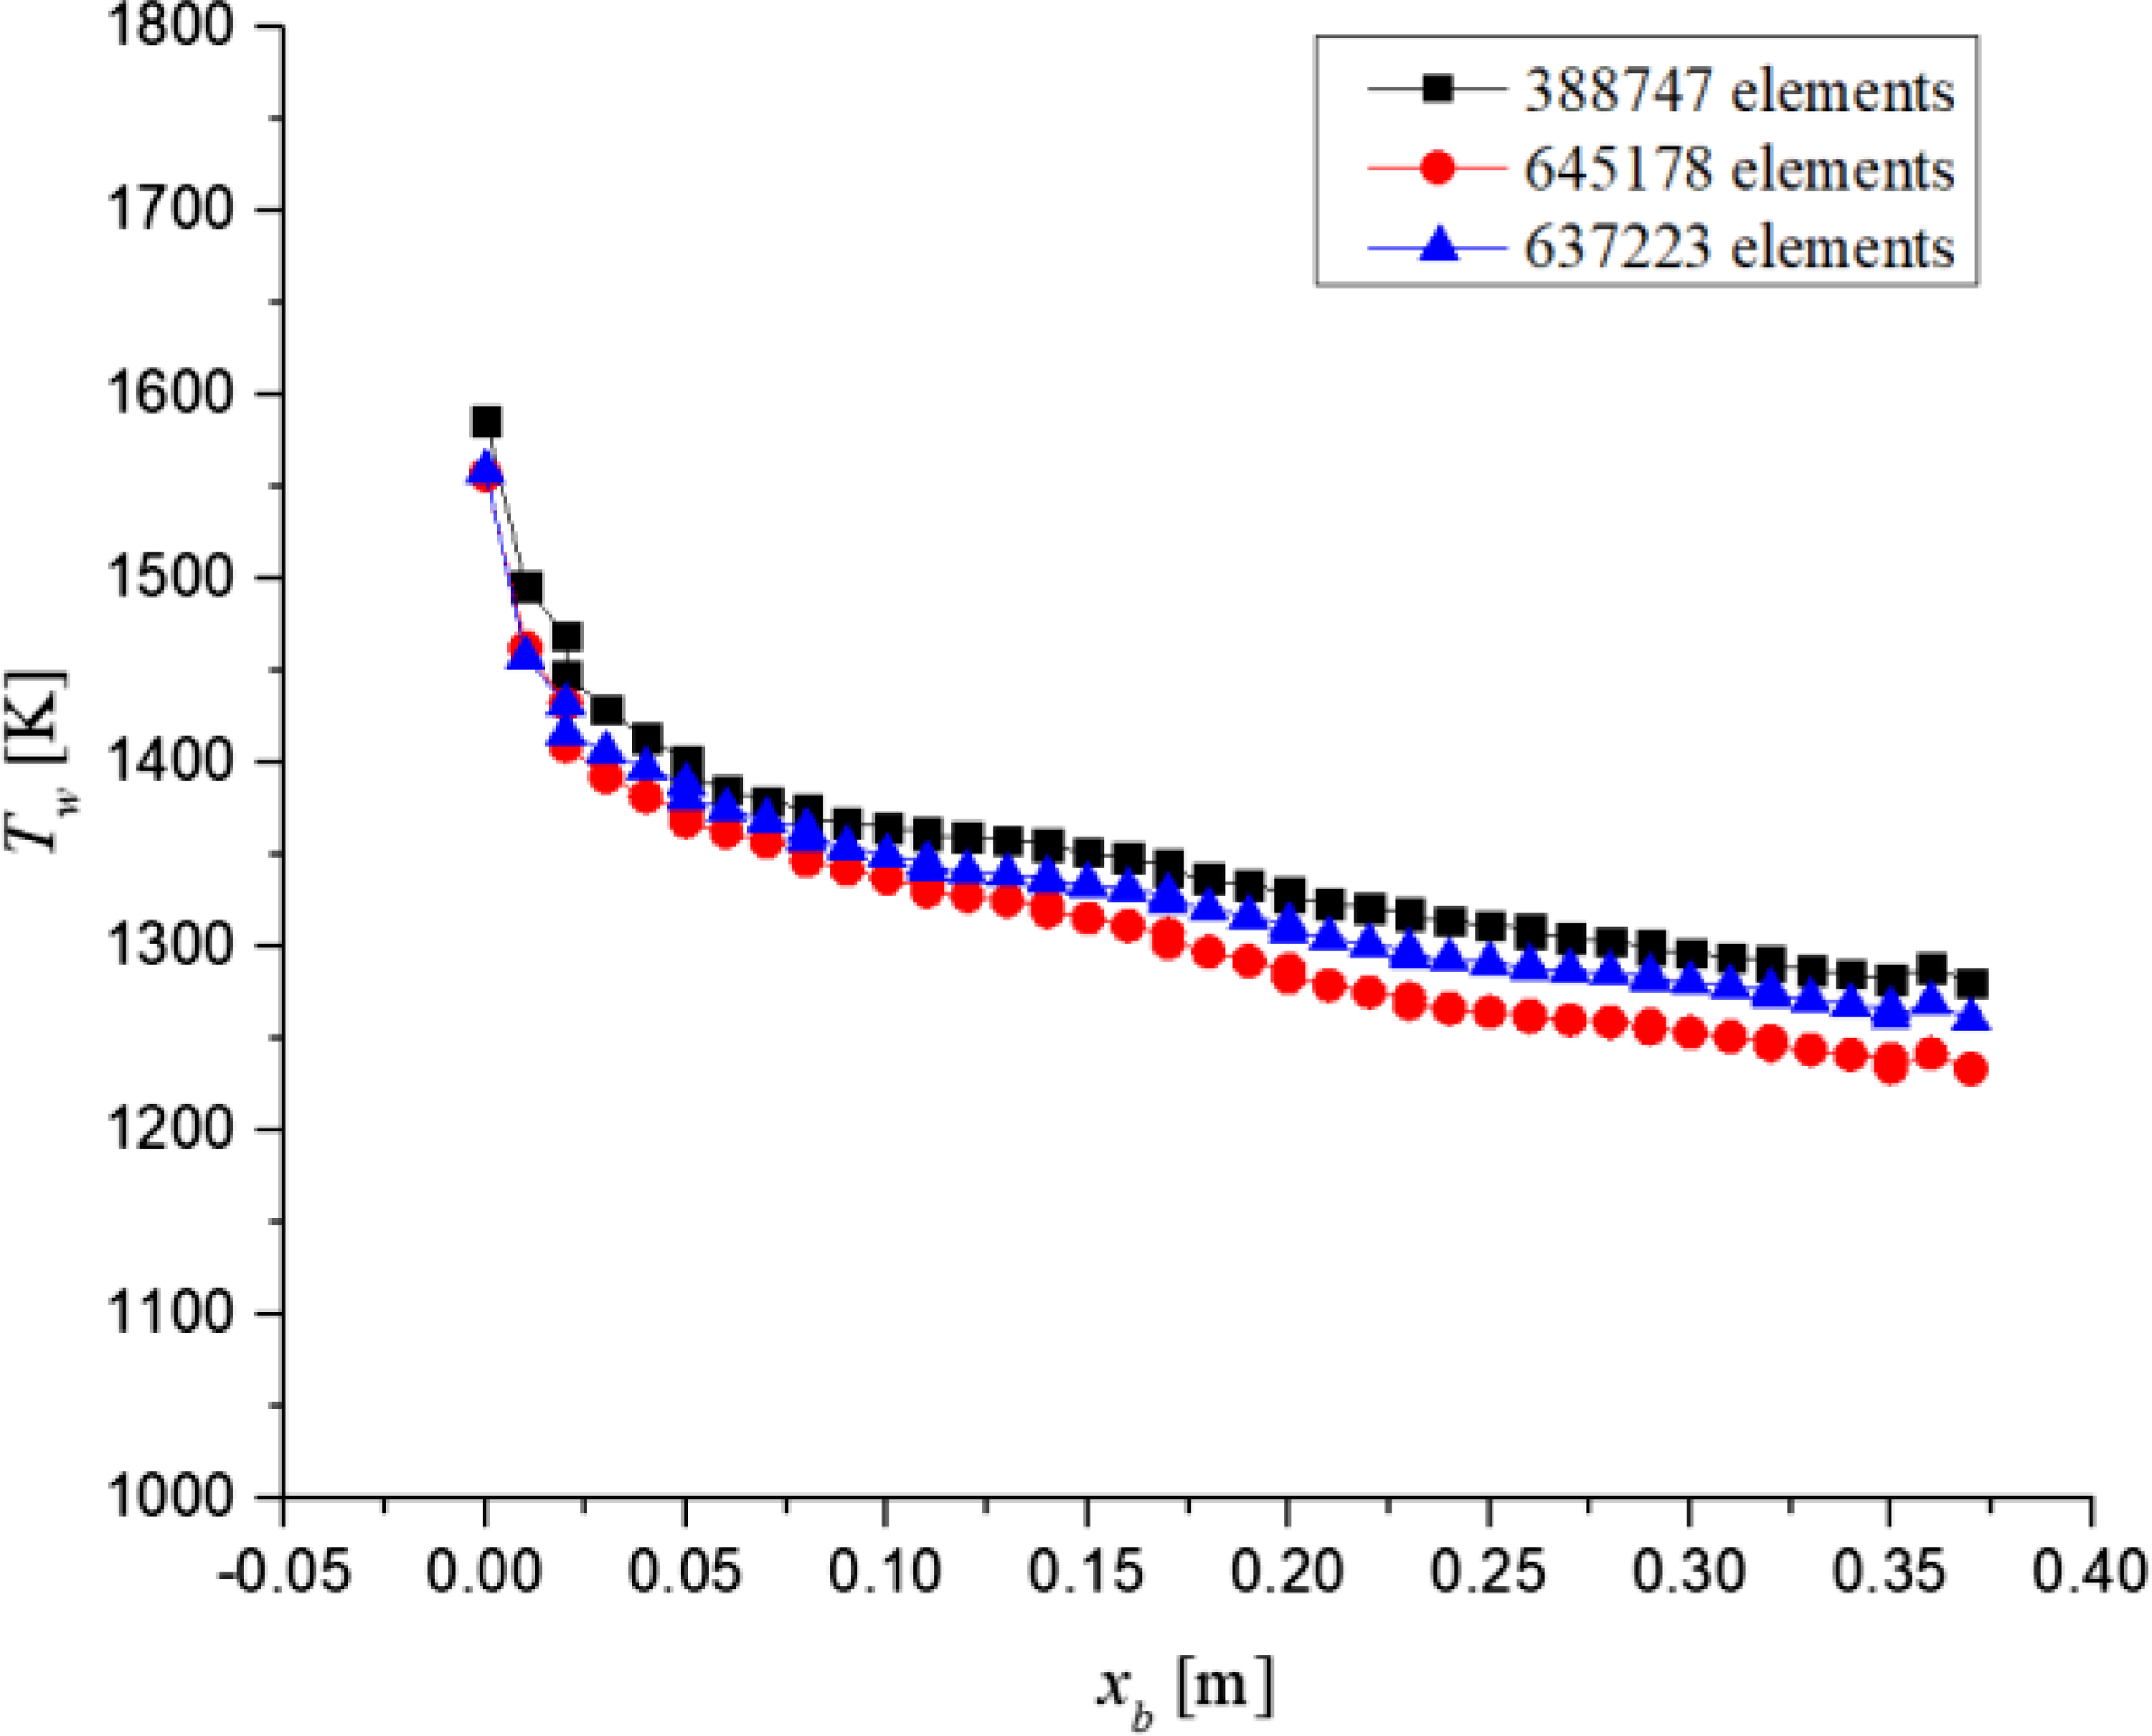
Figure 13. Grid independence of vehicle body for validation study at M ∞ = 6.
To ascertain the temperature behaviour along SBLE, Sachin and Mahulikar (2016) carried out a computational analysis on a 3D hypothesised body of a hypersonic vehicle for
![]() ${M_\infty }$
= 7 and H = 35km. For 70°, 80°, and 89°, the maximum temperature on SBLE is 969.08, 963, and 1,056K, respectively. For 60°, 70°, 80°, and 89°, the maximum heat flux is 11,470, 11,420, 50,284, and 52,240 W/m2, respectively. Heat flux generated by vehicle body is a result of drag experienced by vehicle. The heat flux generated is minimum at a sweepback angle, representing the sweepback angle where drag is minimum. Proves the existence of heat transfer minimised sweepback angle, which is different from drag minimised sweepback angle. According to the research results, there is a heat transfer minimised sweepback angle at an angle of 80°, which is distinct from the drag minimised sweepback angle at an angle of 70° [Reference Panaras and Drikakis48].
${M_\infty }$
= 7 and H = 35km. For 70°, 80°, and 89°, the maximum temperature on SBLE is 969.08, 963, and 1,056K, respectively. For 60°, 70°, 80°, and 89°, the maximum heat flux is 11,470, 11,420, 50,284, and 52,240 W/m2, respectively. Heat flux generated by vehicle body is a result of drag experienced by vehicle. The heat flux generated is minimum at a sweepback angle, representing the sweepback angle where drag is minimum. Proves the existence of heat transfer minimised sweepback angle, which is different from drag minimised sweepback angle. According to the research results, there is a heat transfer minimised sweepback angle at an angle of 80°, which is distinct from the drag minimised sweepback angle at an angle of 70° [Reference Panaras and Drikakis48].
In differ to
![]() $\varLambda$
Drag-min
, Mahulikar (2005) had presented and analytically demonstrated the existence of
$\varLambda$
Drag-min
, Mahulikar (2005) had presented and analytically demonstrated the existence of
![]() $\varLambda$
HT-min
for
$\varLambda$
HT-min
for
![]() ${M_\infty }$
= 7 and H = 35km, which is different from
${M_\infty }$
= 7 and H = 35km, which is different from
![]() $\varLambda$
Drag-min
. Mahulikar observed the
$\varLambda$
Drag-min
. Mahulikar observed the
![]() $\varLambda$
HT-min
at 80° and
$\varLambda$
HT-min
at 80° and
![]() $\varLambda$
Drag-min
at 70° [Reference Mahulikar9]. Using Saffil as an insulator and PICA as an ablator, a study was conducted on the simple geometry of RHV with TPS. Computational research by Shilwant and Mahulikar examined the behaviour of
$\varLambda$
Drag-min
at 70° [Reference Mahulikar9]. Using Saffil as an insulator and PICA as an ablator, a study was conducted on the simple geometry of RHV with TPS. Computational research by Shilwant and Mahulikar examined the behaviour of
![]() $\varLambda$
HT-min
for
$\varLambda$
HT-min
for
![]() ${M_\infty }$
= 5 to
${M_\infty }$
= 5 to
![]() ${M_\infty }$
= 9 and H = 35km, which stays constant at
${M_\infty }$
= 9 and H = 35km, which stays constant at
![]() $\varLambda$
= 80° for the range,
$\varLambda$
= 80° for the range,
![]() ${M_\infty }$
= 5–9 [Reference Shilwant and Mahulikar31].
${M_\infty }$
= 5–9 [Reference Shilwant and Mahulikar31].
The thickness calculation simulation is verified with a simple flat plate problem with assumptions as follows: (i) properties are calculated at mean film temperature and remain constant, (ii) properties of Saffil remain constant, (iii) material is isotropic. In given problem, density (
![]() $\rho$
) of air is 1.204kg/m3, and inlet velocity (V
in
) is 1.5m/s. The length considered for simulation is 0.4m. Sutherland’s law is used to compute the dynamic viscosity (
$\rho$
) of air is 1.204kg/m3, and inlet velocity (V
in
) is 1.5m/s. The length considered for simulation is 0.4m. Sutherland’s law is used to compute the dynamic viscosity (
![]() $\mu$
), and the result is 1.9e-5kg/(m×s). The Reynolds number obtained from the above properties is 3.8e4. So the flow is considered a laminar flow, and the following relationship is used to calculate heat transfer coefficient (h), Nu = 0.664 × (Re) 1/2× (Pr) 1/3, where Nu (= h×L/k
air
) is Nusselt number, Pr (=
$\mu$
), and the result is 1.9e-5kg/(m×s). The Reynolds number obtained from the above properties is 3.8e4. So the flow is considered a laminar flow, and the following relationship is used to calculate heat transfer coefficient (h), Nu = 0.664 × (Re) 1/2× (Pr) 1/3, where Nu (= h×L/k
air
) is Nusselt number, Pr (=
![]() $\mu$
× C
p
/k
air
) is Prandtl number. Specific heat (C
p
) and thermal conductivity of air (k
air
) at the mean film temperature are 1,007J/(kg× K) and 27.23e-3W/(m×K), respectively. The convective heat transfer coefficient is obtained as 7.85W/(m2×K). Conductive and convective heat transfer have the same value at the contact wall between the TPS and inside air. After equating, thickness value for
$\mu$
× C
p
/k
air
) is Prandtl number. Specific heat (C
p
) and thermal conductivity of air (k
air
) at the mean film temperature are 1,007J/(kg× K) and 27.23e-3W/(m×K), respectively. The convective heat transfer coefficient is obtained as 7.85W/(m2×K). Conductive and convective heat transfer have the same value at the contact wall between the TPS and inside air. After equating, thickness value for
![]() $\varLambda$
HT-min
is 0.028m and for
$\varLambda$
HT-min
is 0.028m and for
![]() $\varLambda$
Drag-min
is 0.031m. The error [= (thickness from analytical calculations – thickness from simulation) × 100/(thickness from analytical calculations)] for
$\varLambda$
Drag-min
is 0.031m. The error [= (thickness from analytical calculations – thickness from simulation) × 100/(thickness from analytical calculations)] for
![]() $\varLambda$
HT-min
and
$\varLambda$
HT-min
and
![]() $\varLambda$
Drag-min
are 28% and 22.5%, respectively.
$\varLambda$
Drag-min
are 28% and 22.5%, respectively.
4.0 Summary and conclusions
For two alternative lifting body (of RHV) designs, an aero-thermal condition is anticipated in this paper using a CFD simulation in enough depth to allow passive TPS design. 3-D geometries were generated for two different configurations and for each with two different cases: case (i): same payload capacity (TPS thickened outside of vehicle surface), case (ii): same overall volume (TPS thickened inside vehicle surface). According to the outcomes, the key research findings can be summed up as follows:
-
1. For $\varLambda$
Drag-min
, the heat generation (due to drag experienced by the vehicle) is less than that of the drag experienced by the vehicle at $\varLambda$
HT-min
, but heat transfer to vehicle is not least. For $\varLambda$
HT-min
, heat generated is not minimum, but the heat transfer to vehicle is minimal, resulting in lower wall temperature at outer surface of TPS than $\varLambda$
Drag-min
. The wall temperatures of simulated RHV for $\varLambda$
Drag-min
and $\varLambda$
HT-min
are typically 1,013 and 970K, respectively.
 -
2. The thicknesses to maintain the inner wall temperatures at 323K for $\varLambda$
Drag-min
and $\varLambda$
HT-min
are typically 0.024 and 0.02m, respectively.
 -
3. The percentage weight reduction of the TPS of RHV (overall weight of vehicle) for the same payload capacity (higher overall volume) case with the use of $\varLambda$
HT-min
instead of $\varLambda$
Drag-min
is 4.8%. This weight reduction helps to reduce overall operational cost of the mission by reducing lift-induced drag and fuel consumption.
 -
4. For same payload capacity case, the nose, upper, and lower surface areas increase for both geometries after applying thickness of TPS material. The total (nose, upper, and lower) surface area for $\varLambda$
HT-min
(1.546m2) is more as compared to $\varLambda$
Drag-min
(1.377m2). So the heat flux associated with body for RHV at $\varLambda$
HT-min
is less as compared to $\varLambda$
Drag-min
.
 -
5. For same overall volume (reduced payload volume) case, the percentage increase in payload capacity is 4.04% with design of vehicle at $\varLambda$
HT-min
instead of $\varLambda$
Drag-min
. This increase in payload capacity (together with reduced TPS weight) helps to reduce overall operational cost of the mission.
 -
6. For same overall volume case, the wetted surface area of RHV before and after thickening of TPS, remains constant. But the wetted surface area available for heat transfer is more for $\varLambda$
HT-min
(1.353m2) as compared to $\varLambda$
Drag-min
(1.159m2). So, the resultant heat flux associated with vehicle body is less for $\varLambda$
HT-min
as compared to $\varLambda$
Drag-min
.
 -
7. For $\varLambda$
HT-min
net heat flux associated with the body is less as compared to vehicle body at $\varLambda$
Drag-min
in both cases. As heat flux associated with vehicle body is less, the localised rise in temperature is also less for $\varLambda$
HT-min
. So the vehicle design at $\varLambda$
HT-min
also gives the benefit of an increase in chances of survival from increased localised heating, e.g. due to possible fluctuations in trajectory parameters.
 -
8. The design of RHV at $\varLambda$
HT-min
serves several benefits and also helps to reduce lift-induced drag for RHV. From the results, the % reduction in lift-induced drag is a significant reduction of 47.68% and 45.27% for constant payload capacity (increased overall volume) case and constant overall volume (reduced payload volume) case, respectively. The RHV design at $\varLambda$
HT-min
always reduces TPS weight and the lift-induced drag, which reduces the drag experienced by the vehicle, reducing the overall operation cost of the corresponding mission at a given trajectory.
Acknowledgments
The authors thank the Ministry of Education, Govt. of India, for the financial support in the form of a Teaching Assistantship to PhD-student Rohan Shilwant (Roll no. 194010012 – IIT-Bombay). Authors are grateful to the Ikerbasque Professorship program of the Basque Foundation for Science, Basque Country (Spain), for the support for this research to S.P. Mahulikar, vide ID: Z0555235C.
Competing interests
All co-authors have seen and agree with the contents of the manuscript and there is no financial interest to report. We certify that the submission is original work and is not under review at any other publication.


