Article contents
[no title]
Published online by Cambridge University Press: 01 August 2014
Abstract

- Type
- Communications
- Information
- Copyright
- Copyright © American Political Science Association 1974
References
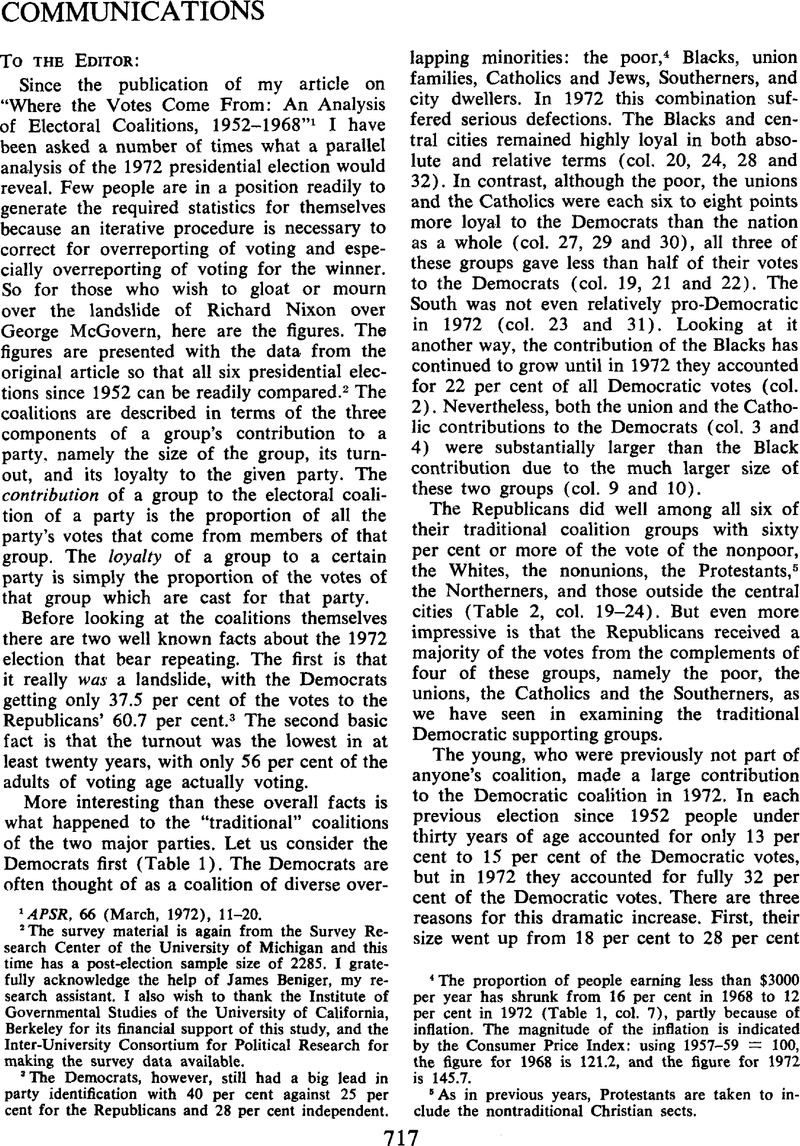
1 APSR, 66 (03, 1972), 11–20 CrossRefGoogle Scholar.
2 The survey material is again from the Survey Research Center of the University of Michigan and this time has a post-election sample size of 2285. I gratefully acknowledge the help of James Beniger, my research assistant. I also wish to thank the Institute of Governmental Studies of the University of California, Berkeley for its financial support of this study, and the Inter-University Consortium for Political Research for making the survey data available.
3 The Democrats, however, still had a big lead in party identification with 40 per cent against 25 per cent for the Republicans and 28 per cent independent.
4 The proportion of people earning less than $3000 per year has shrunk from 16 per cent in 1968 to 12 per cent in 1972 (Table 1, col. 7), partly because of inflation. The magnitude of the inflation is indicated by the Consumer Price Index: using 1957-59 = 100, the figure for 1968 is 121.2, and the figure for 1972 is 145.7.
5 As in previous years, Protestants are taken to include the nontraditional Christian sects.
- 9
- Cited by


Comments
No Comments have been published for this article.