Introduction
Ice-core studies in the Arctic have been carried out in Greenland, the Canadian High Arctic, Svalbard and the Russian Arctic islands. to further define spatial and temporal variability of climatic and environmental changes across the entire Arctic, the Ice-Core Circum-Arctic Paleoclimate Program (ICAPP) was initiated under the International Arctic Science Committee (IASC) and Past Global Changes (PAGES) of the International Geosphere–Biosphere Programme (IGBP). Since the inception of ICAPP, several new ice cores have been recovered from ice caps where ice-core data were sparse (Reference FisherFisher and others, 1998; Reference Grumet, Wake, Zielinski, Fisher, Koerner and JacobsGrumet and others, 1998; Reference O’DwyerO’Dwyer and others, 2000;Reference WatanabeWatanabe and others, 2001). This paper is concerned with snow-pit samples and an 85m deep ice core retrieved from Penny Ice Cap, southern Baffin Island, Canada.
Penny Ice Cap is the southernmost major ice cap in the Canadian Arctic. An 85 m deep ice core was recovered from Penny Ice Cap in 1995, along with a previously reported 334m deep ice core to the bedrock (Reference FisherFisher and others, 1998; Reference Grumet, Wake, Zielinski, Fisher, Koerner and JacobsGrumet and others, 1998, Reference Grumet2001). At the drill site, about 40% (mass fraction) of the snow accumulation melts and refreezes (Reference FisherFisher and others, 1998). In spite of the relatively high summer melt, an earlier study suggests that a glaciochemical record from Penny Ice Cap can still be interpreted at a sub-decadal temporal resolution (Reference Grumet, Wake, Zielinski, Fisher, Koerner and JacobsGrumet and others, 1998). In this paper, we further examine the effects of summer melt, presenting new δ18O and ion-chemistry data obtained from snow pits and the 85m deep core. We also evaluate signal and noise (including that caused by meltwater percolation) in the ice-core record from Penny Ice Cap by comparing the new results from the 85m deep core with those from the 334m deep core. We then discuss the climatic and environmental changes that occurred in Baffin Island during the last two centuries. the comparison of the two ice cores allows a better understanding of the ice-core signals.
Sample Collection
Ice core
An 85 m deep ice core was retrieved on the central ridge of Penny Ice Cap (67˚15’N, 65˚46’W; 1900ma.s.l.) in 1995 (Fig. 1), 2.5 m apart from the 334m deep ice core that reached bedrock (Reference FisherFisher and others, 1998). the drill was cleaned before the coring operation by drilling a 10 m core adjacent to the core site. After each drill run, the core recovered was allowed to slide from the core barrel directly into a clean plastic bag without handling. Then the bag was stapled. Special care was taken during this procedure to avoid contamination of the core.
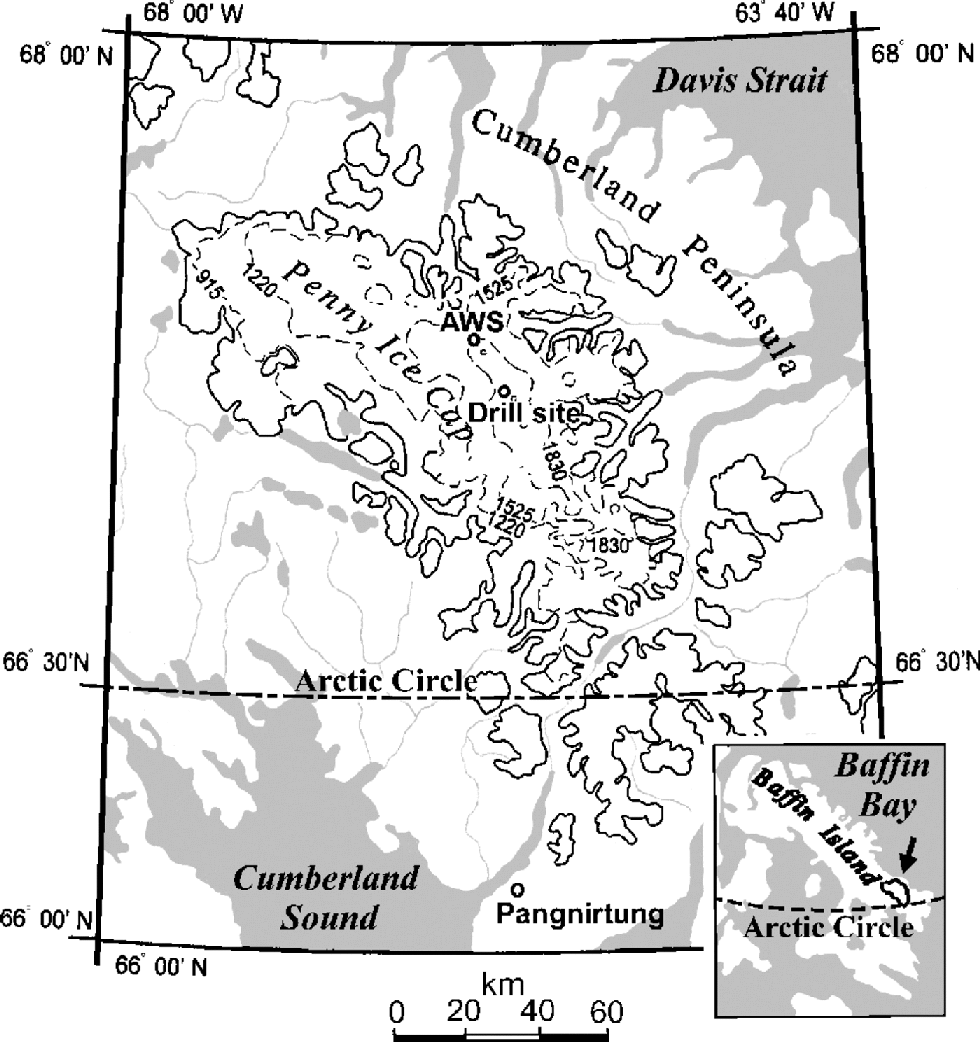
Fig. 1 Location of Penny Ice Cap, Baffin Island, after Reference Zdanowicz, Zielinski and WakeZdanowicz and others (1998). the locations of the automatic weather station (AWS) and ice-core drilling site in 1995 are shown.
The upper 40 mof the core was processed in a laboratory tent in the field. the rest of the core was transported to Ottawa frozen, and processed in a clean-air cabinet placed in a low-temperature room. Both in the tent and in the clean-air cabinet, the core was processed using the following procedure. First, the long side of each plastic bag was opened. the core was then cut with a pre-cleaned saw into 4–5 cm sections which were put into Whirlpak bags, using plastic gloves. Whenever a sample was handled, a new plastic glove was used to avoid sample cross-contamination.
Although the core surface is not scraped off, contamination can be avoided if the core barrel is pre-cleaned and if the core is handled with clean plastic gloves through the whole drilling and processing procedure. the Agassiz ice core, having been processed with a similar method (Reference Koerner, Fisher and Goto-AzumaKoerner and others, 1999), retained seasonal variations of ions, which suggests that there is no serious contamination with this method. Furthermore, the 334m deep ice core drilled near the presently studied 85m core, the surface of which was scraped off with a clean knife, shows generally very similar ion concentrations, as will be seen later. These facts confirm that there was no detectable contamination with the method we adopted in this study.
The samples bagged in the field were melted in the field hut, and those bagged in Ottawa were melted in the laboratory. Melted samples were decanted into pre-cleaned 100 mL plastic bottles for ion analysis, and 20 mL plastic bottles for δ18O analysis, either in the field or in the Ottawa laboratory. the slightly different sampling environment in a field tent from that in a clean-air cabinet in Ottawa appears to have no contamination effects, because no sudden change in concentration levels is observed at 40 m depth. All the bottled samples were immediately refrozen. the samples for ion analysis were kept frozen until ready for analysis in Japan, while those for δ18O analysis were kept frozen except during transportation to Copenhagen which took about a week.
Pit-wall samples
To examine physical and chemical stratigraphy of the ice-cap surface, a 3.3m deep pit was dug near the drill site in May 1995. In addition to this pit, a 4.8 m deep pit was dug close to the automatic weather station (AWS) in May 1994. the AWS site (67˚17N, 65 ˚55W; 1900ma.s.l.), also located on the central ridge of Penny Ice Cap, is 6km distant from the drill site (Fig.1).
After observation of the visible stratigraphy in each pit, samples were collected from a pre-cleaned wall of the pit using a pre-cleaned stainless-steel knife and disposable plastic gloves. Pit-wall samples were collected vertically, and continuously in approximately 0.05 mincrements, from the snow surface to a depth 0.1–0.2m above the bottom of the pit. the samples were placed into Whirlpak bags. the bagged samples collected in 1995 were melted in the field hut, and then treated in the same manner as the ice-core samples. the pit-wall samples collected in 1994 were transported frozen to Ottawa and melted in the Ottawa laboratory.
Laboratory Analysis
The ice core and pit-wall samples collected in 1995 and 1994 were analyzed for Cl–, NO3 – and SO4 2– using Dionex model Dx-500 and Dionex model Dx-100 ion chromatographs in the Nagaoka Institute of Snow and Ice Studies (NISIS) clean room (class 10000) in Nagaoka, Japan. the detection limit was 1ng g–1 for each of these anions. Na+, K+, Mg2+ and Ca2+ were determined for the ice core and 1995 pit-wall samples using a Dionex model Dx-100 ion chromatograph in the NISIS clean room. the detection limit was 1ng g–1 for Na+, and 0.5 ng g–1 for the other ions. δ18O was measured at the Geophysical Institute at the University of Copenhagen.
Results and Discussion
Physical and chemical stratigraphy of the pits
Figures 2 and 3 show visible stratigraphy, and profiles of ion concentrations and δ18O, respectively, of the 1995 and 1994 pits. Frequent occurrence of ice and icy firn layers in both of the pits indicates relatively heavy summer melt on Penny Ice Cap, as reported in earlier papers (Reference HoldsworthHoldsworth, 1984; Reference FisherFisher and others, 1998; Reference Grumet, Wake, Zielinski, Fisher, Koerner and JacobsGrumet and others, 1998; Reference Zdanowicz, Zielinski and WakeZdanowicz and others, 1998).
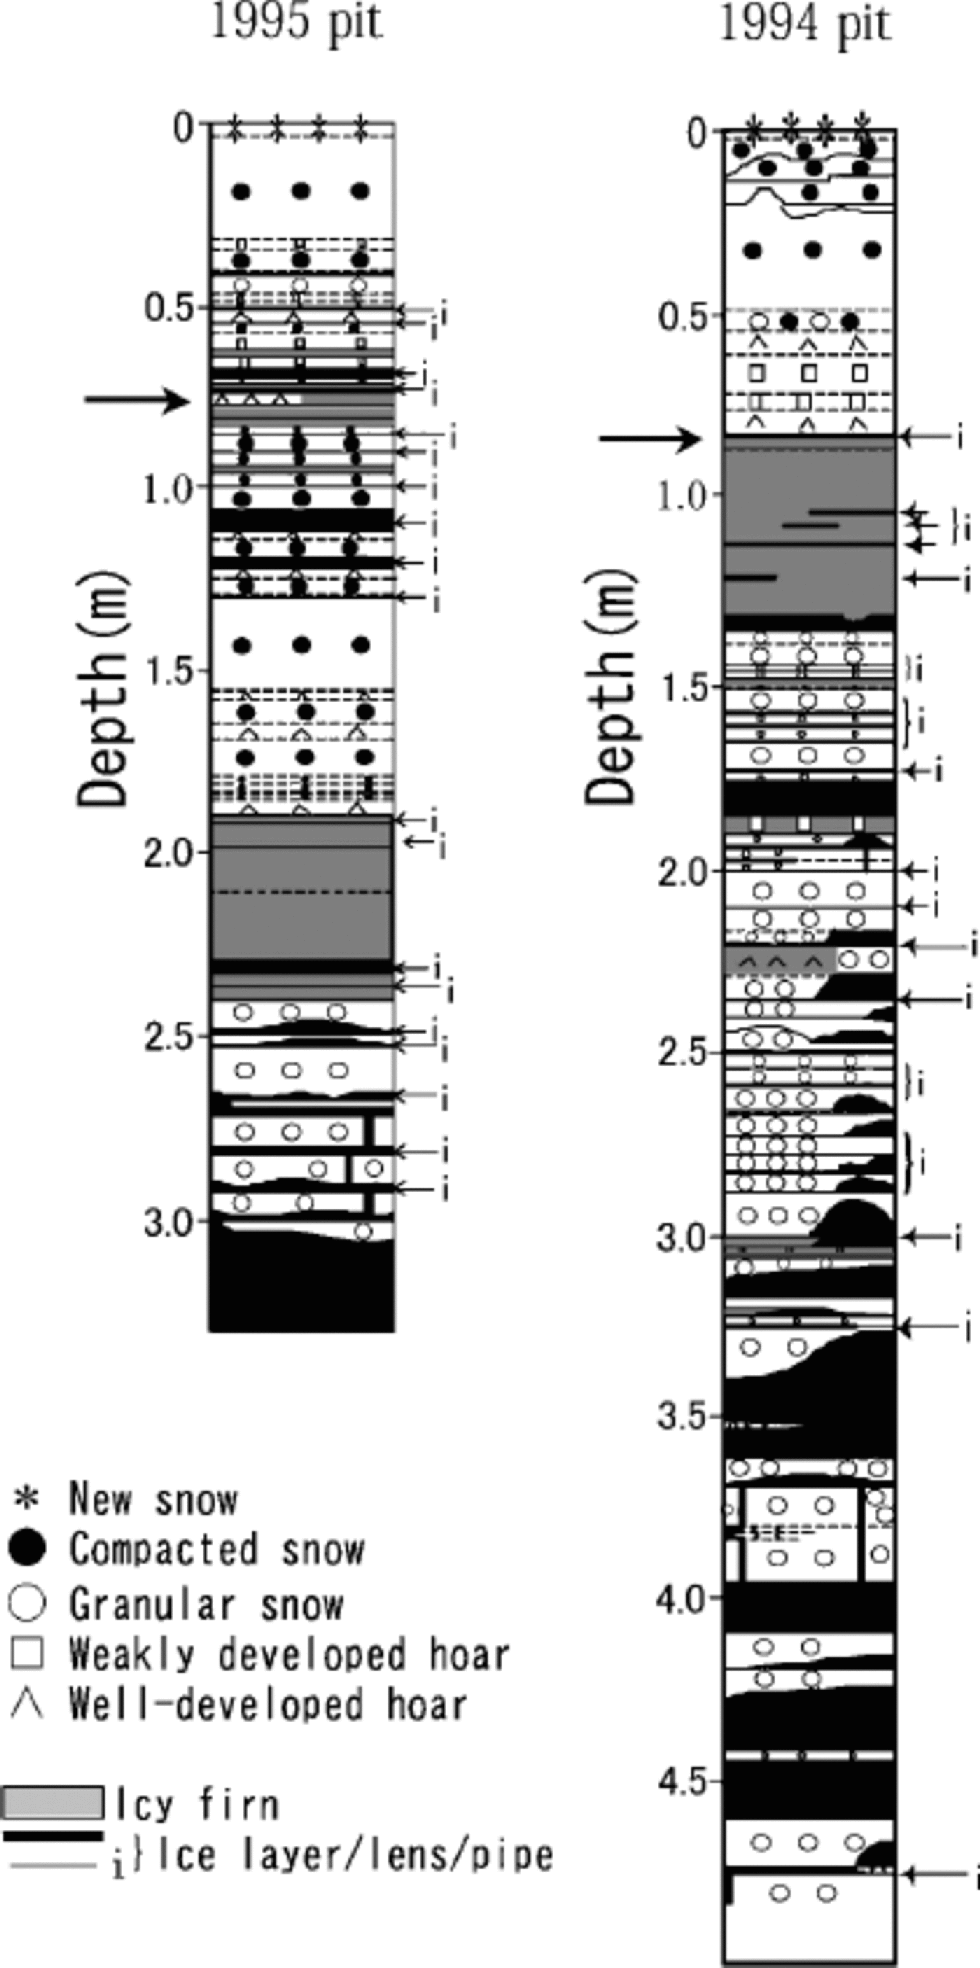
Fig. 2 Stratigraphy of the 1995 and 1994 pits. Thick arrows show the end of the previous summers.
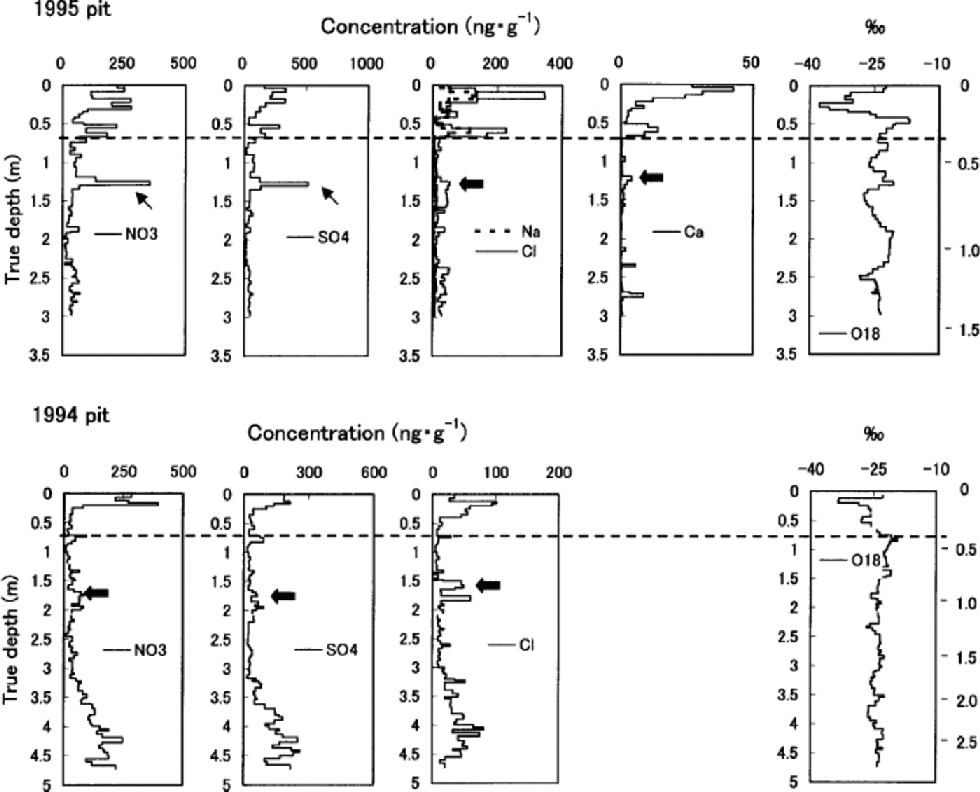
Fig. 3 Ion concentrations and δ18O in the 1995 and 1994 pits. Water equivalent depth in meters is marked on the right vertical axis. Dashed lines indicate the end of the previous summer. Thick and thin arrows show the previous spring peaks and ions concentrated by the melt–refreeze effect, respectively.
High correlations with Na+ of K+ (r =0.89), Mg2+ (r = 0.95) and Cl– (r =0.96) in the 1995 pit, though K+ and Mg2+ are not presented in Figure 3, suggest these ions are mainly of sea-salt origin. Their concentrations (including those of NO3 – and SO4 2–) all peak near the surface in both the 1995 and 1994 pits, indicating deposition in late winter/early spring. the concentrations of Ca2+ in the 1995 pit follow the same pattern. In both of the pits, concentrations of all the ions measured generally decrease from near the surface to the depth corresponding to the end of the previous summer.
Below the first summer-melt layers, the annual late-winter/early-spring peak of ions and the annual δ18O summer peak become ambiguous due to meltwater percolation (Fig. 3). the amplitude of δ18O seasonal variation also decreases below the first melt layers, again due to meltwater percolation. The1995 pit shows generally reduced ion concentrations below the previous summer layer, which is evidence of ion leaching through melt–refreeze cycles (e.g. Reference Davies, Vincent and BrimblecombeDavies and others, 1982; Reference Goto-Azuma, Nakawo and AzumaGoto-Azuma and others, 1994). An exception is the sharp peak observed in NO3 – and SO4 2– concentration at about 1.25m depth. This peak was presumably formed by concentration of NO3 – and SO4 2– through melting and refreezing, since it is associated with ice layers (Reference Goto-Azuma, Enomoto, Takahashi, Kobayashi, Kameda and WatanabeGoto-Azuma and others, 1993a, Reference Goto-Azuma, Enomoto, Takahashi, Kobayashi, Kameda and Watanabeb, Reference Goto-Azuma, Nakawo, Shimizu, Azuma, Nakayamaand and Yokoyama1994). In the deeper 1994 pit, the annual peak of Cl– below the 1993 summer layer is present in subdued form, around 1.6m depth. the more easily eluted species NO3 – and SO4 2– (e.g. Reference Davies, Vincent and BrimblecombeDavies and others, 1982; Reference Goto-Azuma, Nakawo, Shimizu, Azuma, Nakayamaand and YokoyamaGoto-Azuma and others, 1993b,Reference Goto-Azuma, Nakawo, Shimizu, Azuma, Nakayamaand and Yokoyama1994) show an even more damped peak at slightly greater depth. the 1994 pit illustrates the effects of ion elution with a gradual increase of ion concentrations beginning at about 3.0m depth, where they remain elevated down to 4.6 mdepth.
Dating of the ice core
The pits show that the value of seasonal variations of ion concentrations and stable isotopes on Penny Ice Cap as a dating tool may be somewhat limited. for example, Figure 4 shows clear evidence of post-depositional redistribution of δ18O by summer melt at depths of 33–38m, where seasonal variation of δ18O is severely dampened. This depth section is the worst of the entire 85m core. Although melt-percentage analysis has not been carried out for this core, the same depth interval of the adjacent 334m deep core shows the highest average melt percentage for the past 1000 years (Reference Grumet, Wake, Zielinski, Fisher, Koerner and JacobsGrumet and others, 1998), which would have led to the severest post-depositional alteration of δ18O.
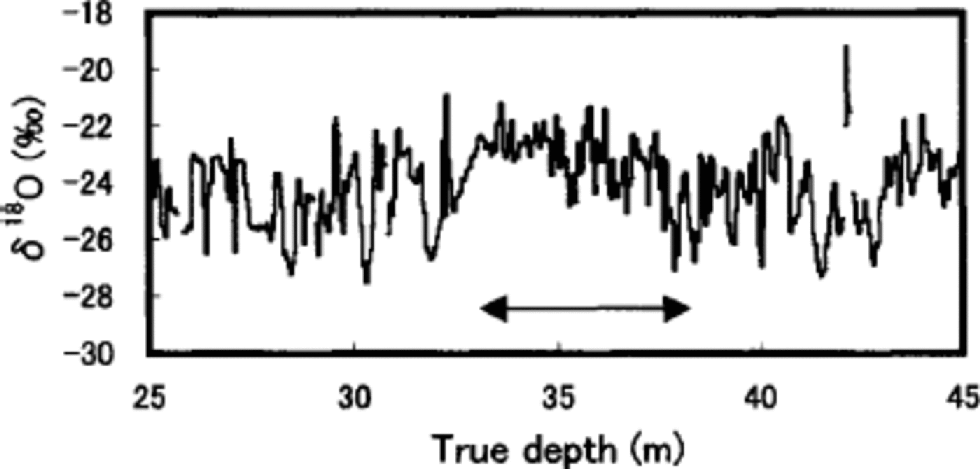
Fig. 4 Detailed profile of δ18O at 25–45 m depths. the arrow indicates the depth section with the highest melt percentage.
Since seasonal variations of δ18O and ions are not always preserved in Penny Ice Cap, although they remain at depths with lower percentage melt, we did not use the annual-layer counting method to date the 85 m core. Instead, we dated the core using the following reference horizons. First is a beta-activity peak formed in the 1963 annual layer from a 1962 Soviet Union bomb test (detected at 17.5 m depth in a dedicated 20m core drilled near the 85 and 334m cores (Reference Grumet, Wake, Zielinski, Fisher, Koerner and JacobsGrumet and others, 1998)). Second is a volcanic SO4 2– peak from the eruption of Laki, Iceland, in 1783. We assigned the SO4 2– peak at 83m depth to the Laki eruption, since this eruption gives the most significant volcanic SO4 2– signature over the last 250 years in ice cores from the Canadian Arctic and Greenland (e.g. Reference Zheng, Kudo, Fisher, Blake and GerasimoffZheng and others, 1998; Reference RobertsonRobertson and others, 2001). the mean accumulation rate as determined between the 1963 bomb layer and the 1995 ice-cap surface is 0.34mw.e. a–1, and that determined between the depths of the 1783 Laki layer and the 1963 bomb layer is 0.33m w.e. a–1. Agreement of the two values suggests little if any thinning of annual layers has occurred at this depth. the core was dated using a linear fit to the depth–age relationships provided by the beta-activity and Laki reference horizons. the core covers the past 220 years.
While the 1783Laki volcanic peak gives the second highest annual mean SO4 2– concentration over the past 220 years, the Tambora (Indonesia) and Katmai (Alaska, U.S.A.) volcanic eruptions in 1815 and 1912 (e.g. Reference Clausen and U. HammerClausen and Hammer, 1988; Reference Hammer, Oeschger and LangwayHammer, 1989; Reference Zheng, Kudo, Fisher, Blake and GerasimoffZheng and others, 1998), respectively, are not very pronounced (Fig. 5). the heavier summer melting on Penny Ice Cap has moved and concentrated the ions in parts of the core, so that smaller volcanic SO4 2– peaks cannot be identified to further tune the time-scale. Nevertheless, there is a SO4 2– peak in 1816, which is most likely associated with the Tambora eruption in 1815. Since SO4 2– deposit by the Tambora eruption peaks in 1816 in Arctic ice cores (e.g. Reference Clausen and U. HammerClausen and Hammer, 1988), the dating error around 1816 appears to be <1year. on the other hand, there are two peaks around 1912, in which year a SO4 2– peak from the Katmai eruption in 1912 is expected. One is in 1910 and the other in 1914. We cannot determine which of the two is the Katmai peak. In either case, the dating error around 1912 is estimated to be ±2 years. Thus we estimate that the dating error is of the order of ±2 years between the 1963-bomb and 1783-volcanic reference horizons. Similarly, Reference Zheng, Kudo, Fisher, Blake and GerasimoffZheng and others (1998) from a study of cores drilled within 1m of each other from Agassiz Ice Cap, Ellesmere Island, Canada, showed that the inter-core dating difference between the same two reference horizons was also ±2 years.
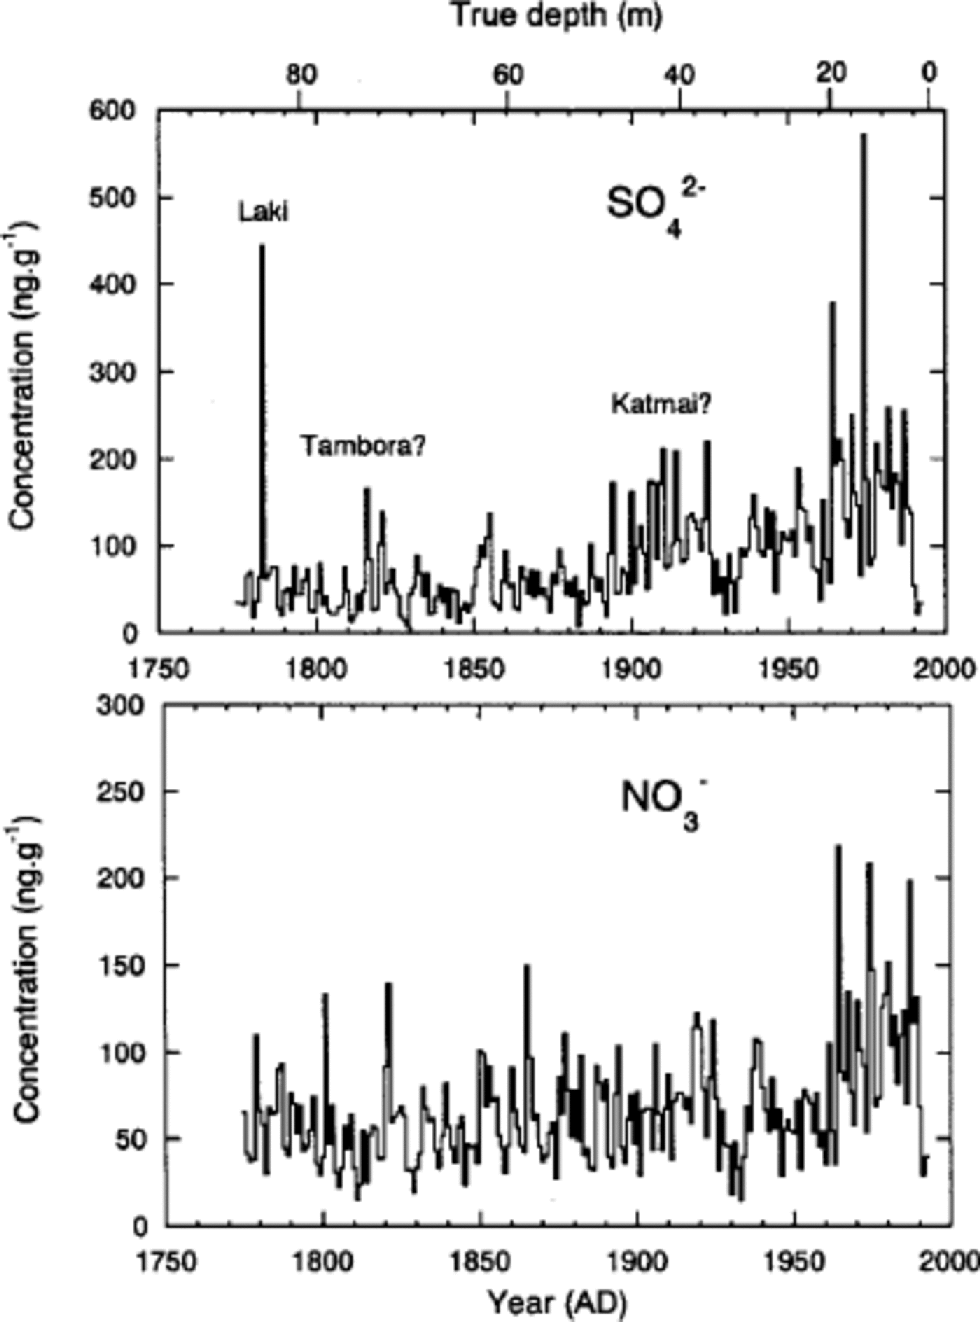
Fig. 5 Annual mean concentrations of SO4 2– and NO3 – obtained from the 85 m deep core.
Noise and signal in the ice-core record
Figure 6 presents the correlation coefficient time series R(t) for various species, computed from the two Penny 1995 cores that are 2.5 mapart.The time-scale for the upper 85 mof the 334 mdeep core was developed by the same method used for the 85m deep core (Reference FisherFisher and others, 1998; Reference Grumet, Wake, Zielinski, Fisher, Koerner and JacobsGrumet and others, 1998). Both of the cores were sampled at a resolution better than 5 samples per calculated year. the inter-series correlations are presented in Figure 6 for annual average series and for the seasonal series (4 values a–1). At either resolution, the segment-by-segment correlations are done by scanning one series along the other until a match is defined by a maximum in R that occurs within a narrowly defined inter-series time offset. Since the two cores are so close, this time offset is small ( <1year). the high-resolution and annual-average series correlations for Cl–, SO4 2– and Ca2+ are given in Figure 6a–c by the thin and thick lines, respectively. All of the correlations except those indicated are significant at the 95% level. the average values for the correlations are given inTable 1.
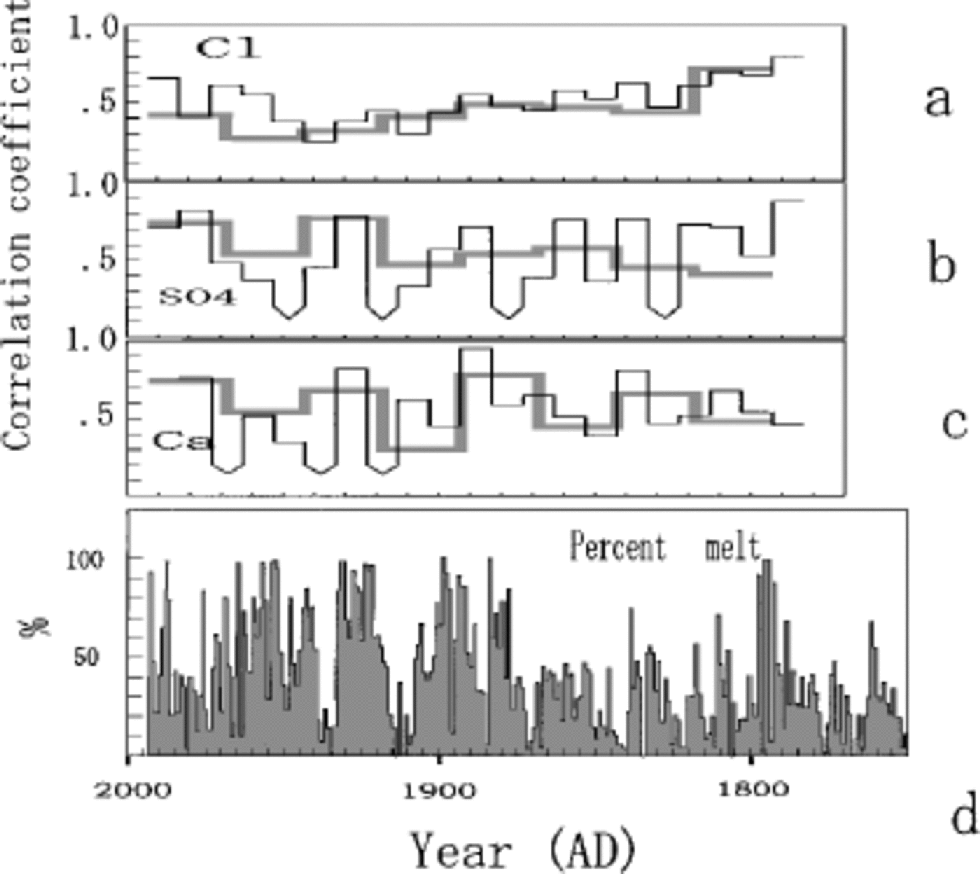
Fig. 6 Correlation coefficient time series R(t) for Cl– (a), SO4 2– (b) and Ca2+ (c), computed from the two Penny cores that are 2.5 m apart, together with annual percentage melt from the 334 m core (d). Thick and thin lines represent correlation coefficients for annual average series and seasonal series, respectively. the correlations not significant at 95% level are indicated with the downward-pointing arrow curves.
Table 1. Average correlation coefficients for various species calculated from the two Penny 1995 cores drilled 2.5 m apart

The common signal variance between two series of the same species is proportional to R, and the single-series noise variance to (1 –R).The signal-to-noise variance ratio R/(1 – R) is given in Table 1. At both listed resolutions, about 40– 50% of the single series are random noise related to snow-drifting and melt effects. These chemical-species series thus have a signal-to-noise ratio close to 1.The high noise ratio is partly due to the severe summer melt, which is suggested by greater fluctuations of annual mean SO4 2– and NO3 – compared to those from Dye 3, southern Greenland, and Summit, central Greenland, where melt effects on ion chemistry are very small (Reference Goto-Azuma and KoernerGoto-Azuma and Koerner, 2001). on the other hand, the δ18O annual series has a high signal-to-noise ratio (3.0) as has been predicted for such a low-latitude site by the noise model of Reference Fisher, Reeh and ClausenFisher and others (1985). Even the severely altered δ18O signal at 33–38m depths (Fig. 4) is observed in surprisingly similar manner for the same depths in the 334m core (Reference Grumet, Wake, Zielinski, Fisher, Koerner and JacobsGrumet and others,1998).
Percentage melt is defined as the ratio of melt percentage to accumulation, both in water equivalent. δ18O and percentage melt are both proxies for temperature, but they do not necessarily contain exactly the same information. δ18O is a proxy for temperature during periods of snowfall (e.g. Reference Dansgaard, Oeschger, Oeschger and LangwayDansgaard and Oeschger,1989). If accumulation were evenly distributed throughout the year, δ18O would represent an annual temperature proxy. Figure 7 shows this is not the case. Summer snow accumulation accounts for about 80% of the total accumulation during May 1994–May 1995. the snow-accumulation record during the following year (May 1995– May 1996) displays a similar tendency (Reference Koerner, Fisher and Goto-AzumaKoerner and others, 1999). Thus the δ18O record from Penny Ice Cap has a warm-season bias as a proxy. δ18O is, however, still affected by the winter temperature, 20% of snow being accumulated in the winter. on the other hand, melt is solely a summer-temperature proxy (Reference Koerner and FisherKoerner and Fisher, 1990; Reference KoernerKoerner, 1997). the correlation coefficient r for annual mean δ18O and melt percentage is 0.19. It increases to 0.58 when a 15 year running-mean series is used. It also increases to 0.25, provided annual δ18O stacked series (δ18O series for 85 and 334 m cores added and averaged) is compared with the melt-percentage series.
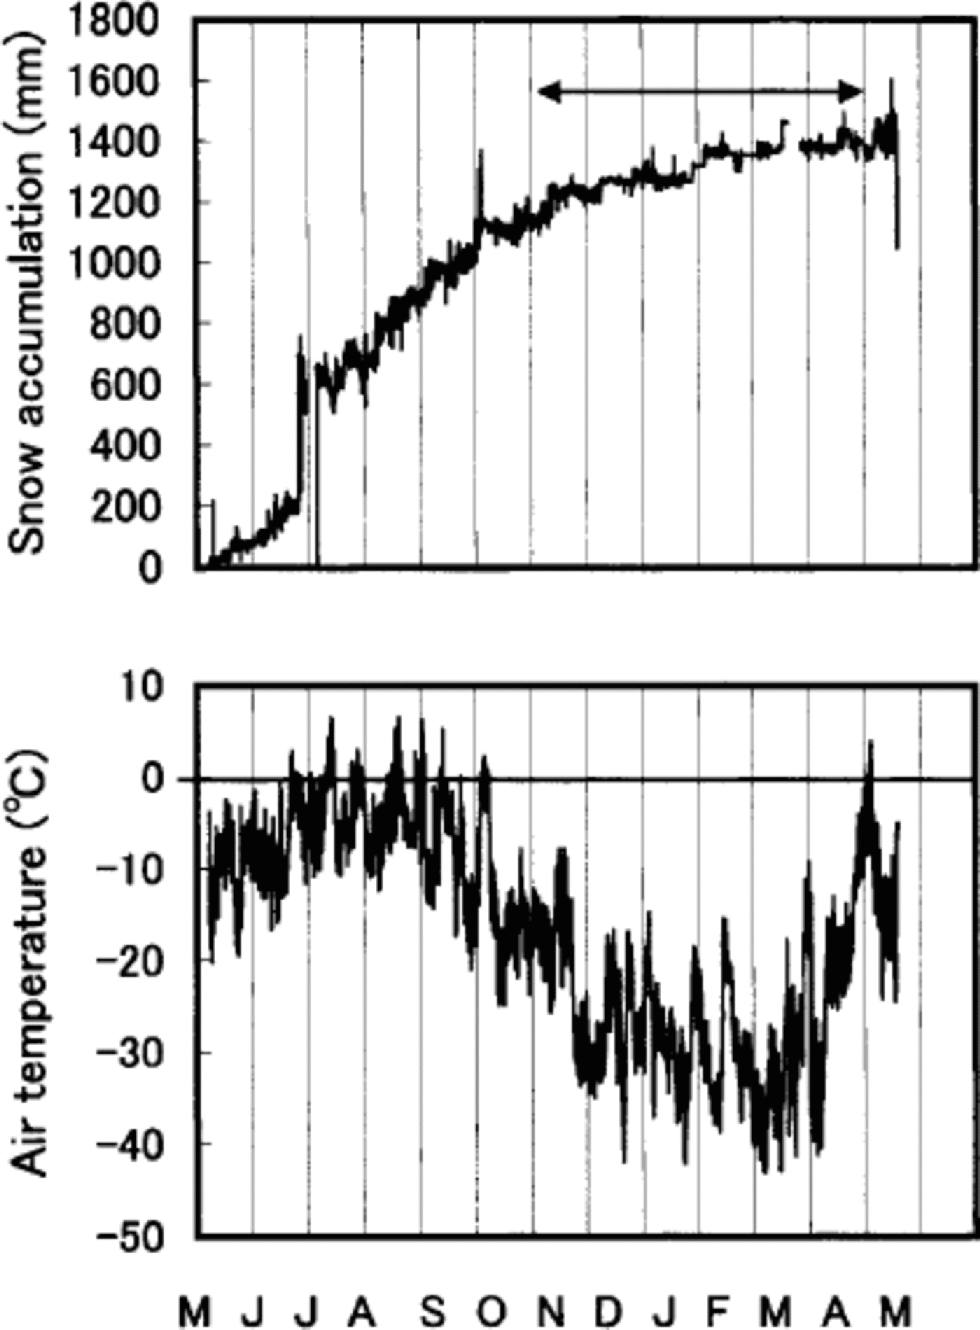
Fig. 7 Hourly snow-accumulation and air-temperature records for 6 May 1994 to 12May 1995 from the AWS. the arrow indicates the winter months. the sudden increase of accumulation in late July is due to rime falling off the snow-depth sensor onto the snow surface underneath.
Comparison of the various chemical species R(t) series to the melt-percentage series (Fig. 6d) shows there is no strong relationship. There is a slight tendency to lower correlations during periods of high melt.
Trends of  and
and 
Annual mean concentrations of SO4 2– and NO3 – depicted in Figure 5 contain about 50% noise, as was discussed in the previous subsection. Despite the large noise fraction, we can still see general trends in the SO4 2– and NO3 – time series.
A sharp increase in SO4 2– concentrations occurred on Penny Ice Cap about 1890 or 1900. This increase is caused by increased industrial emissions (Reference Goto-Azuma and KoernerGoto-Azuma and Koerner, 2001). Concentrations of SO4 2– doubled or tripled by 1910. They remained relatively constant during the 1910s, decreased slightly in the 1920s and 1930s, and then rose again in the 1960s. By the 1970s, they had increased to about four times the pre-industrial level. This suggests that anthropogenic SO4 2– in the 1970s is as much as 75% of total SO4 2–. In the late 1970s or early 1980s, SO4 2– began to decrease, presumably due to pollution controls. the trends of Penny-site SO4 2– compare closely with those from the Dye 3 site, where there are negligible melt effects (Reference Goto-Azuma and KoernerGoto-Azuma and Koerner, 2001). This confirms that the ice-core chemistry record from Penny Ice Cap, despite the heavy summer melting and high noise ratio, can be used as a reasonable proxy for the climatic and environmental changes over the last two centuries on better than a decadal basis.
Using the various SO4 2– time series from different Arctic sites, Reference Goto-Azuma and KoernerGoto-Azuma and Koerner (2001) divided the sites into three basic regions on the basis of the timings of concentration changes. These are: a southern region (Dye 3, southern Greenland), a central/northern Greenland region (Summit and sites further north) and a northern region (Agassiz Ice Cap, Ellesmere Island and Svalbard). Combining the graphical comparison between SO4 2– time series and emission rates of its precursor SO2, and statistical analysis allowed Reference Goto-Azuma and KoernerGoto-Azuma and Koerner (2001) to identify the major pollutant-source regions for the anthropogenic SO4 2– in the three main receptor regions. These are (1) North America for the southern region, (2) both North America and Eurasia for the central/ northern Greenland region, and (3) Eurasia for the northern region. Penny Ice Cap SO4 2– was found to show the highest correlation with the North American emission record (Reference Goto-Azuma and KoernerGoto-Azuma and Koerner, 2001). A flux analysis also suggests that the dominant influx to Penny Ice Cap must be from North America (Reference Goto-Azuma and KoernerGoto-Azuma and Koerner, 2001).
NO3 – concentrations, which are probably also due to increased industrial emissions, began to increase about 1960 and doubled by the 1970s. This suggests that anthropogenic NO3 – in the 1970s accounts for about 50% of total NO3 –. NOx emission trends in both North America and Eurasia (including Russia/ USSR) are so similar (Reference Erisman and DraaijersErisman and Draaijers, 1995) that it is not possible to use the trends to separate out the source regions for the various Arctic sites (Reference Goto-Azuma and KoernerGoto-Azuma and Koerner, 2001). However, unlike NO3 – trends at other Arctic sites which display sharp increases in the 1940s or 1950s, Penny Ice Cap NO3 – instead shows a very delayed increase beginning in the post-1950s. At present we have no clear explanation for this late increase, while high noise ratio in the Penny Ice Cap chemistry record may be partly responsible. Because of more complex air-to-snow deposition processes, together with post-depositional losses of NO3 – from the snowpack (e.g. Reference Legrand, Léopold, Dominé, Wolff and BalesLegrand and others, 1996) and similarities between the North American and Eurasian emission trends, we cannot attribute a source zone for Penny NO3 –.
Trends of sea-salt ions and temperature
Trends in annual mean concentrations of Cl–, Na+, K+ and Mg2+, which are mostly of sea-salt origin, are generally similar. Therefore, we present only the Cl– time series in Figure 8 to discuss the sea-salt trends. Cl– initially shows a slight decrease of concentration between 1775 and 1800. Increases then began about 1860 or 1870, peaking in the 1920s and 1930s. Since then Cl– has remained elevated, with some fluctuations. to interpret the trends of Cl–, we compare in Figure 8 the time-series of Cl– with those of δ18O and percentage melt.
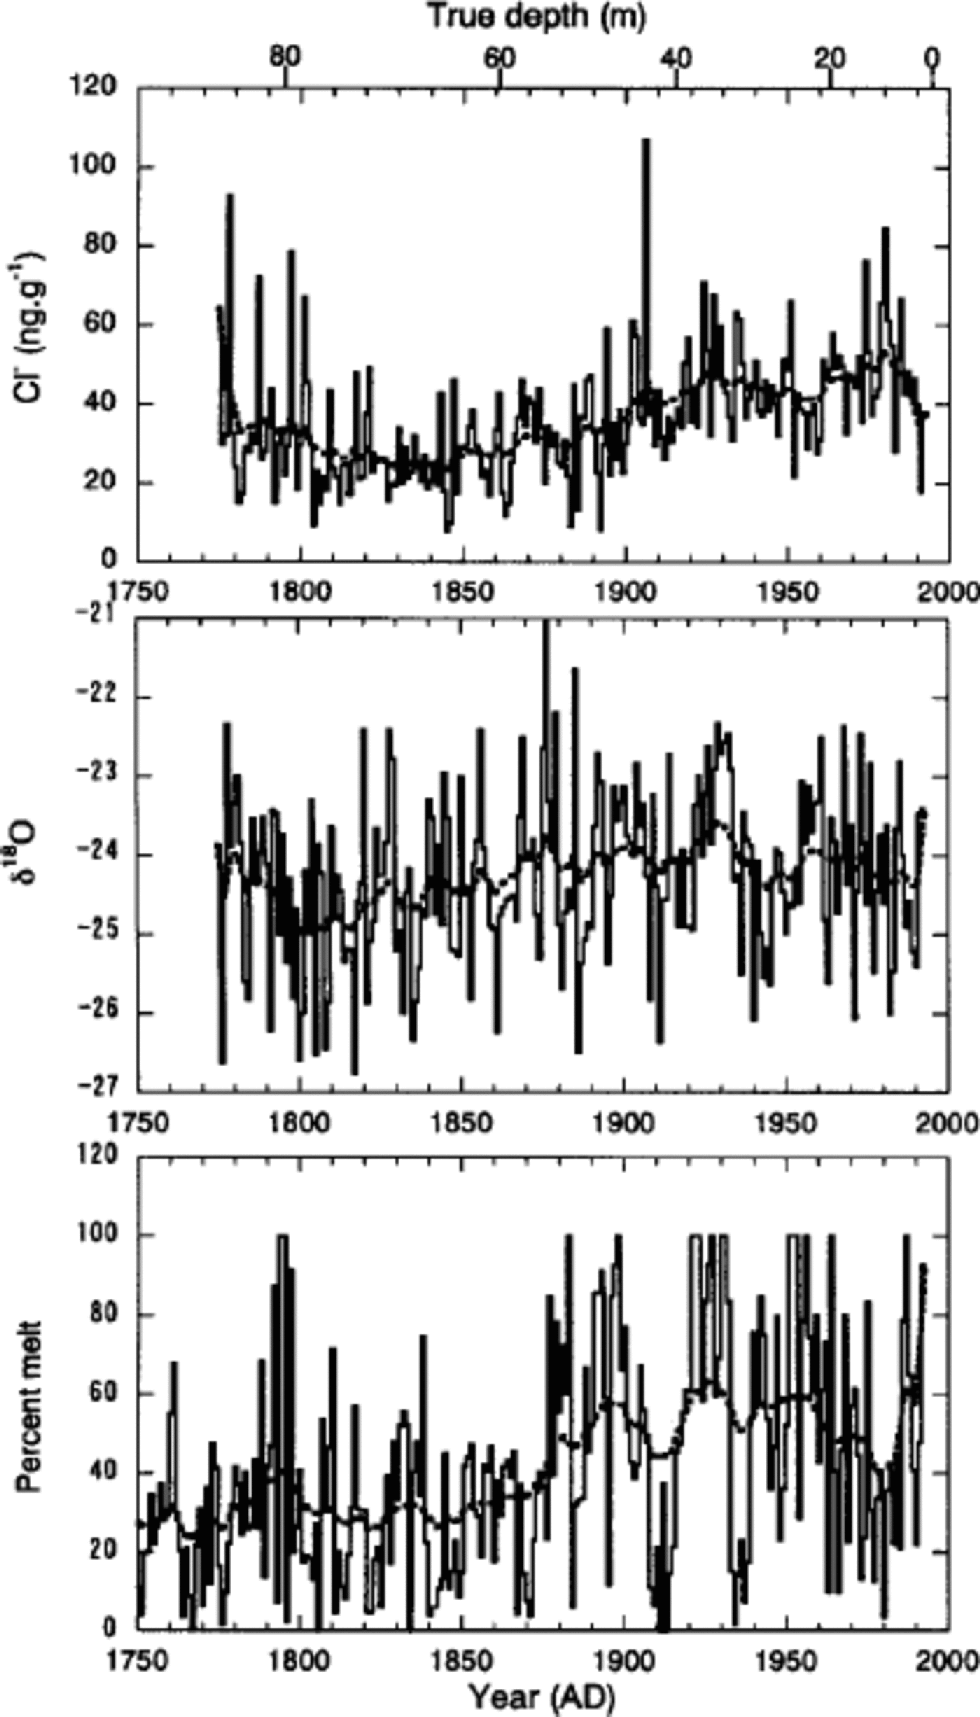
Fig. 8 Annual mean values of Cl–concentrations, δ18O and percentage melt (solid curves) together with the spline curves (broken curves). the former two were obtained from the 85 m deep core, and the latter from the 334 m deep core.
On a multi-decadal to centennial scale, trends of Cl– show positive relationships with those of both δ18O and melt percentage. However, Cl– shows a better correlation with melt percentage. Correlation coefficients for 15 year running-mean series are 0.51 and 0.55 for δ18O and melt percentage, respectively. This suggests that on a decadal scale Cl– is associated with summer temperature, rather than winter temperature. This correlation lends support to the argument by Reference GrumetGrumet and others (2001) that sea-salt concentrations on Penny Ice Cap are not responding to an increase in the strength of polar atmospheric circulation as in the case at Summit (Reference MayewskiMayewski and others, 1994; Reference O’Brien, Mayewski, Meeker, Meese, Twickler and WhitlowO’Brien and others, 1995). Rather, they reflect a more regional signal that is associated with sea-ice extent in the Baffin Bay/Labrador Sea region. When summer temperature increased on Penny Ice Cap at the end of the Little Ice Age (about 1860 or 1870), the regional sea ice would have retreated, leading to an increase of sea-salt concentrations.
Conclusions
We have analyzed pit-wall samples and an 85 mice core from the central ridge of Penny Ice Cap. the results indicate relatively heavy summer melt, which often moves stable oxygen isotopes and ions through a few annual layers. This means that annual layers are not always identifiable in the pits and the core. Furthermore, comparisons of the 85m core with the 334m core drilled 2.5 m apart reveal that at an annual resolution about 40–50% of the single chemistry time series are random noise related to snowdrifting and melt effects. However, ice-core chemistry and δ18O records, together with melt records, provide us with a reasonable proxy record of climatic and environmental changes during the past two centuries on a better than decadal basis. In terms of atmospheric chemistry, SO4 2–and NO3 – concentrations started to increase about 1900 and 1960, respectively, due to an influx of industrial aerosols from North America. the SO4 2– trends agree very well with those at Dye 3, where melt effects on ion chemistry are very small. This confirms that an ice-core record from a site like Penny Ice Cap, where the average percentage melt is about 40%, can still give meaningful information. Sea-salt concentrations began to increase in the mid-19th century and have remained high through the 20th century. This increase is related to an associated temperature increase as represented by the melt record and, to a lesser extent, the δ18O record. As we interpret sea salt as a sea-ice proxy it suggests that sea-ice extent decreased from a Little Ice Age maximum to less extensive coverage in the nearby Baffin Bay/Labrador Sea region in the 20th century. Further studies on the relationship between sea-salt content and temperatures need to be performed to fully explain the difference in the trends of sea salt, δ18O and melt series on a higher temporal resolution.
Acknowledgements
We would like to thank the staff of the Nunavut Research Institute in Iqaluit for generous logistical support during the various field seasons. We also acknowledge the work of E. Blake and M. Gerasimof. as ice-core drillers, J. Sekerka, M. Paranandi and H. Kand. for the laboratory analyses, and J. Bourgeoi. and L. Lundgaard for help in the field. We are also grateful to the people of the towns of Iqaluit, Pangnirtung, and Broughton Island for their support and help in carrying out the fieldwork. the Polar Continental Shelf Project of the Ministry of Natural Resources Canada provided aircraft and logistics support. the Geological Survey of Canada of the Department of Natural Resources and the Science and Technology Agency, Japan, funded the work. Finally, we would like to acknowledge two thorough reviews that helped to greatly improve the paper.


