1. Introduction
The prospect of significant changes in global sea level due to greenhouse warming has raised much scientific and public concern. A key factor controlling global sea level is the mass balance of Greenland and Antarctica, which include 97% of the world’s glacierized surface. Changes in the mass balance of these ice sheets have the potential to significantly affect global sea level.
A realistic simulation of the mass balance of polar ice sheets requires model resolutions which exceed those typically used in global-climate simulations up to now (T42–T21 spectral resolution, corresponding to a 3°-6° grid) (e.g. Reference Thompson and PollardThompson and Pollard, 1997). With recent developments in computing it has become possible to perform multi-annual simulations at spectral resolutions up to T106 (corresponding to a horizontal grid resolution of 1.1° or approximately 100 km). It has been shown that through an increase in horizontal resolution of this magnitude the simulated mass balance on the polar ice sheets can be significantly improved, for the following reasons:
-
(i) The precipitation distribution over the polar ice sheets is strongly dependent on orographic forcing. The representation of orography improves considerably with higher resolution (cf Fig. 1). Reference Ohmura, Wild and BengtssonOhmura and others (1996b) found a substantial improvement in precipitation over the polar ice sheets in the T106 simulations with the ECHAM3 GCM of the Max Planck Institute for Meteorology, Hamburg, compared to lower-resolution integrations with the same model. Reference Genthon, Jouzel, Deque, Desbois and DesalmandGenthon and others (1994) documented the improved simulation of accumulation over Greenland in a T79 version of the ARPEGE (Action Recherche Petite Echelle Grande Echelle) model compared to lower model resolutions.
-
(ii) The ablation areas on the steep margins of the ice sheets are much better resolved in higher-resolution models, allowing for a more appropriate calculation of ablation. The accurate calculation of ablation in the high-resolution ECHAM3 T106 model was documented in Reference Ohmura, Wild and BengtssonOhmura and others (1996a, b).
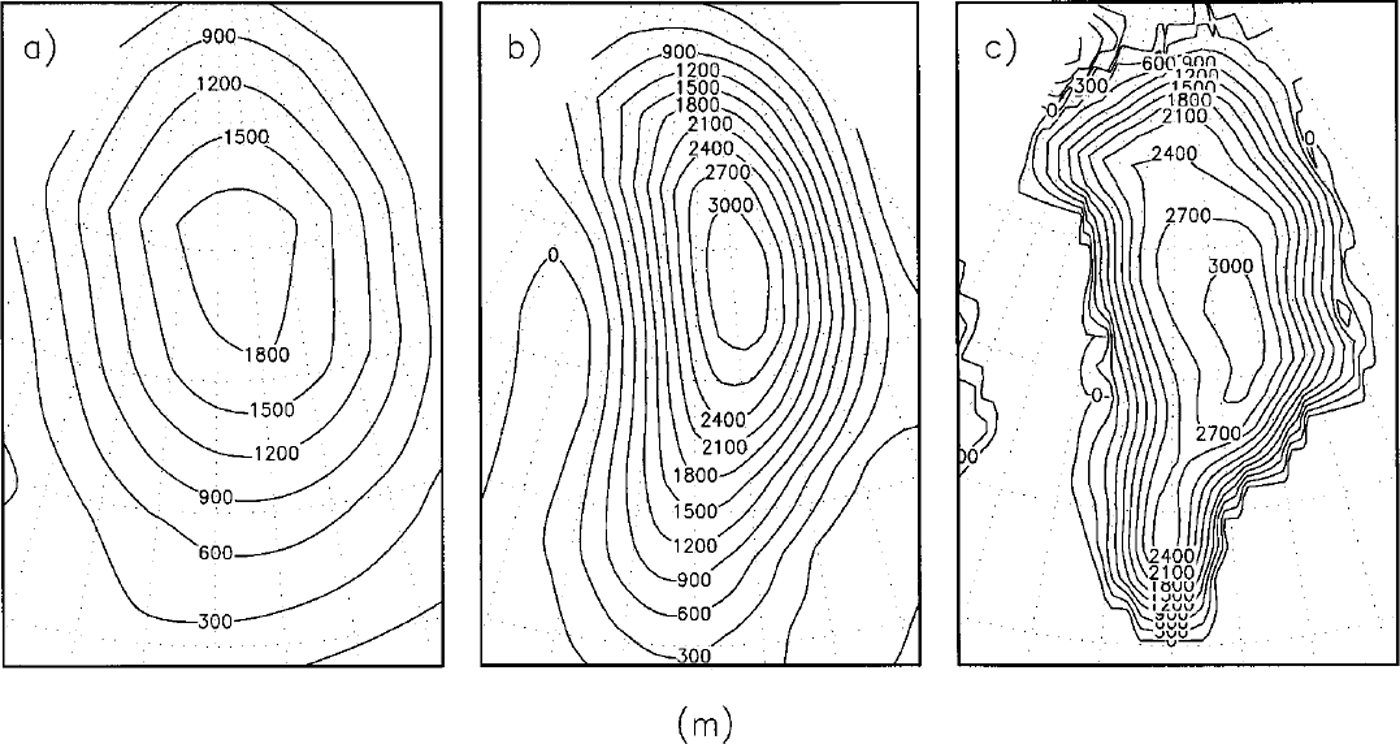
Fig. 1. Representation of the Greenland orography (m) in models with various horizontal resolutions: (a) T21 (5.6=); (b) T42 (2.8°); and (c) 7106(1.1°).
The first climate-change experiment at T106 resolution, performed with the ECHAM3 GCM, was evaluated in Reference Ohmura, Wild and BengtssonOhmura and others (1996a,Reference Ohmura, Wild and Bengtssonb) with respect to the mass-balance changes of the polar ice sheets. The present study focuses on the mass-balance changes of the polar ice sheets as calculated in more sophisticated T106 time-slice experiments with the most recent model version, ECHAM4, and on the comparison of these results with the ones obtained previously in the ECHAM3 T106 experiments (Reference Ohmura, Wild and BengtssonOhmura and others, 1996a, b).
2. Models and Experimental Setup
As noted above, the model used in this study is the ECHAM4 GCM (Reference RoecknerRoeckner and others, 1996), which is the latest version of the ECHAM model series developed at the Max Planck Institute for Meteorology, Hamburg (MPI). These GCMs have evolved from the spectral numerical weather-fore-casting model of the European Centre for Medium-range Weather Forecasts (ECMWF) and have been extensively modified in Hamburg for climate applications. Compared to the precursor model version ECHAM3 (Reference RoecknerRoeckner and others, 1992), ECHAM4 incorporates revisions in a number of key climatic processes, as described in Reference RoecknerRoeckner and others (1996). A major change consists in the introduction of a new radiation scheme based on Reference MorcretteMorcrette (1991), with modifications in the water-vapor continuum (Reference Giorgetta and WildGiorgetta and Wild, 1995). For advection of water vapour and cloud water, the spectral method has been replaced by a semi-Lagrangian transport method (Reference Williamson and RaschWilliamson and Rasch, 1989). The closure for penetrative convection in the Reference TiedtkeTiedtke (1989) mass-flux scheme has been revised. In the parameterization scheme of the planetary boundary layer, the first-order turbulence closure is replaced by a turbulent kinetic-energy closure (Reference Brinkop and RoecknerBrinkop and Roeckner, 1995). A new global dataset of land-surface parameters is used in ECHAM4 (Reference Claussen, Lohmann, Roeckner and SchulzweidaClaussen and others, 1994), constructed from major ecosystem complexes. Several studies have documented improvements in various aspects of the simulated climate in ECHAM4 (e.g. Reference RoecknerRoeckner and others, 1996; Reference Wild, Dümenil and SchulzWild and others, 1996,Reference Wild, Ohmura, Gilgen, Roeckner, Giorgetta and Morcrette1998).
In the framework of the European Union Project SIDDACLICH (Simulation, Detection and Diagnosis of Anthropogenic CLImate CHange), climate-change scenarios of unprecedented high resolution have been performed jointly by the Swiss Federal Institute of Technology, Zurich, and the MPI. The aim was thereby to obtain climate-change scenarios at the highest resolution currently used in climate modeling, namely at T106 (1.1 °). Since it is not feasible to run such a high-resolution GCM over several decades with today’s supercomputing resources, as required in transient climate-change experiments, "time-slice" experiments were performed (Reference Cubasch, Waszkewitz, Hegerl and PerlwitzCubasch and others, 1995; Reference Wild, Ohmura and CubaschWild and others, 1997). In this manner the high-resolution atmospheric model can be run over the time window where the CO2 concentration is expected to double, using prescribed boundary conditions of sea-surface temperature (SST) and sea-ice distribution predicted by a lower-resolution, transient, coupled atmosphere-ocean scenario run. T106 (1.1°) experiments with ECHAM4 have been carried out for both present-day and 2 × CO2 conditions using the associated SST and sea-ice distributions from a new transient scenario run with the ECHAM4 at T42 (2.8°) resolution coupled to the OPYC ocean model (Reference Roeckner, Bengtsson, Feichter, Lelieveld and RodheRoeckner and others, 1999). This scenario run takes into account a gradual increase in CO2 and other greenhouse gases according to the Intergovernmental Panel on Climate Change Scenario IS92a (Reference Leggett, Pepper, Swart, Houghton, Callander and VarneyLeggett and others, 1992), with an expected CO2 doubling after 70 years. Prior to that, an analogous experiment was performed with the precursor model version ECHAM3 T106, using the boundary conditions from an older scenario run with model version ECHAM1 at coarser resolution (T21, 5.6°) and the LSG ocean model (Reference CubaschCubasch and others, 1992). The mass-balance changes over the polar ice sheets in this experiment were evaluated in Reference Ohmura, Wild and BengtssonOhmura and others (1996a, b). While the ECHAM3 T106 model was integrated for 5 years for both present and 2 × CO2 conditions, the ECHAM4 T106 experiments were each extended to 10 years, thereby ensuring statistically more significant results. Furthermore, the ECHAM4 model has been improved in major aspects compared to its precursor version ECHAM3 (e.g. Reference RoecknerRoeckner and others, 1996; Reference Wild, Dümenil and SchulzWild and others, 1996,Reference Wild, Ohmura, Gilgen, Roeckner, Giorgetta and Morcrette1998). Since the new ECHAM4 T106 time-slice experiments were integrated over a longer period with an improved model, and with SST boundary conditions from a newer and more sophisticated transient experiment, these are considered to be the most adequate experiments for the objectives of the present study. A re-evaluation of the mass-balance changes over the polar ice sheets under greenhouse warming has therefore been considered indispensable.
3. Accumulation
For the assessment of the model-calculated accumulation (solid precipitation minus evaporation) over Greenland under present-day conditions, a new observational reference is used (Reference Ohmura, Calanca, Wild and AnklinOhmura and others, 1999) (Fig. 2). This reference is based on the re-evaluation of the climatology of Reference Ohmura and ReehOhmura and Reeh (1991), using additional information from about 50 shallow to medium-deep ice cores and wind-corrected precipitation measurements observed at coastal meteorological stations. Furthermore, for each station, the total precipitation is divided into liquid and solid phase in the transitional seasons based on a relationship between the ratio of solid precipitation to total precipitation and mean air temperature, developed recently at the authors’ institute. A comparison of this new climatology with the accumulation as calculated in the high-resolution ECHAM3 and ECHAM4 T106 experiments for present-day conditions qualitatively reveal a very good agreement of both models in the regional accumulation pattern (Fig. 2). Quantitatively, however, ECHAM3 generally tends to overestimate the accumulation. This overestimation is less pronounced in the ECHAM4 model. This is also apparent in the annual mean accumulation over Greenland which is, at 331 mma−1, closer to the new observational estimate of 297 mm a"1 given in Reference Ohmura, Calanca, Wild and AnklinOhmura and others (1999) (cf Table 1). ECHAM3 and other previous experiments used to estimate mass-balance changes, conversely, overestimated accumulation over Greenland under present climate far more seriously, exceeding the newly evaluated value of 297 mm a"1 by 40% and more (cf Table 1). Over Antarctica, the ECHAM4 T106–calculated accumulation shows a very realistic regional pattern when compared to the climatology of Reference Giovinetto, Waters and BentleyGiovinetto and others (1990) (Fig. 3). The annual mean accumulation over Antarctica amounts to 166 mm a"1 (Table 1) in ECHAM4 T106, which is well within the range of observational estimates from 147–184 mm a"1 listed in Reference Ohmura, Wild and BengtssonOhmura and others (1996a). The ECHAM3 T106 accumulation, on the other hand was, at 197 mm a−1, somewhat outside this range (Table 1). The accumulation in the interior of the Antarctic ice sheet, in particular, is overestimated in ECHAM3, a feature no longer present in ECHAM4.
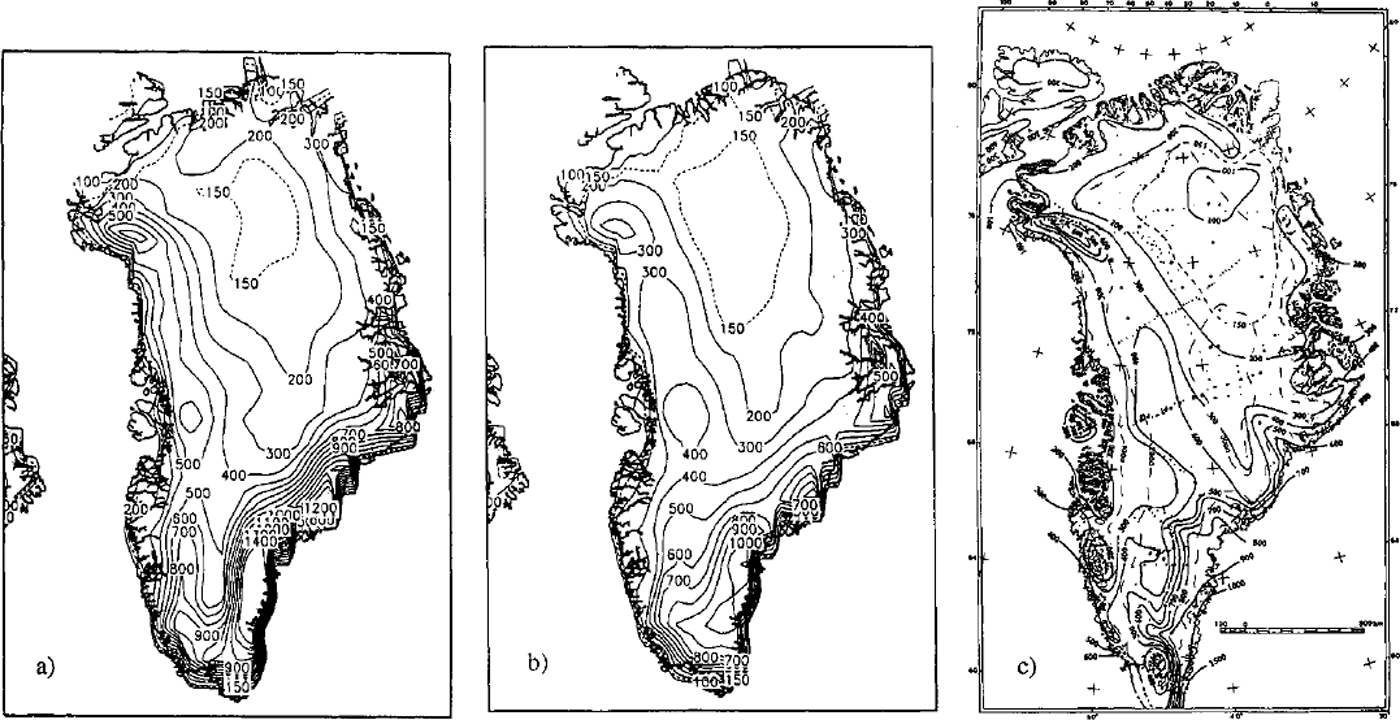
Fig. 2. Annual mean accumulation over Greenland (mm a’1) under present climatic conditions. Model calculations with (a) ECHAM3 T106and(b) ECHAM4 T106 compared to (c) the new climatology of Reference Ohmura, Calanca, Wild and AnklinOhmura and others (1999).

Fig. 3. Annual mean accumulation over Antarctica (mma−1) under present climatic conditions, (a) Model calculations with ECHAM3 T106and(b) ECHAM4 7106 compared to (c) the climatology of Reference Giovinetto, Waters and BentleyGiovinetto and others (1990).
Table 1. Present-day annual accumulation and ablation integrated over the Greenland and Antarctic ice sheets, calculated with ECHAM3 T106 and ECHAM 4 7106 and observed
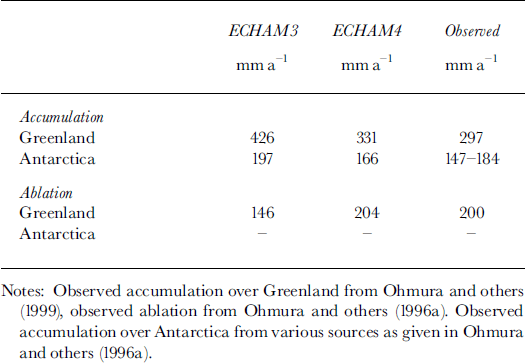
The above findings underline the improved representation of accumulation over both Greenland and Antarctica in the new high-resolution experiments and enhances confidence in the projected changes in future climates.
In the ECHAM4 T106 2 × CO2 experiment, the accumulation over Greenland increases on average by 92 mm a"1 (Fig. 4, Table 2). This marks a substantial revision of the estimates obtained in the previous ECHAM3 T106 scenario, which showed a slight decrease in accumulation. Seasonally, Table 3 shows that the increase in the ECHAM4 accumulation is largest in the winter season ( + 182 mma−1), in line with the highest temperature increase during winter (+4.5°). The large accumulation increase in winter, which was not found in ECHAM3, is caused by a slight northward displacement of the Icelandic low and an associated increase in the pressure gradient along the coast of Greenland up to Baffin Bay, affecting also the west coast of Greenland to Disco island. This change in the atmospheric circulation is favourable for supplying more water vapour especially to the east coast and the southern half of the west coast.

Fig. 4. Change in annual accumulation over Greenland (mm a ) as projected by ECHAM4 T106 with doubled CO2 concentration; calculated as difference between the 2 × CO2 time-slice scenario and the present-climate experiment.
Table 2 Change in mass balance of the polar ice sheets and contribution to sea-level changes as projected in high resolution (7106)2 × CO2 scenarios with the ECHAM3andECHAM4 models
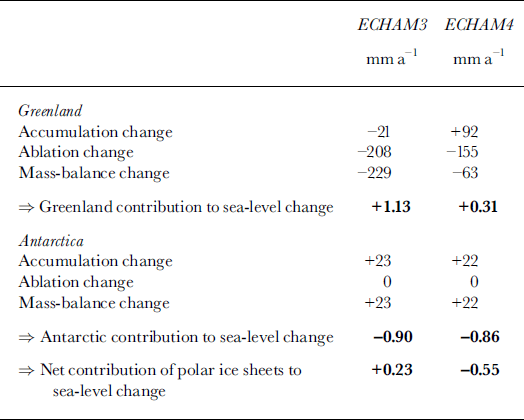
Table 3. Seasonal change in accumulation (ΔAcc) and temperature (A T) over the polar ice sheets as projected by EC-HAM4 T106 under doubled CO2 concentration, calculated as difference between the 2 × CO2 time-slice scenario and the present climate experiment
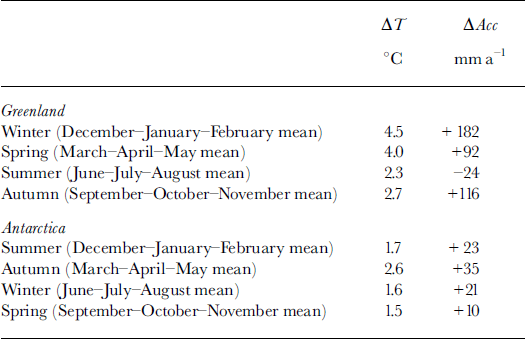
Over Antarctica, annual accumulation increases by 22 mm a"1 (Fig. 5, Table 2) in the EGHAM4 scenario, an amount almost identical to the previous EGHAM3 experiment (23 mm a"1). The accumulation change is thus very similar in both old and new experiments. The seasonal increase in accumulation in the EGHAM4 scenario is in line with the seasonal temperature increase as can be inferred from Table 3. In addition to the temperature increase, the increased low-pressure activities in the sub-Antarctic low-pressure zone are responsible for the increase in accumulation in the scenario experiments throughout the year, especially for the marginal zones of the ice sheets. This is found consistently in both ECHAM4 and ECHAM3 scenarios. Regional differences between the old and new scenario become visible mainly in the interior of East Antarctica with the larger accumulation increase in ECHAM4. This is related to a decrease in surface pressure over East Antarctica, which is stronger in ECHAM4 than in ECHAM3. Over Wilkes Land, on the other hand, ECHAM4 projects a significant decrease in accumulation in summer which is less pronounced in ECHAM3. In general, however, it can be noted that the response of accumulation over Antarctica to the 2 × CO2 forcing is very consistent in both old and new experiments.
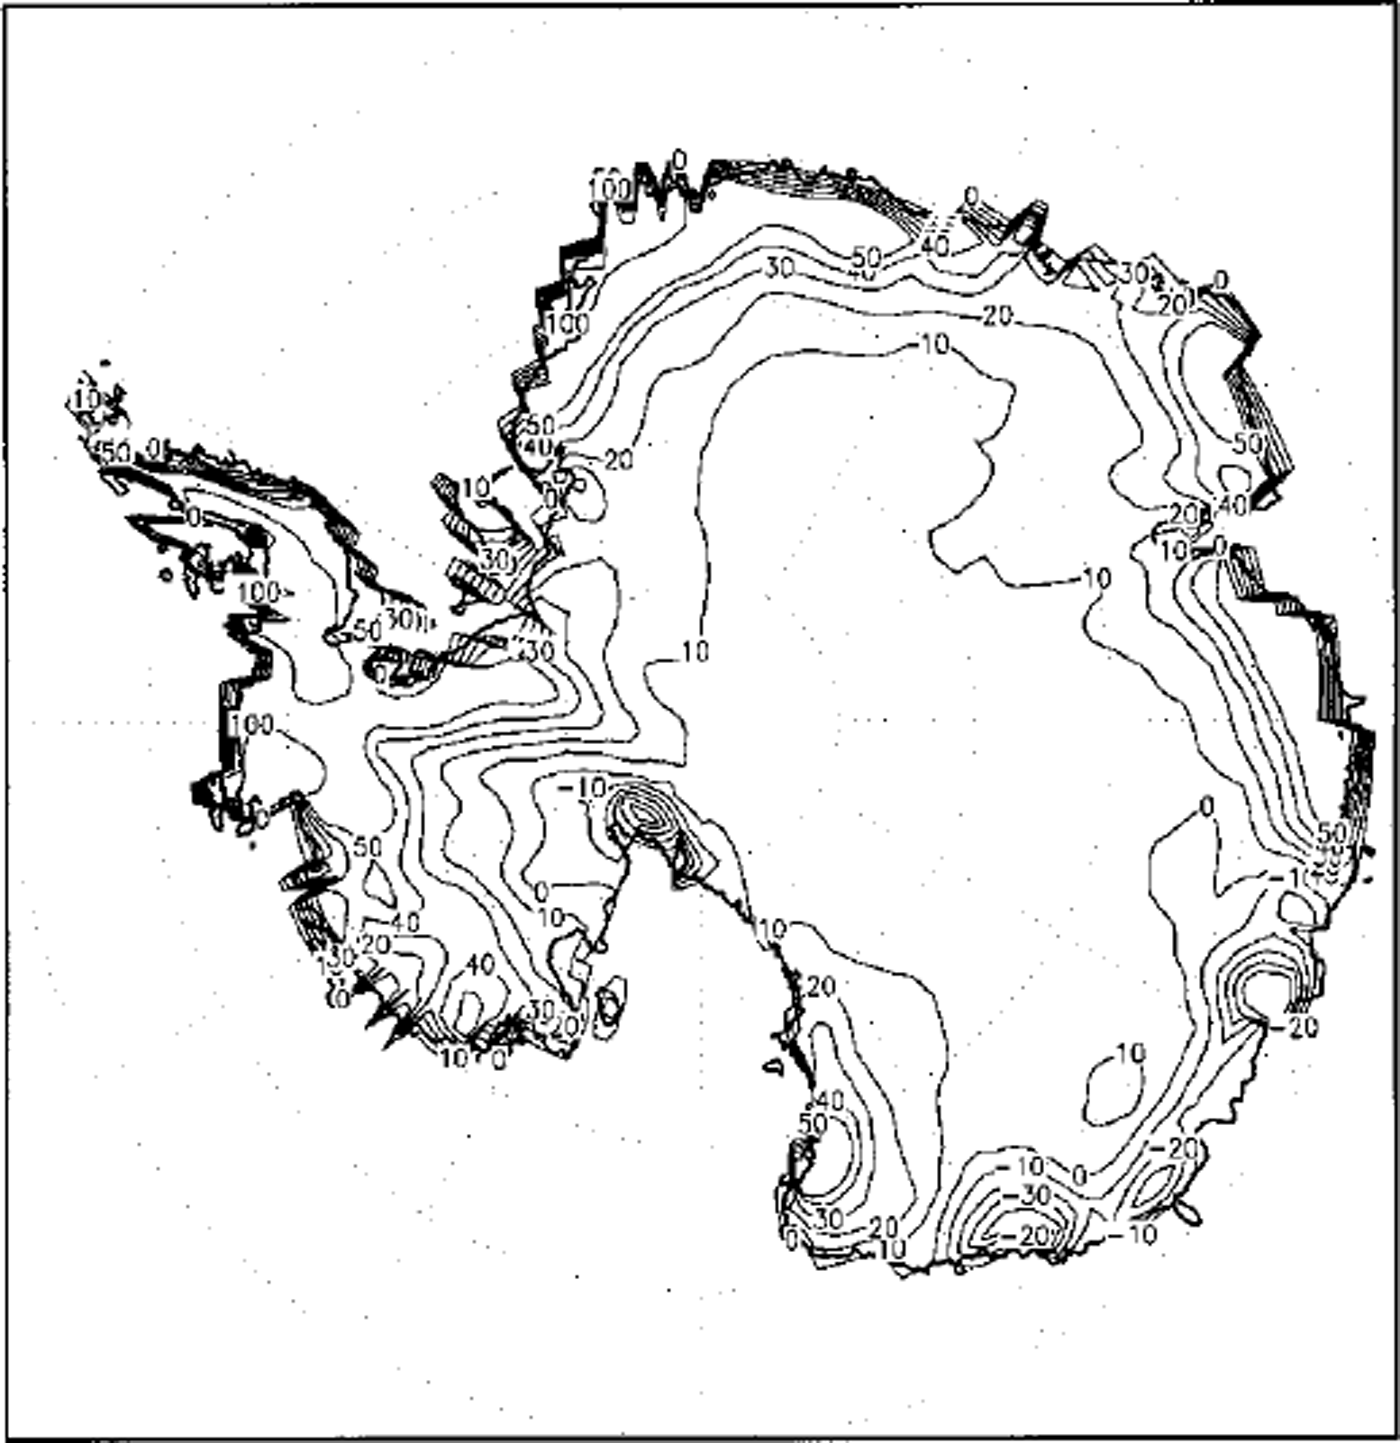
Fig. 5. Change in annual accumulation over Antarctica (mm a–1) as projected by ECHAM4 T106 with doubled CO2 concentration; calculated as difference between the 2 × CO2 time-slice scenario and the present-climate experiment.
4. Ablation
Since ablation is not explicitly calculated in the model, a linear relationship between calculated summer temperature TJ JA (in °C) and ablation A (in mma−1 ) is used, having been derived from extensive observations in Greenland (Reference Ohmura, Wild and BengtssonOhmura and others, 1996a):
Applying Equation (1) in EGHAM4 T106 to present-day conditions yields an ablation of 203 mma−1 on Greenland, in line with the observational estimate, which uses the same relationship, but applied to observed temperature data (Table 1). The increase in ablation, with the warming in the ECHAM4 2 × CO2 experiment shown in Figure 6, is projected at 155 mm a"1. This is somewhat lower, yet of similar magnitude compared to the ablation change in the ECHAM3 scenario (cf Table 2). The inland shift of the –2°C isoline, which encloses the discharge-producing area according to Equation (1), amounts to 45 km in the ECHAM4 scenario on average, compared to 69 km in the ECHAM3 scenario. This is equivalent to an increase in the areal extent of the discharge-producing area by 215 000 km2 in ECHAM4 and 353 000 km2 in ECHAM3, and in line with the somewhat lower ablation increase in ECHAM4 compared to ECHAM3 (Table 2).

Fig. 6. Change in summer (June-July-August mean) temperature over Greenland (°C) as projected by ECHAM4 7706 with doubled CO2 concentration, calculated as difference between the 2xCO2 time-slice scenario and the present-climate experiment.
The temperature over Antarctica is too low for significant melt under present climatic conditions. Even in the 2 × CO2 scenario, the temperature increase in summer (Fig. 7) is not sufficient to produce any significant melt. This can be inferred from Figure 8, where the temperature distribution over Antarctica in the ECHAM4 2 × CO2 scenario is shown for the Southern Hemisphere summer (December-January-February) mean. The –2°C isoline, which marks the lowest summer temperature where ablation can occur (cf. Equation (1)), does not reach the Antarctic ice sheet, which is therefore also too cold for any significant ablation under 2 × CO2 conditions. This is likewise found in both EC-HAMS and ECHAM4 scenarios. It should be noted, however, that little further warming is required to raise temperatures on the margins of the Antarctic ice sheet above the –2°C threshold. Thus, if the increase of atmospheric CO2 concentration could not be stopped at double the present value, further greenhouse warming would initiate significant melt from the Antarctic ice sheet.
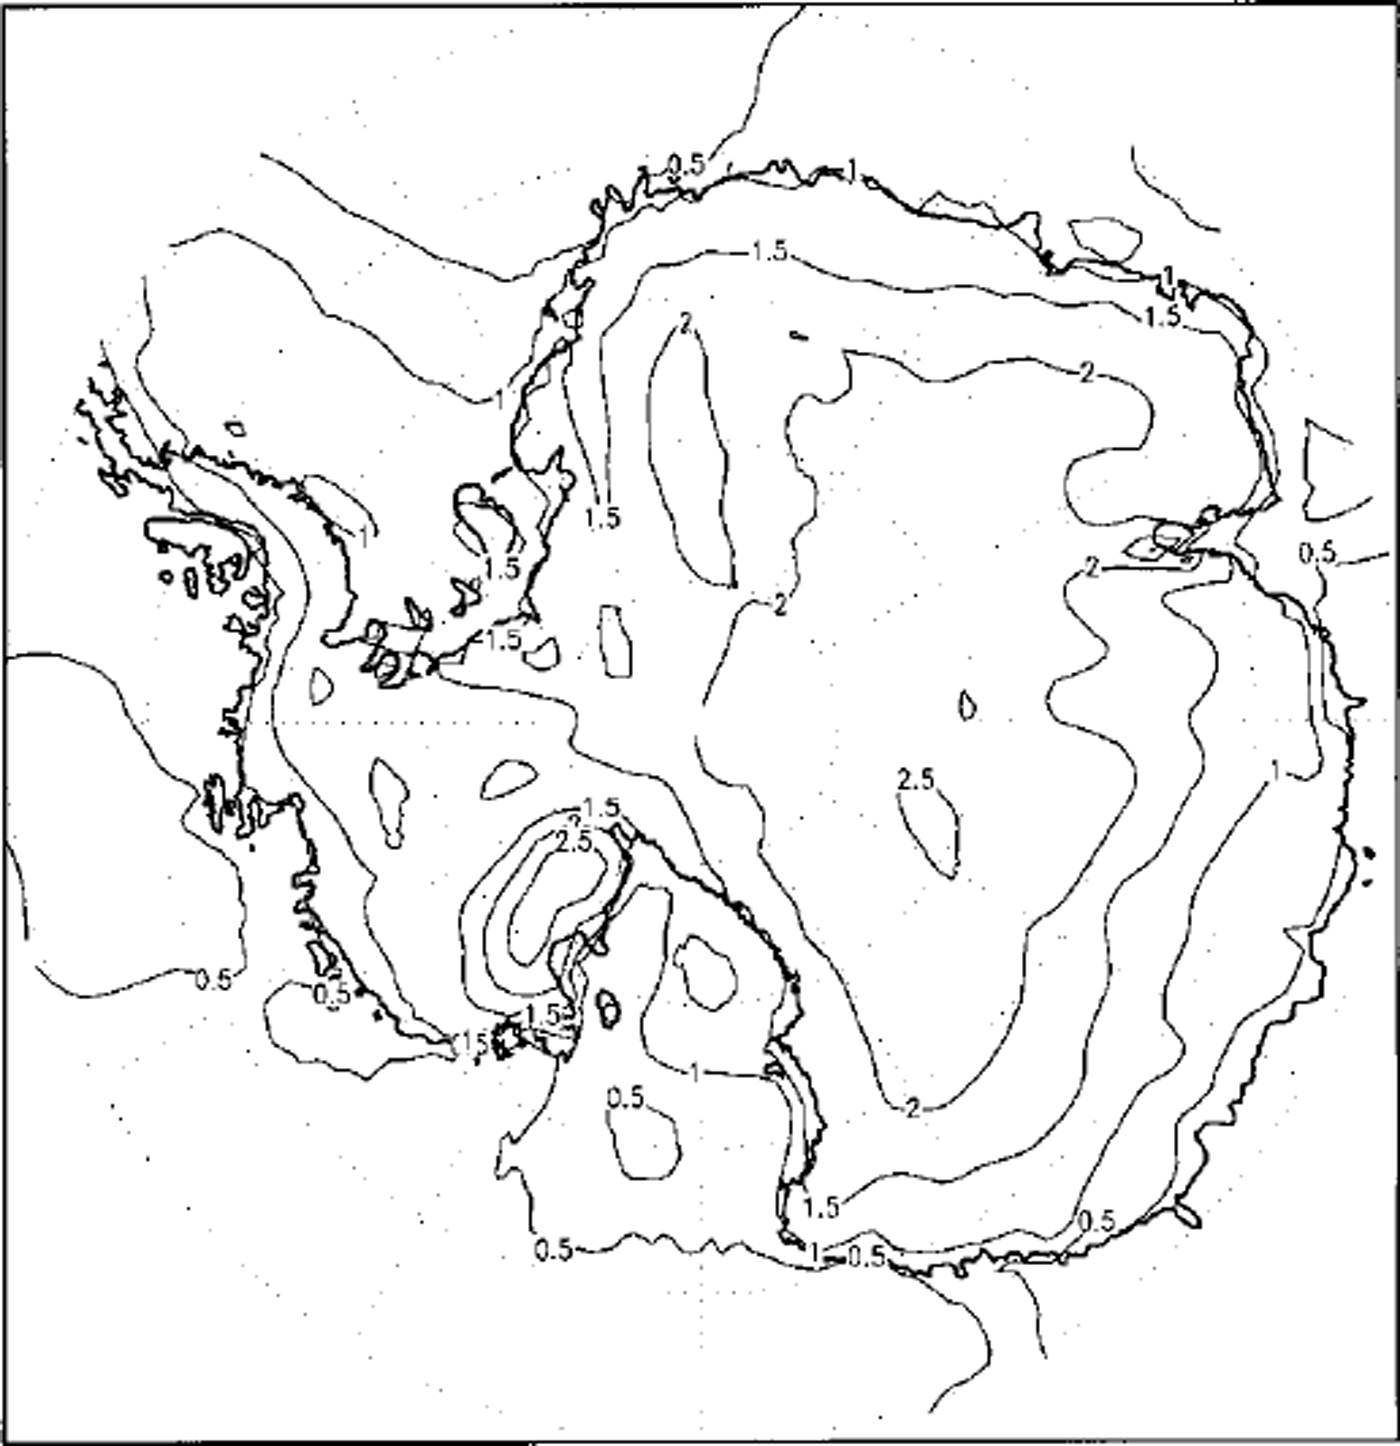
Fig. 7. Change in summer (December-January-February mean) temperature over Antarctica (aC) as projected by EC-HAM4 T106 with doubled CO concentration; calculated as difference between the 2 × CO2 time-slice scenario and the present-climate experiment.
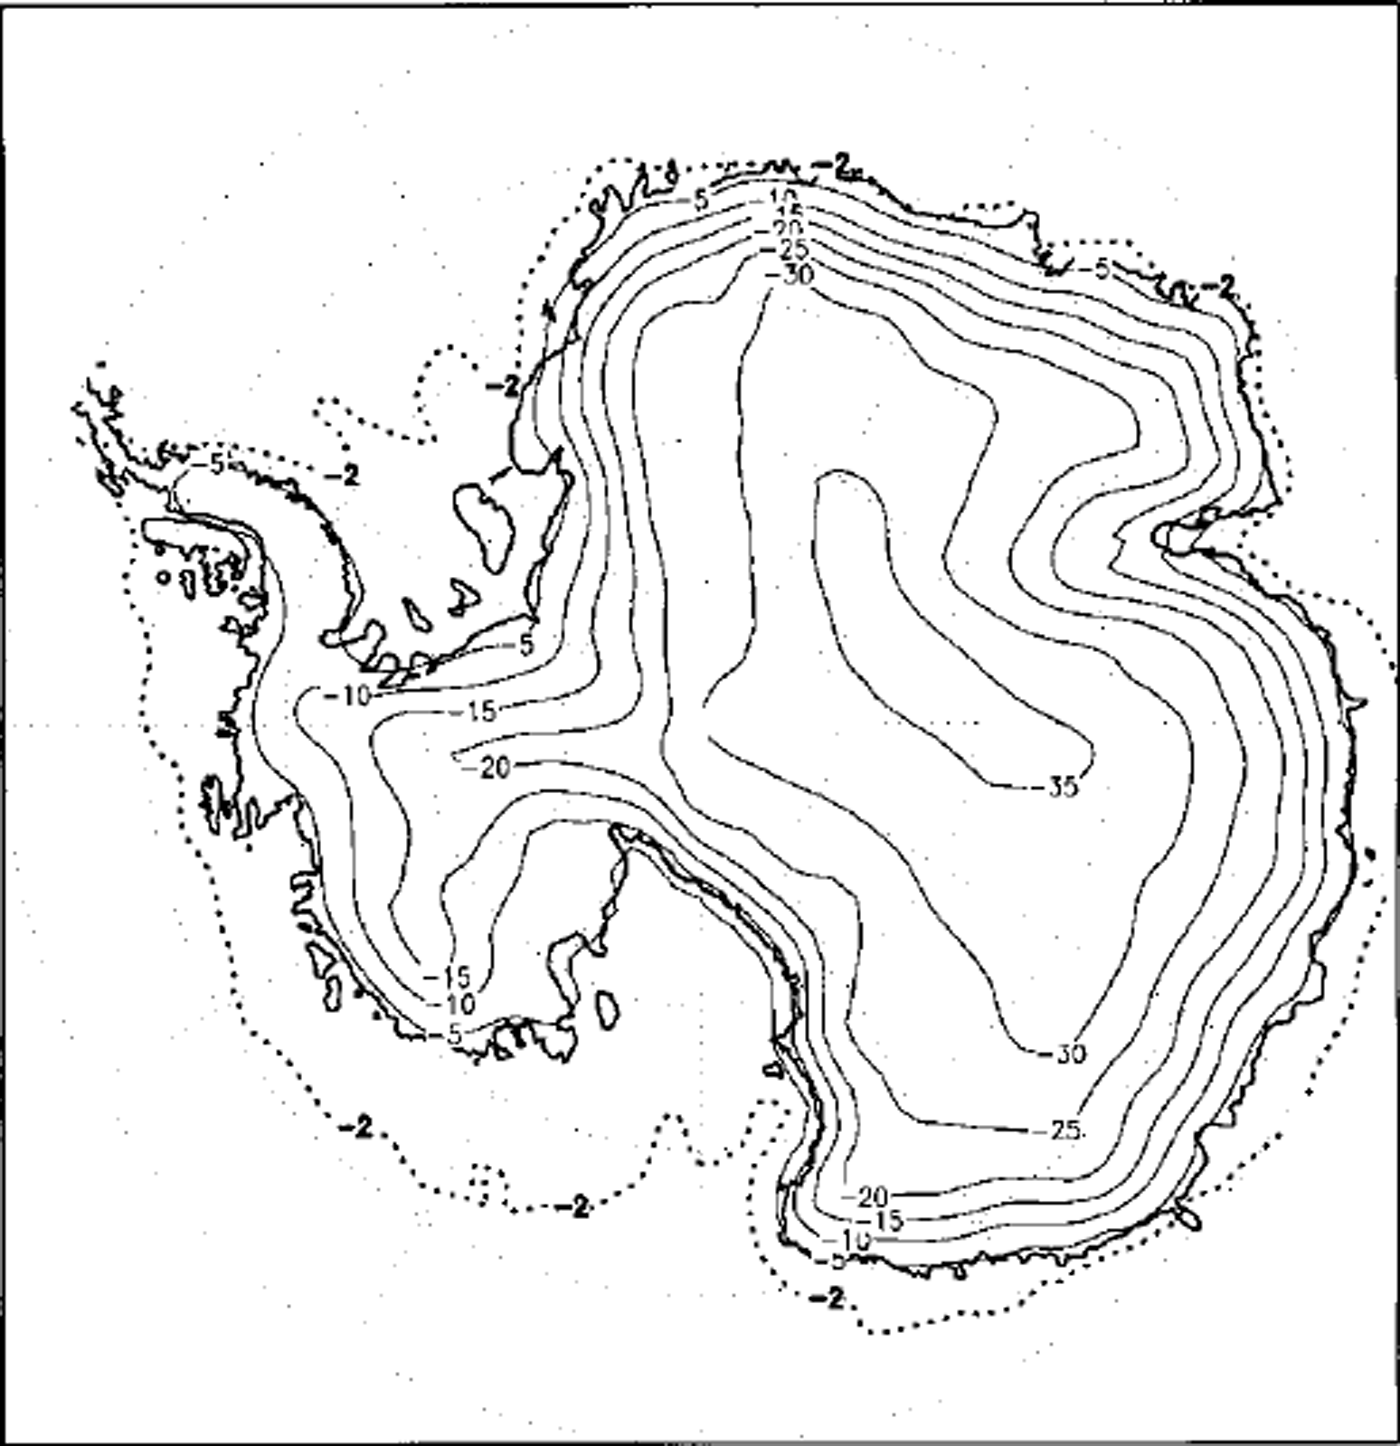
Fig. 8. Summer mean temperature under doubled CO2 concentration over Antarctica (˚C) as projected in the ECHAM4 T106 time-slice scenario. The dotted–2°Cisoline defines the lowest temperature at which ablation can occur.
5. Net Mass-Balance Changes and Consequences for Sea Level
In the ECHAM4 scenario, the aforementioned changes in accumulation and ablation lead to an alteration in mass balance of–63 mm a"1 over Greenland. This corresponds to an annual total mass loss at 2 × G 0 2 of 110 km3, which is significantly smaller than in the former ECHAM3 scenario and mainly due to the difference in accumulation (Table 1).
Over Antarctica, the mass-balance increases by 22 mm a"1 in the ECHAM4 2 × CO2 scenario due to accumulation changes only, corresponding to a total annual mass gain of 305 km3 (Table 2). This amount is almost identical to the ECHAM3 scenario.
Overall, this indicates that in the new ECHAM4 T106 scenario, the mass gain in Antarctica dominates the mass loss in Greenland almost by a factor of three, while in the former ECHAM3 T106 scenario, the larger mass loss in Greenland nearly compensated for the mass gain in Antarctica.
In terms of sea-level change, this corresponds to a sea-level fall due to the polar ice sheets of 0.6 mm a"1 in the ECHAM4 scenario, while the ECHAM3 scenario gave an estimate close to zero (sea-level rise of 0.2 mm a"1). Assuming a linear behaviour in the mass-balance changes, the new estimate in the ECHAM4 scenario is equivalent to a sea-level fall of 21 mm at the time of 2 × CO2 compared to present day.
The 0.6 mm a-1 decrease in sea level at the time of 2 × CO2 projected in the new ECHAM4 scenario caused by the polar ice sheets may be able to compensate for about half of the sea-level rise induced by the melting of mountain glaciers and small ice caps projected in other recent studies (Reference Warrick, le Provost, Meier, Oerlemans, Wood-worth, Houghton, Filho, Callander, Harris, Kattenberg and MaskellWarrick and others, 1996; Reference Gregory and OerlemansGregory and Oerlemans, 1998). This would imply that the thermal expansion of sea water might dominate the net contribution from the cryosphere to sea-level rise over the next decades. Yet, the negative contribution from the polar ice sheets to sea level may eventually reverse, if CO2 concentrations reach levels well above doubled values. This would then induce sufficient warming to initiate melt also on the Antarctic ice sheet, thereby significantly accelerating global sea-level rise. Thus, the deceleration of sea-level rise due to the net mass gain on the polar ice sheets may only be effective as long as CO2 concentrations can be stabilized below double the present values.
The largest uncertainties still inherent in these estimates are related to the contribution from the Greenland ice sheet, i.e. accumulation changes and uncertainties in the calculation of ablation which need further investigation, whereas over Antarctica, the response of the mass balance to 2 × CO2 forcing seems to be more robust and reliable.
Acknowledgements
The Swiss Center for Scientific Computing (CSCS) generously provided the necessary computer resources for the high-resolution climate-change experiments. We are grateful to the Max-Planck Institute for Meteorology (L. Bengtsson, E. Roeckner, U. Cubasch and U. Schlese) for the highly valued cooperation in the joint climate-modeling projects. This study is supported by the Swiss Bundesamt fur Bildung und Wissenschaft (BBW) grant No. 95.0640 and the Alliance for Global Sustainability (AGS).


