Introduction
As snowpacks compress during the transition from firn to ice, air voids change to channels, and then to air bubbles. The bubbles shrink with increasing depth because of overburden pressure. Finally, at some depth, they disappear. Simultaneously, air clathrate-hydrates begin to form. Their formation depends on temperature and pressure, and the dissociation of air hydrates (Reference MillerMiller, 1969). Reference Uchida, Hondoh, Mae, Lipenkov and DuvalUchida and others (1994) found that fluctuations of hydrates in the Vostok ice core are correlated with climatic changes. In particular, the number concentration of hydrates varied remarkably in the Last Interglacial period. Fluctuations in the number concentration of air bubbles from the Vostok ice core (Reference Barkov and LipenkovBarkov and Lipenkov, 1984; Reference LipenkovLipenkov, 1989) are also correlated with climatic variations. The data contain information about the deposition of snow on the surface of ice sheets and its subsequent metamorphosis, and may thus be expected to be correlated with climatic variations.
A 2500.72 m deep ice core was drilled at Dome Fuji (Dome F) station (77°19’01"S, 39°42’12" E) by Japanese Antarctic Research Expedition (JARE) parties from 1993 to 1997. Forty per cent of the ice core was cut lengthwise and 2251.39 m was brought to Japan in 1996. The samples were stored in a cold room at-50°C.
Observation Methods and Measurements
Observation of air bubbles was conducted using an optical microscope, and observation of air hydrates was conducted with a microscope using a laser beam as a light source. The presence of hydrate was confirmed by refraction-index measurements. The samples were 10 cm long, 4 cm wide and about 2 mm thick. The whole sample area was searched for air bubbles, and a region 10 cm long, 1.1mm wide and 5 mm thick was searched for hydrates. Areas of 1.1x1.1mm2 were photographed using a charge coupled device camera and analyzed on a computer. The concentration and size were measured, and volumes were calculated. The pictures were taken at a X60 magnification, enabling all features > 0.01 mm to be observed.
Results
Features of the air bubbles and hydrates
Figure 1 shows photographs of hydrates from the Dome F ice core. Most of the hydrates observed are of two kinds, either ellipsoidal or irregular (Fig. la and b). But air hydrates of longer rod-like shape were also found (Fig.Id). This type was not observed in Vostok ice cores (Reference Uchida, Hondoh, Mae, Lipenkov and DuvalUchida and others, 1994).
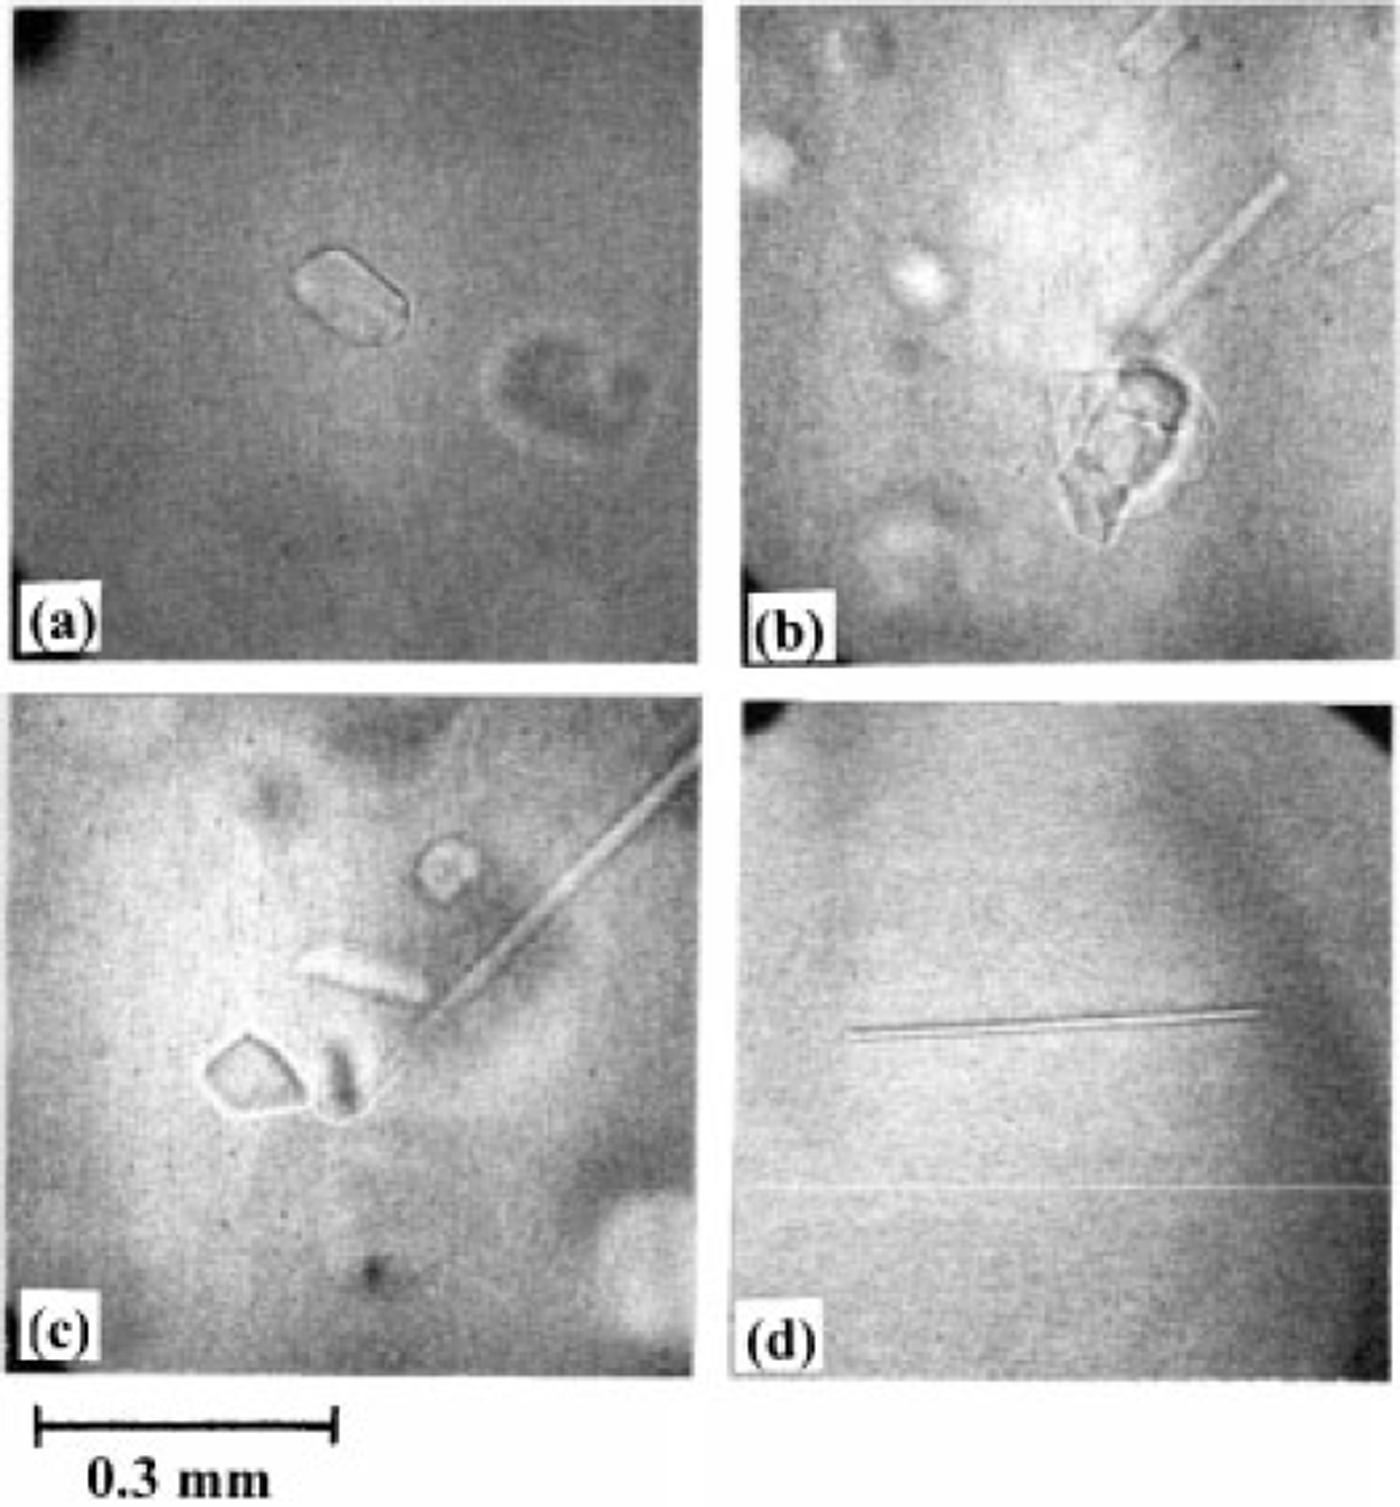
Fig. 1. Various forms of air-hydrate crystals observed in the Dome F core: (a) ellipsoidal; (b) irregular; (c) polyhedral; ( d) rod-like (sample from 1000 m).
Figure 2 shows the aspect ratio of the air bubbles (calculated by assuming an elliptical shape, aspect ratio is the ratio of the major to minor axes). The air bubbles gradually become more spherical with depth, but never become completely spherical. The smallest value of the aspect ratio was about 1.25.
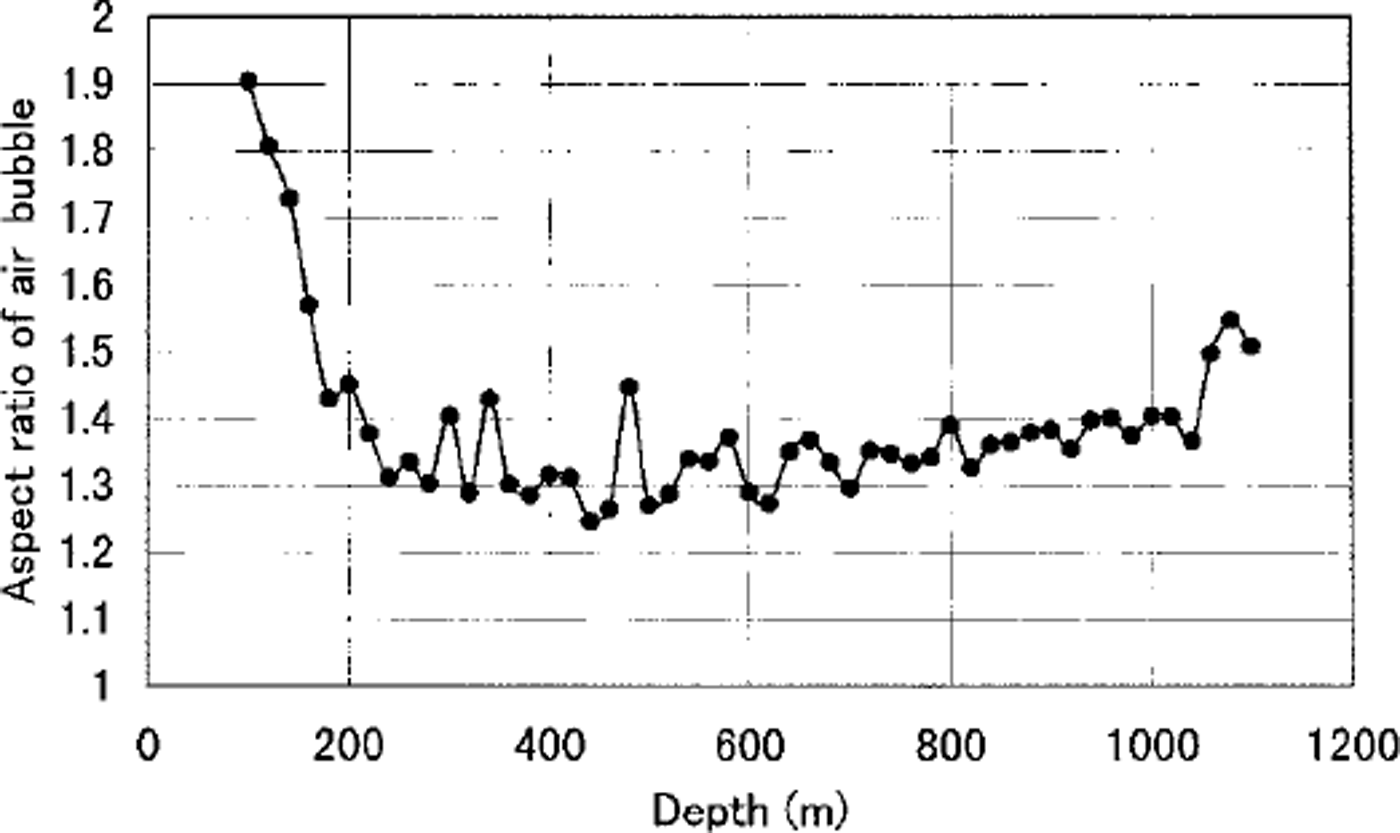
Fig. 2. Aspect ratio of air bubbles as a function of depth.
The air hydrates occurred as four types: ellipsoid, irregular, polyhedron and rod-like (Fig. 1). The rod-like hydrates are distinguished from the ellipsoidal hydrates by an aspect ratio above 5. The relative proportion of hydrate forms as a function of depth is shown in Figure 3. The relative proportion of ellipsoidal hydrates decreases with increasing depth to about 1000 m where air bubbles disappear. Below this, the proportion of ellipsoid hydrates increases gradually with depth. In contrast, the relative proportion of irregular hydrates changes in the opposite sense. The relative proportion of the rod-like hydrates is always small (5-10%) and decreases with depth.
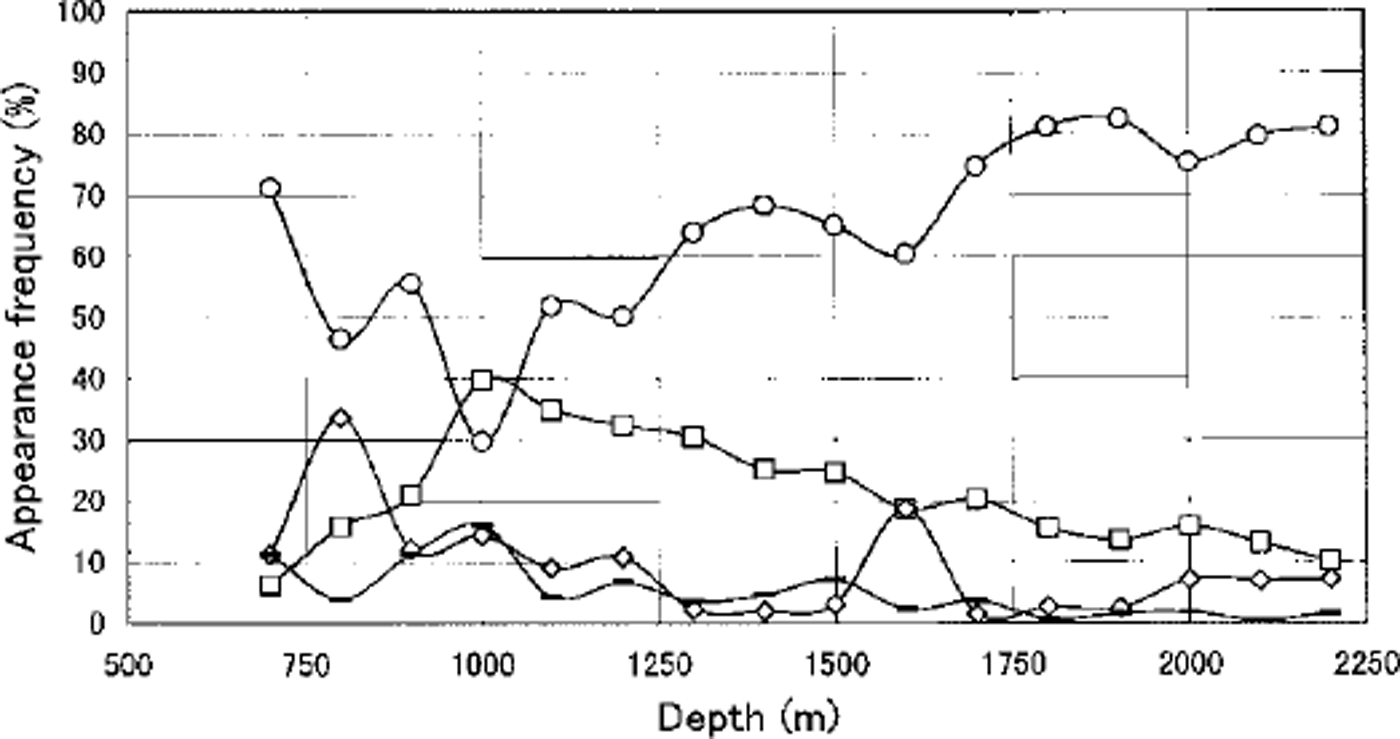
Fig. 3. The relative frequency of various forms of air hydrates against depth. Circles: ellipsoid; squares: irregular; lozenges: polyhedron; dashes: long rod.
Figure 4a and b show plots of the size distribution of air bubbles and hydrates, respectively, at various depths. The diameter is the average of the major and minor axes. It can be seen that the distribution of air-bubble size changes gradually with depth from a near T-distribution to a normal distribution (Fig.4a). The plots of hydrate size are closer to a normal distribution (Fig.4b). Figure 5 shows the air-bubble and -hydrate size profile as a function of depth. Filled circles correspond to the median value, and the "error bars" indicate the size range within the median ±17%. The median value does not change significantly, but the size of the large air bubbles decreases rapidly near the surface.
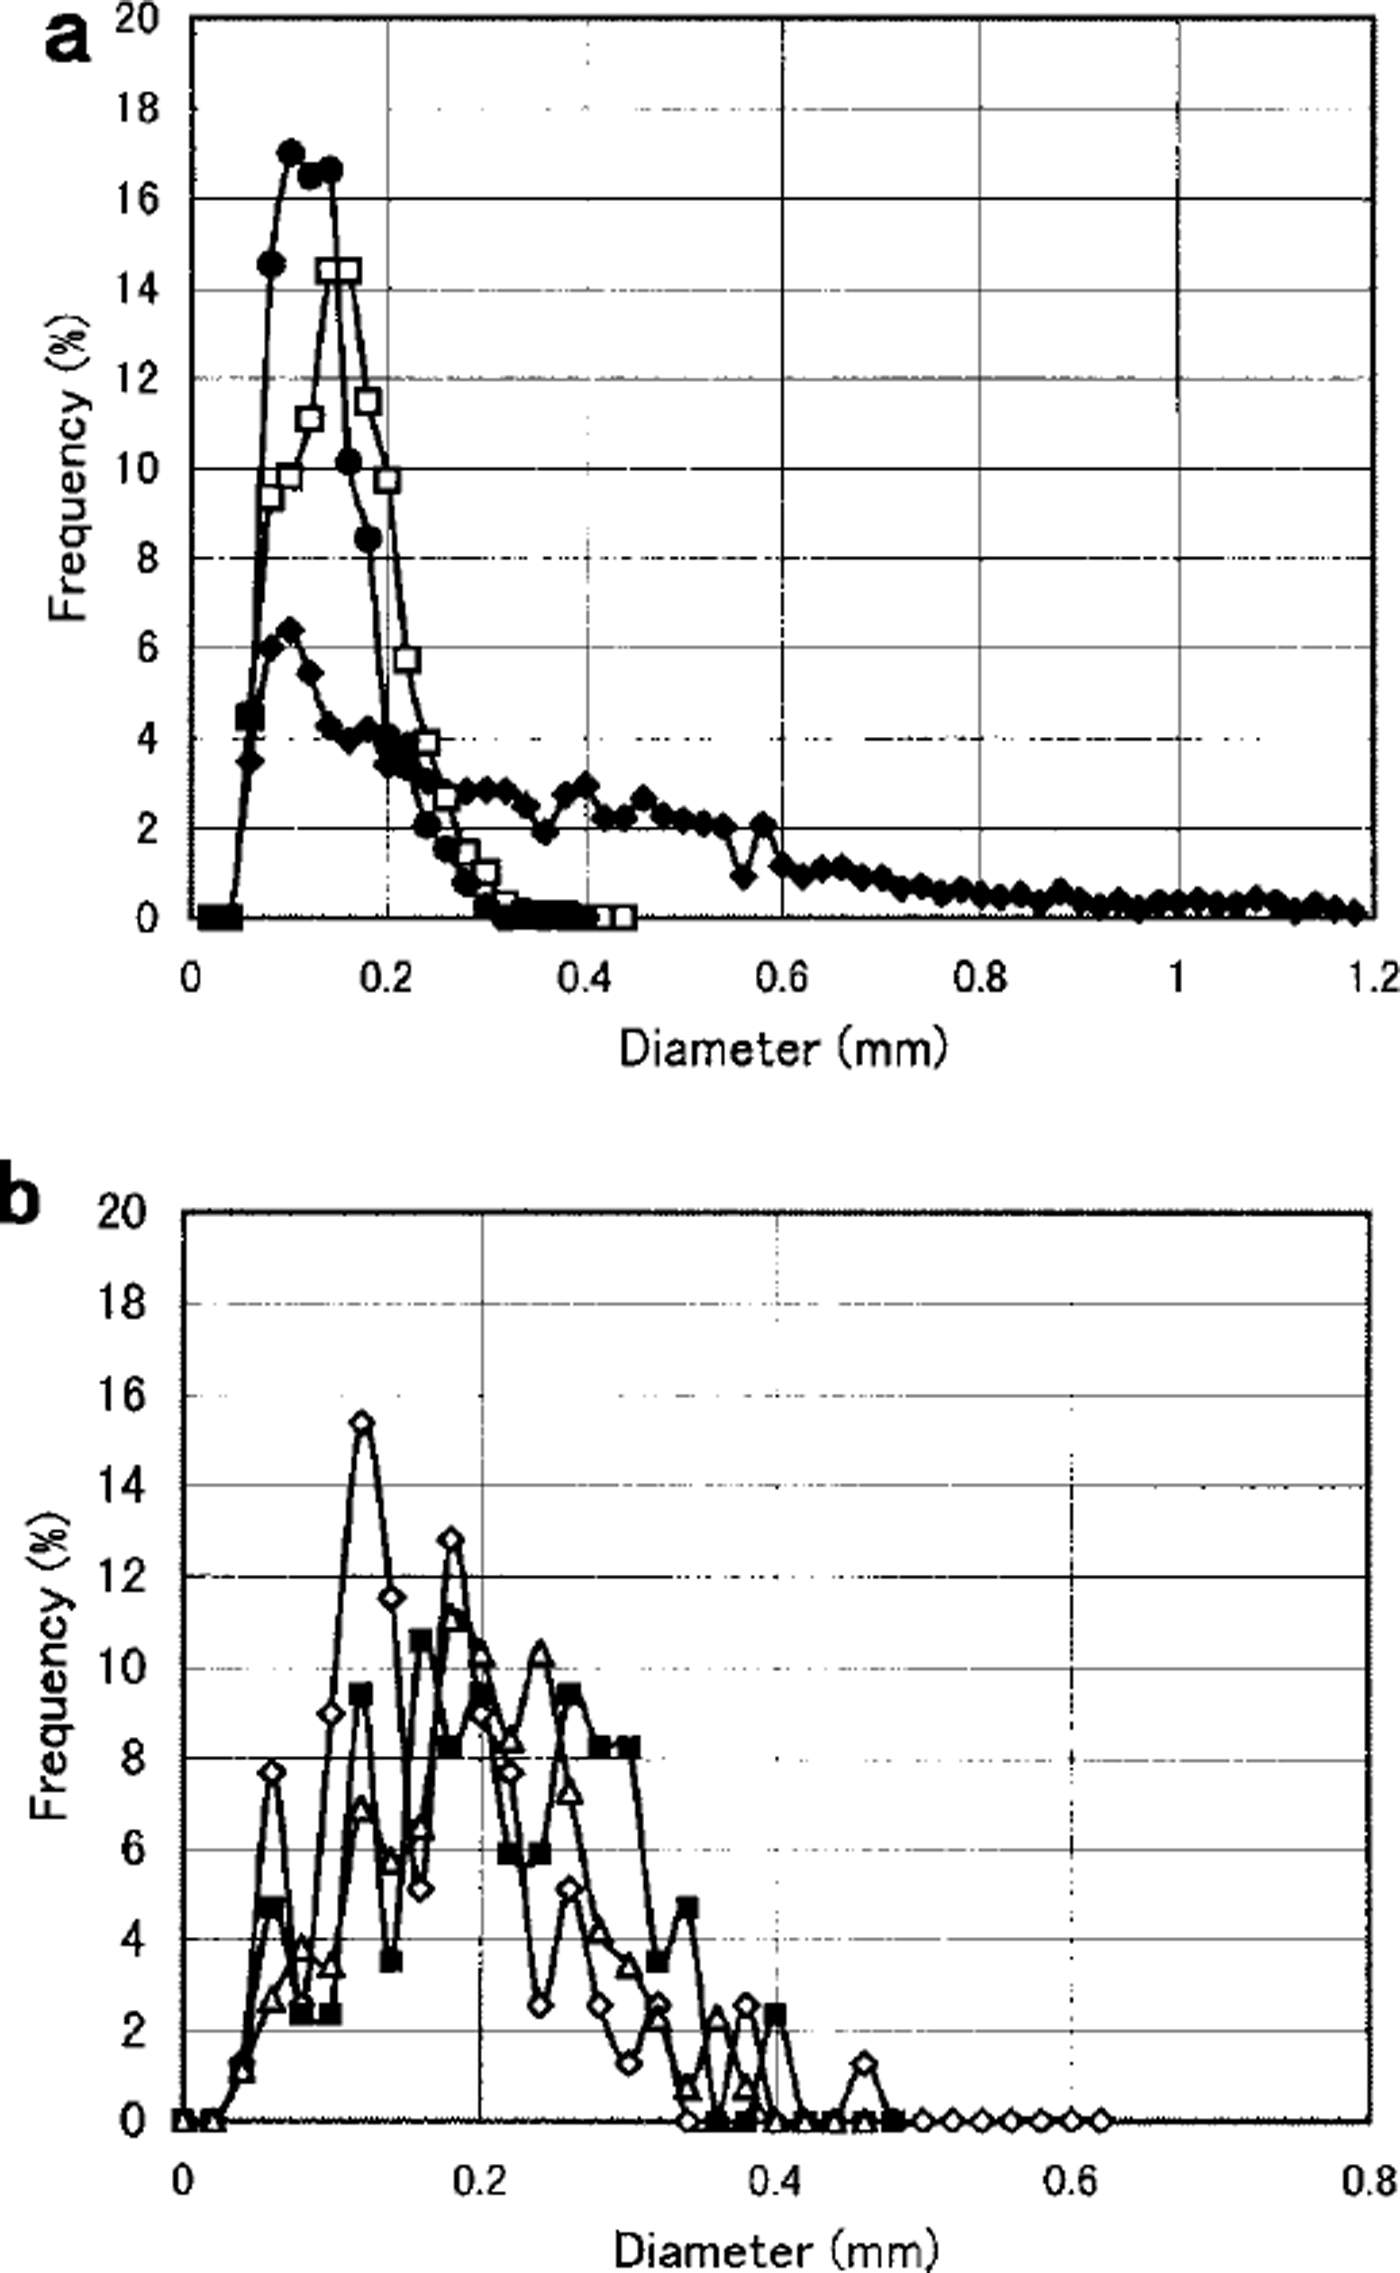
Fig. 4. Plots of (a) size distribution of air bubbles, and (b) hydrates. Filled lozenges: 100 m; empty squares: 700 m; filled circles: 1200 m; empty lozenges: 900 m; filled squares: 1700 m; empty triangles: 2100 m.
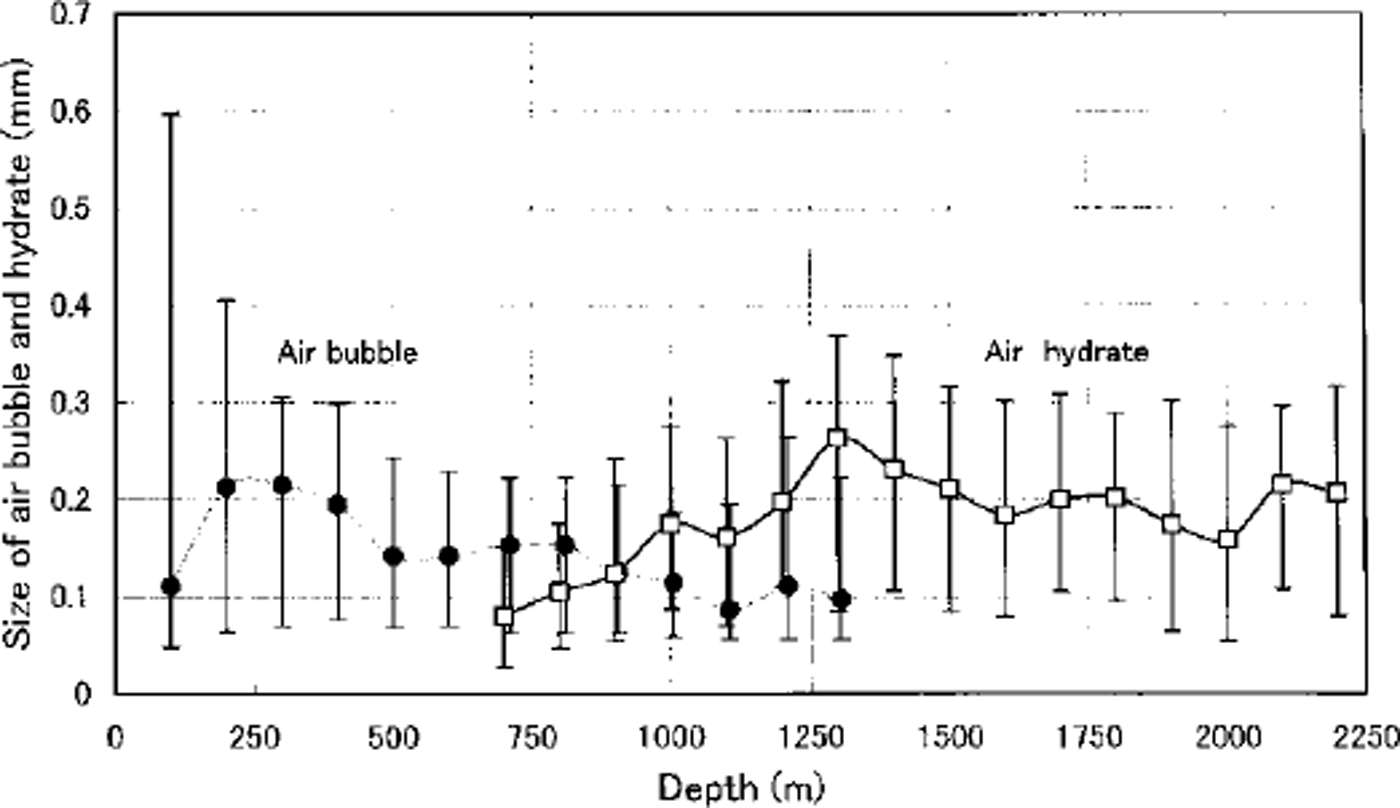
Fig. 5. The relationship between air-bubble size and -hydrate size and depth. Filled circles: air bubble; empty squares: air hydrate.
Concentration and volume of air bubble and hydrate
Figure 6 shows the profiles of air-bubble and -hydrate concentration against depth. The concentration of air bubbles is about 700-800 cm"3 at shallow depths, and decreases suddenly with depth below about 500 m. Air bubbles disappear at about 1100 m and hydrates begin to appear from about 450 m. The transition zone from air bubbles to hydrates occurs between about 450 and 1100 m. The number concentration of hydrates is about 400-600 cm−3, with larger values around 2000 m depth. Changes in hydrate concentration with depth correspond approximately with changes of climatic conditions at the time of deposition, as indicated by the δ 18O profile (Fig. 6). The colder the temperature, the larger the hydrate concentration and vice versa. This link with climate was also observed in the Vostok ice core (personal communication fromV. Ya. Lipenkov, 1996). The number concentration of hydrates in the Dome Fcore in the Last Glacial Maximum (LGM) ice, however, is approximately half that of the Vostok core.
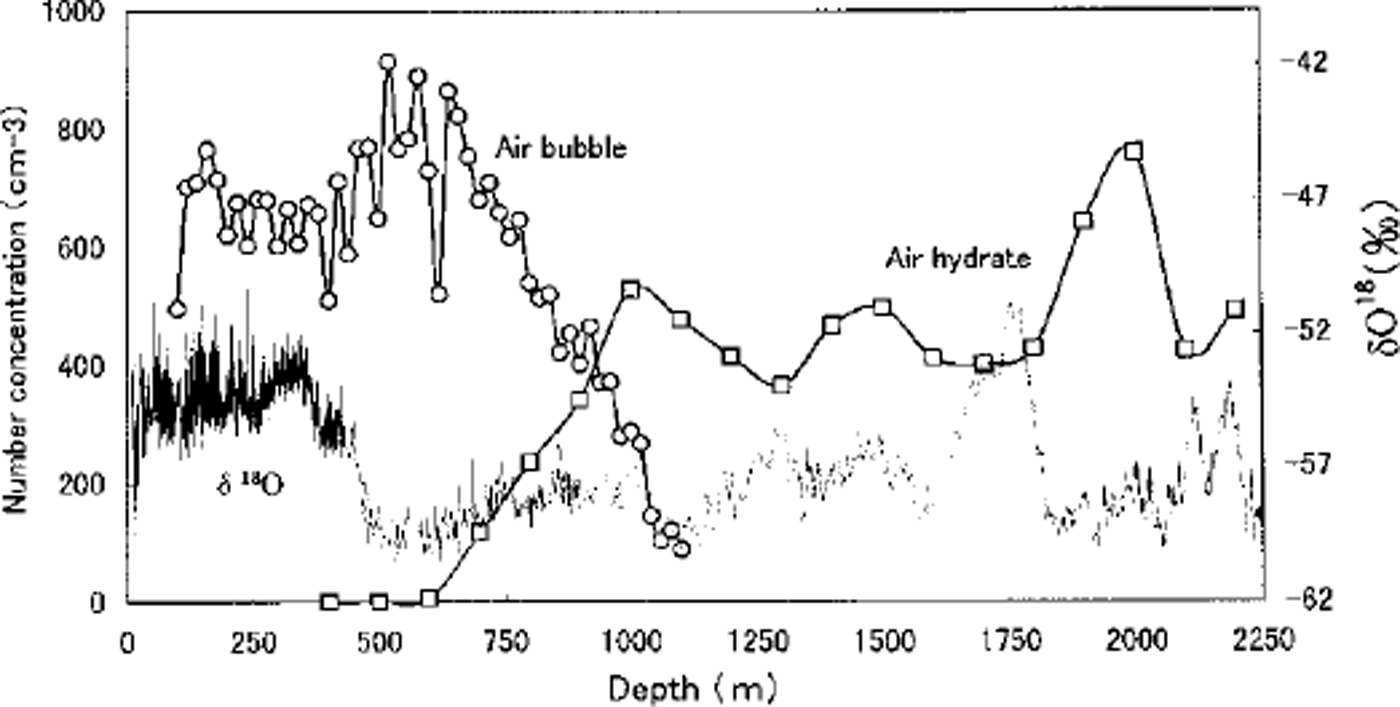
Fig. 6. Profiles of the number concentration of air bubbles and hydrates. Circles: air bubble; empty squares: air hydrate.
Profiles of the total volume of air bubbles and hydrates are shown in Figure 7. The total volume of both gradually decreases with depth, after a sharp decrease of air-bubble volume at shallower depths. A shift of volume between both at the depth at which the air bubbles disappear is due to the difference in density between air bubbles and hydrates. The density of air hydrate calculated by Reference Hondoh, Anzai, Goto, Mae, Higashi and LangwayHondoh and others (1990) was 980 kg m−3.
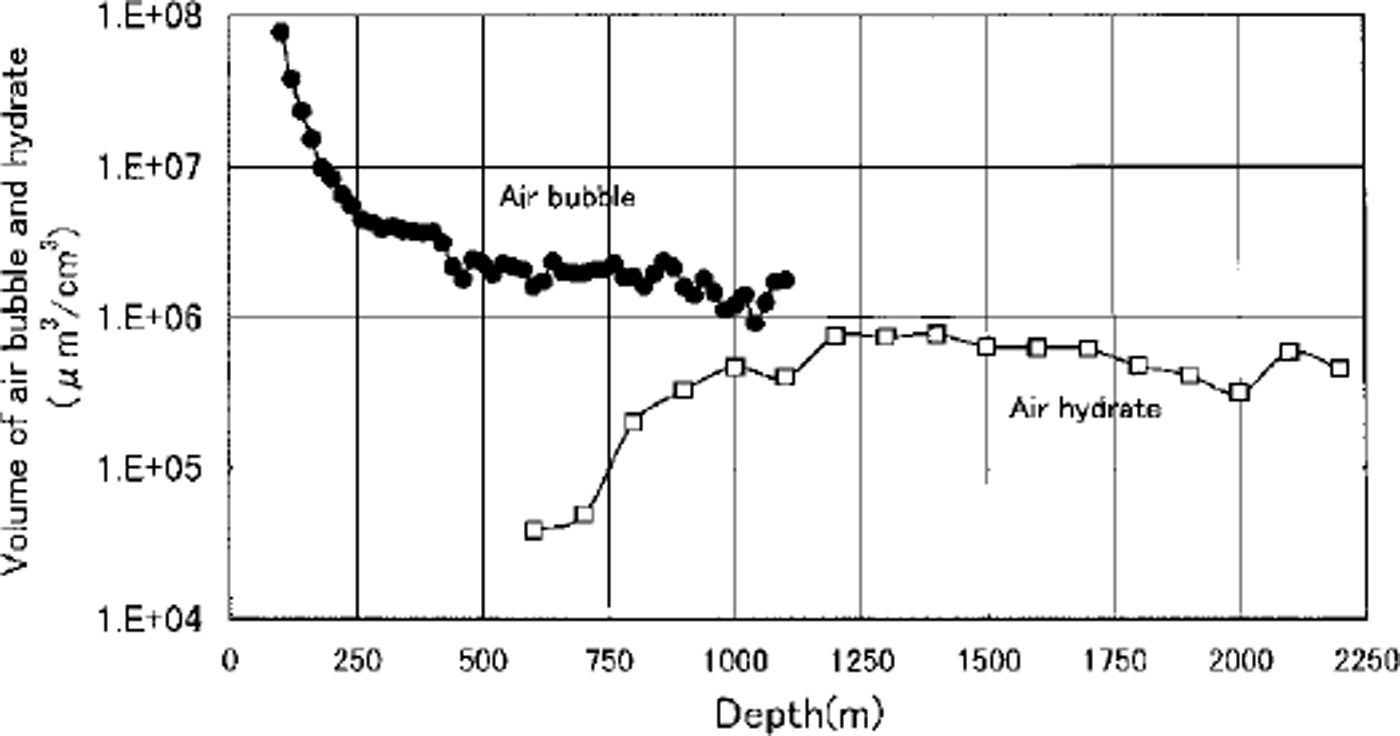
Fig. 7. Profiles of air-bubble and -hydrate volume. Filled circles: air bubble; empty squares: air hydrate.
Comparison of the Dome F and Vostok data
The concentration and volume of air bubbles and hydrates in the Vostok ice core were examined by Reference LipenkovLipenkov (1989) and Reference Uchida, Hondoh, Mae, Lipenkov and DuvalUchida and others (1994), respectively. The fluctuations of concentrations in the Vostok core were inversely correlated to climate. Similarly, the fluctuations of concentrations in the Dome F core are inversely correlated with δ 18O variability.
As described above, the concentration of hydrates between about 750 and 1200 m (i.e. during the Glacial period) in the Dome Fcore is approximately half that of the Vostok core, while the total volume of hydrates is almost the same (personal communication from V. Ya. Lipenkov, 1996). During the densification process, the smaller the snow grain-size, the larger the number of air bubbles and the smaller the size of the air bubbles. Since grain growth depends on temperature at shallow depths in ice sheets, snow containing smaller grains is formed at lower temperature (Reference GowGow, 1969). If grain-size at about 750-1200 m depth is reflected in the grain growth at the surface, one would expect the Vostok core to have smaller grains than the Dome Fcore. However, grain-size in the Vostok core at these depths is at least twice that in the Dome F core (Reference Lipenkov, Barkov, Duval and PimientaLipenkov and others, 1989; Reference AzumaAzuma and others, 1999), yet the temperature at the time of deposition was almost the same (SB value calculated for the Vostok core and 518O value for the Dome Fcore).
The discussion up to now has considered the densification process of spherical grains. However, a skeleton-type depth hoar develops near the surface at Dome F. The crystals grow to a few mm in size (Reference AkitayaAkitaya, 1974) and have a very complicated structure. When crystals of this skeleton type are packed and subsequently densified, the ice contains many bubbles. Thus the concentration of air bubbles is much higher than if the ice had been formed from spherical grains. The mean temperature is −55.5°C, and the present snow-accumulation rate at Vostok station is about 2.2 g cm-2a–1 (Reference Jouzel, Petit and RaynaudJouzel and others, 1990). This is lower than the present rate of about 3.2 gem"2 a−1 at Dome F station where the mean temperature is −58.9°C (Reference WatanabeWatanabe and others, 1997). However, the accumulation rate at Dome F during the period corresponding to depths of 750-1200 m was almost the same as the rate at Vostok, judging from a comparison of δD and δ180 profiles. The growth rate of depth-hoar crystals depends on how long the snow is kept in a steep temperature gradient near the ice-sheet surface. However, since the temperatures are believed to have been about the same at Vostok and at Dome F, this cannot explain the large difference in hydrate concentration. It would seem therefore that the difference in number concentration in the LGM ice cannot be accounted for in terms of differences in the metamorphism of snow to ice.
Concluding Remarks
Observations of air bubbles and hydrates were carried out on the Dome F ice core. The hydrates were classified into four types. The relative frequency profiles are shown in Figure 3. The number of ellipsoidal hydrates increased with depth below the transition from air bubble to hydrate. In contrast, the irregular hydrates decreased with increasing depth. This is considered to be due to annealing effects of hydrates in the ice sheet as proposed by Reference HondohHondoh (1989) on the basis of the observation of hydrates in Dye 3 ice cores. A new, rod-like hydrate shape, unreported until now, was discovered.
The number concentrations of air bubbles and hydrates were correlated with the δ 18O profile. However, the mean volume did not change as much as the number concentration. In the ice from the Glacial period the number concentration of hydrates is a factor of two greater at Vostok than at Dome F. This difference cannot be accounted for on the basis of the packing of different snow types.
Acknowledgements
We thank the members of the JARE drilling team and TARE parties for recovering the ice core and transporting it to japan in excellent condition.


