Introduction
The southern Sea of Okhotsk is characterized by sea ice which is located at one of the lowest latitudes in the world. In this region, sea-ice extent normally begins to spread from the north in mid-January, reaches the coastal region of Hokkaido in late January and covers the largest area at the end of February. During this season, this region is located on one of the main cyclone tracks over East Asia (Reference Chen, Kuo, Zhang and BaiChen and others, 1991) and is subject to developing cyclones. Since a large horizontal temperature gradient exists between the cold continent (T ≤ −20°C) and the warm northern Pacific Ocean (T ≥ 0°C), it is possible that the heat exchange between the atmosphere and the sea-ice area over this region has a significant effect on the cyclone activities. Some numerical studies have pointed out the possibility that the presence of sea ice can affect the surrounding atmospheric circulation (e.g. Reference Honda, Yamazaki, Tachibana and TakeuchiHonda and others, 1996). However, because of limited in situ data, it is still uncertain how much effect sea-ice area has on the heat budget in the Sea of Okhotsk.
This region is also important to the ocean circulation. Dense water produced by ice formation can affect the ocean structure. This region has recently been identified as a possible source of the North Pacific Intermediate Water (Reference Watanabe and WakatsuchiWatanabe and Wakatsuchi, 1998), so it is important to estimate how much sea ice can be produced in this area. Estimation of the ice production also serves to explain ice-growth processes in this region.
Thus the southern Sea of Okhotsk is an important area for both the atmospheric and the oceanic circulation. In early February of 1996−99, corresponding to the ice-growth season, we carried out meteorological and ice observations in this region, using the ice-breaker soya. The major purpose of this paper is to discuss the thermodynamical features of sea-ice area in this region on the basis of these in situ data. For this purpose, we calculate the heat budgets and estimate turbulent heat flux from ocean to atmosphere and ice-growth rate. In addition, in order to determine the characteristics of the heat budget in this region, the results are compared with those in the northern Sea of Okhotsk which are estimated using the European Centre for Medium-range Weather Forecasts (ECMWF) dataset and an empirical solar radiation formula.
Meteorological and Ice Observations
In early February of 1996−99, we carried out in situ observations aboard the ice-breaker soya in the southern Sea of Okhotsk (Fig. 1), in collaboration with the Japan Coast Guard. On these cruises, we measured directly both meteorological and ice conditions, in particular the ice concentration and thickness.

Fig. 1. Geographical map of the southern sea of okhotsk with the ship tracks (thin lines) and ice edges (thick dashed line) for (a) 1996; (b) 1997; (c) 1998; (d) 1999
During the observation of about 1 week in early February, the air temperature ranged from −6° to −1°C for 1996, from −10° to −2°C for 1997, from −16° to −3°C for 1998 and from −13° to −2°C for 1999. The averaged temperatures during the first 10 days of February at the coastal station Abashiri (Fig. 1) were −6.5°, −5.1°, −7.8° and −6.7°C for years 1996−99, respectively. Since the mean temperature for 1971−2000 is −7.1 °C, with standard deviation of 1.94°C, each year is almost normal. In addition, the averaged temperatures during the ice-growth season (21 January-28 February) were −6.0°, −4.9°, −7.1° and −5.8°C for years 1996−99, respectively, nearly the same as the averaged values during the observation period. Thus we may say that although the observation period is short, the data are relatively representative. The wind speed was 1−10 m s"1, and the wind direction varied from south to north for each year. The sea-ice extent in the southern Sea of Okhotsk was almost normal compared with the averaged ice edge during 1971−90.
Air temperature and relative humidity were measured with a thermo-/hygrometer with a ventilating motor fan. This instrument was mounted on the ship mast at 15 m a.s.l. so as to avoid interference from the ship. Shortwave radiation was measured with pyranometers at the bow. A gimbal mechanism was used to keep the measuring surface horizontal. The details of shortwave radiation measurement are described in Reference Toyota, Ukita, Ohshima, Wakatsuchi and MuramotoToyota and others (1999). Anemometers installed at the top of the ship mast, 22 m a.s.l, were used to obtain wind data. This observation was conducted by the ship’s crew at hourly intervals. Cloud amount, ice amount (both in tenths) and weather were observed visually at hourly intervals during the cruise. In addition, we recorded the areal fraction of each ice type around our ship at hourly intervals according to the classification of WMO (1970).
Ice thickness was monitored by a downward-looking video camera mounted at the side deck of the ship. Some ice floes which were broken at the bow were found to turn into side-up positions. For such ice floes we measured their ice thicknesses manually on each video image. This way, ice-thickness data could be obtained with an accuracy of a few centimeters. The measurement was made throughout the cruise. The numbers of samples collected was 153, 4119, 2910 and 1658 in 1996−99, respectively. Since the ice-thickness data were obtained during all the cruises, and the cruise tracks cover a relatively large area in the southern Sea of Okhotsk, we regard the measured ice-thickness histogram (Fig. 2) as the representative areal ice-thickness distribution. The fraction of total ice coverage in this region was determined from visual observation. We averaged the ice-amount data which were visually observed at hourly intervals during the cruise.
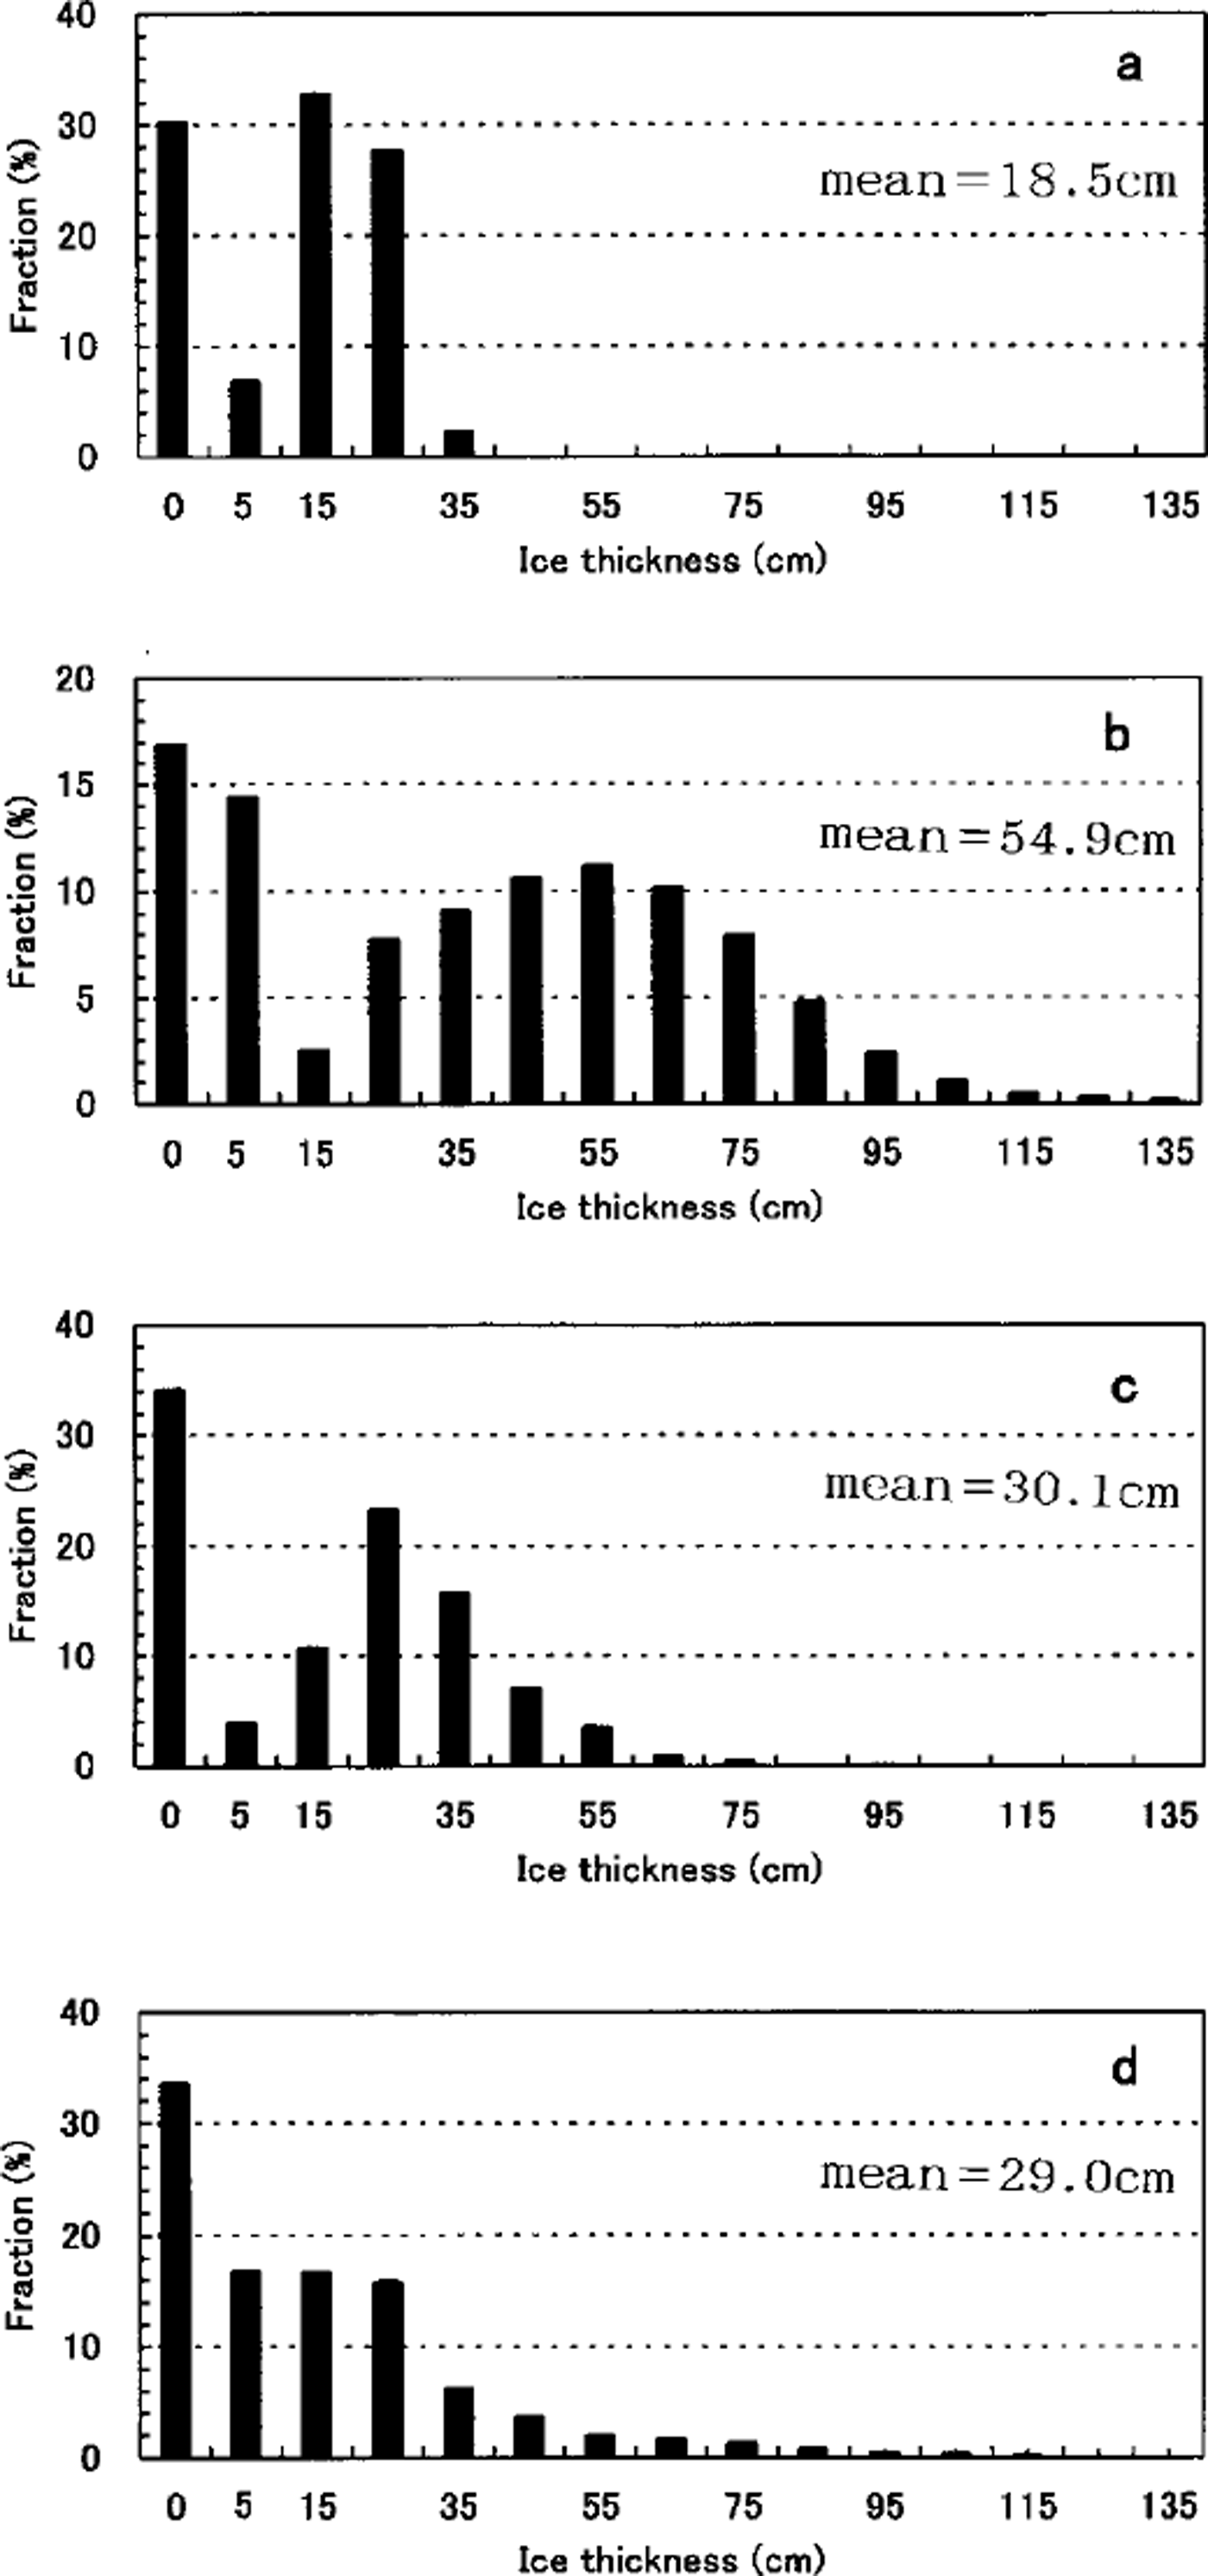
Fig. 2. Areal fraction of ice thickness for (a) 1996, (b) 1997, (c) 1998, (d) 1999 used for the heat-budget calculation.
Method of Calculation
A thermodynamic ice model similar to that of Reference MaykutMaykut (1978, Reference Maykut1982) is used to estimate heat budgets and ice production. Reference MaykutMaykut (1978, Reference Maykut1982) used these models to investigate the effects of ice-thickness variations on heat exchange over the central Arctic. He assumed an ice-thickness distribution as calculated byReference Thorndike, Rothrock, Maykut and ColonyThorndike and others (1975). In our study, we use the distribution obtained from our observations.
We allocated the areal fraction of ice thickness at 10 cm intervals (hi = 15,25,35,45,… cm) among the total ice concentration (69.8% in 1996,83.1 % in 1997,65.9% in 1998 and 66.4% in 1999) which was calculated from hourly visual observations. The areal fraction of the thinnest ice (hi = 5 cm) was also obtained from the visually observed fraction of nilas. As is shown in Figure 2, the ice-thickness distributions differ significantly among the four years; the ice is thin for 1996, much thicker for 1997 and moderately thick for 1998 and 1999.
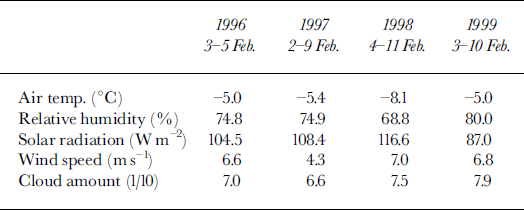
In order to grasp the general features of the heat budget in this region, we use the averaged diurnal cycle of the meteorological data during the observational period. For this purpose, we prepared the hourly meteorological data by taking averages at each hour during the period. The hourly data of air temperature, relative humidity and solar radiation are shown in Figure 3. For reference, daily averaged data are listed in Table 1. Although the periods are limited to about 1 week, both warm and cold spells are included, so the averaged daily cycle can be considered representative in this region at this time of the year. Figure 3 also shows that meteorological conditions are relatively similar in each year except that air temperature is about 3°C lower for 1998 than for other years.
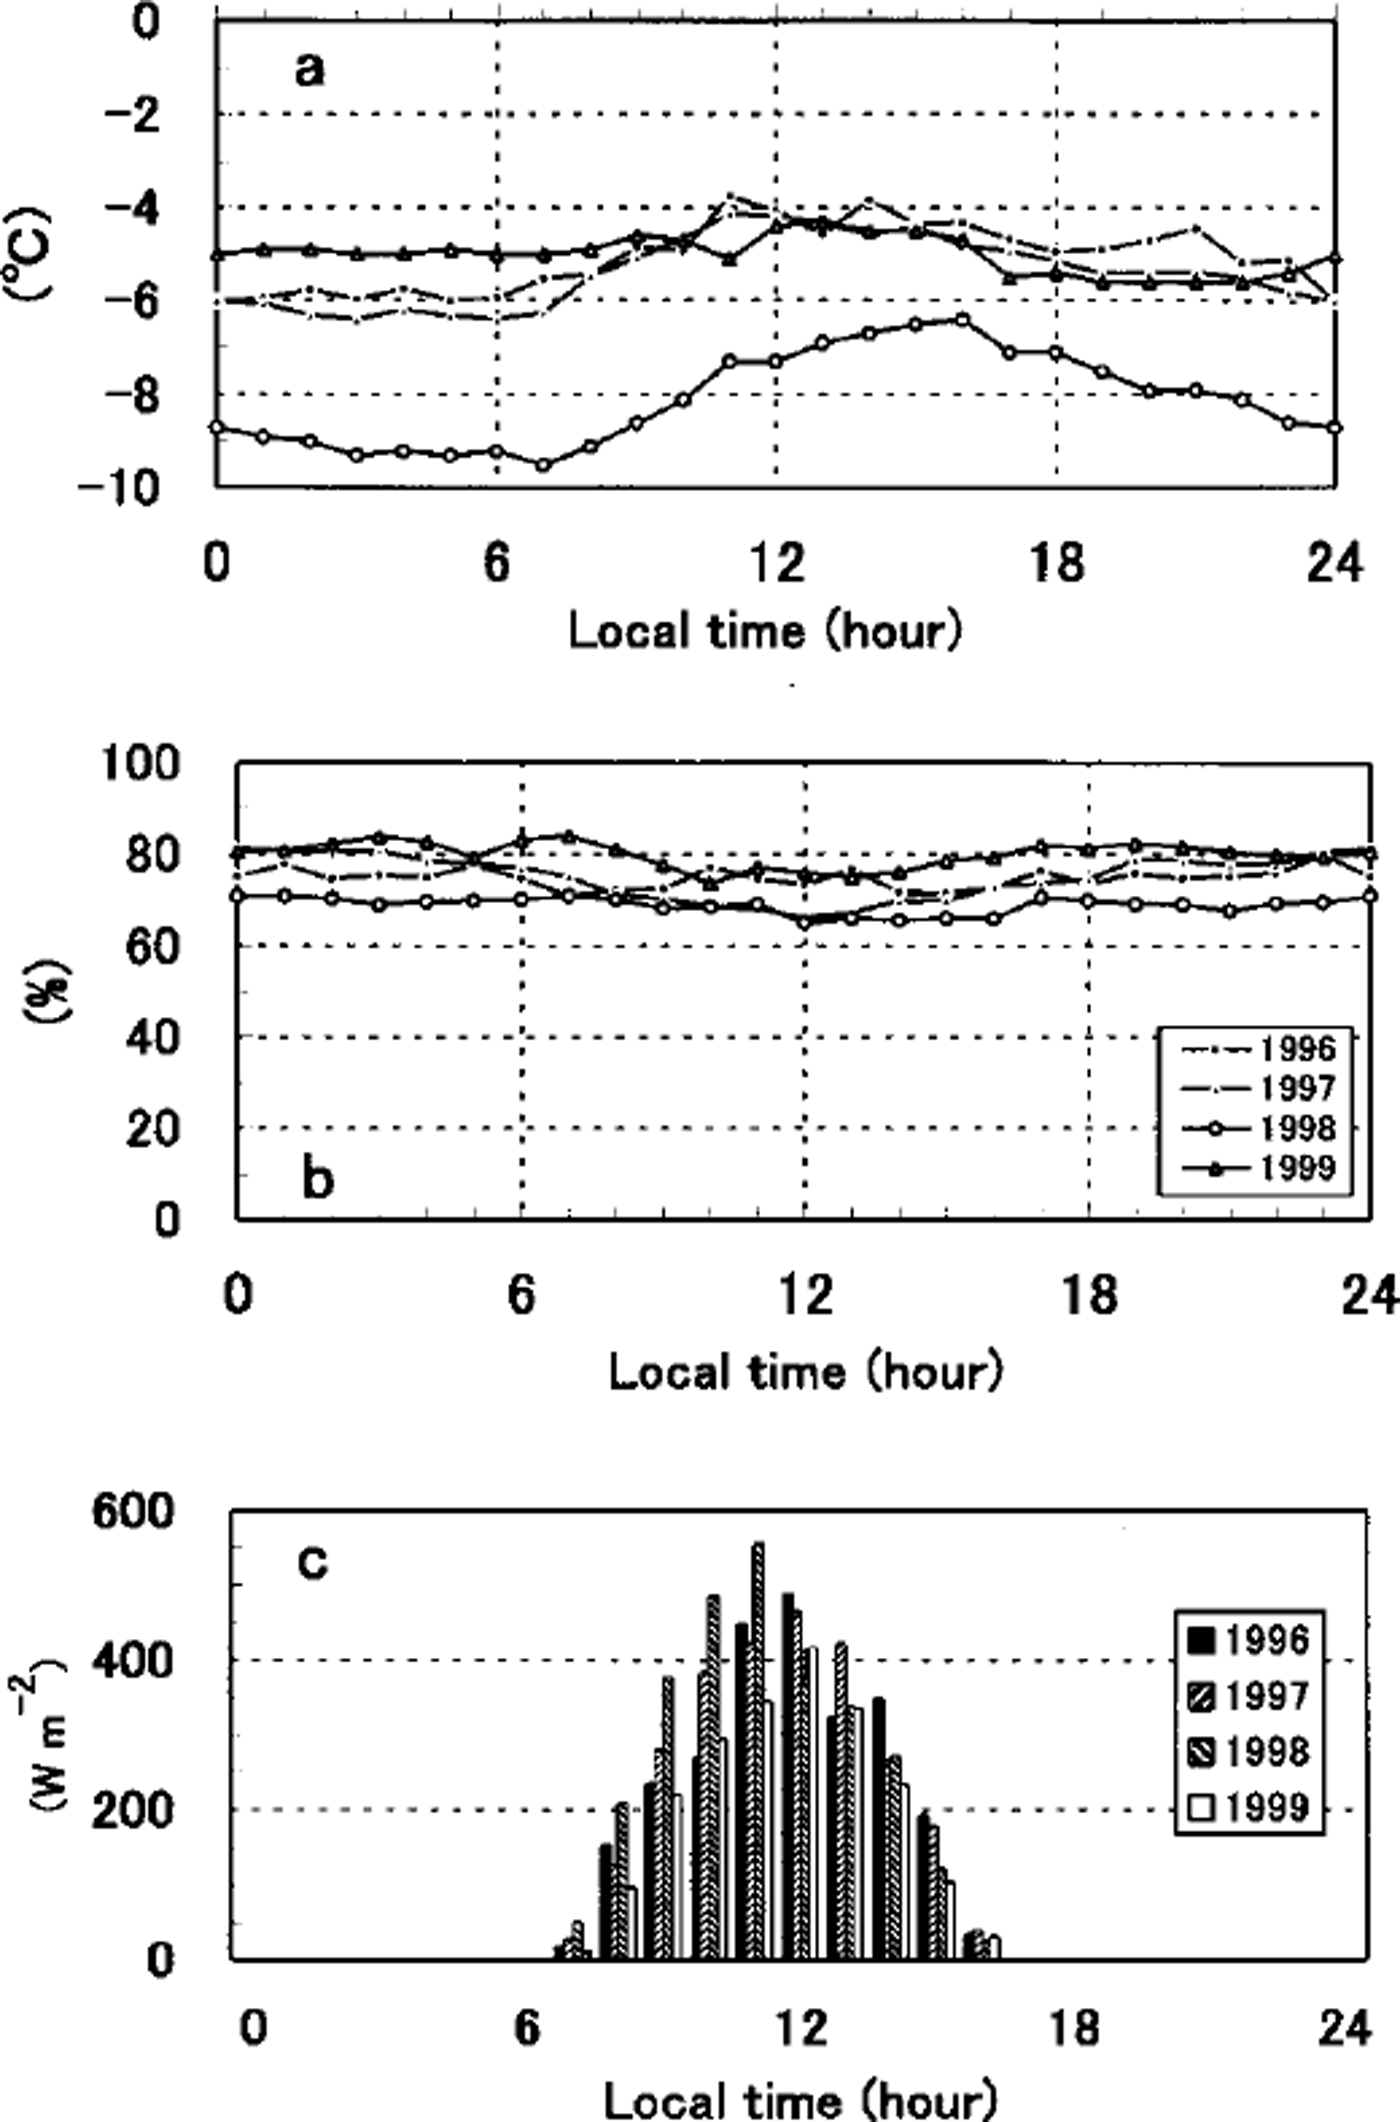
Fig. 3. Hourly averaged meteorological data: (a) air temperature ( b) relative humidity ( c) solar radiation.
Table 1. Daily mean meteorological conditions
Heat budgets are calculated under the following assumptions:
-
(1) Vertical heat transport is predominant.
-
(2) Sensible-heat flux (FSH), latent-heat flux (FLH), net solar radiation (FSW), net longwave radiation (FLW) and conductive heat flux in ice (FCI) are balanced at the surface of the sea ice.
-
(3) Areal ice-thickness distribution is represented by the frequency of observed ice thickness (Fig. 2).
-
(4) Sea ice is covered with snow except for nilas, and the snow depth is 1/5 of the ice thickness.
For assumptions (1) and (2), we follow the method of Reference MaykutMaykut (1978). We consider that assumption (3) is approximately satisfied because our ship did not take a route of thinner ice. In assumption (4), the ratio of snow depth to ice thickness is based on the results of video analysis in 1997, in which snow depth and ice thickness are well correlated and the ratio is about 1/5.
Thermodynamic ice-growth model
When the surface temperature (Ts) is below the freezing point, the heat-balance equation at the surface can be expressed as
Here a flux toward the surface is taken to be positive, and one away from the surface is negative. The sensible-heat flux and the latent-heat flux are calculated using the bulk method. FSH is obtained from ρcpcsu(ta - ts), where Ta is the observed air temperature, p is the air density (1.3 kg m3), cp is the specific heat of the air (1004 J kg−1 K−1), cs is the transfer coefficient for sensible heat, and u is the observed wind speed. FLH is obtained from 0.622ρLvCeu(resa - ess)/p, where Lv is the latent heat of sublimation (2.84 × 10⁶ Jkg−1; Reference YenYen, 1981), ce is the transfer coefficient for latent heat, r is the observed relative humidity, p is the surface pressure and esa and esS are the saturation vapor pressure in the atmosphere and at the surface, respectively. The dependence of es on air temperature is expressed as a fourth-order polynomial developed by Reference MaykutMaykut (1978). cs and ce are both taken to be 1.37 × 10⁻³, after Reference Andreas and MakshtasAndreas and Makshtas (1985), since their observational conditions (air temperature 11 m; wind 21 m above the surface) were similar to ours. For open water and nilas, a somewhat smaller value of 1.0 × KT3 (Reference Aota, Shirasawa and TakatsukaAota and others, 1989) is used because the roughness is much less than that for thicker ice. Since the ice is relatively thin in this region, we assume that the temperature gradient in the ice interior is linear, so that the conductive heat flux (FCI) can be written as γ(TB - Ts), where tb is the temperature at the ice bottom and is taken to be the freezing temperature of sea water and 7 is thermal conductance of the ice-snow slab (= k1k3/(kshi + kihs)) where k and h are the thermal conductivity and thickness, respectively, and subscripts i and s denote ice and snow, respectively.
The absorbed shortwave radiation (FSW) is described as Fr ( 1 - α)(1 - i0), where fr is the solar radiation reaching the ground, a is surface albedo and i0 is the transmittance. The albedo values are estimated from in situ observations (Reference Toyota, Ukita, Ohshima, Wakatsuchi and MuramotoToyota and others, 1999). For open water, nilas (hi = 5 cm) and thick ice (hi ≥ 15 cm), the albedo values are 0.07,0.12 and 0.64, respectively. Since the extinction coefficient of snow is >60m−1 (Reference MellorMellor, 1977), we set i0 = 0 except for nilas. For nilas, i0 = 0.18 is used following Reference Grenfell and MaykutGrenfell and Maykut (1977).
The incident longwave radiation (FLW,) is obtained from FLW1 = 0.7855 (1 + 0.2232C2.75) ![]() where c is the cloud amount (0 ≤ c ≤ 1). This formula was derived from observations with small vapor pressure (<2hPa) in the polar region by Reference Maykut and ChurchMaykut and Church (1973). In our case, this formula seems applicable because our average vapor pressure was about 2 hPa during the cruise. The emitted longwave radiation (FLW2) is
where c is the cloud amount (0 ≤ c ≤ 1). This formula was derived from observations with small vapor pressure (<2hPa) in the polar region by Reference Maykut and ChurchMaykut and Church (1973). In our case, this formula seems applicable because our average vapor pressure was about 2 hPa during the cruise. The emitted longwave radiation (FLW2) is ![]() . Emissivity ε is taken to be 0.97 for open water and nilas (hi = 5 cm) and 0.99 for thicker ice.
. Emissivity ε is taken to be 0.97 for open water and nilas (hi = 5 cm) and 0.99 for thicker ice.
After substituting the observed values, ts is solved using Equation (1) and the Newton-Raphson method. The individual fluxes are then calculated by substituting the obtained Ts. For open water, ts is taken to be the freezing temperature, and the residual term (FQ= FSH + FLH + FSW + FLW + FCI) is calculated. If FQ is negative, FQ is used for ice formation.
The heat-balance equation at the bottom of the ice is expressed as:
where pi is the ice density (900 kg m−3), lt is the latent heat of fusion and fw is the ocean heat flux. lf is taken to be 2.45 × 10s J kg"1 for open water, 2.67 × 10⁵ J kg"1 for nilas and 3.02 × 10⁵ J kg"1 for thicker ice, on the basis of bulk salinity data of ice samples and the Reference YenYen (1981) formula. If we set fw to be zero, the growth rate is calculated as FCI/ρiLf from Equation (2). For open water, the ice-growth rate is calculated as −FQ/ΦiLf. The heat fluxes and ice-growth rate of the total area are obtained by summing up the area-weighted values of individual ice thicknesses.
Results and Discussion
We examine the heat budget over the entire ice area in this region. From the hourly averaged meteorological data obtained in the previous section, we calculate the heat budget on the ice surface at each hour and examine the diurnal features. We did not take the ice-thickness change into account here because the treatment of the surface melting process is not easy and the purpose here is to examine the effect of the meteorological diurnal cycle on the heat budget. Here the heat budget at each hour is calculated with the same ice conditions. When the surface temperature (Ts) is calculated as more than the melting point (0°C), 0°C is substituted for Ts, and the residual heat flux FQ (= FSH + FLH + FCI + FSW + FLW) is calculated. FQwill be used to melt ice or snow.
Since the results are similar among the four years studied, we show here the average results of all four years (Fig. 4). Figure 4a shows that FQ and FCI are significantly negative and positive, respectively, which means that sea ice grows significantly at night-time. These fluxes are balanced by emitted longwave radiation. The average ice-growth rate is estimated as 2.2 cm d−1 (2.4,1.4, 3.1 and 1.9 cm d−1 for years 1996−99, respectively). Figure 4b shows that the solar radiation is predominant and causes surface melting in the daytime ( FQ ≥ 0). When averaged over 1 day, the effect of solar radiation remains prominent (see Fig. 4c), so that ice-growth rate is small (1.4 cm d−1 on average).
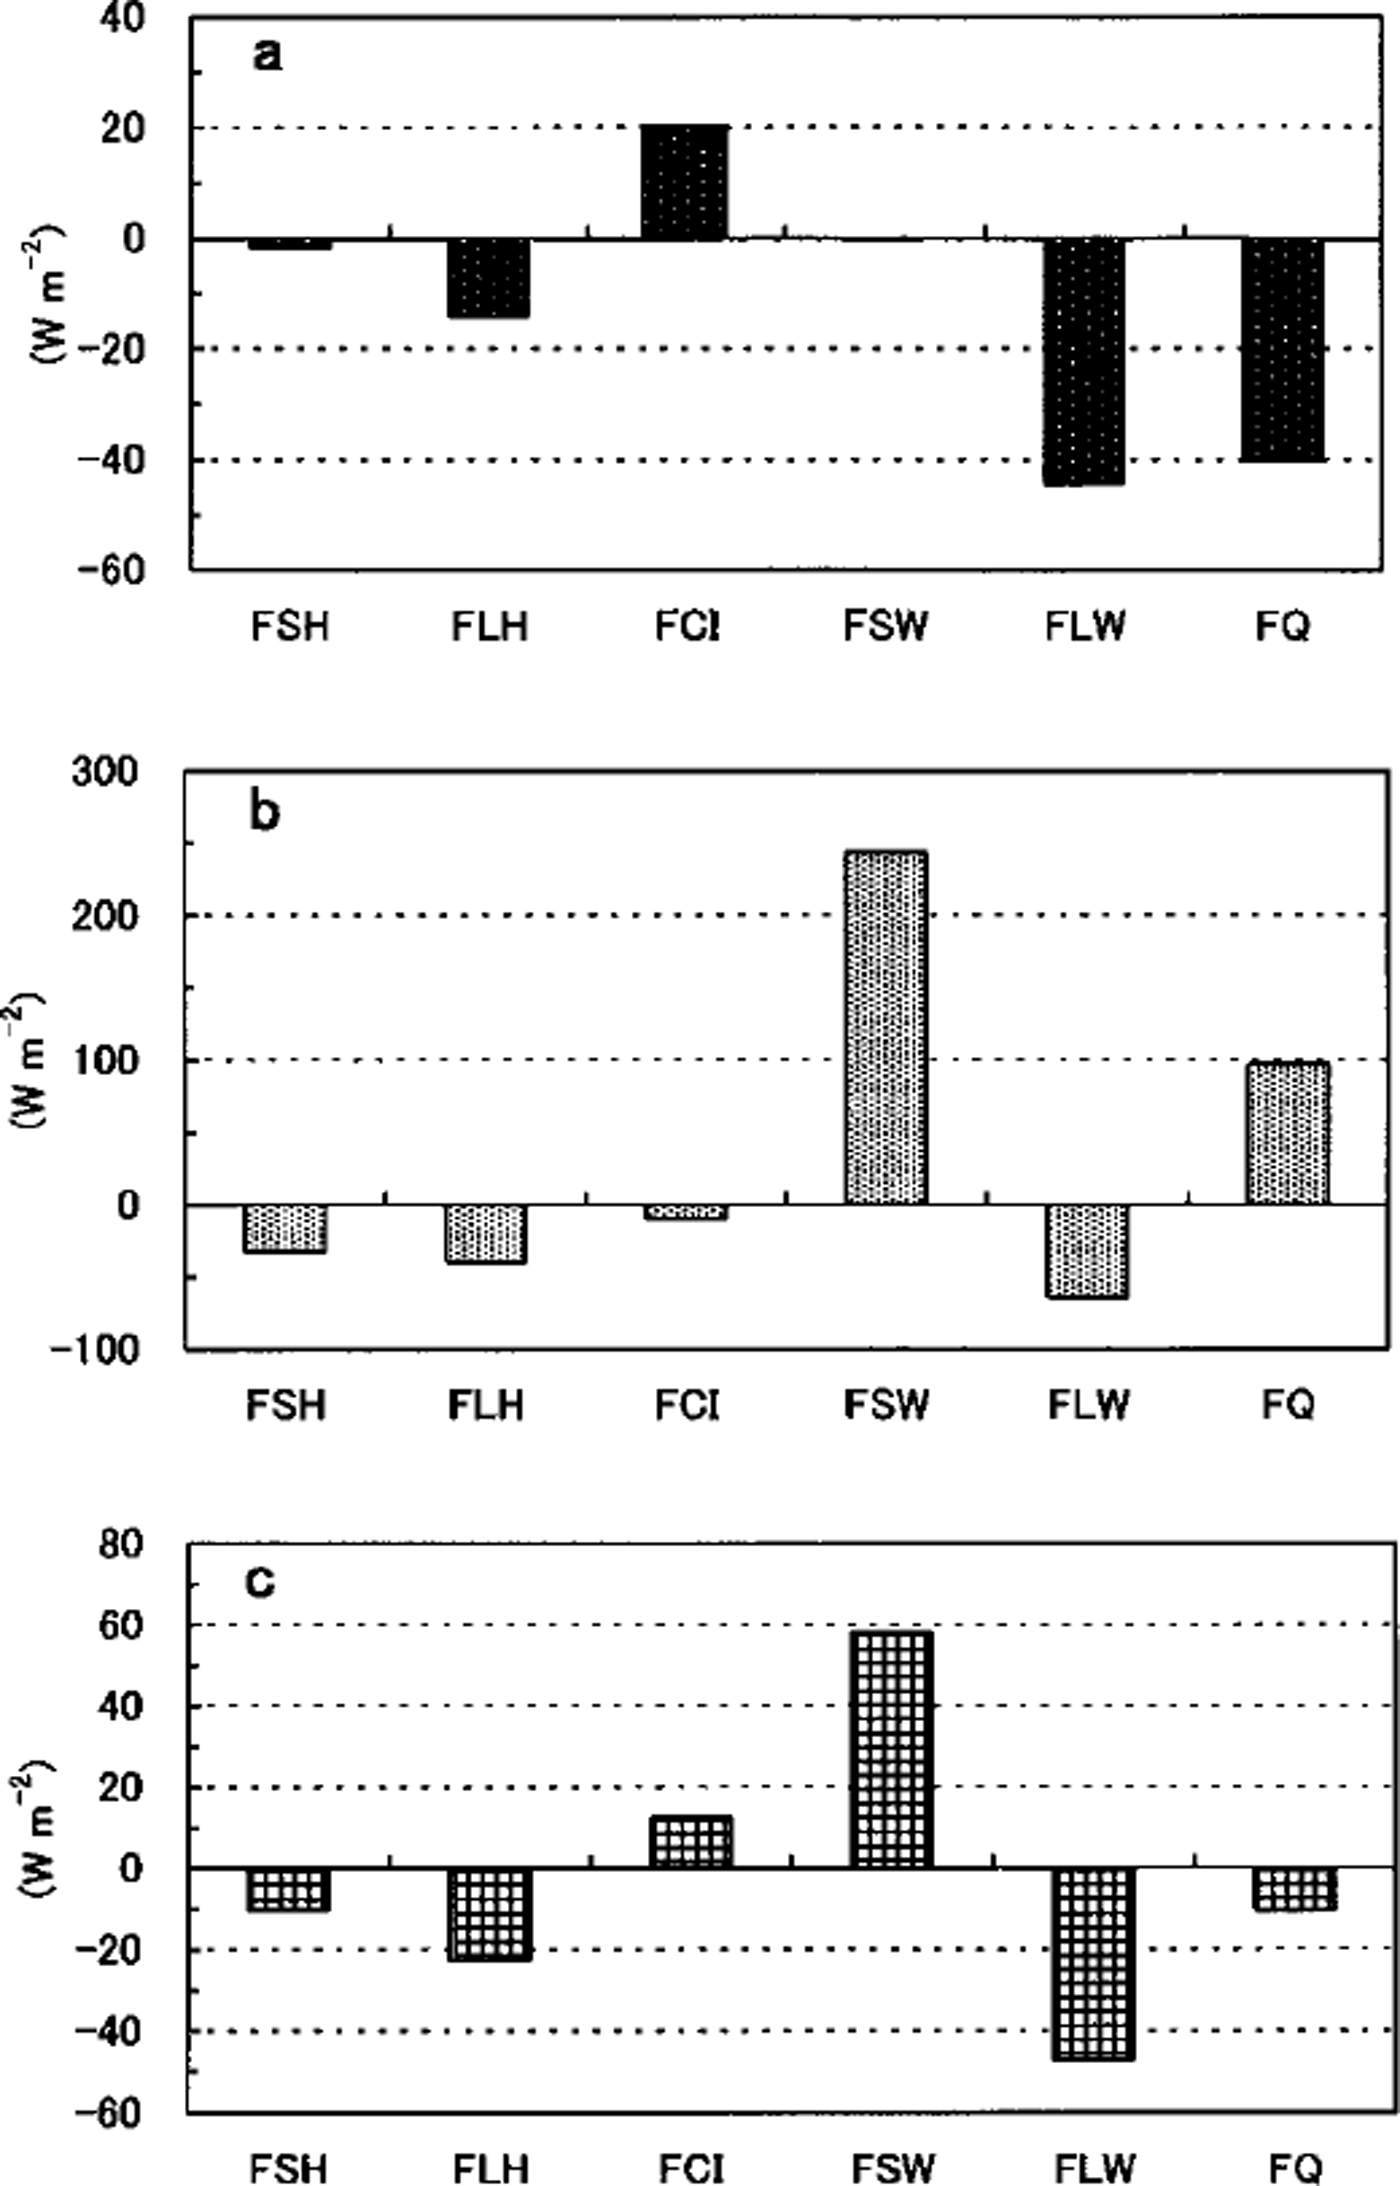
Fig. 4. Four-year averaged diurnal change of heat budget over the entire sea-ice area, calculated from hourly data: (a) at midnight (0 hour), (b) at daytime (noon), (c) daily mean. fsh, flh, fci, fsw, flw and fq denote the fluxes of sensible heat, latent heat, conductive heat in ice, solar radiation, longwave radiation and residual, respectively.
This result differs from that over thin ice area in the polar region (Reference MaykutMaykut, 1978), where the sensible-heat flux dominates the heat exchange with the atmosphere in the winter, and seems to be one of the features of winter sea ice at low latitudes. The estimated turbulent heat flux (30.5, 16.8, 51.6 and 32.6 Wm−2 for years 1996−99, respectively) is nearly the same as that estimated in the Antarctic pack-ice region at the beginning of the melt season (0 ∼ 60 W m−2; Reference Andreas and MakshtasAndreas and Makshtas, 1985). However, the estimated value is much smaller than over winter leads in the polar regions (e.g. 120 Wm"2 (Reference Allison, Tivendale, Akerman, Tann and WillsAllison and others, 1982), 130 W m−2 (Reference Ruffieux, Persson, Fairall and WolfeRuffieux and others, 1995)). Thus the heat exchange over thin ice is not as large as in the winter polar regions because of the relatively warm air temperature. The contribution of conductive-heat flux is also small, so that the ice-growth rate is limited to 1.41, 0.59, 2.04 and 1.45 cm d−1 for years 1996−99, respectively; thus, the averaged ice-growth rate is limited and thermodynamic growth is small in this region.
Note that the average turbulent flux in the total area is upward, whereas it is downward in the polar region where thick ice predominates (Reference MaykutMaykut, 1982). This implies that sea ice in this region works as a heat source for the atmosphere rather than a heat sink. Figure 5 shows that the turbulent flux decreases significantly with ice thickness, especially at < 30 cm thickness. This decrease is attributed mostly to the large change in the sensible flux. With the increase of ice thickness, the surface temperature becomes less influenced by the underlying water temperature. Thus the surface temperature approaches the air temperature, and the upward sensible-heat flux decreases. Finally, the sensible-heat flux becomes downward as in the polar region. In the southern Sea of Okhotsk, however, since relatively thin-ice area predominates, the total sensible-heat flux becomes upward (see Fig. 4c). From Figure 6, more than half of the total upward turbulent heat flux (32.9 Wm−2) is owed to open-water and nilas area (24.4 W m−2). Thus open-water and thin-ice area characterize the heat budgets in this region. Figure 5 also shows that without sea ice the turbulent heat flux would increase to 64.2 Wm"2 (refer to open-water area) if the air temperature remains unchanged. These values are twice the area-weighted values, which implies that the turbulent heat flux is reduced by half due to the sea ice.

Fig. 5. Four-year averaged turbulent heat flux (fsh + flh) as a function of ice thickness (non-area-weighted). positive means downward.
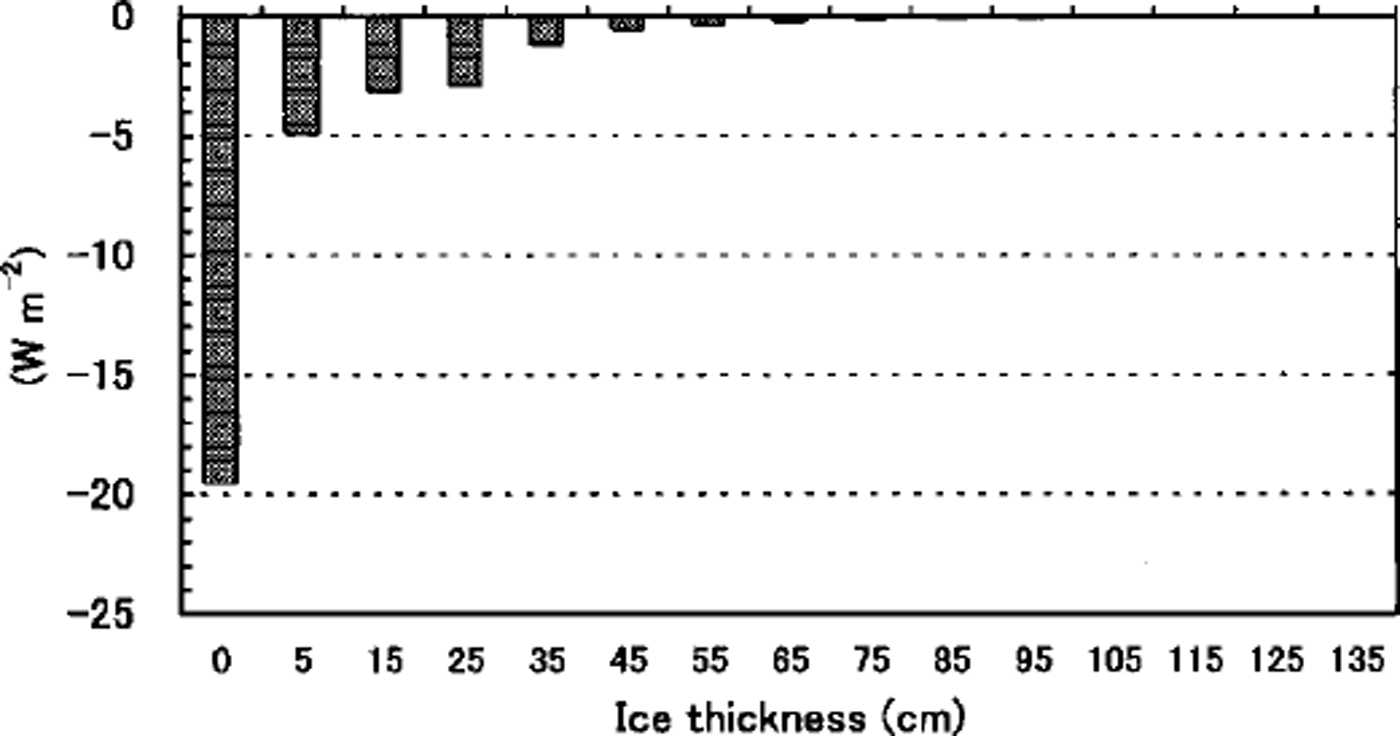
Fig. 6. Four-year averaged turbulent heat flux (area-weighted).
Comparison with the northern Sea of Okhotsk
In order to figure out the heat-budget characteristics in this region, we calculate the heat budget during ice-growing periods in the northern Sea of Okhotsk, using one season of ECMWF twice-daily gridded data for December 1996−March 1997. We assume that when ice edge reaches each gridpoint judging from daily images from the Special Sensor Microwave/Imager, sea-surface temperature becomes the freezing point and sea ice begins to grow. Ice growth at each point is calculated thermodynamically on the basis of the obtained heat budget. The method of calculation is the same as the above, but in this case the model is for a single ice class and does not include an ice-thickness distribution with open-water and thin-ice fractions. The daily averaged air temperature, wind speed and dew-point temperature are used. The cloud amount is assumed to be 0.7. As for daily solar radiation (Qs), the formula developed by Reference KimKim (1992) for the ocean adjacent to Japan is applied here with modification for snow and ice.
Since the obtained ice thickness at the end of March is almost 1 m in the northern coastal area and this value closely matches the coastal observation (Reference Tabata, Noguchi and SaitoTabata and others, 1980), our calculation should be a good approximation. Figure 7a shows the ice-thickness growth at points A-C marked in Figure 7b. It is shown from Figure 7a that at each point rapid ice growth occurs for about 30 days after sea ice begins to grow. Therefore, we regard these 30 days as ice-growth period and calculated the averaged heat budget. We then compared the result in the southern region (point C) with that of the northern Sea of Okhotsk (points A and B). Figure 8 shows that ice-growth rate (FCI) decreases by half from A to C and that this decrease is compensated mainly by the increase of solar radiation. The other fluxes do not change much. Hence, abundant solar radiation plays a significant role in the heat budget in the southern Sea of Okhotsk, whereas outgoing longwave radiation is much more significant in the northern Sea of Okhotsk.
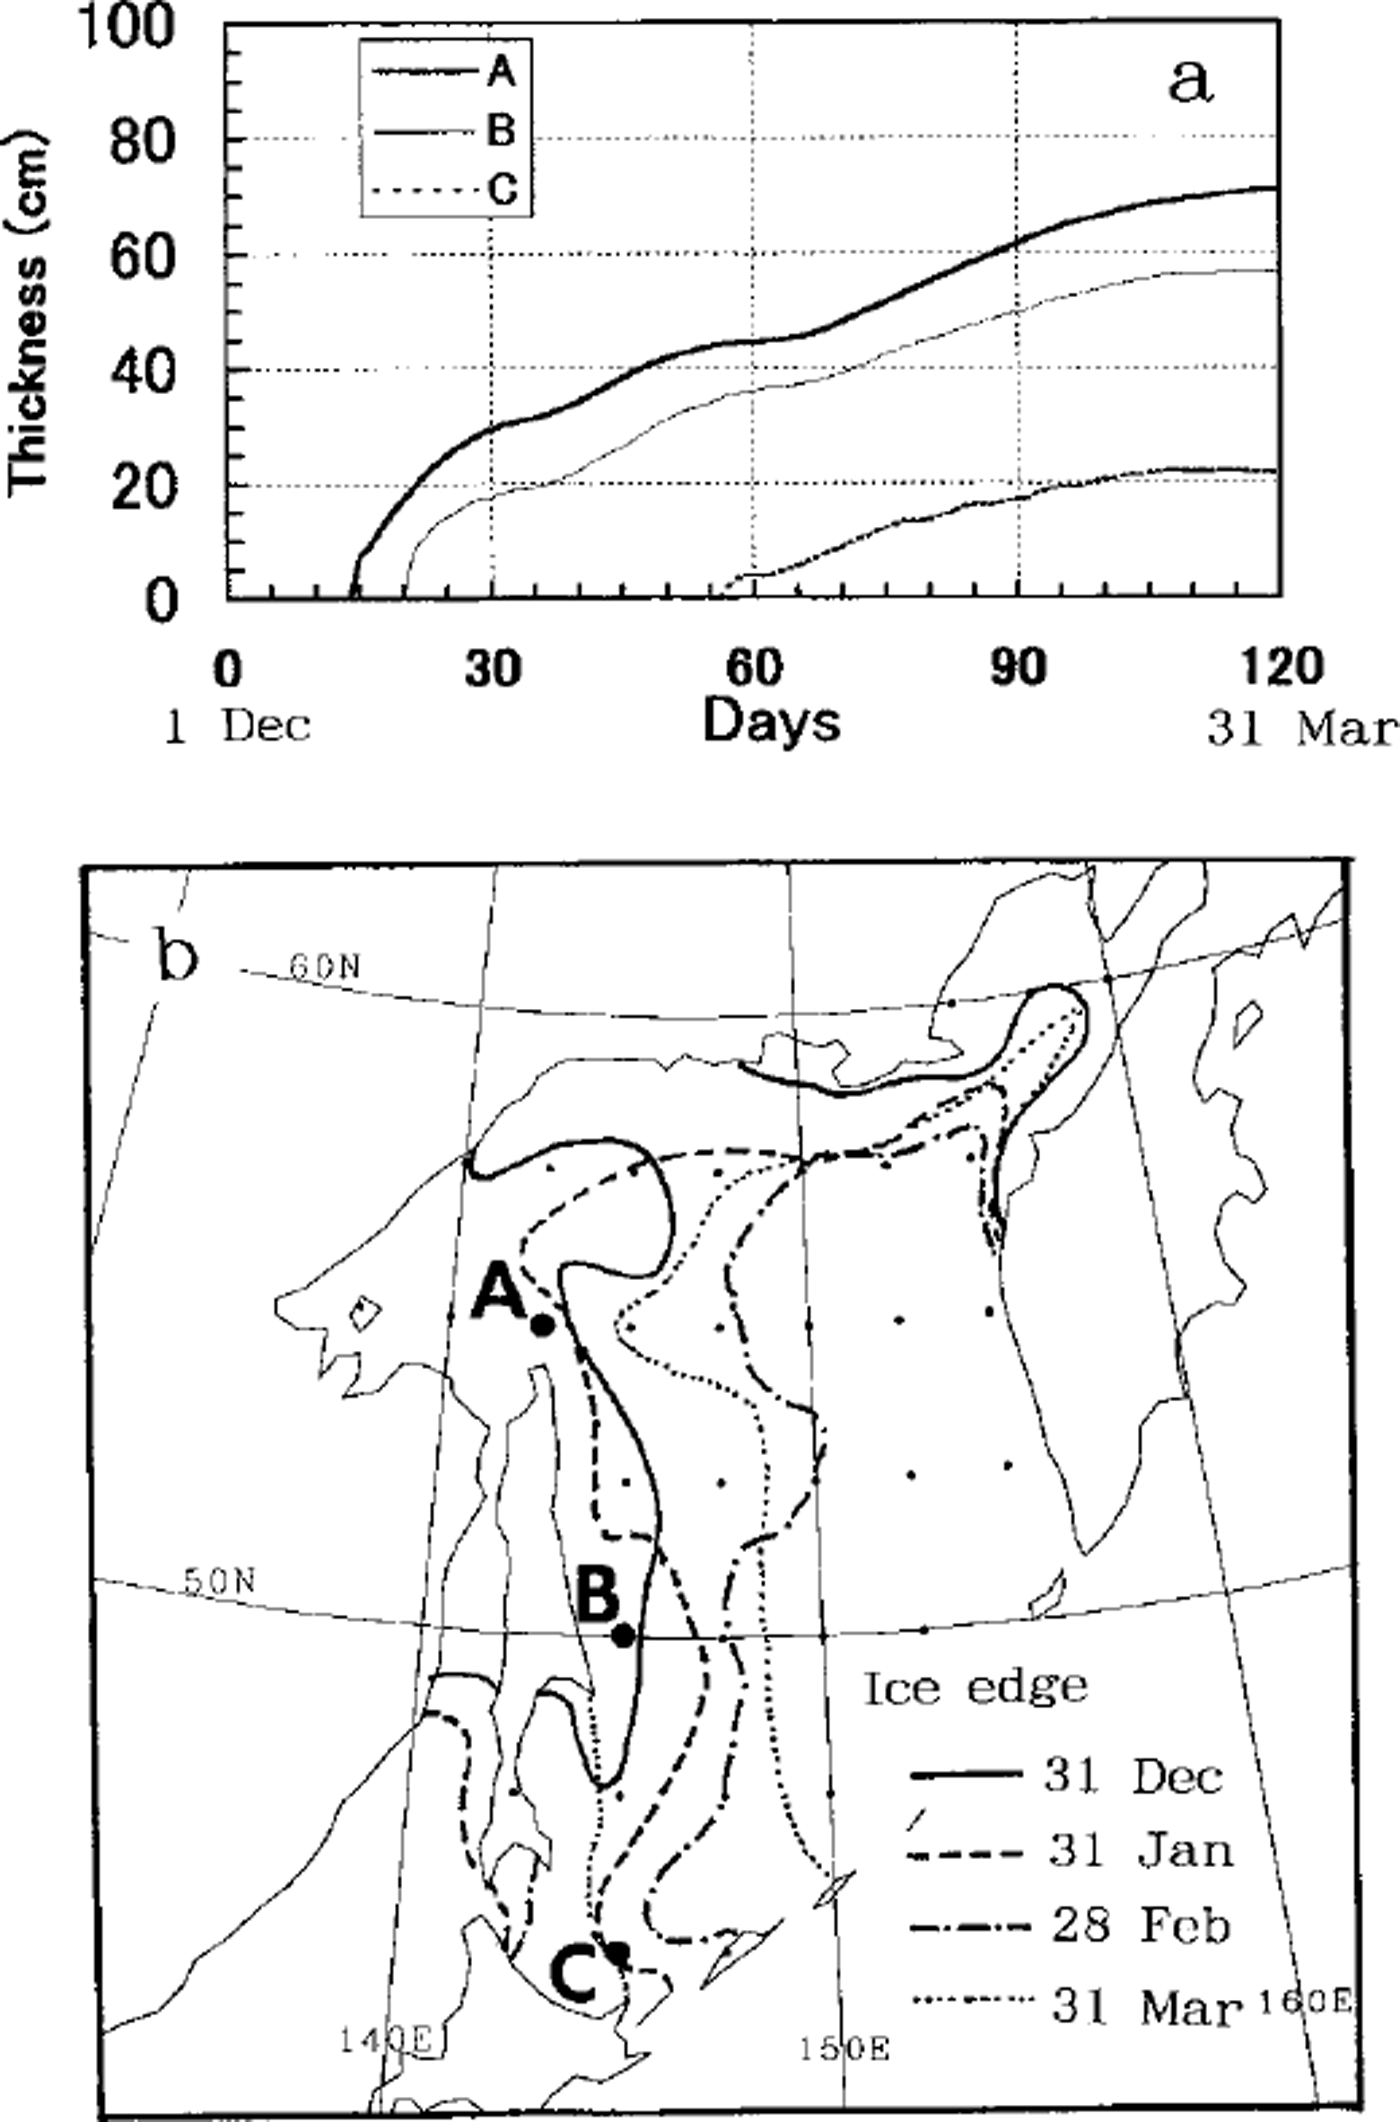
Fig. 7. Ice growth estimated from one season of ecmwf data. (a) ice-thickness change at points a-q december 1996-march 1997. (b) geographical map of the points with ice edges.
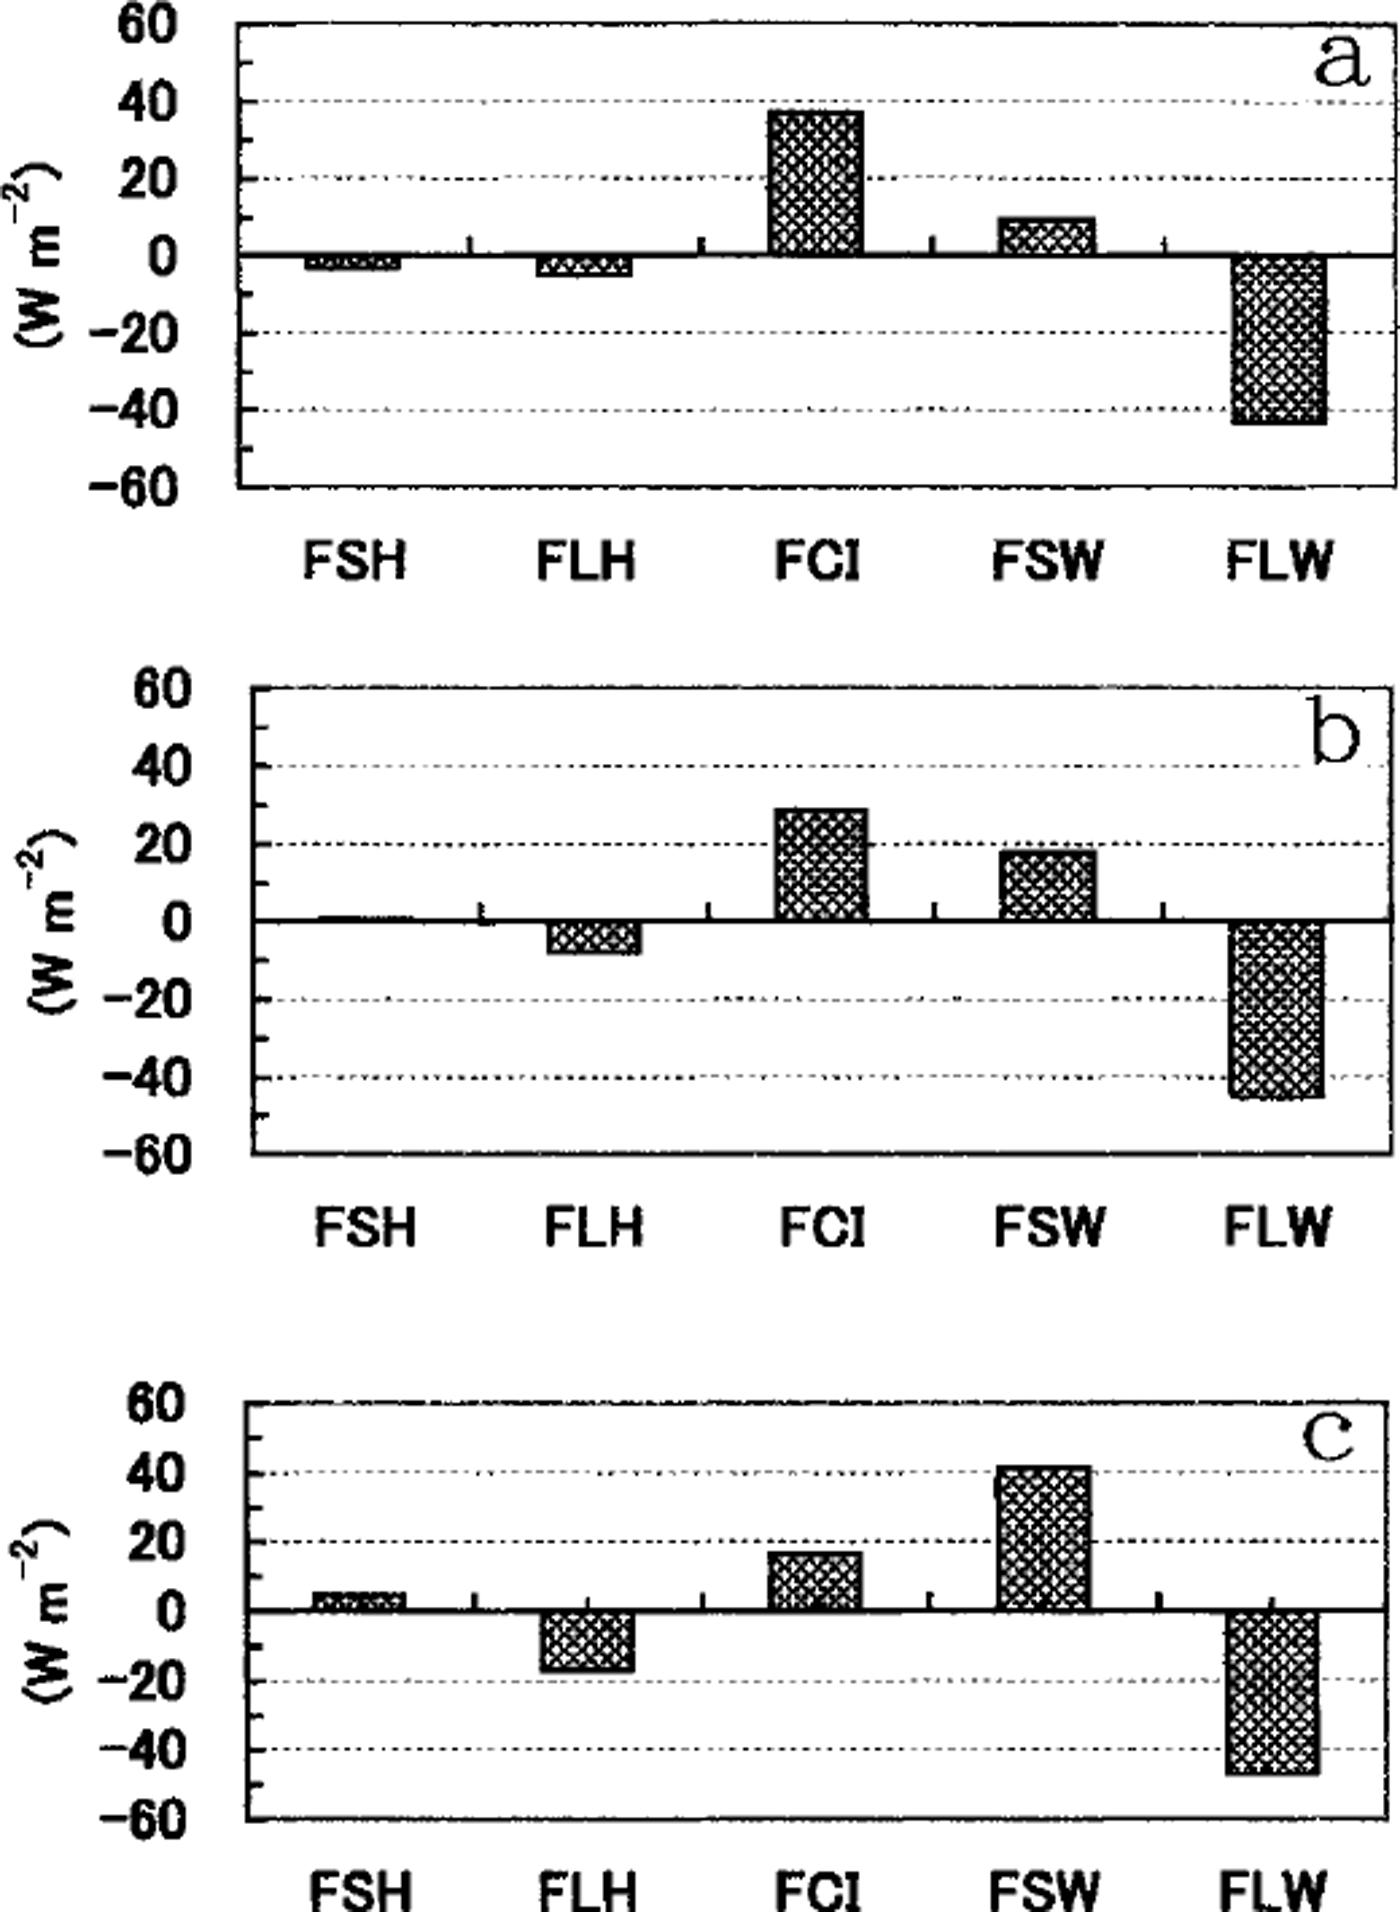
Fig. 8. Averaged heat budget during the initial 30 days from the start of ice growth at points a-c in figure 7.
To examine how much solar radiation affects ice growth, we conducted a sensitivity study of sea-ice albedo in the whole Sea of Okhotsk. We calculated the ice-thickness growth with albedo values of 0.55 and 0.75, and examined the resulting difference of ice thicknesses at the end of March. The calculated ice thickness is 20−30 cm in the southern Sea of Okhotsk and 60−90 cm in the northern part. The difference of thickness is estimated as 6−8 cm in the southern part and 2−3 cm in the northern part. This result shows that the increase of sea-ice albedo by 0.2 caused the ice thickness to decrease by about 25% in the southern region, but only by a few per cent in the northern region.
Conclusion
To examine the thermodynamic^ characteristics of sea-ice area in the southern Sea of Okhotsk, we estimated the heat budget using a one-dimensional, thermodynamical model on the basis of our ice and meteorological observations. Based on a limited amount of data, totaling 27 days of observations, our investigations show the following characteristics in this region: (1) Due to relatively thin ice thickness, turbulent heat flux is upward, showing that the sea-ice region provides turbulent heat to the atmosphere. (2) Thin-ice and open-water area contribute significantly to the total turbulent heat flux. (3) Melting occurs in daytime, while sea ice grows at night at the rate of 2 cm d−1. Hence, thermodynamical ice growth is limited to about 1 cm d−1 on average. (4) The heat budget in the southern region is largely characterized by abundant solar radiation compared with that of the northern region. The first, third and fourth results are characteristics in this region located at a relatively low latitude, while the second one is generally observed for polar regions. The fourth result is further verified by a sensitivity experiment of the sea-ice albedo. An increase of sea-ice albedo by 0.2 caused the ice thickness to decrease by about 25% in the southern region, but only by a few per cent in the northern region.
Acknowledgements
We are sincerely grateful to the crew of P/V soya of Japan Coast Guard and colleagues of the Institute of Low Temperature Science for their kind cooperation throughout the cruise. Special thanks are given to K. Ohshima for support with both observation and analysis. We are also indebted to N. Iwasaka of Tokyo University of Mercantile Marine for the pyranometers and to H. Shimoda of Ship Research Institute for the technical support for video monitoring. Useful discussions withY. Fukamachi,T Kawamura, J. Ukita, M. Ikeda, T Yamanouchi and K. Takeuchi are also acknowledged. The proofreading by H. H. Shen was also helpful. The comments by reviewers were useful to the improvement of this paper. This work was partially supported by a fund from Core Research for Evolutional Science and Technology, Japanese Science and Technology Corporation.


