1. Introduction
Over the past few years, there has been growing interest in the extraction of paleoclimatic information from chemical profiles measured in high-altitude ice cores (e.g. Reference KoernerKoerner, 1997; Reference Grumet, Wake, Zielinski, Fisher, Koerner and JacobsGrumet and others, 1998). Such valuable ice-core records are, however, usually affected by occasional to moderate melt, which limits their reliability as a means of paleoclimatic reconstruction. More attention should therefore be paid to formation processes of ice-core chemical records from mountainous areas before they can be confidently interpreted as a climatic indicator.
In May and June 1997, a 40.9 m ice core was recovered from a site at 6500 m a.s.l. on the north branch of Far East Rongbuk (FER) Glacier, approximately 13 km north of the peak of Qomolangma (Mount Everest), Himalaya (Fig. 1). Based on field observations of the widely spread dry-stream tracks (the largest snowmelting channel on the surface of the glacier can be several meters wide and >1 m deep) and the stratigraphic features of the several snow pits around the FER drilling site, we speculate that the FER core records may be modified by meltwater percolation. In August 1998, another 80.4 m ice core was recovered from a site at 6500 m a.s.l. on East Rongbuk (ER) Glacier, <5 km north of Qomolangma peak (Fig. 1). The thickness of the firn layer is >20 m, and few distinct percolation-ice layers can be identified, implying that little, if any, snowmelt occurs at the ER core drilling site. The stratigraphic features therefore suggest that this drilling site may be located in the cold-percolation or recrystallization zone. In considering potential for post-depositional changes, this makes the ER core a suitable reference in comparisons between the isotopic and ionic profiles of the ER and FER cores.

Fig. 1. Location map of ice-core drilling sites.
Sampling and analysis processes for the cores are available elsewhere (Hou and others, 1999b; Qin and other, 2002). Both cores were dated by reference layers of the /3-activity peaks, and seasonal variations in the isotopic and major-ionic (Ca2+, Na+ and NH4 +) profiles (Fig. 2). In addition, a slight adjustment was made to the FER core dating (Hou and others, 1999b), following a comparison of the chemical concentration peaks of the two cores. Since the same chronological scale is necessary for better comparison of the ice-core records, we confine the time series of the two ice-core records to the periods 1954-96 for the FER core and 1954-97 for the ER core, as determined by the older β-activity peak. The average sampling resolutions are over 5 and 12 samples a 1 for the above sections of the FER and ER cores, respectively.

Fig. 2. Ice-core dating. The dashed lines indicate the beginning of each annual layer, and the double β-activity peaks correspond to the 1954 and 1963 reference annual layers, respectively.
2. δ18O
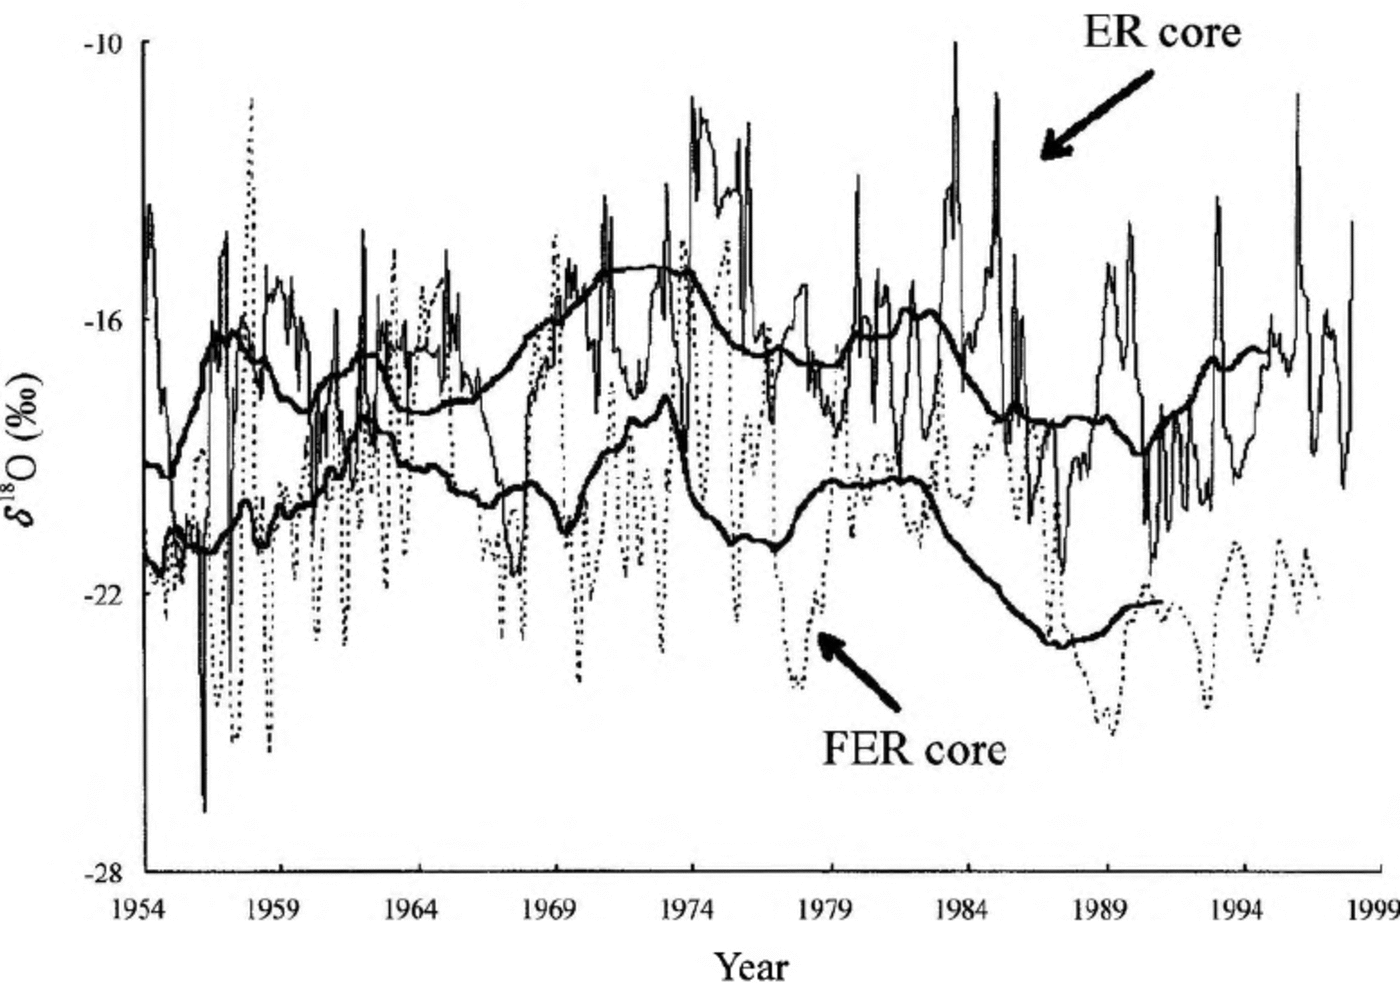
The δ18O profiles of the ER and FER cores are shown in Figure 3. The variation of the two δ18O profiles is basically similar, especially for the corresponding ridges and troughs of the smoothed lines. For the period 1954-96, the average δ18O values of the FER and ER cores are -20.30%o and 17.18%o, respectively, i.e. different by 3.12%o. The fluctuation amplitudes of the two δ18O series are similar during the period 1954-86, but that of the FER δ18O record decreases rapidly after 1987. Moreover, the δ18O gap between the FER and ER cores reaches 4.93%o during the period 1987-96. Since similar processing and analysis procedures are adopted for both cores, the apparent discrepancy is unlikely to be caused by artificial factors.

Fig. 3. The δ18O profiles of the ER core (thin solid line) and FER core (dashed line). The bold lines stand for the 46-point smoothing result for the ER core and the 20-point smoothing result for the FER core, respectively. Both smoothing results are approximately equal to 4a moving averages. The smoothed FER record does not cover the years 1989-94 due to the smoothing method used.
In western China, δ18O in precipitation is mainly controlled by different vapor sources, different transport patterns of vapor in the atmosphere, average “rain-out history” of the air mass, and different temperature structures which control the condensation temperature (Yao and others, 1996; FIou and others, 1999a). In tropical regions (including the central Himalaya), monsoon precipitation has more negative δ18O values than precipitation during the other seasons, indicating the amount effect (Kang and others, 1999). Since the two drilling sites are located close together and at the same altitude (6500 m a.s.l.), the above-mentioned factors do not explain the remarkable discrepancy between the two δ18O series of the FER and ER cores. We suggest that this discrepancy may be caused by post-depositional processes, especially the heavy snowmelting that can severely homogenize the original δ18O oscillations of the FER core (Hou and others, 1999a). However, the FER core would be expected to show higher δ18O values than the ER core due to intensive ablation of the summer snow layer, with low δ18O values (amount effect) (Kang and others, 1999) at the FER drilling site, which is undoubtedly contrary to the real δ18O measurements of the two cores. Therefore, modification by meltwater percolation processes alone does not explain the dUiO discrepancy between the two cores.
The uneven seasonal distribution of precipitation can also affect the annual δ18O values of the ice cores. For instance, higher mean annual δ18O values for the ER core might appear if more winter precipitation (i.e. high dl80 values) was accumulated at the ER drilling site than at the FER site. Moreover, surface snow redistribution or blowing-away by wind can also influence the final SmO values of the ice cores. Year-round field observation at the ice-core drilling sites is planned in order to determine the factors controlling the ice-core δ18O records, as well as to establish the relationship between the various ice- core records and atmospheric parameters.
3. Major Ions
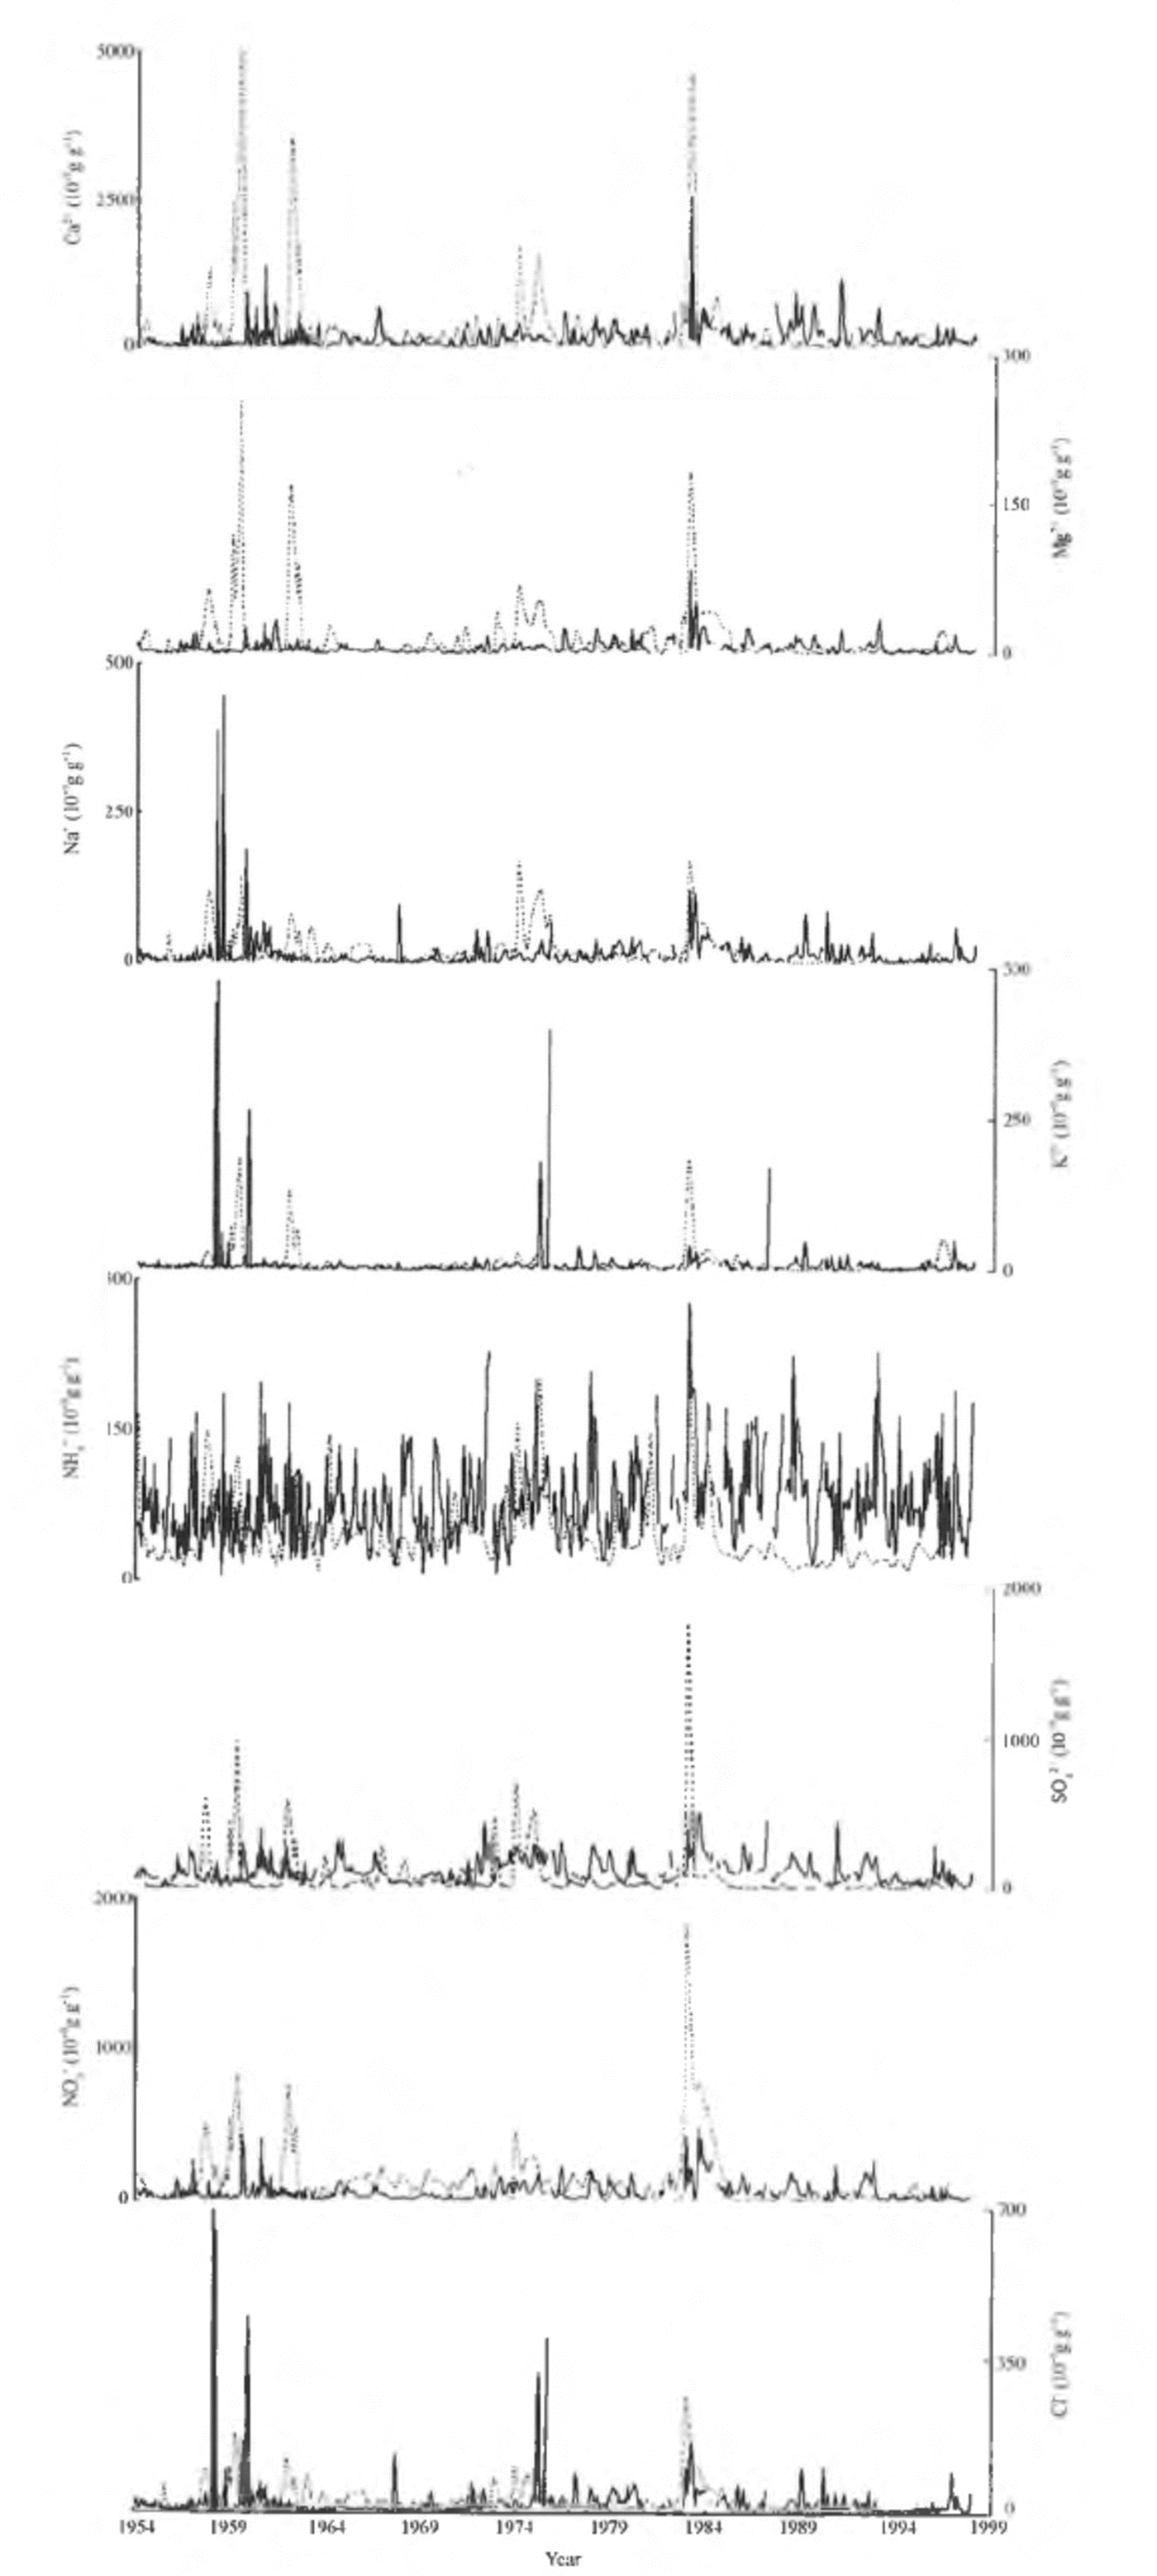
The major-ionic profiles of the ER and FER cores are shown in Figure 4. Considerable differences between corresponding ionic profiles of the two cores are apparent. The concentrations of Ca2+, Mg2+, SO4 2- and NO3 - for the FER core are higher than for the ER core before 1985, but much lower since then. Differences can also be observed for the Cl- , Na+ and K+ profiles. NH4 + concentrations are significantly lower for the FER core than for the ER core; the mean NH4 + concentration of the FER core since 1985 is only one-quarter of that of the ER core.

Fig. 4. The ionic profiles of the ER core (solid lines) and the FER core (dashed lines).
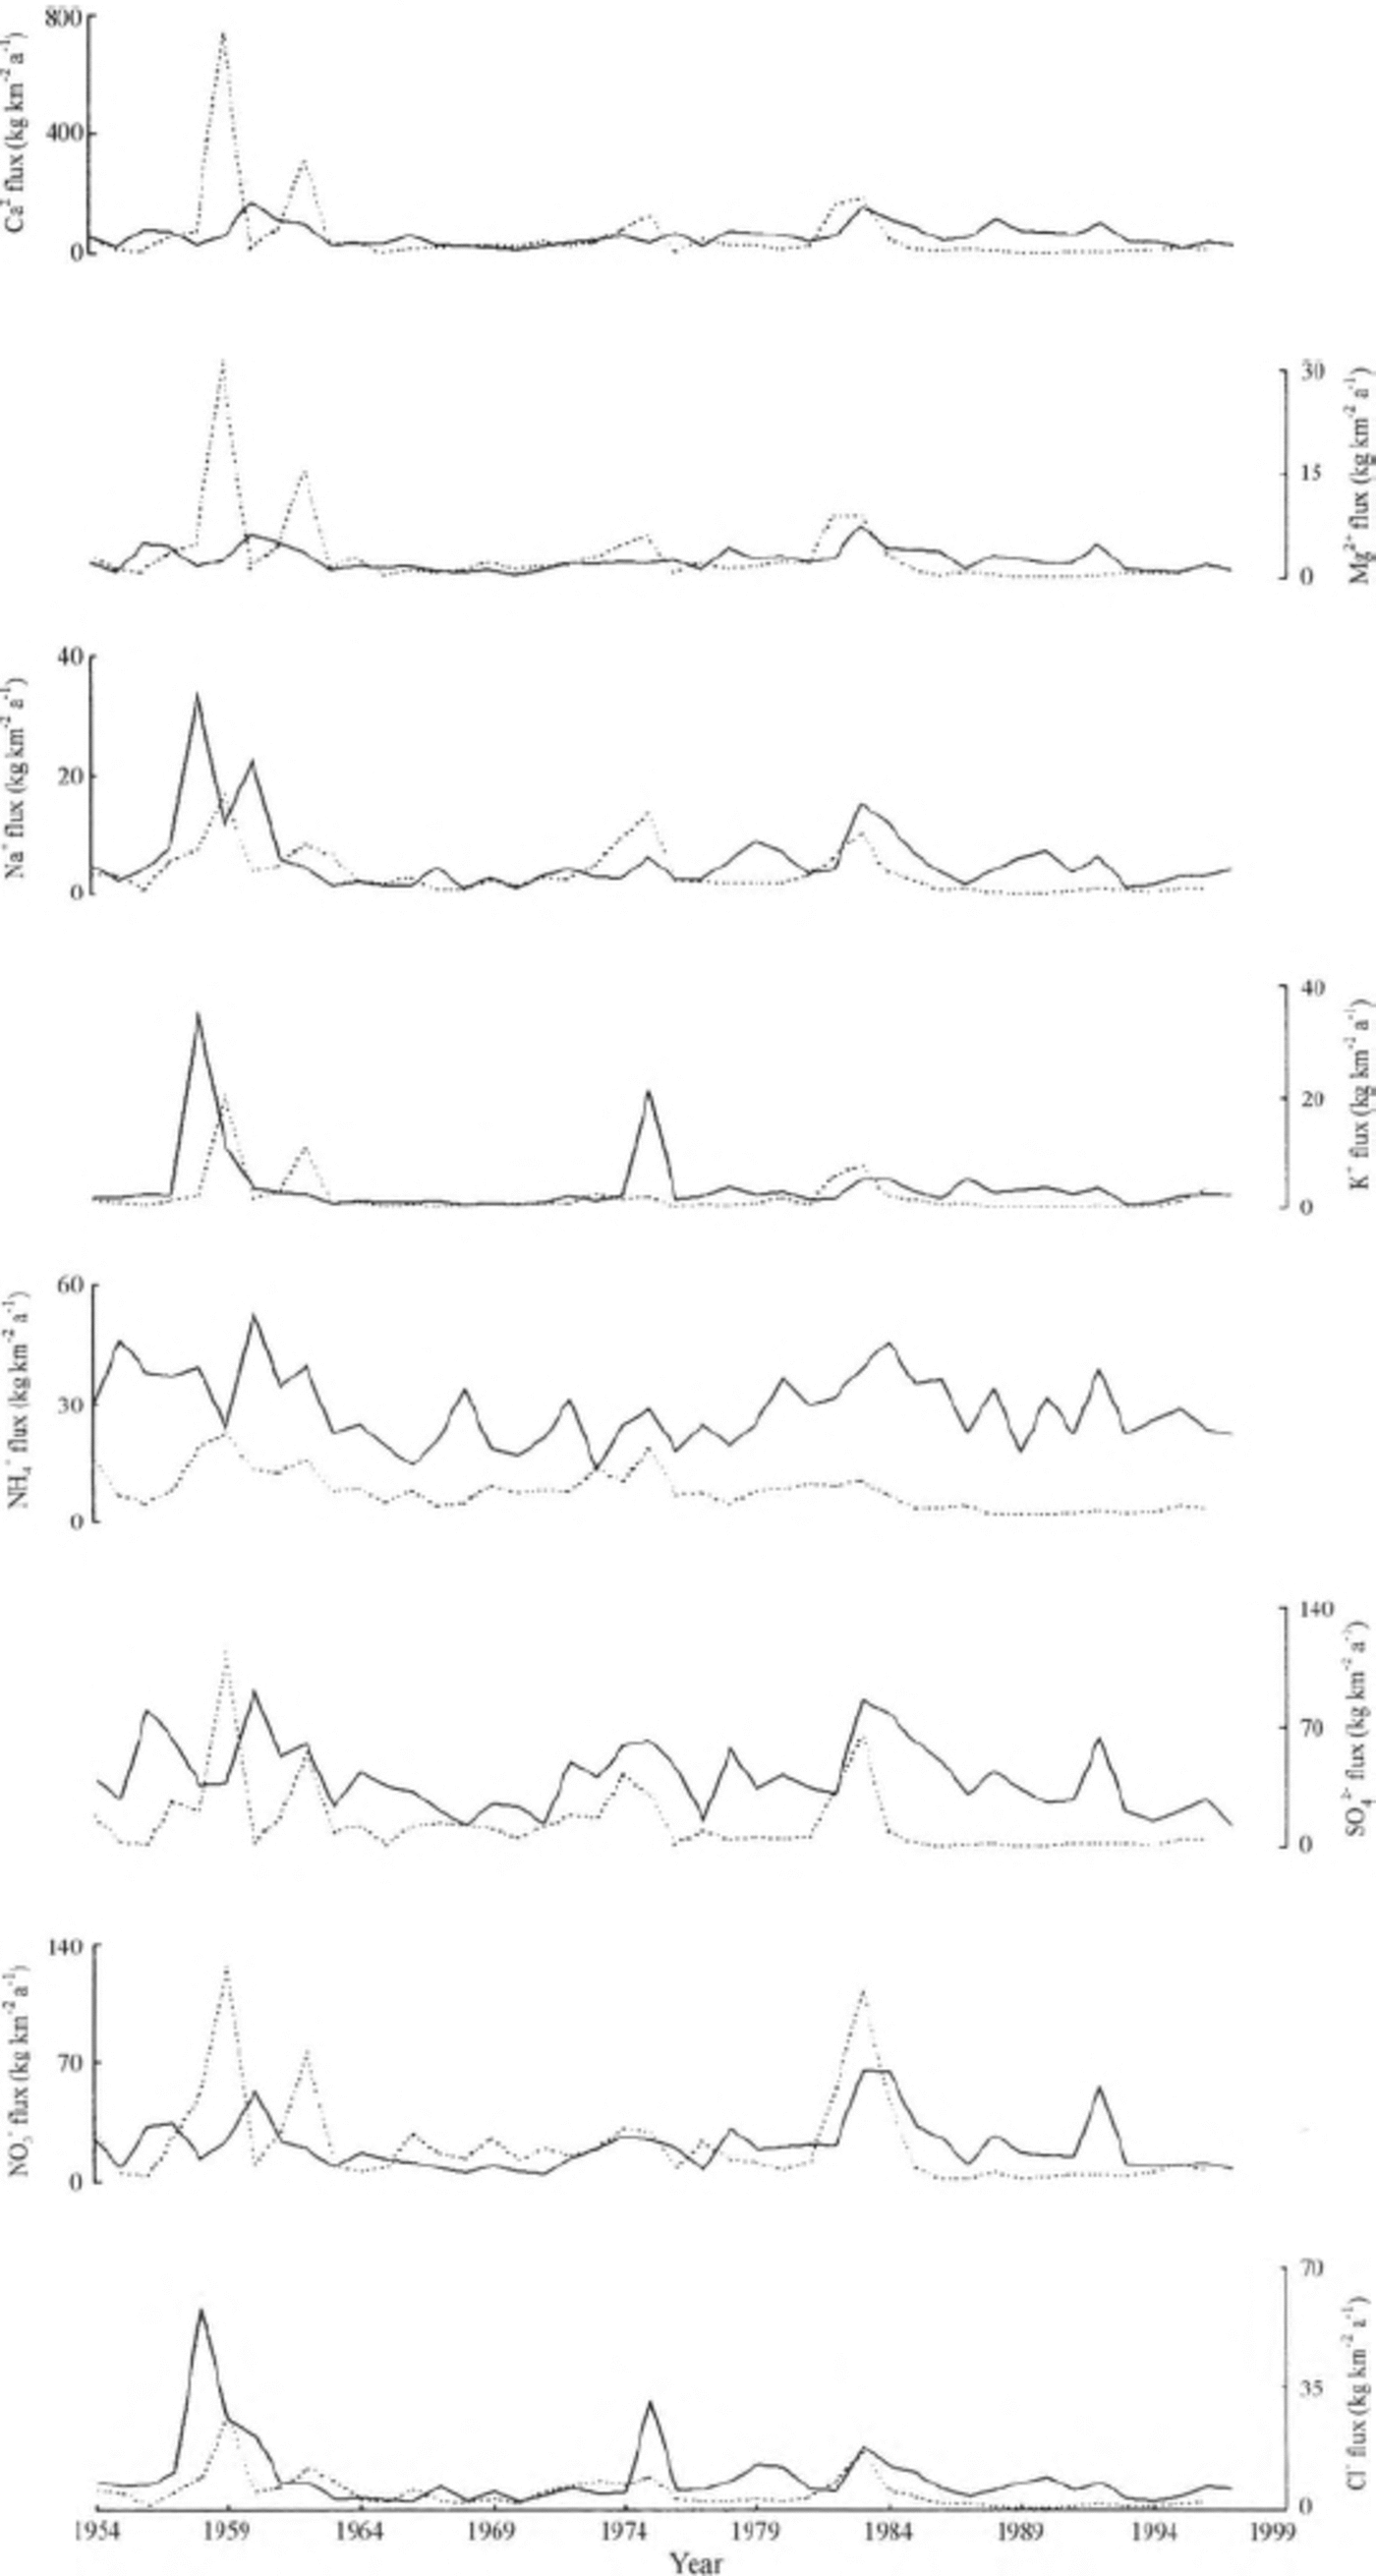
The average net accumulation rate of the FER core is less than half of that of the ER core for the period 1954—96 (Qin and others, 2002; Fig. 2). To eliminate the effect of the varied accumulation rate on concentrations, we calculate the flux (F) of each chemical species by the equation F = CA, where C is the individual annual mean concentration and A is the annual accumulation rate. The chemical fluxes of the two cores are compared in Figure 5. For Ca2+, Mg2+ and, to a lesser degree, NO3 -, the chemical fluxes of the FER core are higher than those of the ER core before 1963, but much lower after 1985, while similar flux values can be observed during the period 1964-84. Except for a few small intervals, the chemical fluxes of Cl- , Na+ , K+ and SO4 2- in the FER core tend to be lower than in the ER core. Moreover, the fluxes of NH4+ in the FER core are always lower than in the ER core.

Fig. 5. The annual fluxes of each chemical speciesfor the ER core (solid lines) and the FER core (dashed lines).
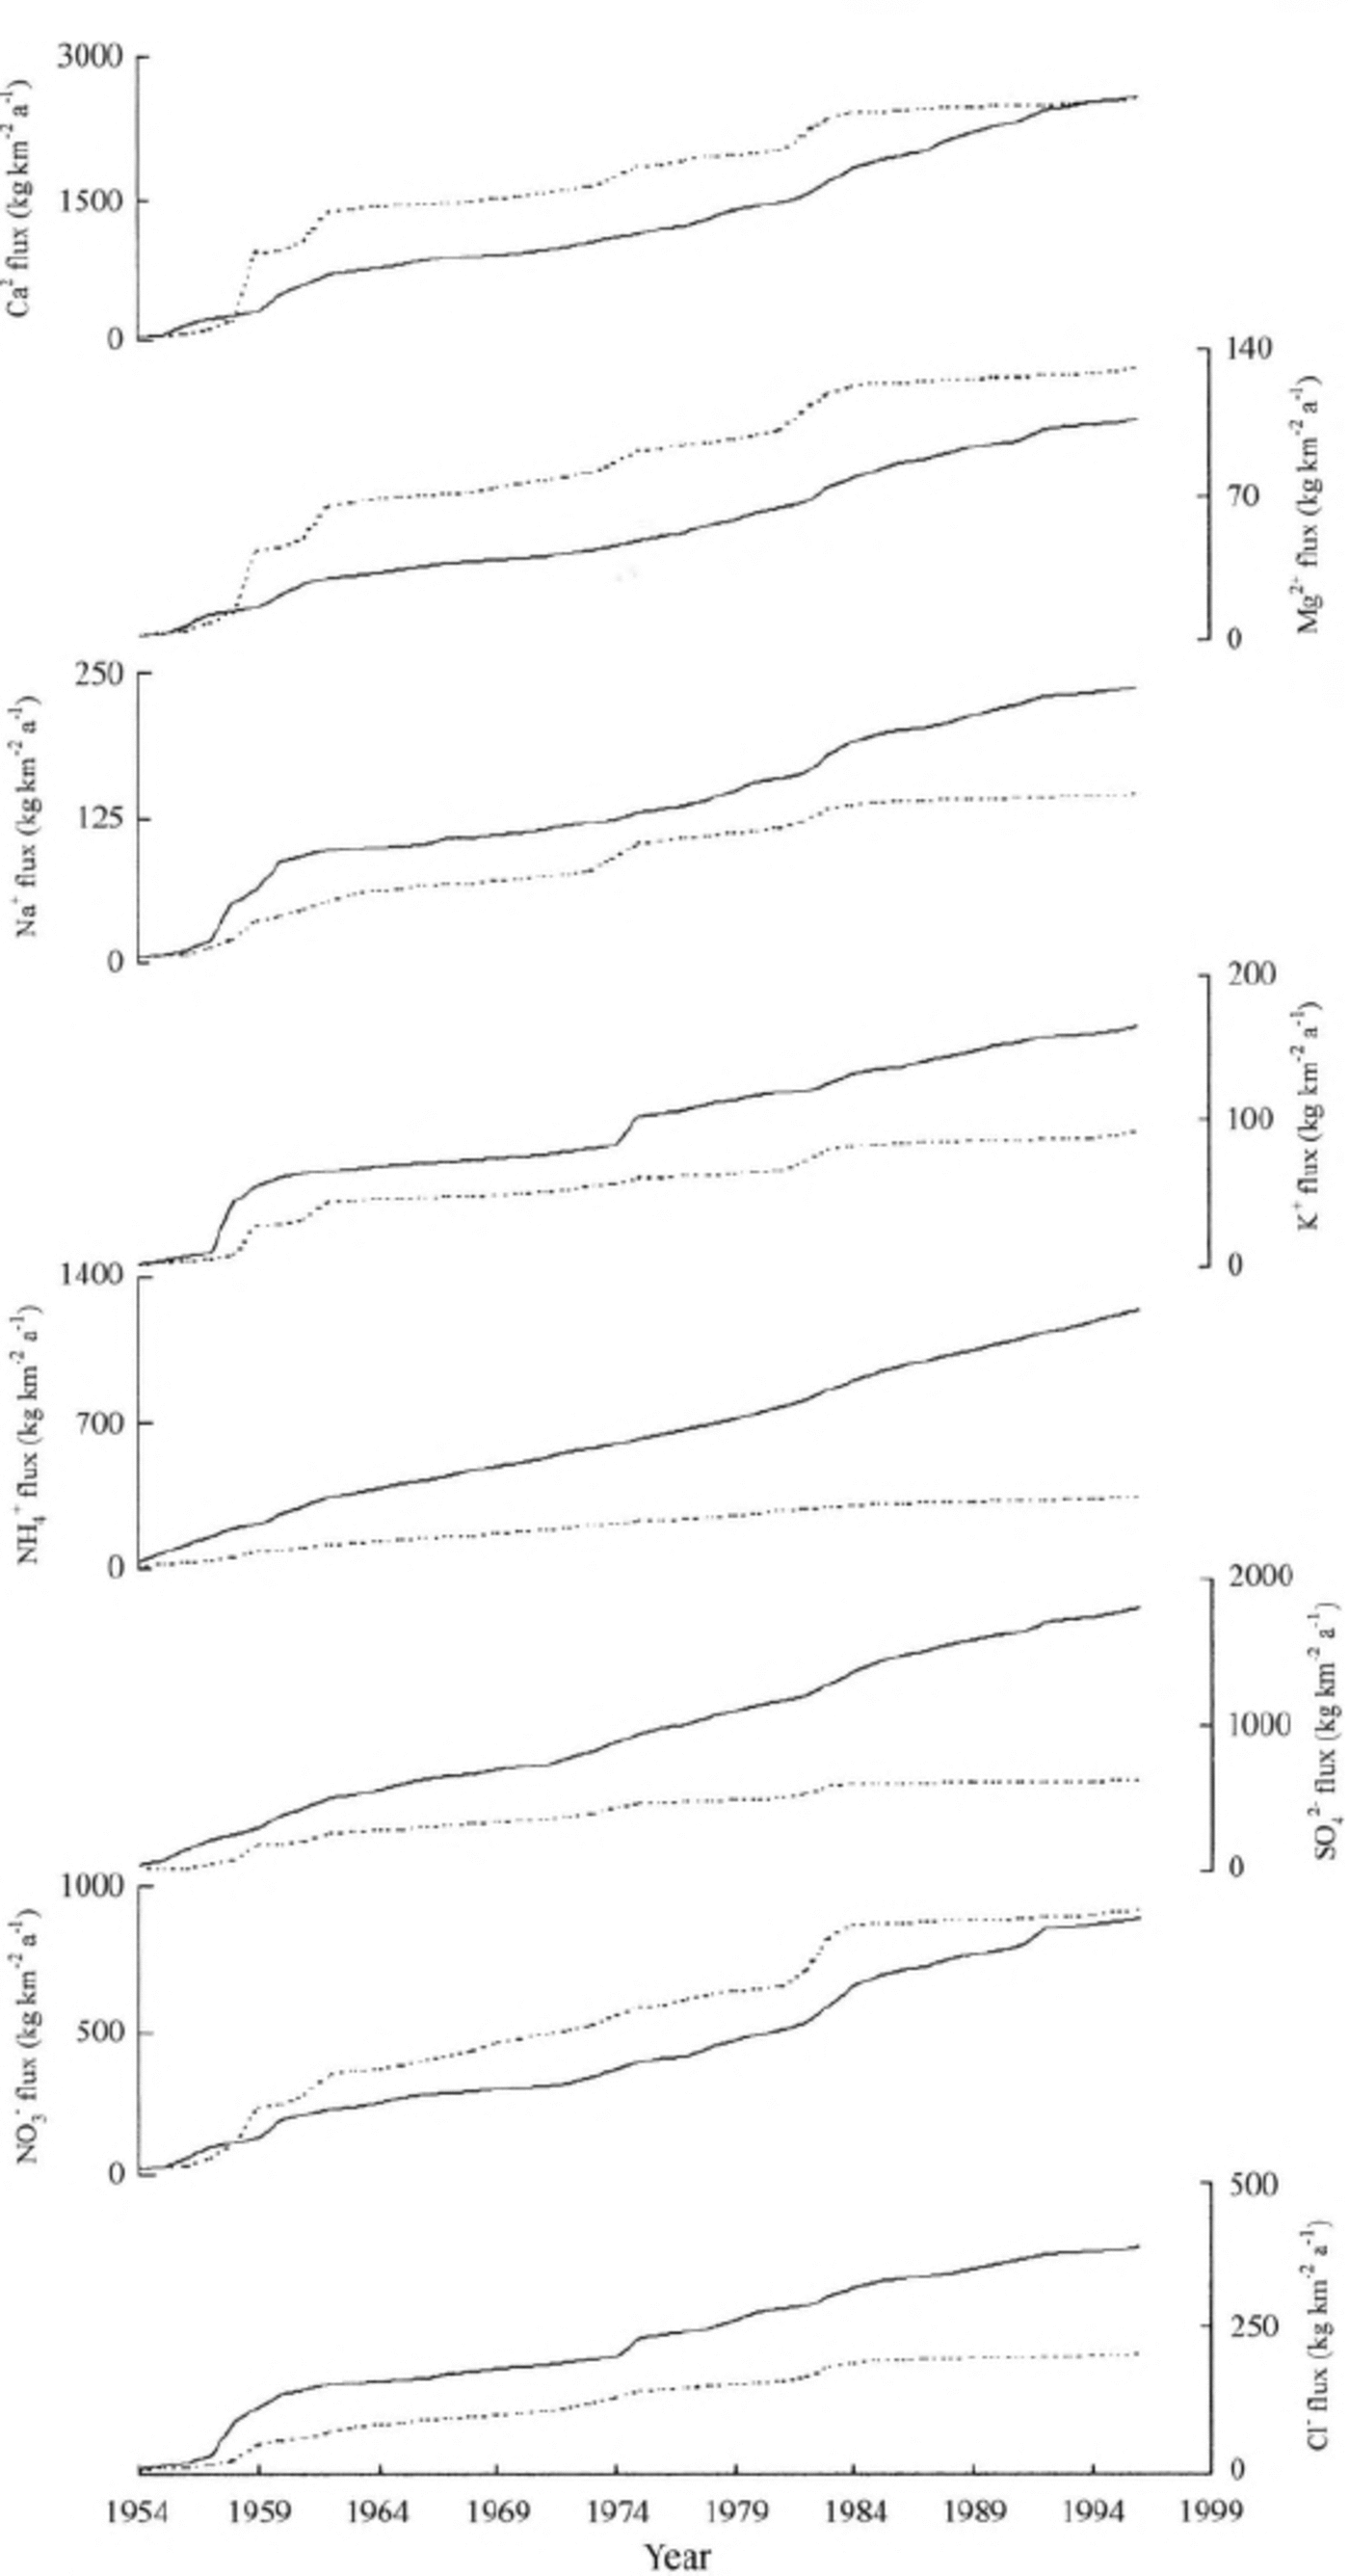
The phasing of the gaps between the neighboring flux peaks of the two cores (Fig. 5) may reflect the real variations, but it may also be caused by the potential error in the ice- core dating. Therefore, we further calculate the cumulative flux of each chemical species since 1954 (the older β-activity horizon), as shown in Figure 6. The cumulative Ca2+, Mg2+ and N03 fluxes indicate a sharp increase during the period 1958-61 for the FER core against the ER core, but this increase has slowed down since the mid-1980s while the cumulative Ca2+, Mg2+ and NO3 - fluxes of the ER core have continued increasing. As a result, the final cumulative Ca2+ and NO3 - fluxes are very similar, and the gap between the cumulative Mg2+ fluxes of the two cores has narrowed since the mid-1980s. The cumulative fluxes of all the other major ions (NH4+, SO4 2, Cl-, Na+ and K+) are lower in the FER core than in the ER core. For instance, the final cumulative NH4+ flux of the FER core is 335.2 kg km-2 a -1, less than one- third of that of the ER core (1232.2 kg km-2 a -1 in 1996).

Fig. 6. The cumulative fluxes of each chemical speciesfor the ER core (solid lines) and the FER core ( dashed lines).
The apparent discrepancy in the ionic concentrations and fluxes of the two cores cannot be caused by depositional processes (e.g. different atmospheric loadings at the two drilling sites). Previous studies have shown that 50-80% of the pollutant load in the snowpack can be released with the first 30% of the snowmelting (Reference Johannessen and HenriksenJohannessen and Henriksen, 1978; Reference Tranter, Brimblecombe, Davies, Vincent, Abrahams and BlackwoodTranter and others, 1986). Thus the ion-elution process can leach most of the ions from the uppermost part of the snowpack. The concentrated meltwater moves downwards, then refreezes on the underlying stratigraphic discontinuity location, resulting in ice lenses or ice layers with high ionic concentrations. However, most of the ions can flow away from the glacier system with the snowmelt discharge. If more intensive melting follows, this results in glacier ice layers with very low ionic contents (Hou and others, 1996; Hou and Qin, 1999). Though the distance between the FER and ER core drilling sites is only a few kilometers, the average net accumulation rate at the FER core site is less than half that at the ER core site, suggesting a higher ablation rate at the FER than at the ER core site. Field observation also confirmed heavy snowmelting, mostly in late summer on the south-facing FER Glacier, compared with little or no snowmelting at the ER core drilling site. Thus we suggest that the low chemical loads for NH4+, SO4 2, Cl-, Na+ and K+ in the FER core may be attributable to chemical release by the ion-elution process.
Both field and laboratory observations suggest that SO4 2- and NH4 + might be preferentially leached by meltwater (Reference Tranter, Brimblecombe, Davies, Vincent, Abrahams and BlackwoodTranter and others, 1986), which may explain the large difference between the final cumulative SO4 2- and NFI4+ fluxes of the two cores. Though Cai4 is also preferentially eluted from the snow and ice, several chemical reactions in the presence of meltwater probably contribute a certain quantity of Ca2+ (Flasnain andThayyen, 1999), such as carbonation reactions involving atmospheric CO2:

or coupled reactions involving the weathering of carbonates by protons derived from sulphide oxidation:

Therefore, the Ca2+ supplement for the FER core may roughly offset the amount lost by the ion-elution process, and Reaction (3) should play a minor role, given the extremely low cumulative SO4 2 flux of the FER core.
NO3 is also very active during the elution process, so the similar cumulative NO3 fluxes of the two cores imply that it is supplemented in the FER core by chemical reaction (s). Reference Lyons, Mayewski, Spencer and TwicklerLyons and others (1990) report that crustally derived NO3 from soils appears to be the main source of NO3 in snow samples from central Asia. Reference Williams, Tonnessen, Melack and DaqingWilliams and others (1992) carried out comprehensive research into the sources and spatial variation of the chemical content of winter snowpack at the head of the Uriimqi river, and confirmed that terrestrial dust may be the primary source of NOs in the snowpack. As for Ca" ', we speculate that a similar chemical process might occur for NO3 in the FER core, although much work needs to be done to obtain details of the potential chemical reactions.
4. Conclusions
Through comparison of two adjacent ice-core chemical records, it is suggested that the overall characteristics of the δ18O profiles of the two cores are similar, while a significant discrepancy exists for the ionic profiles of the two cores due to the elution process and chemical reactions. Therefore, the ice-core records are affected not only by the climatic and environmental conditions during precipitation, but also by the post-depositional processes. If ice cores, especially thoserecovered from less than ideal environments, are to be used with confidence for paleo-reconstruction, it is first necessary to determine how much the records reflect the climatic and environmental conditions, and which records are just modified results of post-depositional processes.
Recent glacier retreat and thinning have been widely observed in the high mountains, and rising temperatures are expected to intensify this trend. Therefore, our results also suggest an urgent need to recover valuable ice cores from high elevations before they are completely washed out.
Acknowledgements
We thank S. I. Whitlow for chemical measurements of the samples. This research was supported by the Chinese Academy of Sciences (KZCX1-10-02; KZCX2-301; KZCX2-108); the Cold and Arid Regions Environmental and Engineering Research Institute (CACX210506); the K. C. Wong Foundation, Centre National de la Recherche Scientifique, France; and the National Natural Science Foundation of China (49901004, 49871022). The manuscript was improved by comments from T. van Ommen, I. D. Goodwin and an anonymous reviewer.


