Introduction
It is important to record and to understand the patterns of crystal-size and -structure change in polar ice sheets because they influence and are influenced by many of the other physical properties, including the ice flow itself. Detailed examinations have therefore been carried out of crystal size and structure from deep and intermediate cores drilled by Australian National Antarctic Research Expeditions (ANARE) on Law Dome, East Antarctica (e.g. Reference Wakahama and KuroiwaWakahama, 1974; Reference Russell-Head and BuddRussell-Head and Budd, 1979; Reference Jacka, Gao and KunJacka and Gao, 1989; Reference LiLi, 1995; Reference Morgan, Wookey, Li, van Ommen, Skinner and FitzpatrickMorgan and others, 1997; Reference Li, Jacka and MorganLi and others, 1998).
In the upper snow layer the original crystalline form and density change soon after new snow is deposited on the surface, as indicated by gradual crystal growth and compaction with increasing depth and time. The rate of densification and crystal growth depends on surface meteorological conditions, especially surface mean temperature and accumulation rate which affects the amount of time for which the firn is influenced by the high summer temperatures. The annual climatic cycle produces detectable annual sequences of stratification, i.e. fluctuations of physical properties of snow such as density, crystal size and surface melting features. These phenomena vary from place to place, reflecting the corresponding changes in surface conditions. The study of the physical properties of the upper snow layer of polar ice sheets helps in the understanding of the formation and the nature of the ice sheet in relation to the surface climatic conditions of the region. Field studies of the physical properties of the snow layer on Law Dome have been carried out by Reference XieXie (1985), Reference Han and YoungHan and Young (1989), Reference Li, Young and WookeyLi and others (1991) and Reference LiLi (1995).
It is important to understand the development of crystal size and structure in the near-surface firn and ice, down to a depth of ∼ 300 m. This upper ice is the start material for the subsequent crystallographic and flow developments. A detailed study has been carried out of the near-surface crystal structure from cores collected at 16 sites on Law Dome, and results from that study are in preparation for publication. Here, two particular firn/ice cores are examined, both from relatively high-snow-accumulation sites. In these two cores, apparently high crystal-growth rates were discovered below the firn/ice transition. A mechanism for the higher growth rates is proposed.
Crystal-size and c-axis orientation data are presented for samples collected from the firn and near-surface ice layers of the DE08 and Dome Summit South (DSS) ice cores. The DE08 site (66°43′S, 113°12′E; 1250ma.s.l.) is 16 km east of Law Dome summit. The accumulation rate is −1160 kg m-2a-1 1 and the annual mean temperature is −18.8°G (Reference Etheridge, Wookey, Rado and BeaudoingEtheridge and Wookey, 1989). DSS (66°46’ S, 112°48′E; 1370 ma.s.l.) is 4.7 km south-southwest of the Law Dome summit. The accumulation rate is ∼ 6 4 0 kg m-2 a−1 and the annual mean temperature is −21.8° C. Further details of these sites, of the ice-core properties and of the drilling techniques can be found in Reference Etheridge, Wookey, Rado and BeaudoingEtheridge and Wookey (1989) and Reference Morgan, Wookey, Li, van Ommen, Skinner and FitzpatrickMorgan and others (1997). Snow-pit stratigraphy studies at both sites indicate they are in dry-snow zones (Reference LiLi, 1995).
For ice under insignificant stress in the upper firn layers of polar ice sheets, crystal growth is a process based primarily on crystal-boundary migration due to surface curvature driven by a reduction of free energy in total crystal-boundary area. Crystal-growth rate is dependent on temperature, and mean crystal size is determined by the relation between temperature, growth time and initial mean crystal size (Reference Stephenson and OuraStephenson, 1967; Reference GowGow, 1969; Reference Alley, Perepezko and BentleyAlley and others, 1986a, Reference Alley, Perepezko and Bentleyb). This process has been well studied in polar firn and in the upper ice layers (typically to several hundred meters depth at low-accumulation-rate sites) where deformation is small.
For deforming ice, laboratory studies on clean, initially isotropic ice (Reference Budd and JackaBudd and Jacka, 1989) have shown that crystal anisotropy begins to develop after a minimum strain rate is reached at about 1% strain. A steady-state crystal-orientation fabric pattern can develop after about 10% strain, provided the stress configuration remains unchanged. A steady-state ice-crystal size also develops during the transition from minimum isotropic flow to steady-state anisotropic flow. The steady-state crystal size seems to depend primarily on the magnitude of the stress and is largely independent of temperature (Reference Jacka and LiJacka and Li, 1994), because of the compensating nature of the effects of temperature and strain rate.
Firn and Ice-Crystal Measurement Techniques
Crystal-size measurements were carried out on thin sections cut perpendicular to the long axis of the firn/ice cores. All ice thin sections were prepared by freezing a thick section to a glass slide then cutting it to −0.3 mm using a microtome; these were photographed at the drill site within 2 h of core extraction. Firn thin sections from the DE08 core (i.e. samples above 80 m depth) were prepared in the laboratory at Casey station (-100 km from the drill site). No firn samples are available for the DSS core. To prepare a firn thin section, firstly a thick (-1 mm) section is cut. This is soaked in Dodecane (C12H26) and placed on a glass slide at a temperature below −15°C to allow the Dodecane to freeze. The thickness of the firn section is then reduced to 0.3-0.4 mm using a microtome. The temperature is then increased above −10°C to allow the Dodecane to melt. Photographs of the firn thin sections showing crystal textures were taken between crossed polarisers. A detailed description of this technique and of the properties of Dodecane is given by Reference AlleyAlley (1980).
Crystal size in this study is represented by mean crystal area averaged over at least 100 crystals. Because of the large number of pores and gaps between crystals in the firn thin sections, crystals were randomly selected from enlarged photographs and measured individually for each thin section from the DE08 core. The area of each crystal was calculated assuming that the crystal area can be approximated by that of an ellipse whose long and short axes are the diameters of the measured largest inscribed circle and smallest circumscribed circle, respectively, for that crystal. The mean area for a thin section is then the arithmetic mean of the areas for the measured crystals. Mean crystal size for the DSS ice core was obtained by counting the number of crystals in given areas of thin section of ice. A detailed comparison of crystal-size measurement techniques (using three different crystal-selecting methods) is given by Reference Li, Young and MalcolmLi and others (1990). They found that provided enough crystals (>100 to 200) are selected, the variability of measured mean crystal size appears to be small (of the order of ±10%)
Crystal ,-axis orientation fabrics were measured at the drill site using a universal stage (Reference LangwayLangway, 1958). Eight thin sections at depth intervals of ∼ 2 0 m were measured between 55 and 204 m depth from the DE08 core. Crystal-size measurements from firn thin sections from the DE08 core were made at −10 m depth intervals. Crystal size and ,-axis orientation fabrics from the DSS ice core were measured between 78 m and the bottom of the core (-1200 m) with an average depth interval of ∼ 6 m (Reference LiLi, 1995). In this study, measurements only from the top 300 m of this core are examined.
Results from the Firn/Ice Cores
Crystal-size profiles
Changes in crystal size with increasing depth from near the surface to 300 m for the DE08 core and from 78 to 300 m for the DSS core are illustrated in Figure 1. Crystal size at DE08 is generally smaller than at DSS at the same depth. Note that the 10 m firn temperature at DE08 (-18.8°C) is higher than at DSS (-21.8°C). The crystal-size difference is greatest at ∼ 9 5 m depth, slightly below the firn/ice transition depth (i.e. the depth of bubble close-off which occurs at a density of 830 kg m−3) which at DE08 is 80 m. Below ∼ 9 5 m the increase of crystal size with depth at DE08 is significantly enhanced. The DSS crystal size increases approximately linearly with depth from ∼ 7 8 m Gust below the firn/ice transition at 70 m) to ∼ 300 m. For DSS, it is clear that at some depth above 78 m (i.e. within the firn or just below the firn/ ice transition) there is an enhancement of crystal-growth rate in comparison with the growth rate higher in the firn.
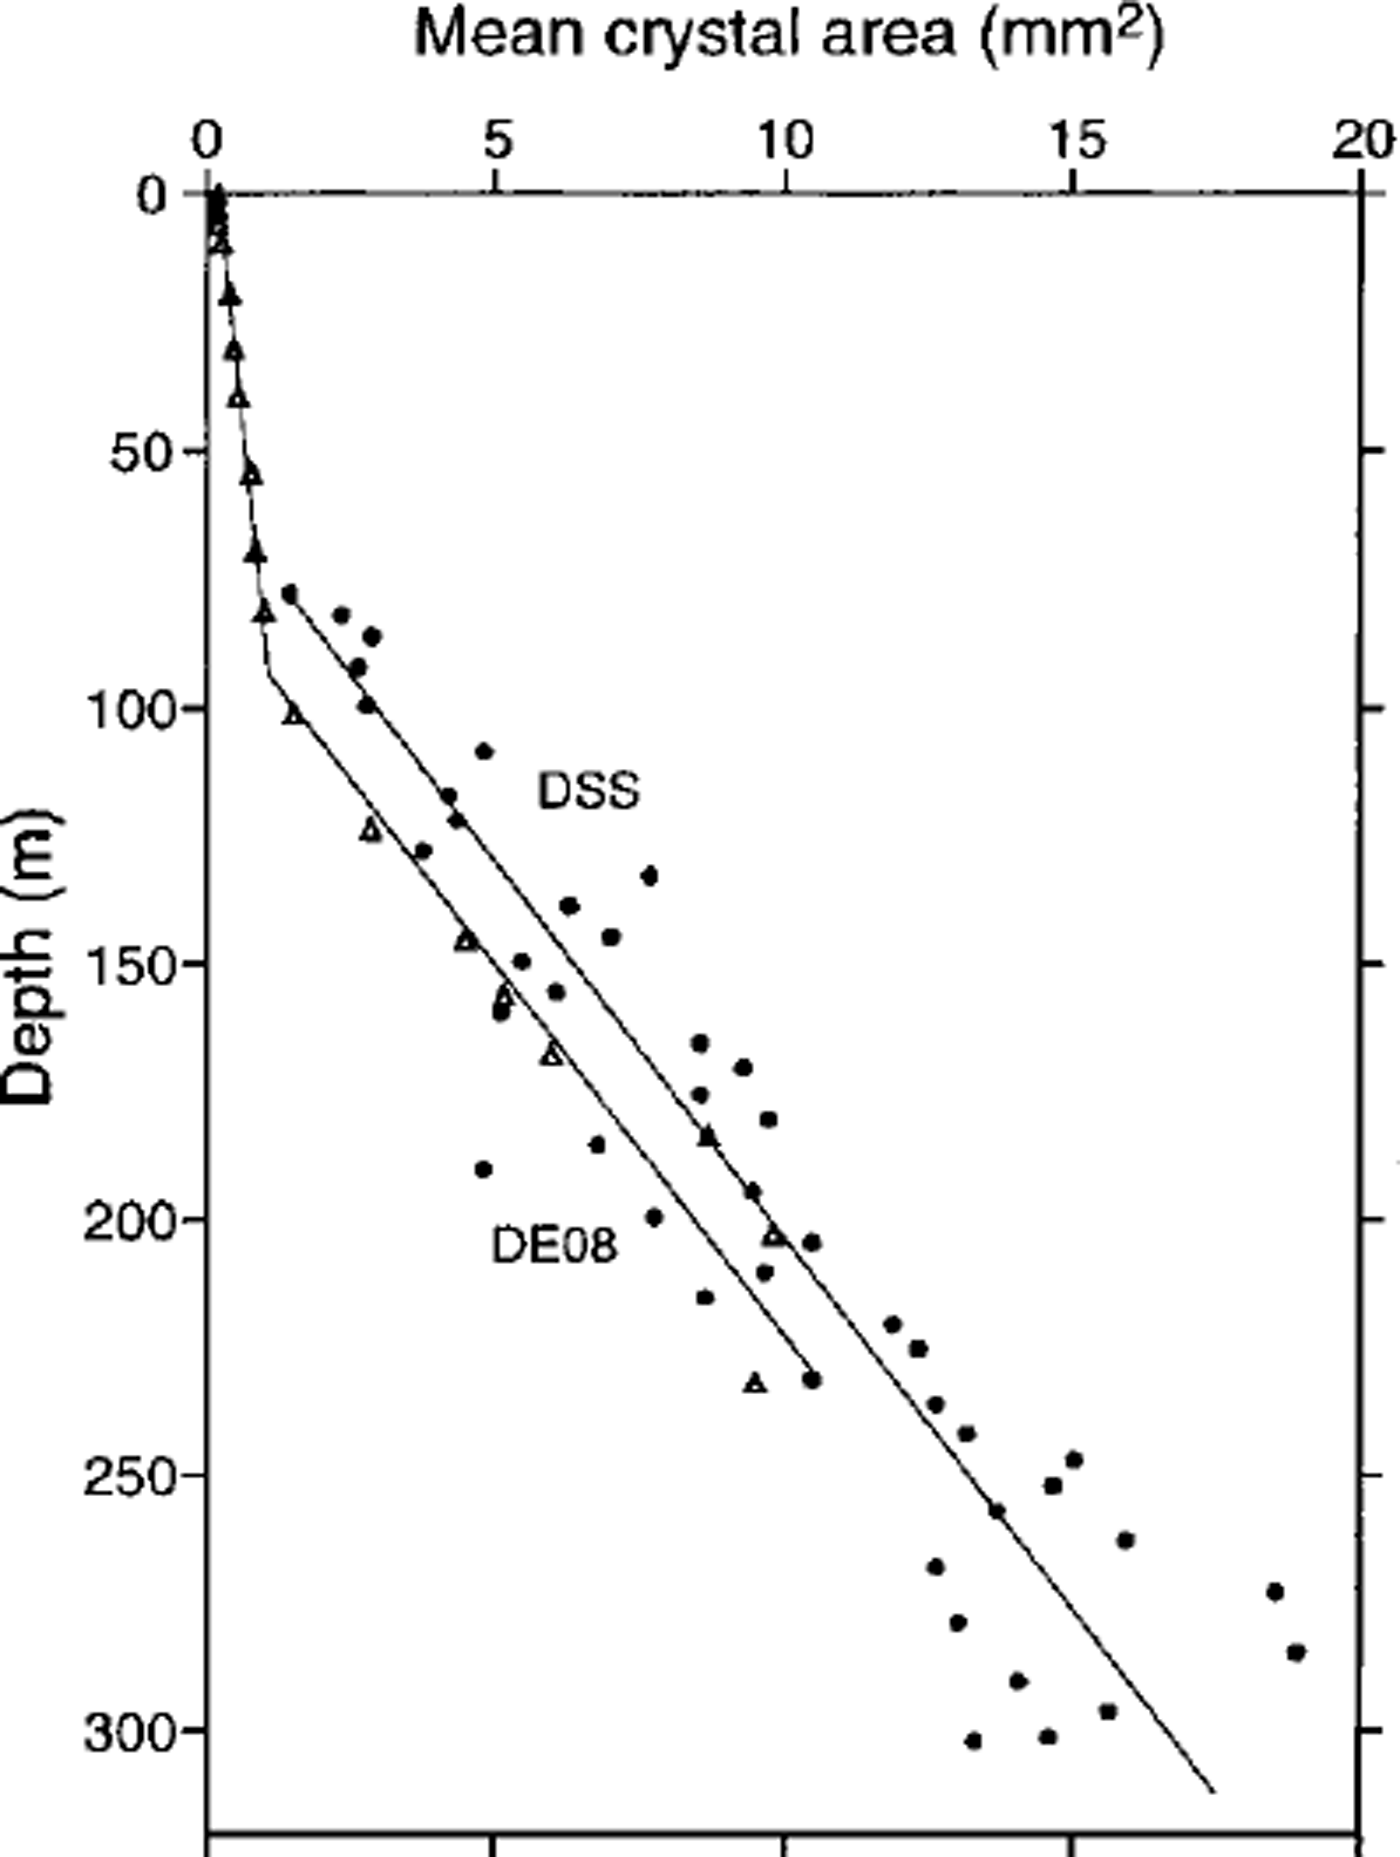
Fig 1. Plot of crystal size as a function of depth at DE08 (triangles)and DSS (filled circles).
Figure 2 shows crystal size as a function of age for the two cores. Ages for the DSS (Reference Morgan, Wookey, Li, van Ommen, Skinner and FitzpatrickMorgan and others, 1997) and DE08 cores were obtained by counting seasonal cycles detected by measurement of electric conductivity and oxygen-isotope ratio. For the DSS core, where crystal size was not measured in the firn, crystal size has been estimated (Reference GowGow,1969) and is indicated by a dashed line down to the firn/ice transition, below which measurements are included. A sharp increase in crystal-growth rate at ∼55 a BP at DE08 is clear. Based on the estimated crystal size above the firn/ice transition, there is a crystal-growth enhancement at DSS at ∼78 a BP. Since we have measured crystal-size data below this depth, this estimation (i.e. from the calculation based on Reference GowGow (1969)) would seem to be the maximum age for the crystal-growth enhancement.
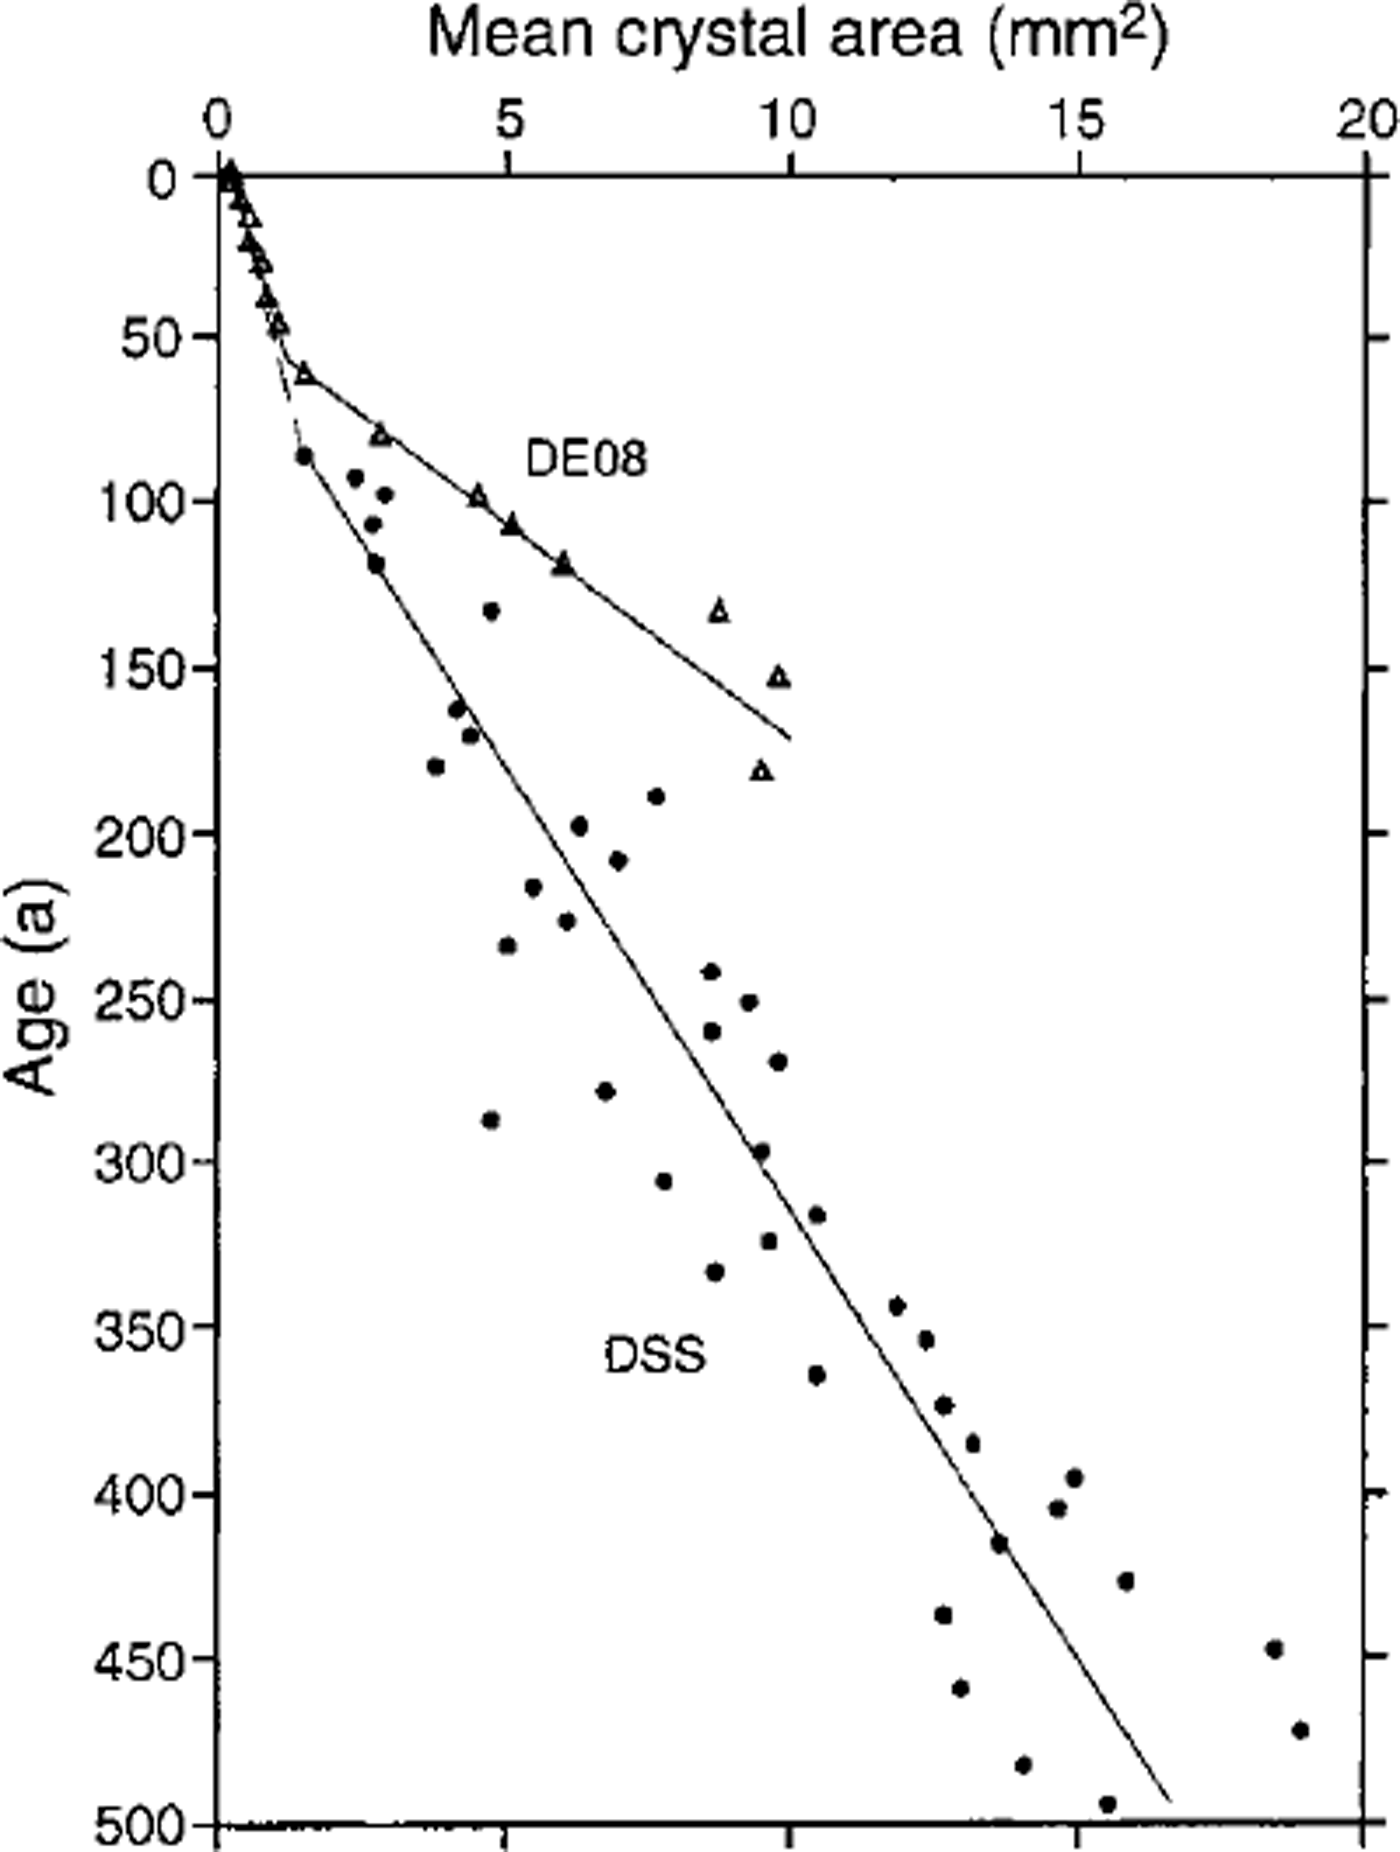
Fig. 2. Plot of crystal size as a function of age at DE08 and DSS. The dashed line in firn for DSS is estimated using Reference GowGow (1969).
Crystal-growth rates
In firn and unstrained ice, crystal size can be expressed as a function of time and temperature by the relation
where D2
is the mean crystal area at time t,
![]() is the initial mean crystal area and K is the crystal-growth rate which depends on temperature according to the Arrhenius equation,
is the initial mean crystal area and K is the crystal-growth rate which depends on temperature according to the Arrhenius equation,
where K0 is a constant, R is the gas constant, T is the temperature in Kelvin and E is the activation energy of the growth process (Reference Stephenson and OuraStephenson, 1967; Reference GowGow 1969,Reference Gow1975).
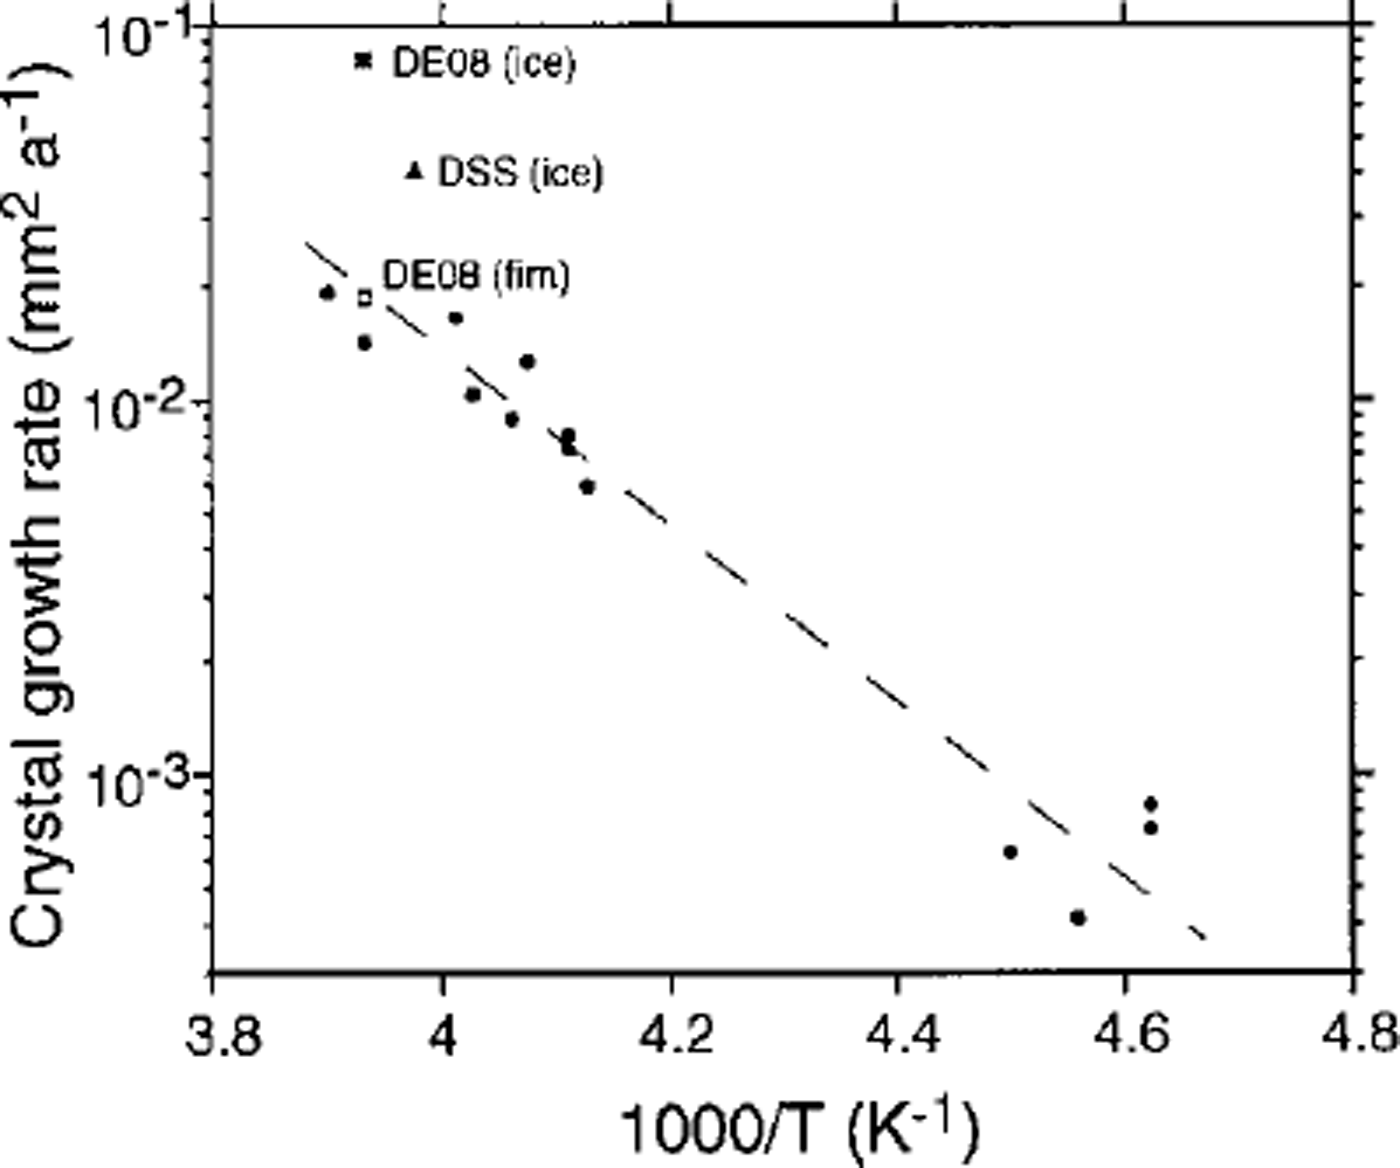
Fig. 3. Plot of crystal-growth rate against reciprocal of the absolute temperature. The dashed line is the best fit to the data shown by closed circles (from Reference PatersonPaterson, 1994). The values for the firn and ice from DE08 and for the ice from DSS are indicated.
From the regression lines shown in Figure 2, the crystal-growth rate at DE08 is 1.79 x 10⁻² mm2 a−1 in firn (0-94 m) and 7.67 X10⁻² mm2 a−1 in ice (94-233 m). The crystal-growth rate at DSS is 3.84 x lO−2 mm2 a−1 in ice. A plot of these growth rates as a function of temperature is shown in Figure 3, together with data from several other polar sites (from Reference PatersonPaterson, 1994). Crystal-growth rate in the DE08 firn closely agrees with the generally found growth-rate-temperature relation indicated by the dashed line in Figure 3. However, the growth rates in the ice at DE08 and DSS are significantly greater than the general trend.
Borehole measurements show that the temperature at DE08 decreases from −18.8°C at 10 m depth to ∼-20°C at 100 m depth, and below this is almost constant to 230 m depth near the bottom of the hole (Reference Etheridge, Wookey, Rado and BeaudoingEtheridge and Wookey, 1989). At ∼ 5 0 to 350 m depth, temperatures at DSS remain approximately isothermal at ∼-22°C (Reference Van Ommen, Morgan, Jacka, Woon and Elc‘heikhVan Ommen and others, 1999). Detailed analysis of oxygen isotope ratio in the DE08 and DSS ice cores shows that no large or rapid temperature changes have occurred in the ice above −300 m (Reference Etheridge, Steele, Langenfelds, Francey, Barnola and MorganEtheridge and others, 1996; Reference Morgan, Wookey, Li, van Ommen, Skinner and FitzpatrickMorgan and others, 1997). Thus, enhanced crystal growth in shallow ice layers at these two sites cannot be attributed to temperature effects.
c-axis orientation fabrics
Fabric diagrams (plotted on Schmidt equal-area projections) of c-axis orientation data together with corresponding histograms of the frequency of crystals within each 5° inclination interval are shown in Figure 4 for the DE08 and DSS cores. The data used to compile these fabric diagrams are composites of orientation data measured from several thin sections over 50 m depth intervals. Note therefore that the fabric diagrams for the DSS core contain more data points than those for the DE08 core because thin sections were cut and measured at more closely spaced intervals of the DSS core. The sine curve plotted along with each histogram is the expected distribution for the case of uniformly distributed c axes. Thus for differences from an isotropic crystal pattern, variations from the sine curve should be considered. Figure 4 shows the development with increasing depth in both the DE08 and DSS cores, of some central tendency of the c axes. Each histogram shows that the frequency of, axes with inclination greater than −50° is less than expected for a random distribution, while the frequency of inclinations less than −45° is greater than expected for a random distribution. A report of the DSS crystal fabrics is in preparation for publication elsewhere, showing greater detail of the anisotropy development through the core. Even for the shallow depth interval, 50-100 m in the firn/ice transition region, a non-random pattern is evident. This development of a central tendency of the c axes is indicative of ice flow due to internal deformation.
Comparison with Other Polar Ice Cores
Figure 5 shows crystal size as a function of depth for firn and shallow ice from cores drilled at Dome C (Reference AlleyAlley, 1980), Byrd Station (Reference GowGow,1970), Little America V (Reference CraryCrary, 1961; Reference GowGow, 1970), Maudheim (Reference GowGow,1969; Reference PatersonPaterson, 1994) and Camp Century (Reference GowGow,1971; Reference PatersonPaterson, 1994). A plot of crystal size as a function of age is not shown, because an age scale is not available for all cores. In the firn, crystal-growth rate increases monotonically with temperature from the coldest location included, Dome C (-54.3°C), to the warmest, DE08 (-18.8°C). In addition, the firn crystal-size profiles for DE08 and for all the cores represented in Figure 5 are approximately as expected (Fig. 3) for the temperature-dependent growth rate (Reference GowGow, 1969).
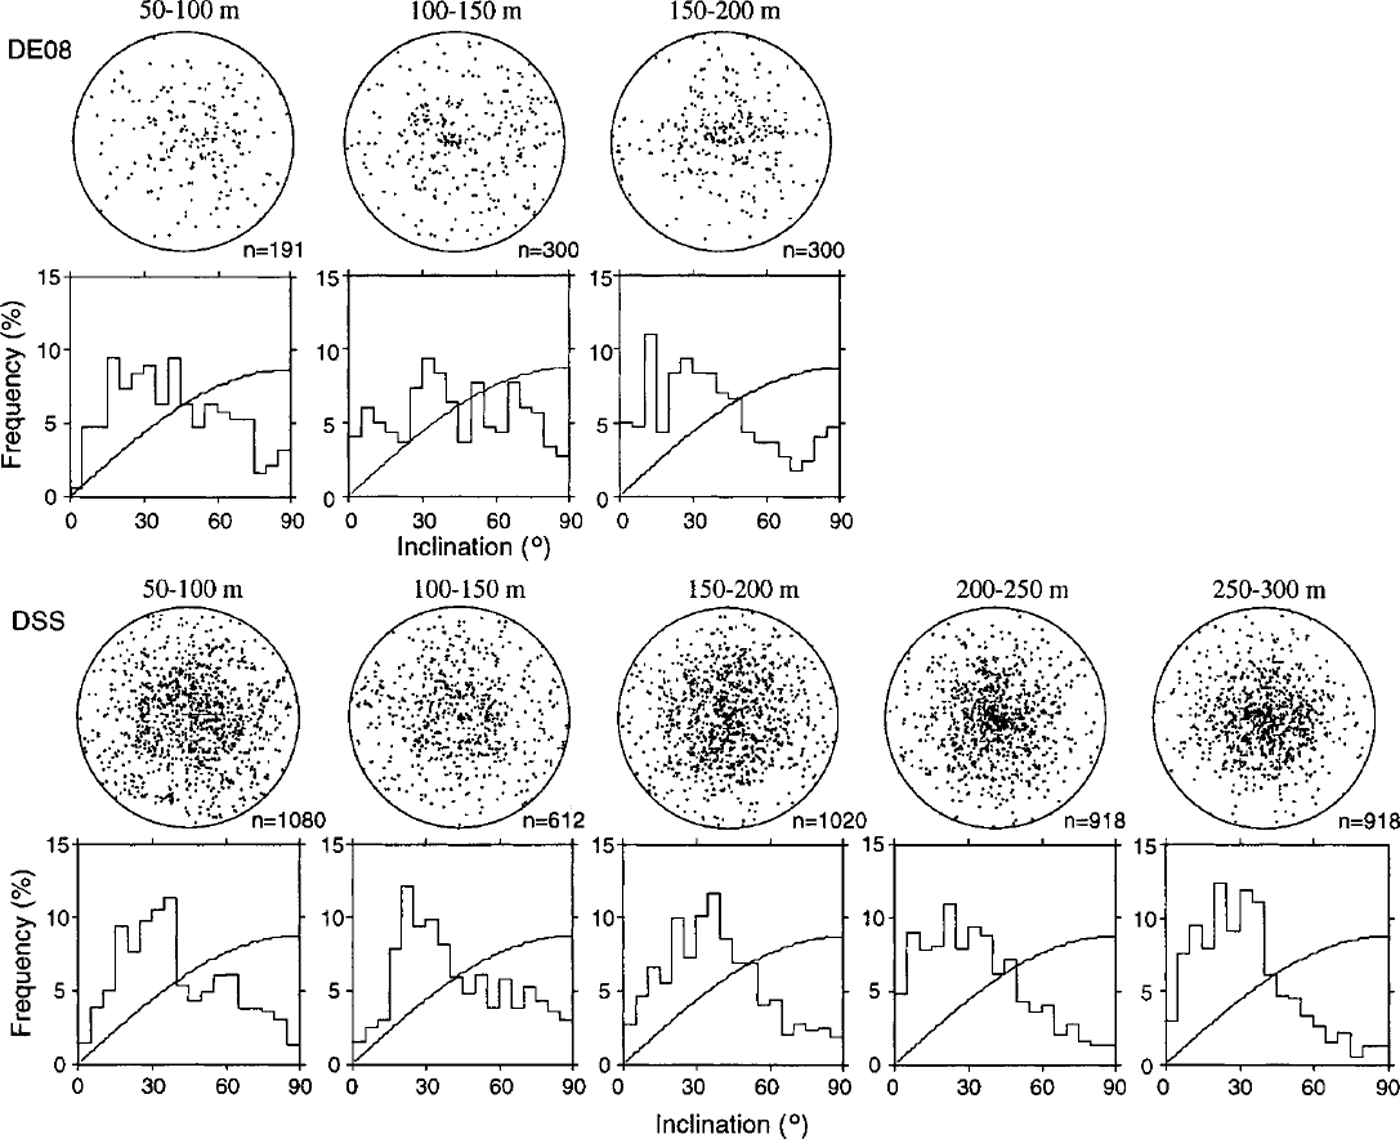
Fig. 4. Crystal c-axis orientation fabrics in shallow ice for the DE08 and DSS cores. Note each fabric diagram is a composite of data over 50 m depth intervals.
The crystal-size relations with age for the Byrd Station and Camp Century cores indicate no sharp change of crystal-growth rate across the fim/ice transition. For the Maudheim and (although there are no firn data available) Little America V cores, however, there does appear to be a sharp enhancement of crystal-growth rate, similar in character to that discovered in the DE08 and DSS cores.
Above, it was noted for the DE08 and DSS cores that a crystal-orientation fabric indicative of ice flow through internal deformation had begun to develop. No such fabric development is evident in the ice near the firn/ice transition in the Byrd Station core, leading Reference GowGow (1968) to write that "Despite the progressive increase in the size of crystals with depth at Byrd Station, this growth was not accompanied by any increase in the degree of preferred orientation of crystallographic c-axes." The crystal fabrics immediately below the firn/ice transition from Camp Century indicate a random pattern, but a small-circle .-axes distribution pattern has developed at 190 m depth (Reference Herron and LangwayHerron and Langway, 1982), 65 m below the transition. At Dome C also, crystal fabrics immediately below the firn/ice transition exhibit a random orientation pattern (Reference Duval and LoriusDuval and Lorius, 1980). There is thus little evidence from the crystal-orientation fabrics from these three cores of significant ice flow at these shallow depths.
At Little America V, Reference GowGow (1970) noted "the appearance of strain shadows in crystals at around 65 m depth, and the formation of oriented fabrics by 100 m". Gow also speculated that "other factors, particularly deformation, have been responsible for the more rapid rate of growth of crystals at Little America V". The accumulation rate at Little America V is not as high as at DE08 or DSS, but high horizontal strain rates have been measured at this site (Reference CraryCrary, 1961). Little America V is near the front of the Ross Ice Shelf. The larger-crystal ice is likely therefore to have originated further inland, and to have been exposed to relatively high longitudinal strains as it moved towards the ice front. For the Maudheim Ice Shelf, although little difference from random was noted in the crystal-orientation fabrics, Schytt (1958) came to a similar conclusion, i.e. that the change in crystal size at ∼ 7 5 m depth derived from the inland ice sheet.
Accumulation rate (indicated in Table 1) has a clear influence on the crystal-size-depth profile. Crystal sizes in the Byrd Station and Camp Century cores are larger (compared to the DSS and DE08 cores) because crystals have undergone a longer growth time (at approximately the same temperature) due to the lower accumulation rate. The smaller crystals at DE08 (i.e. at the same depths) have had the shortest time to grow because the accumulation rate at DE08 is highest.
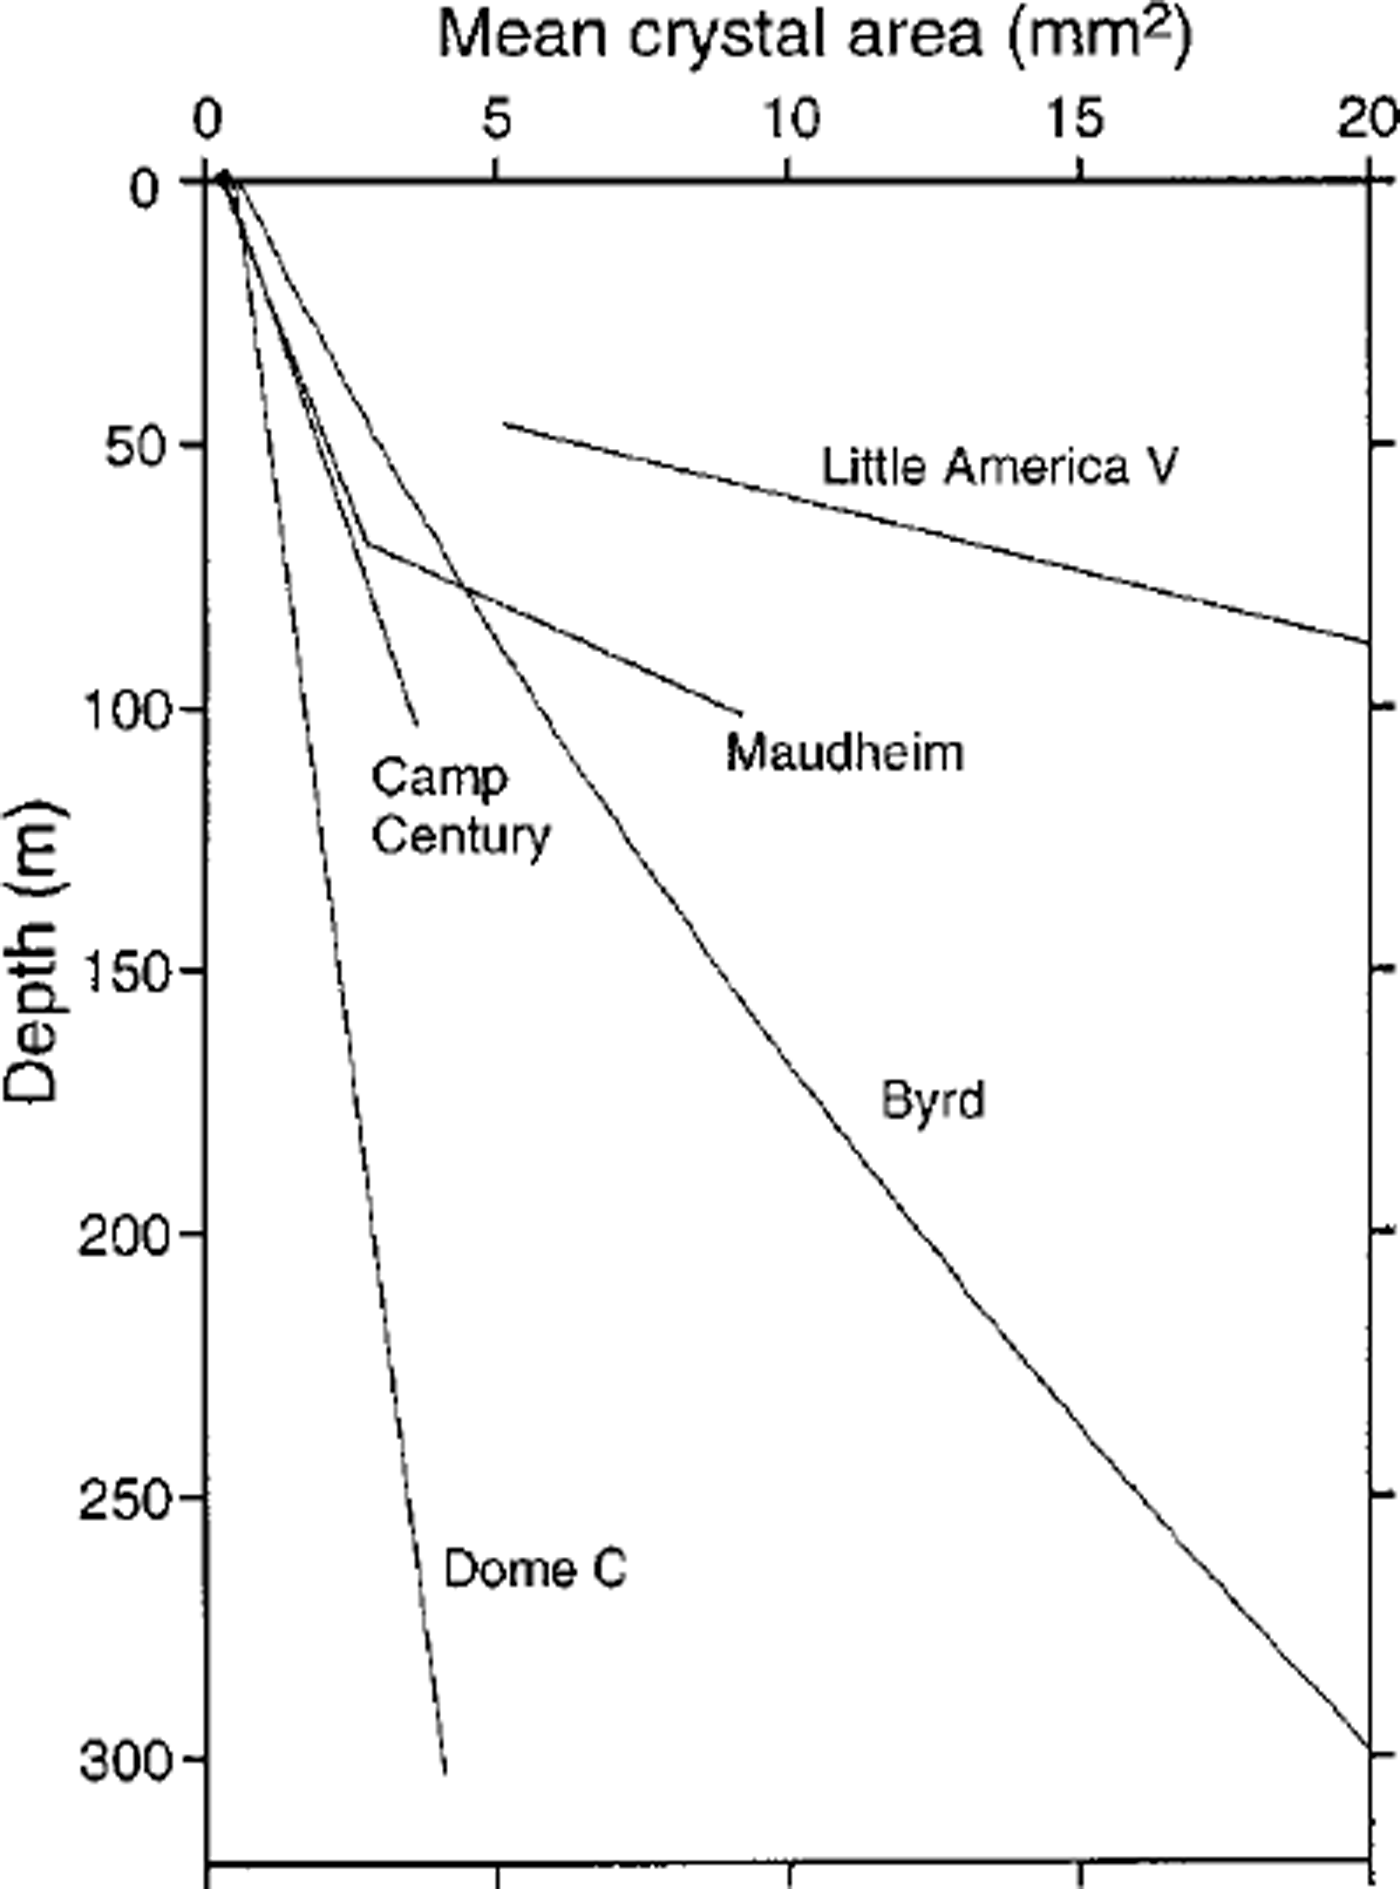
Fig. 5. Plot of crystal size as a function of depth for firn and shallow ice from cores drilled at Dome C, East Antarctica (Reference AlleyAlley, 1980); Byrd Station, West Antarctica (Reference GowGow, 1971); Little America V, Ross Ice Shelf, Antarctica (Reference GowGow, 1970); Maudheim, Maudheim Ice Shelf, East Antarctica (Reference MellorMellor, 1964, from data of Schytt, 1958); and Camp Century, Greenland (Reference GowGow, 1971; Reference Herron and LangwayHerron and Langway, 1982).
The cause of the change to more rapid crystal-growth rate below the firn/ice transition at DE08 and DSS will now be examined. Particularly high accumulation rate and some development of crystal-orientation fabrics seem to be properties distinguishing these cores from the others studied at the inland sites.
A Mechanism for Enhanced Crystal-Growth Rate
From deformation experiments on initially isotropic laboratory ice samples it has been found that mean crystal size changes and an anisotropic .-axis orientation pattern develops while strain rate increases from a minimum value at about 1% strain to a steady-state value beyond about 10% strain (Reference Budd and JackaBudd and Jacka, 1989). In an unchanging stress and temperature field, the change in average crystal size and c-axis orientation ceases once a constant tertiary flow rate has been attained and an equilibrium crystal size is established pertaining to the applied stress pattern. Reference JackaJacka (1984) studied ice with a range of initial crystal sizes. He found that for samples deformed under the same temperature and stress conditions the crystal sizes attained approximately the same value at the termination of the experiment in the tertiary creep stage independent of whether the initial mean crystal size was larger or smaller than the final size. Reference Jacka and LiJacka and Li (1994) have shown that at steady-state tertiary strain rate, a steady-state crystal size is established strongly dependent upon stress magnitude. Consideration of these laboratory results along with the development of the non-random crystal-fabric patterns shown in Figure 4 suggests that a strain in excess of 1% may be reached at a very shallow depth (50-100 m) at DE08 and DSS. It is suggested here that although steady-state ice flow may not be attained till much deeper in the ice sheet, deformation processes begin to control crystal growth, even at this shallow depth.
Estimation of localised octahedral strain rate, estimated as
![]() times the ratio of ice accumulation to thickness (Reference BuddBudd, 1969), gives 8.49 x 10∼4 a−1 at DE08 and 3.90 x 10∼4 a−1 at DSS. These values are 1-2 orders of magnitude higher than estimated for most locations on inland polar ice sheets (e.g. Reference Duval and LliboutryDuval and Lliboutry, 1985). For these higher-accumulation (leading to higher strain rate) sites, a significant effect of deformation on crystal size in the shallow ice layers is evidenced by Figures 2 and 5. Crystal-growth rates (slope of regression lines) at depths less than about 60 m (i.e. above the firn/ice transition) at Byrd Station, Camp Century, DSS and DE08 are similar since the temperatures at these locations are similar. Below the firn/ice transition, crystal size at these four sites differs markedly and it is suggested that these differences are due to the differences in strain rates associated with different accumulation rates at the sites.
times the ratio of ice accumulation to thickness (Reference BuddBudd, 1969), gives 8.49 x 10∼4 a−1 at DE08 and 3.90 x 10∼4 a−1 at DSS. These values are 1-2 orders of magnitude higher than estimated for most locations on inland polar ice sheets (e.g. Reference Duval and LliboutryDuval and Lliboutry, 1985). For these higher-accumulation (leading to higher strain rate) sites, a significant effect of deformation on crystal size in the shallow ice layers is evidenced by Figures 2 and 5. Crystal-growth rates (slope of regression lines) at depths less than about 60 m (i.e. above the firn/ice transition) at Byrd Station, Camp Century, DSS and DE08 are similar since the temperatures at these locations are similar. Below the firn/ice transition, crystal size at these four sites differs markedly and it is suggested that these differences are due to the differences in strain rates associated with different accumulation rates at the sites.
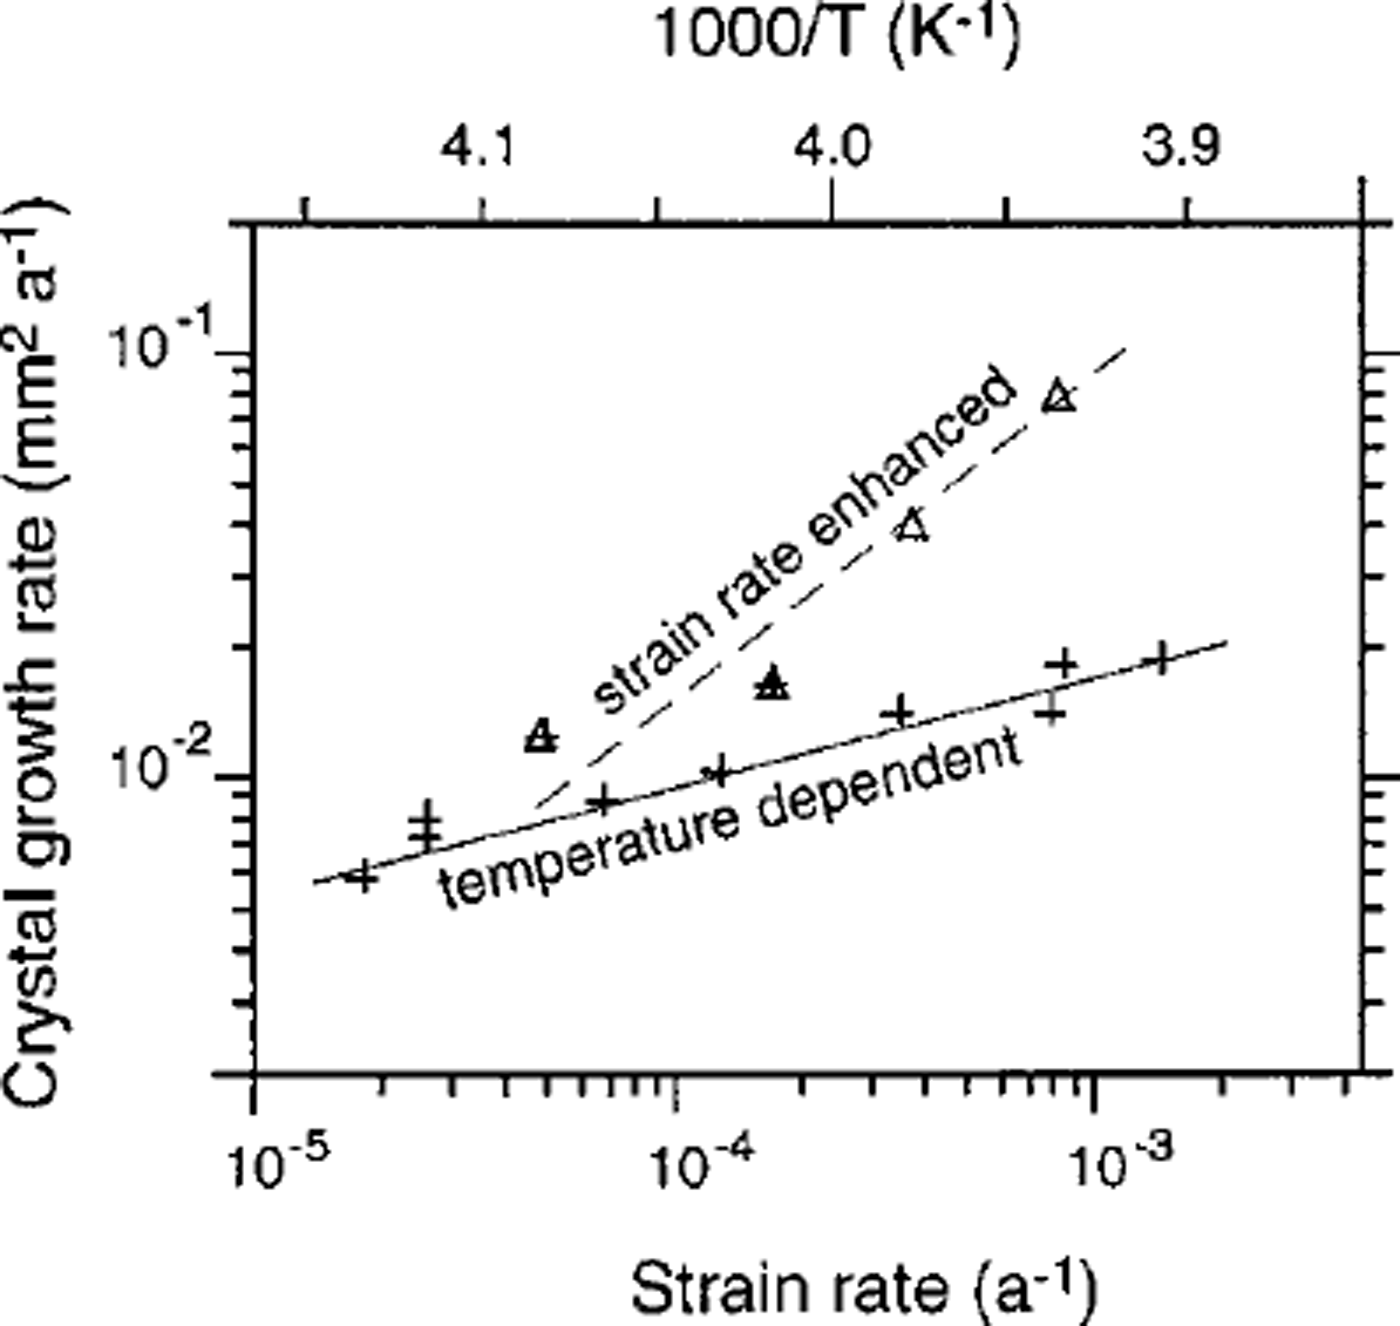
Fig. 6. Plot of crystal-growth rate above the firn/ice transition as a function of temperature (crosses and solid line) for several sites listed in Table 1 and Reference PatersonPaterson (1994), along with a plot of crystal-growth rate below the firn/ice transition as a function of strain rate (triangles and dashed line) for the sites listed in Table 1. The (inverse) temperature (linear) and strain rate (log) axes were aligned based upon the values at Byrd and DE08 For the other two locations (DSS and Camp Century) at which crystal-growth rates are plotted as a function of both temperature and strain rate, the fitted alignment" is remarkably good.
In Figure 6 we have plotted crystal-growth rate above the firn/ice transition as a function of temperature for the sites listed in Table 1 and from Reference PatersonPaterson (1994). This plot is very similar to Figure 3 (rotated); it is an expanded version for the locations at the warmer temperatures, and includes DE08 and DSS. We have also plotted the crystal-growth rate below the firn/ice transition as a function of strain rate for the stations of Table 1. The (inverse) temperature (linear) and strain-rate (log) axes were aligned based upon the values at Byrd and DE08. For the other two locations (DSS and Camp Century) at which crystal-growth rates are plotted as a function of both temperature and strain rate, the "fitted alignment" is remarkably good (not surprising given the nature of the temperature-strain-rate relation). Thus, for Byrd and for Camp Century where the crystal-growth rate is the same above and below the firn/ice transition, the two points are co-located. We propose that normal crystal-growth rate, which occurs in the upper layers of the ice sheets, is temperature-dependent as described by Reference Stephenson and OuraStephenson (1967) and Reference GowGow (1969). In addition, however, crystal-growth rate is enhanced by strain rate at high-accumulation sites. For higher-accumulation sites, e.g. DE08 where (as indicated by the fabric development) a higher strain is attained, the trend toward a steady-state crystal size is most rapid. At DSS, where accumulation (and thus strain rate) is less, the trend toward a steady-state crystal size (i.e. the crystal-growth rate) is less rapid.
Table 1. Physical properties of ice sheets at selected polar sites

Conclusion
Crystal-size data in the firn (at DE08) and shallow ice to below the firn/ice transition depth (at DE08 and DSS) have been presented for these two cores, drilled near the summit of Law Dome, East Antarctica. It was found for the DE08 core in the firn, that crystal-growth rates were temperature-dependent as expected from the established relationship of Reference GowGow (1969). Below the firn/ice transition, crystal-growth rate in these two cores increased markedly. Examination of data from other core sites failed to find a comparable dataset for which a similar phenomenon (large increase of crystal-growth rate below the firn/ice transition) could not be otherwise explained.
Evidence has been presented to suggest that crystal size in the polar ice sheets is controlled by two main processes.
-
(i) Near the surface of the ice sheet, where deformation (apart from compaction) is close to zero, crystal-growth rate is temperature-controlled, as determined by Reference Stephenson and OuraStephenson (1967) and Reference GowGow (1969).
-
(ii) For regions with high strain rates, once the ice has undergone significant strain (this can be judged by examination of crystal-orientation fabric pattern), crystal-size change is controlled by deformation processes. In this case, crystal-growth rate is linearly dependent upon strain rate. The target crystal size (which in a non-changing stress field is the steady-state crystal size) is inversely dependent upon the cube of the stress magnitude (Reference Jacka and LiJacka and Li, 1994). At most locations in polar ice sheets, deformation is not sufficient to control crystal growth until about one-third of the depth in the ice sheet, where the flow is controlled by internal shear deformation due to the ice-sheet thickness and surface slope. At sites of very high snow accumulation, however (e.g. DE08 and DSS), the stress due to the overburden pressure is sufficient to control the crystal growth.
Acknowledgement
We thank W. F Budd for valuable discussions.


