Introduction
Wilhelm II Land lies between Davis and Mirny stations in East Antarctica (78–93˚E) and until recently has not been studied in detail. This paper summarizes the results from shallow-firn-core analysis from this area, and outlines the potential for further drilling investigations. A full data report is in Reference Smith and RuddellSmith and others (2001).
Sampling and Analysis
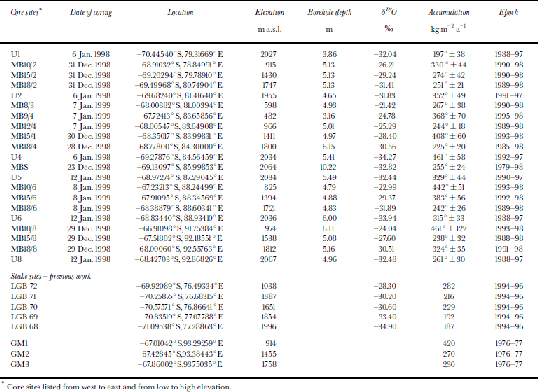
Twenty-one shallow firn cores were collected at 500–2100m elevation during the 1997/98 and1998/99 Australian National Antarctic Research Expeditions (ANARE) summer expeditions (Table1; Fig.1). A Polar Ice Coring Office (PICO) hand auger was used to collect 20 cores of approximately 5m length, and one 10m core at site Mount Brown South (MBS) where an automatic weather station was installed.
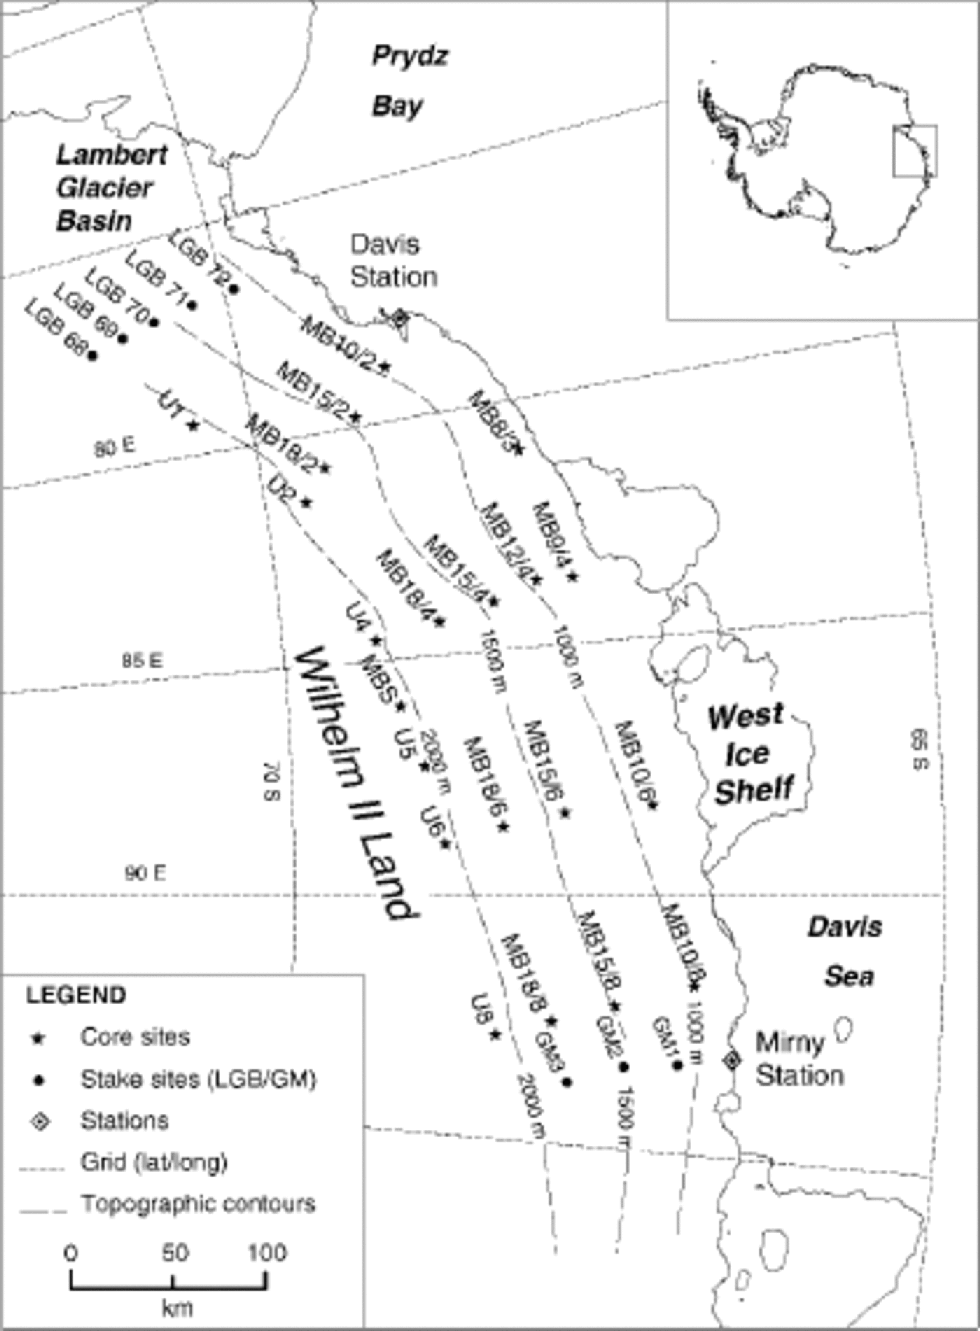
Fig. 1 Location of shallow firn-core sites in Wilhelm II Land (U and MB), and stake sites along the Lambert Glacier basin traverse route (LGBsites) and along the Mirny–Dome C traverse route (GMsites), East Antarctica.
Table 1. Shallow-core and stake-site information in and near Wilhelm II Land including positions, δ 18O, accumulation rates and epochs (LGB sites from Reference Higham and CravenHigham and Craven, 1997; GM sites from Reference YoungYoung, 1979)
The cores from the 1997/98 season were sampled and measured for electrical conductivity (EC) at the Co-operative Research Centre for the Antarctic and Southern Ocean Environment (Antarctic CRC) in Hobart, and the cores from the 1998/99 season were sampled and measured for EC and density at Davis station. A density measurement was made for each of the latter core sections (each approximately 1m long). All samples were analyzed for oxygen isotope ratio (δ18O) and hydrogen peroxide (H2O2) levels as contiguous 4 or 5 cm samples.
Accumulation rates were determined for each site by identification of annual layers within the δ18O, H2O2 and EC records. An example of one core (U5) is presented in Figure 2. Most of these records indicate reasonable agreement between the annual cycle positions, but the quality of the records varied (Reference Smith and RuddellSmith and others, 2001). Snows takes were also installed at most sites, and preliminary analysis of these data indicates that the accumulation rates defined through core analysis are generally consistent with the order of magnitude from stake measurements (Reference Smith and RuddellSmith and others, 2001).
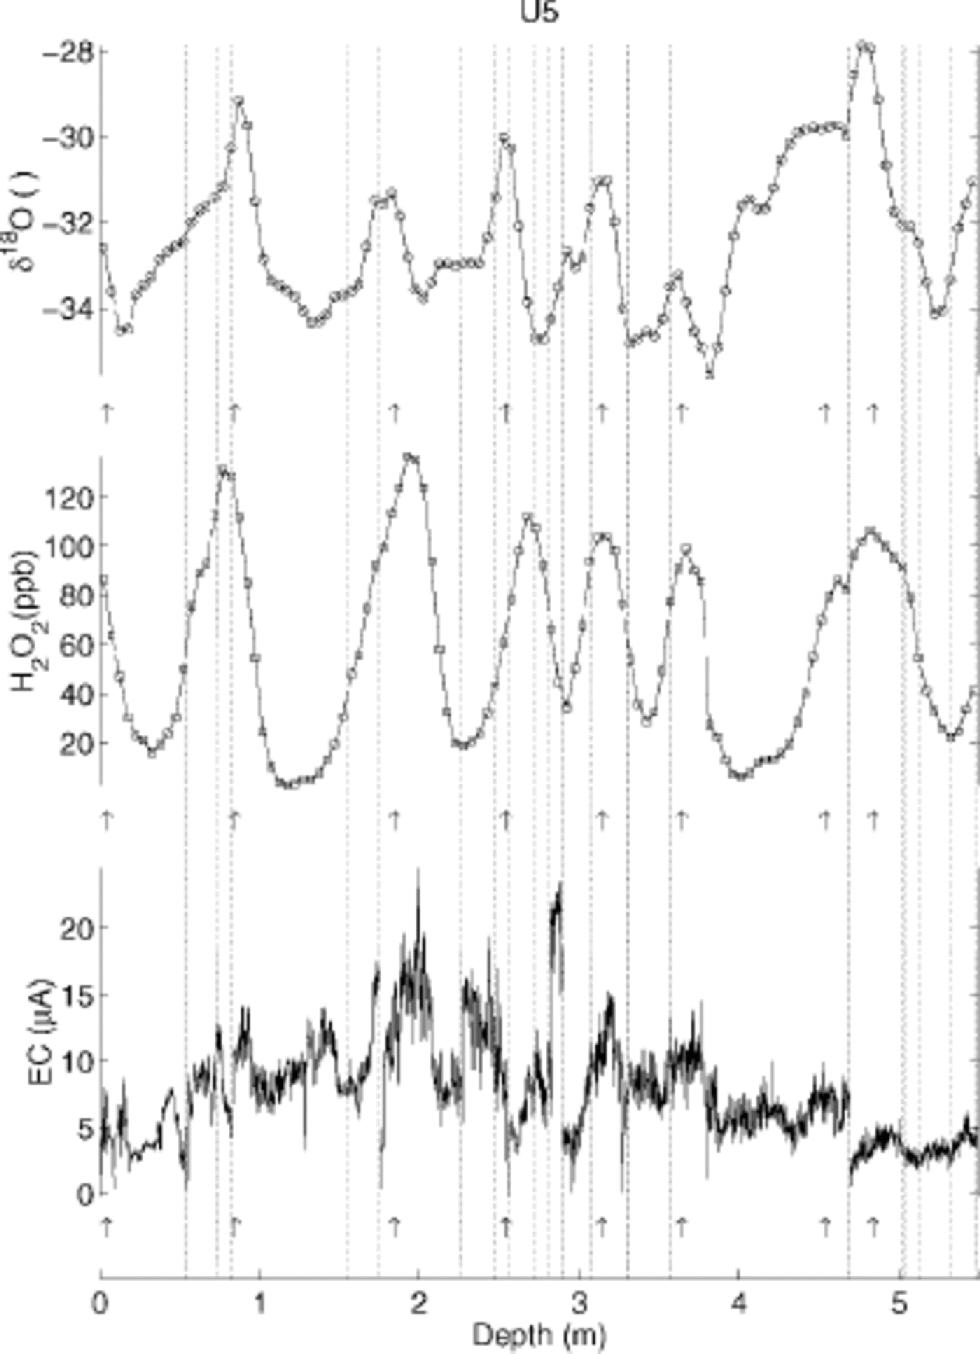
Fig. 2 An example of δ 18O, H2O2 and EC measurement analyses (core U5). Arrows indicate where summer peaks have been identified and used to define the accumulation rate.
Temperature measurements were made in each borehole, but time restraints due to helicopter operations led to inaccurate data which have not been used in this study.
The δ18O and accumulation datasets were contoured using Generic Mapping Tools (GMT) software with an adjustable tension surface and a grid of 2˚×20' (longitude and latitude) (Reference Smith and WesselSmith and Wessel, 1990; Reference Wessel and SmithWessel and Smith, 1998). Where possible, data from Lambert Glacier basin (LGB) and Mirny–Dome C traverse routes have been incorporated into these maps (Table 1).
Oxygen Isotope Distribution
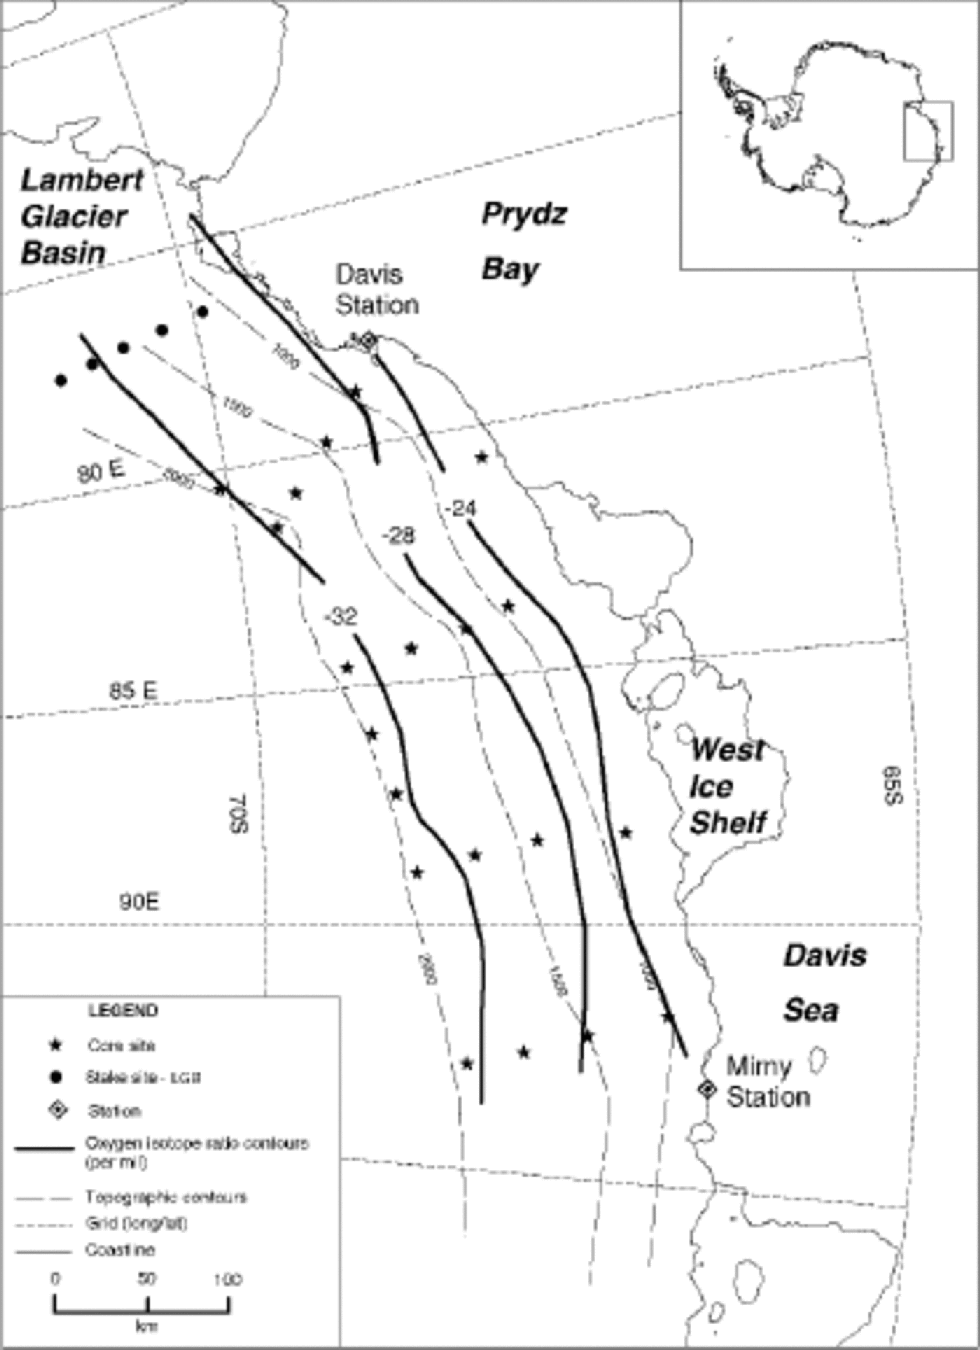
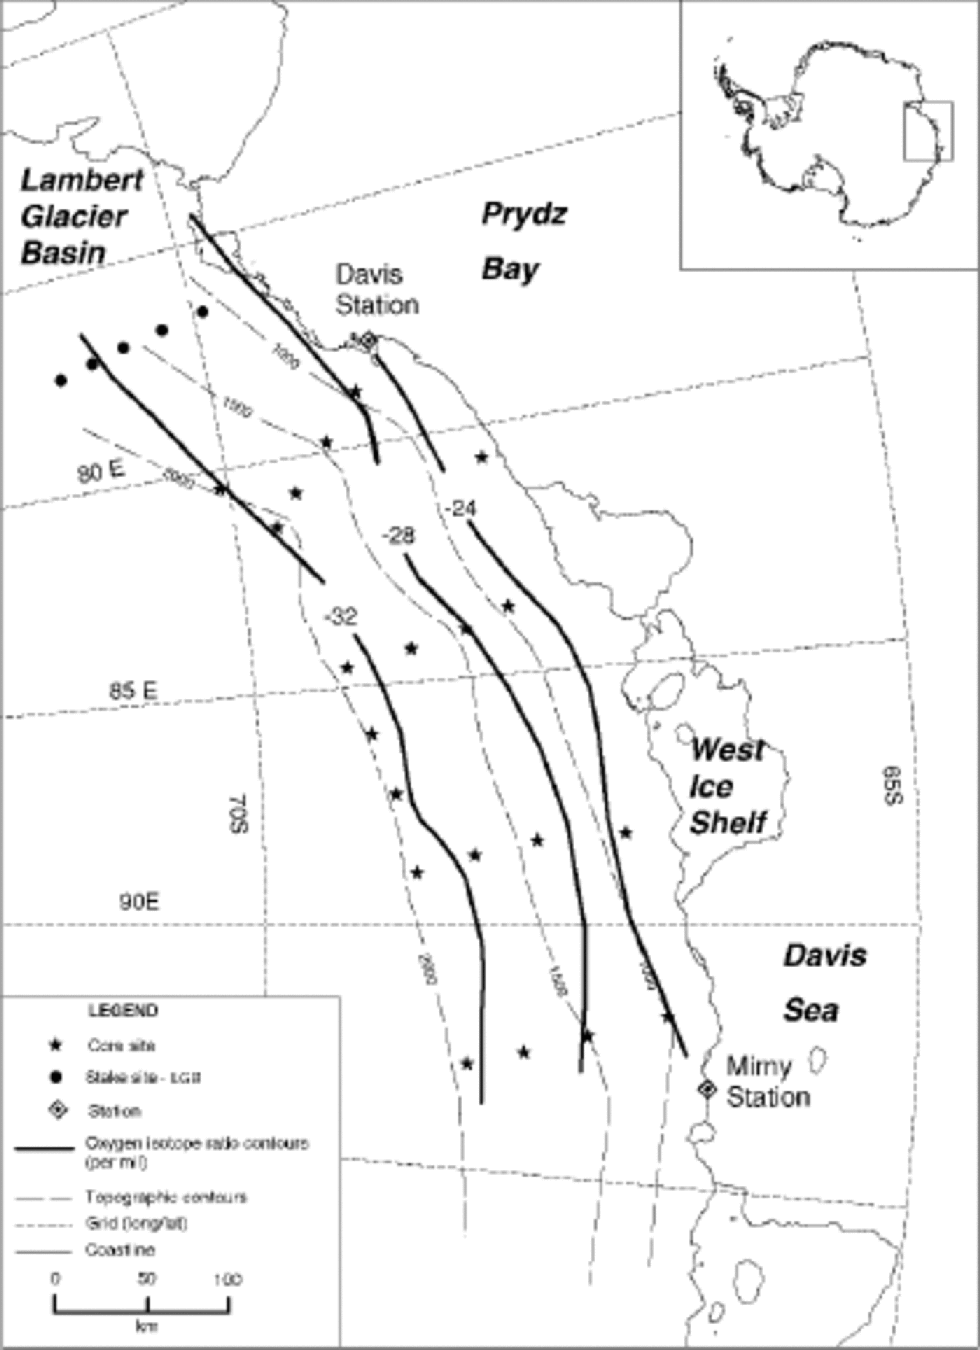
The average δ18O values for each site were determined by a simple average of all samples in one core. Each core covered more than three annual layers, so the average δ18O values are assumed to lie within 1‰ of the recent annual mean (Reference MorganMorgan, 1982). These values are contoured in Figure 3 with additional data from individual stake sites along the LGB traverse route (Reference Higham and CravenHigham and Craven, 1997;Table 1). the contour distribution in Figure 3 shows that δ18O and topographic contours are approximately parallel, with δ18O values decreasing linearly with increasing elevation at a rate of approximately –1‰ per 125 m elevation. the –22‰ contour is inferred to be near the coast, and –32‰ towards 2000 m elevation.
These new data fill a gap in the compilations of Reference MorganMorgan (1982) and Qin and others (1994), both of which were used by Reference Giovinetto and ZwallyGiovinetto and Zwally (1997) and Reference Zwally, Giovinetto, Craven, Morgan and GoodwinZwally and others (1998) to construct model distributions. the main difference between the respective distribution patterns is the position of the –20‰ contour in the vicinity of the grounding line of the West Ice Shelf. In Reference MorganMorgan (1982) this contour is on the continent, while later distribution patterns agree that this contour is on the West Ice Shelf. This latter result implies a significant continentality effect by the West Ice Shelf.
Accumulation
Accumulation data from adjacent areas (LGB and Mirny– Dome C traverse routes; Reference YoungYoung, 1979; Reference Higham and CravenHigham and Craven, 1997) were assimilated with data from this project for contouring as shown in Figure 4. In contrast to the δ18O contour pattern, there is no simple relationship between accumulation rate and elevation. Between 82˚ and 94˚E the accumulation-rate contours run approximately parallel to lines of latitude and therefore oblique to the coast. Near the West Ice Shelf the rate is 400 kg m–2 a–1, but it falls steadily to 300 kgm–2 a–1, forming a zone of relatively low accumulation with an axis along 68.4˚ S.Towards 69˚ S the rate rises back to 400 kgm–2 a–1.West of 82˚E the rates fall more steadily from 300 to 200 kgm–2 a–1 towards LGB.
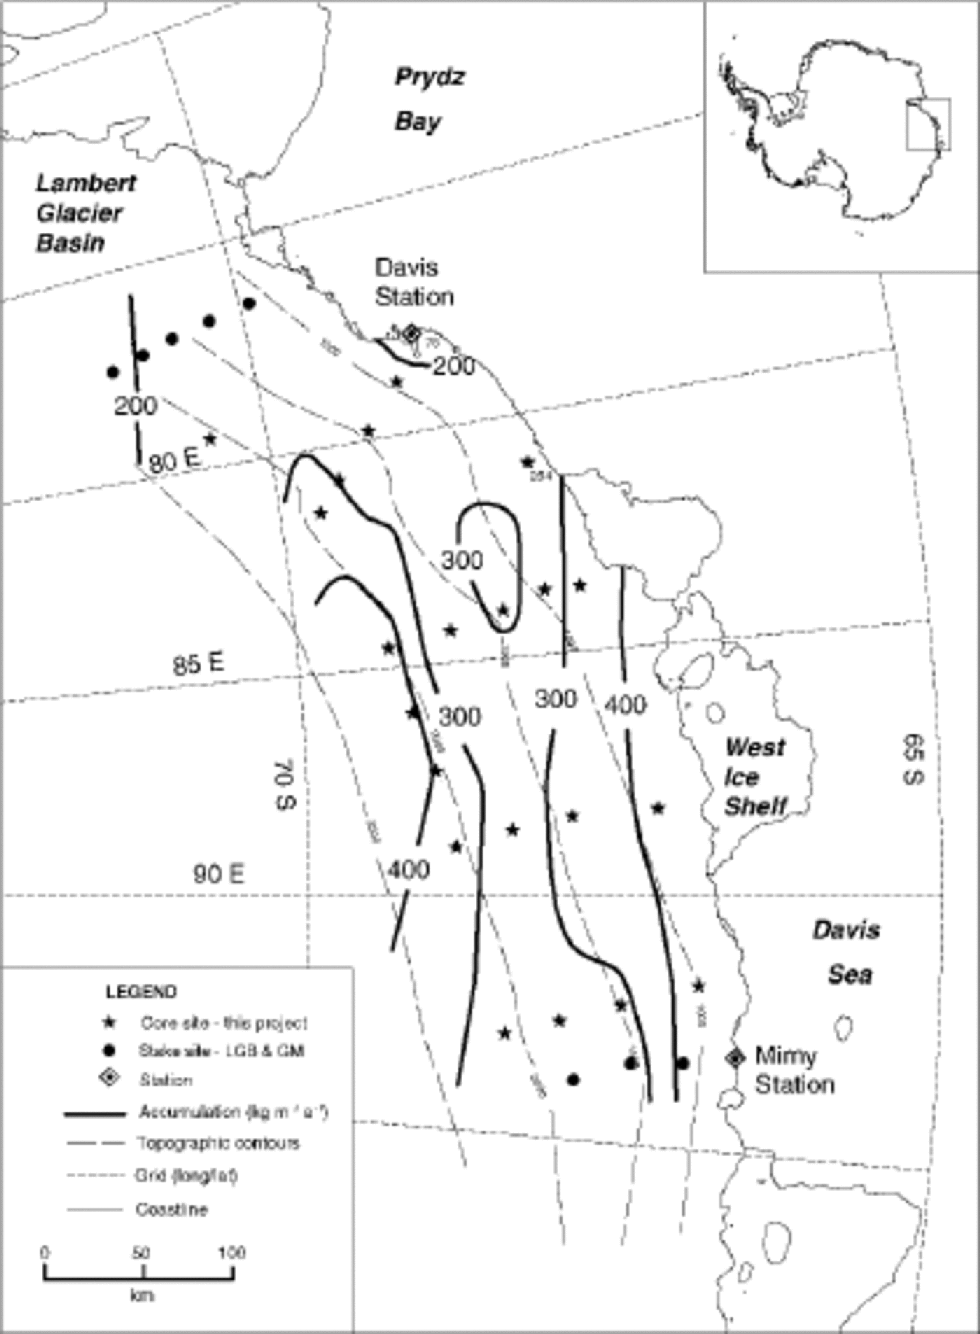
Fig. 4 Accumulation-rate contours showing a zone of relatively low accumulation rate of 300 kgm–2 a–1 along an axis of 68.4˚ S, compared with the coast near the West Ice Shelf and 2000 m elevation where the rate is 400 kg m–2 a–1. Towards LGB to the west the accumulation rate falls steadily from 300 to 200 kgm–2 a–1.
Discussion
Figure 5 presents several accumulation-rate profiles along the Mirny–Vostok and Mirny–Dome C traverse routes showing rates ranging from 400–800 kg m–2 a–1 at the coast to <50 kg m–2 a–1 at Vostok (1400 km inland). Accumulation rates have been measured periodically along this traverse for >30 years. Several profiles are included in Figure 5 to allow an appreciation of the variability between datasets. the profiles indicate two zones of accumulation relatively lower than the trend: 50–150 km and 230–350km from the coast. Projection of a parallel line of data from this project (approximately 30 km to the west) on to the traverse line shows there is good correlation between datasets, with similar distribution and the same lower accumulation zone within 150 km of the coast.
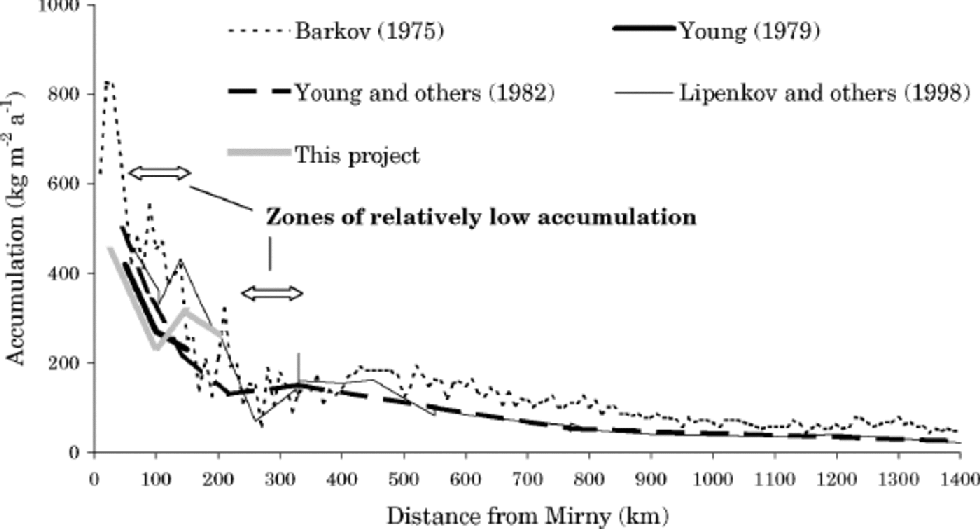
Fig. 5 Examples of accumulation rates along the Mirny–Vostok traverse route, showing two zones of relatively low accumulation between the coast and 400 km inland. Data from this project correlate with the outer zone of lower accumulation.
Given the similar characteristics between the Mirny– Vostok traverse route and the data from this project, it is expected that the accumulation rates south of the sampled area (at least within 200 km of the Mirny–Vostok traverse route) follow a similar pattern. Further sampling is required to confirm this suggestion.
Accumulation-rate distribution is believed to be influenced by the combined effects of surface wind outflow/inflow patterns and coastline morphology and interference of a standing wave in the atmospheric boundary layer that locally enhances and suppresses snowfall patterns as suggested by Reference Pettré, Pinglot, Pourchet and ReynaudPettré and others (1986). the trigger for this disturbance is thought to be the change from a gently sloping ice plateau to a relatively steep surface slope at about 2000 melevation.
Conclusion
The δ18O analysis from this investigation provides useful ground-truthing data for previous δ18O models, and used in conjunction with H2O2 and EC records has been used to infer accumulation rates across this region with sparse prior data. the results compare well at the boundaries with other accumulation studies in areas nearby, and provide detail for future Antarctic accumulation maps.
The complete dataset in Reference Smith and RuddellSmith and others (2001) indicates there is scope for further drilling at sites near Mount Brown (e.g. U5 in Fig. 2) where 1–2 century records could be derived as a contribution to the International Trans-Antarctic Scientific Expedition (ITASE; Reference Mayewski and GoodwinMayewski and Goodwin, 1996) program. Such drilling could provide data from a region with no palaeo-records and may be useful in linking longer-term inland continental records to coastal/ Southern Ocean records.
Acknowledgements
The authors would like to thank the field personnel A.Ruddell, M. King , R. Manson and the crews of Helicopters Australia.


