Introduction
The flexure of floating ice is an important process in the interaction between ocean waves and sea ice (Reference SquireSquire, 1978) and also in the interaction between slowly moving floating ice and sloping structures (Reference Sodhi, Lunardini, Sinha, Wang and GoffSodhi, 1987). The characteristic length of floating ice is the primary property of the ice/ water system that determines the flexural motion over the resulting length and time scales (Fox, in press). In this paper we present a new method for measuring the effective characteristic length at the rates and length scales that occur in flexural responses.
Ice covers are not usually homogeneous but, rather, are composites of ice of various thicknesses joined by ridges or refrozen cracks, etc. Often ocean-wave propagation generates flexure over scales that include many inhomogeneities. Hence, the mechanical properties, and characteristic length in particular, are well defined over scales for which the ice sheet is homogeneous, but take an effective, average, value over larger scales. Further, the effective Young’s modulus, and hence characteristic length, appears to vary with the period of flexure, with existing measurements showing a three-fold reduction in effective Young’s modulus from the static value to the value for forcing around 10 Hz (Reference DiMarco, Dugan, Martin and TuckerDiMarco and others, 1993). Our long-term interest is in in situ measurement of the characteristic length for homogeneous ice sheets as well as determining the effective characteristic length of actual, inhomogeneous, ice covers where we seek to quantify the dependence on forcing frequency and propagation scale.
The present evidence, that the effective characteristic length varies with the forcing frequency (Reference DiMarco, Dugan, Martin and TuckerDiMarco and others, 1993), is not predicted by modelling the ice sheet as a thin elastic plate with fixed flexural rigidity and mass density. Once the frequency dependence of effective characteristic length is measured, we envisage that it will be related to underlying physical, rate-dependent processes leading to better understanding of the local deformation processes that dominate in flexural motion, and improved models for ice flexure. Similarly, determining the largest scale over which the assumption of a homogeneous sheet is valid, i.e. for which a single effective characteristic length is adequate, will lead to improved models for wave propagation and scattering in actual fast-ice covers. The scale over which flexural-gravity wave scattering occurs in actual ice covers is presently unknown. Field measurements of the dependence of effective characteristic length on propagation distance can be used to calibrate models for the propagation and scattering of flexural wave energy, and also provide a way of probing those mechanical features of the ice sheet that are most important in determining long-range propagation of ocean-wave energy. In this paper we focus on the flexural response of an ice sheet using the model of a spatially homogeneous thin elastic plate to develop a method for making an in situ measurement of the effective characteristic length holding at a given frequency of flexure. An example of such a measurement is given.
Characteristic Length
When modelling single-frequency wave-ice interaction, where typical periods are 3−30 s with wavelengths of approximately 10−1000 m, a homogeneous ice sheet may be accurately modelled as a thin elastic plate (Reference SquireSquire, 1984; Reference Fox and SquireFox and Squire, 1991). The characteristic length lc, of the system is related to the effective Young’s modulus e (Reference Kerr and PalmerKerr and Palmer, 1972) of the plate via

where pis the density of water and

is the flexural rigidity of a homogeneous sheet of thickness h with Poisson’s ratio v. The second parameter (other than d or lc) defining the thin plate, usually taken to be the mass per unit surface area, has a minor quantitative role as inertial effects in floating ice may be neglected at all rates relevant to flexural motion (Fox, in press).
Reference WymanWyman (1950) showed that scaling distance by the characteristic length removed any physical parameters from the governing equations for static flexure of a floating ice sheet and gave the deflection η to a unit point load as

where r is the distance from the point load and kei is a modified Bessel function. Note that the physical properties of the ice sheet enter the solution in Equation (3) solely through the characteristic length. It should be noted that the static response of actual ice exhibits creep behaviour as well as a flexural response, so strictly Equation (3) defines the quasistatic flexural response, where quasi-static in this context implies that the motion is slow enough for hydrodynamic effects to be negligible but is faster than rates at which creep is significant. Since the deflection to an arbitrary load may be found as a superposition of the solutions in Equation (3), the quasi-static flexural response of a floating ice sheet to a given load is completely determined by its characteristic length. Consequently, scaling based on characteristic length is the primary means of relating field measurements of slow sea-ice flexure with laboratory-scale tests. In particular, characteristic length is the only function of the ice thickness, effective Young’s modulus and Poisson’s ratio that describes the flexural behaviour and, as observed by Reference Sodhi, Kato, Haynes and HirayamaSodhi and others (1982), should be scaled to compare ice-interaction tests. Reference Sodhi, Kato, Haynes and HirayamaSodhi and others (1982) also observed that calculation of characteristic length from those parameters contains uncertainty due to the approximate value generally assumed for Poisson’s ratio, and therefore that direct measurement of characteristic length is required for accurate test comparisons. It should be noted that the characteristic length determines the flexural response only, i.e. where bending of the ice sheet is the dominant physical process, and does not describe other possible responses such as shear or crushing where the deformations have structure through the thickness of the ice sheet.
One of the methods used to measure characteristic length is to apply a point load to the ice sheet, measure the resulting deflection at the point of load application and use Equation (3) to calculate characteristic length. This method (Reference AshtonAshton, 1986) is commonly used in test basins around the world because of its simplicity. However, it is not possible to use it directly in the field, as a vertical reference is not available.
Several attempts have been made to extend the quasistatic technique for field application. Reference SodhiSodhi (1985) measured surface tilt near a helicopter that landed on, and hence loaded, the ice sheet, with characteristic length calculated by fitting the derivative of Equation (3) to measurements. Sodhi reports that the measurements were subject to noise from sea swell, but nevertheless made two successful measurements. Reference Fox, Wilcocks and HaskellFox and others (1996) measured the pressure at the lower surface of the ice to determine the vertical deflection of a sea-ice sheet loaded by driving a heavy vehicle up to the measurement location. They calculated the (static) characteristic length and from that the effective Young’s modulus, and reported results consistent with the effective Young’s modulus calculated using the temperature and salinity profile of cores taken near the site. Despite that correspondence between the flexural measurement and the physical-properties approach, it should be noted that the latter, semi-empirical, relationship does not allow any frequency dependence or effective spatial dependence to be measured.
Dynamic Measurement Procedure
As mentioned above, existing measurements indicate that the effective Young’s modulus, and hence characteristic length, have a lower dynamic than static value (Reference DiMarco, Dugan, Martin and TuckerDiMarco and others, 1993). DiMarco and others used the term dynamic to refer to any oscillating motion, but here we take it to mean the more precise statement that inertial and hydrodynamic forces are significant, which can be shown to be the case for periods that are not substantially greater than the characteristic time, defined later (Fox, in press). So the static measurements are not necessarily relevant to the comparison between observations of responses in which dynamic flexure is the dominant process. Previous dynamic measurements have been based on the relationship between frequency and the wavelength of the travelling wave, using relatively high-frequency loading provided by a vibrating helicopter (Reference DiMarco, Dugan, Martin and TuckerDiMarco and others, 1993) or moving loads (Reference Squire, Hosking, Kerr and LanghorneSquire and others, 1996). The latter exploits the minimum phase speed that occurs at the wavelength ![]() (Reference Doronin and KheisinDoronin and Kheisin, 1977). However, neither of these mechanisms allows us to examine the spatial characteristics of characteristic length across the range of frequencies of interest. Instead we have developed a stationary dynamic loading device, described next, along with methods for analyzing near-field measurements of the flexure.
(Reference Doronin and KheisinDoronin and Kheisin, 1977). However, neither of these mechanisms allows us to examine the spatial characteristics of characteristic length across the range of frequencies of interest. Instead we have developed a stationary dynamic loading device, described next, along with methods for analyzing near-field measurements of the flexure.
Mechanism for local dynamic loading
A localized oscillating loading mechanism (Fig. 1) has been developed within the New Zealand programme of sea-ice studies. A block is cut from the ice sheet, and a gantry is placed over it with a two-directional hydraulic ram attached to the block. Using servo control, the block is lifted out of the sea water and lowered back into the water with a period and waveform under computer control.
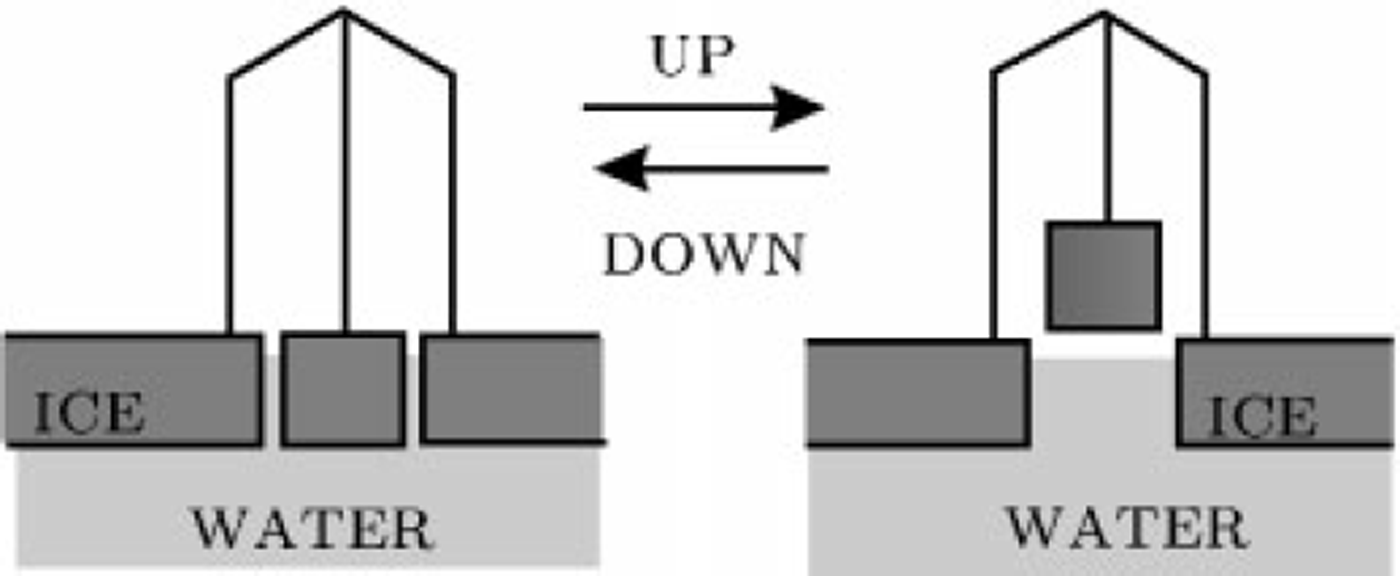
Fig. 1. Schematic drawing of the mechanism for stationary periodic loading a block of ice is cut and lifted up and down.
When the block is floating in the water (down position), only the relatively small weight of the gantry and hydraulics is resting on the ice. However, when the block is completely out of the water (up position) the weight of the block also acts as a downward force through the legs of the gantry. Since inertial forces are small at the periods of interest (3−30 s), a block of mass m results in a periodic forcing of the ice with amplitude mg/2. We have used a rig of this design on the sea ice in McMurdo Sound, Antarctica, and results from that fieldwork are presented later.
Dynamic solution
Extending the static method for measuring characteristic length to a stationary dynamic method requires the functional form of the response of the ice sheet to the loading. Because the hole cut in the ice sheet has negligible effect on the resulting motion of the ice sheet (Reference Dempsey, Slepyan and ShekhtmanDempsey and others, 1995) we can find the solution for the simpler model of an infinite thin elastic plate floating on a hydrodynamic base. For that model, the vertical displacement of the ice sheet, η(x, y, t), with flexural rigidity d, floating on incompressible water of depth h is related to the (upward) pressure applied on the ice, pa(x,y,t), by the system of differential equations and boundary conditions (Reference Fox and SquireFox and Squire, 1994)

where φ(x, y, z, t) is the velocity potential in the water, ρ is the density of water, and m is the mass density of ice (per unit surface area) of the ice sheet. Time-harmonic forcing that has unit magnitude and is localized at the origin is described by setting p a = δ(x, y) expivt, with the displacement of the ice then expressed as Re[η(r)
exp iωt]. Here w is radial frequency and
η(r) is the complex displacement as a function of distance from the point of forcing ![]()
The solution to this system was given by Reference Fox and ChungFox and Chung (1998), which is

where the sum is over the set ^’consisting of the zeros of the dispersion equation
that are positive real or have positive imaginary part. Here ![]() is a Hankel function of the first kind, and
is a Hankel function of the first kind, and

is the residue of the Fourier transform of η at its pole q, and we have written u = 1 - mω2 for brevity. The set K is shown (not to scale) in Figure 2. The dispersion equation always has one positive real zero qt
corresponding to an outward-going travelling wave, two complex roots with positive imaginary part, qd
and ![]() giving decaying travelling waves, and a countably infinite number of pure positive imaginary zeros, qn n = 1, 2, • • •, each giving an evanescent wave (Reference Fox and SquireFox and Squire, 1994).
giving decaying travelling waves, and a countably infinite number of pure positive imaginary zeros, qn n = 1, 2, • • •, each giving an evanescent wave (Reference Fox and SquireFox and Squire, 1994).
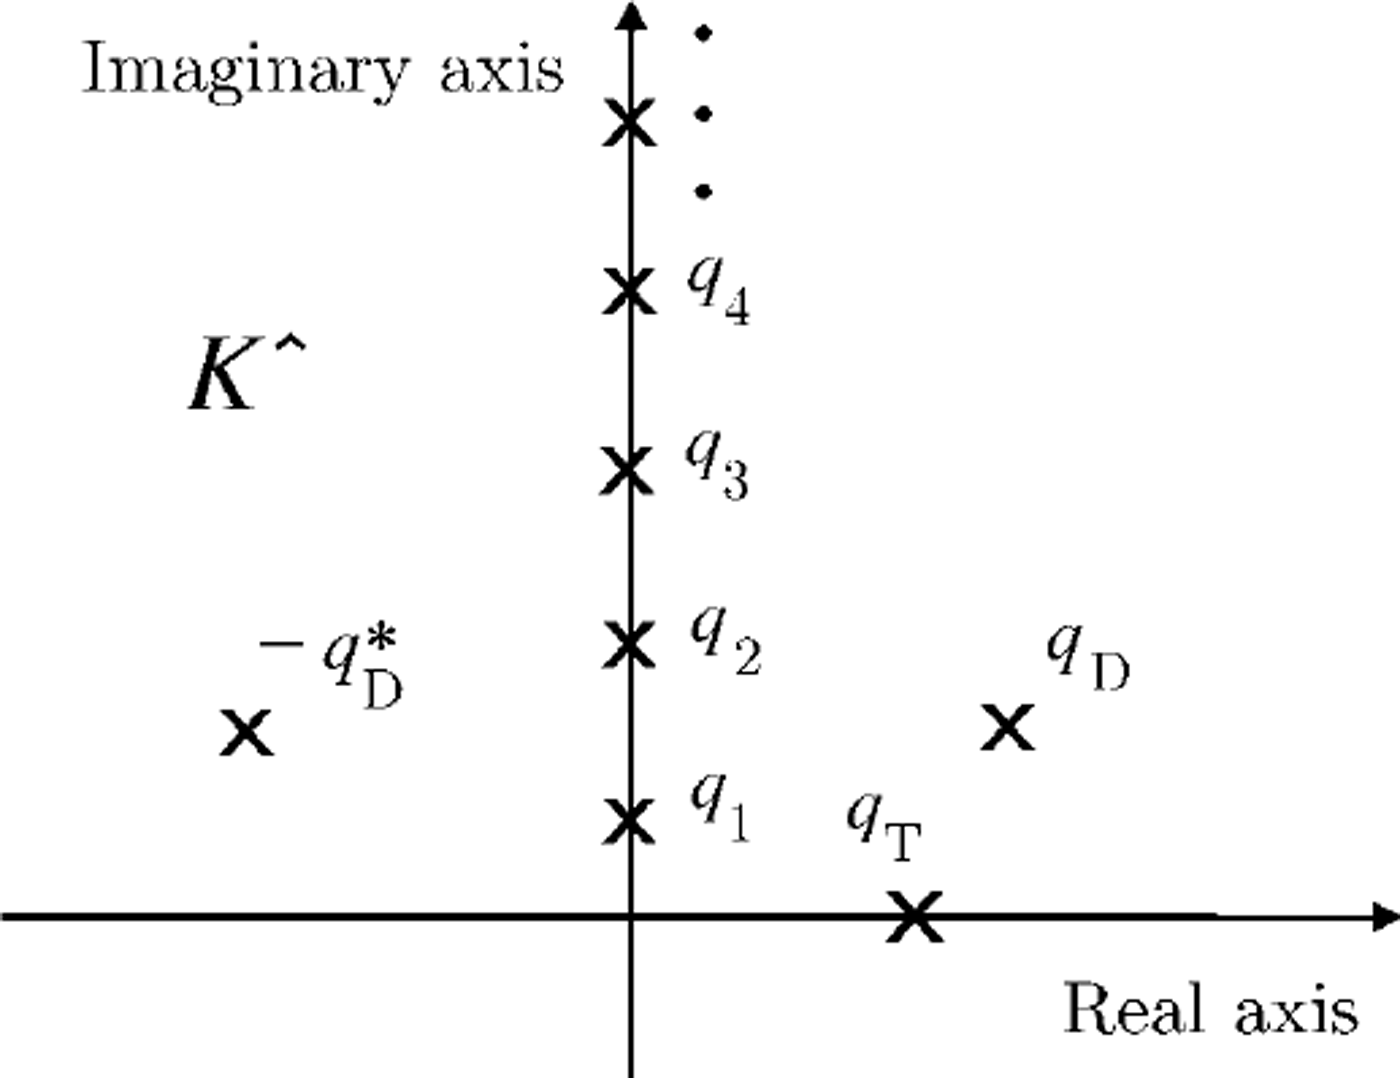
Fig. 2. Schematic of the roots of the dispersion equation in K.
By examining the roots of the dispersion equation, it is possible to show that deep-water solutions depend only on the non-dimensional frequency ωtc,
where ![]() is the characteristic time (Fox, in press). Unit non-dimensional frequency sets the transition between quasi-static solutions and dynamic solutions. When ω ≪ l/tc the response is essentially just the static, Wyman solution moving in phase with the forcing, while when ω ≫ 1 / t c energy is transferred from the loading to the ice sheet, and an appreciable outward-propagating wave is generated. Maximum coupling between the load and the ice/water system occurs at close to unit non-dimensional frequency.
is the characteristic time (Fox, in press). Unit non-dimensional frequency sets the transition between quasi-static solutions and dynamic solutions. When ω ≪ l/tc the response is essentially just the static, Wyman solution moving in phase with the forcing, while when ω ≫ 1 / t c energy is transferred from the loading to the ice sheet, and an appreciable outward-propagating wave is generated. Maximum coupling between the load and the ice/water system occurs at close to unit non-dimensional frequency.
Local measurements
The motion of the ice sheet may be measured using a variety of sensor types. The vertical displacement of the ice sheet, if measured, would allow direct comparison with the functional form of the motion derived from the models for flexural motion. However, displacement is difficult to measure directly in the field because of the lack of a stationary reference. We have previously used measurement of pressure at the lower surface of the ice (Reference Fox, Wilcocks and HaskellFox and others, 1996) as a measure of vertical displacement, though that measurement suffered from low sensitivity and was noise-prone. A number of other measures of the motion are possible, such as the surface slope (tilt) or curvature (strain), or the dynamic nature of the response may be utilized by measuring surface velocity or acceleration.
We now discuss measurements based on acceleration or strain as a function of frequency, as well as the measurement of strain at a single frequency used in the experiments described later.
The displacement at the point of forcing can be written as (Reference Fox and ChungFox and Chung, 1998)

One appealing technique is based on measuring the acceleration close to the point of forcing. This measurement has the advantage that the loading and measurement equipment may be located at the same place, giving the possibility of a self-contained and portable means of measuring characteristic length. The acceleration close to the loading has the complex amplitude −ω2η (0), which is shown as a Bode plot in Figure 3 for the two non-dimensional water depths H/lc = 0.2π (shallow water) and H/lc = 2π (deep water). Note that the magnitude of the acceleration is monotonically increasing with frequency and is given by straight fines on the log-log graph, with a change in slope occurring near unit non-dimensional frequency. Note also that the magnitude of acceleration is slightly different for the two water depths, particularly near ωtc = 1. Measurements based on the magnitude of the acceleration require accurate knowledge of the mass of the block. A more robust measure would be to use the phase of the acceleration with respect to the forcing, which is also monotonically increasing, with frequency going from zero in the quasi-static regime through to π/2 at high frequency. For example, one procedure could be to sweep frequency to locate the relative phase of 0.9, which is where the shallow-water and deep-water phases coincide (at about ωtc = 0.9), to give a measure of characteristic time that is independent of the water depth. The radial frequency ω is then converted to characteristic length by lc = 0.92g/ω2.
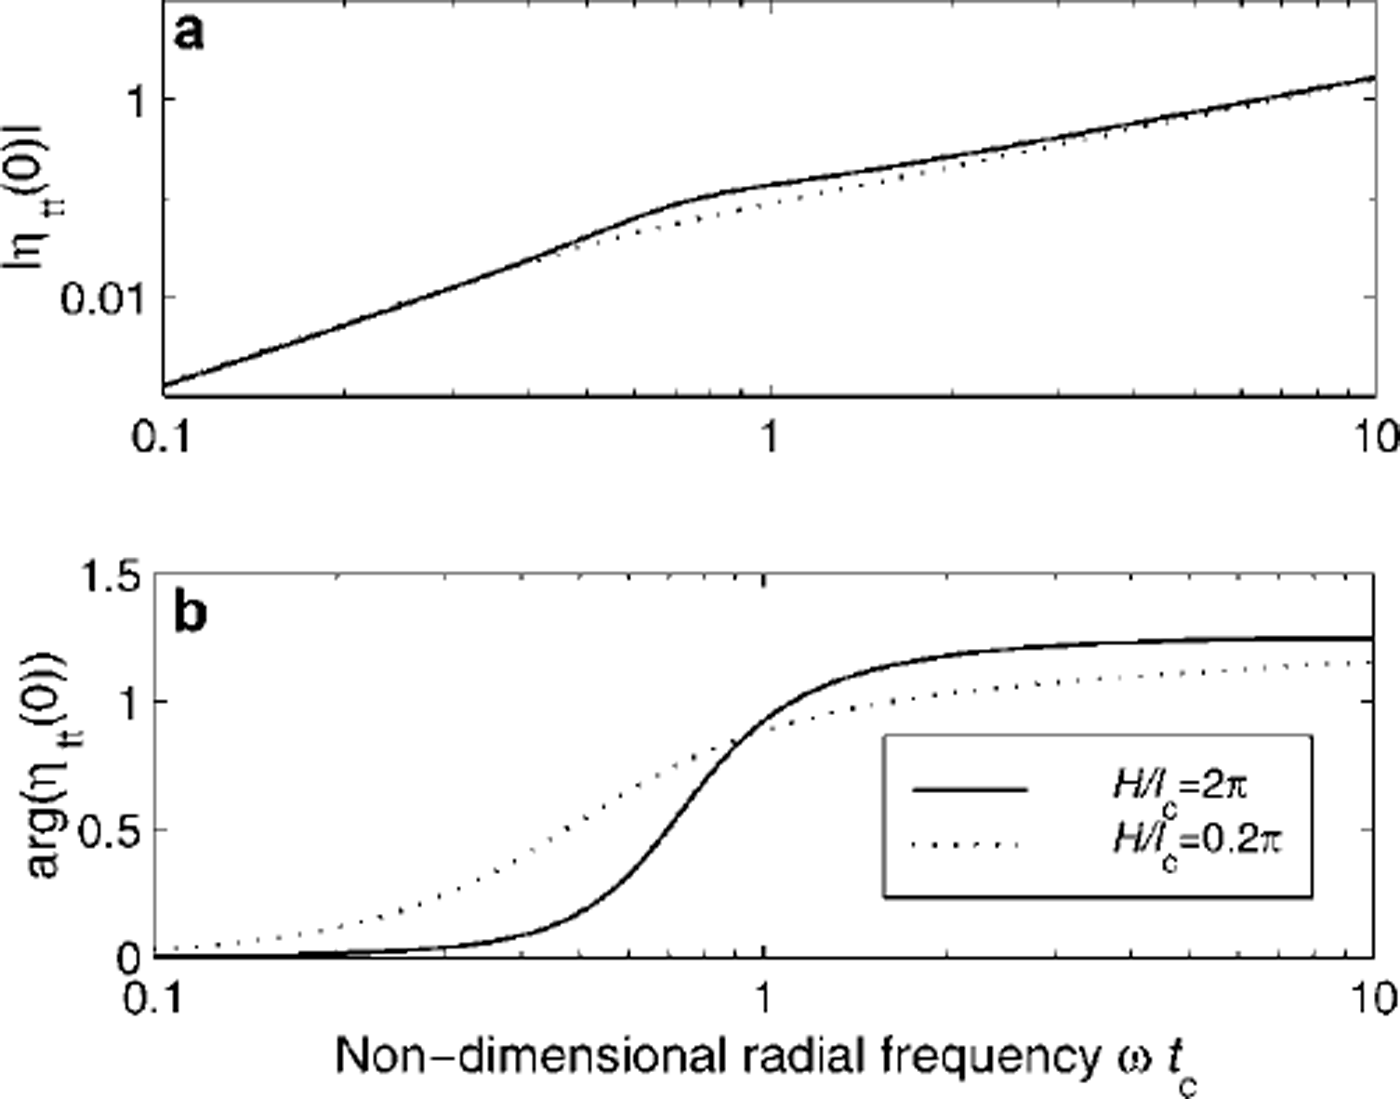
Fig. 3. Magnitude (a) and phase (b) of normalized vertical acceleration at the point of forcing, as a function of non-dimensional frequency.
A second possibility is to measure the curvature (or strain) at the upper surface of the ice near the location of forcing. For a uniform ice sheet of thickness h, strain is proportional to the curvature of the ice sheet (Reference Fox and SquireFox and Squire, 1994) and is

Figures 4 and 5 show the magnitude and phase of the normalized strain, ![]() as a function of non-dimensional frequency, ωtc, and non-dimensional distance, r/lc, from forcing in the case when the water depth is H/lc = 2π, i.e. deep water. Note that plots of magnitude and phase of strain have reversed distance axes for ease of viewing. Figure 4 shows that the magnitude of strain in the near field, r < lc, changes rapidly with r. Because both the strain gauge and the loading mechanism have finite size, it is problematic to determine the strain at a point to fit to the graph of magnitude. If instead the strain gauges are placed in the region r ≳ lc, where the magnitude of strain changes little with respect to distance from the forcing, then by sweeping the frequency and finding the frequency where the dip in magnitude occurs, the characteristic frequency and hence length may be determined without accurate knowledge of the geometry. A more robust measure, that does not require accurate knowledge of the magnitude of forcing, is to use the feature in Figure 5, which shows that for r ≳ lc
the phase of strain has a minimum value at ω ≈ 0.9, and the frequency of the minimum is an insensitive function of distance. Hence, robust measurements can be made in the region r ≳ lc
by finding the frequency where the dip in phase occurs to determine characteristic time and length.
as a function of non-dimensional frequency, ωtc, and non-dimensional distance, r/lc, from forcing in the case when the water depth is H/lc = 2π, i.e. deep water. Note that plots of magnitude and phase of strain have reversed distance axes for ease of viewing. Figure 4 shows that the magnitude of strain in the near field, r < lc, changes rapidly with r. Because both the strain gauge and the loading mechanism have finite size, it is problematic to determine the strain at a point to fit to the graph of magnitude. If instead the strain gauges are placed in the region r ≳ lc, where the magnitude of strain changes little with respect to distance from the forcing, then by sweeping the frequency and finding the frequency where the dip in magnitude occurs, the characteristic frequency and hence length may be determined without accurate knowledge of the geometry. A more robust measure, that does not require accurate knowledge of the magnitude of forcing, is to use the feature in Figure 5, which shows that for r ≳ lc
the phase of strain has a minimum value at ω ≈ 0.9, and the frequency of the minimum is an insensitive function of distance. Hence, robust measurements can be made in the region r ≳ lc
by finding the frequency where the dip in phase occurs to determine characteristic time and length.

Fig. 4. Magnitude of the normalized strain for deep water, as a function of forcing frequency and distance from the forcing
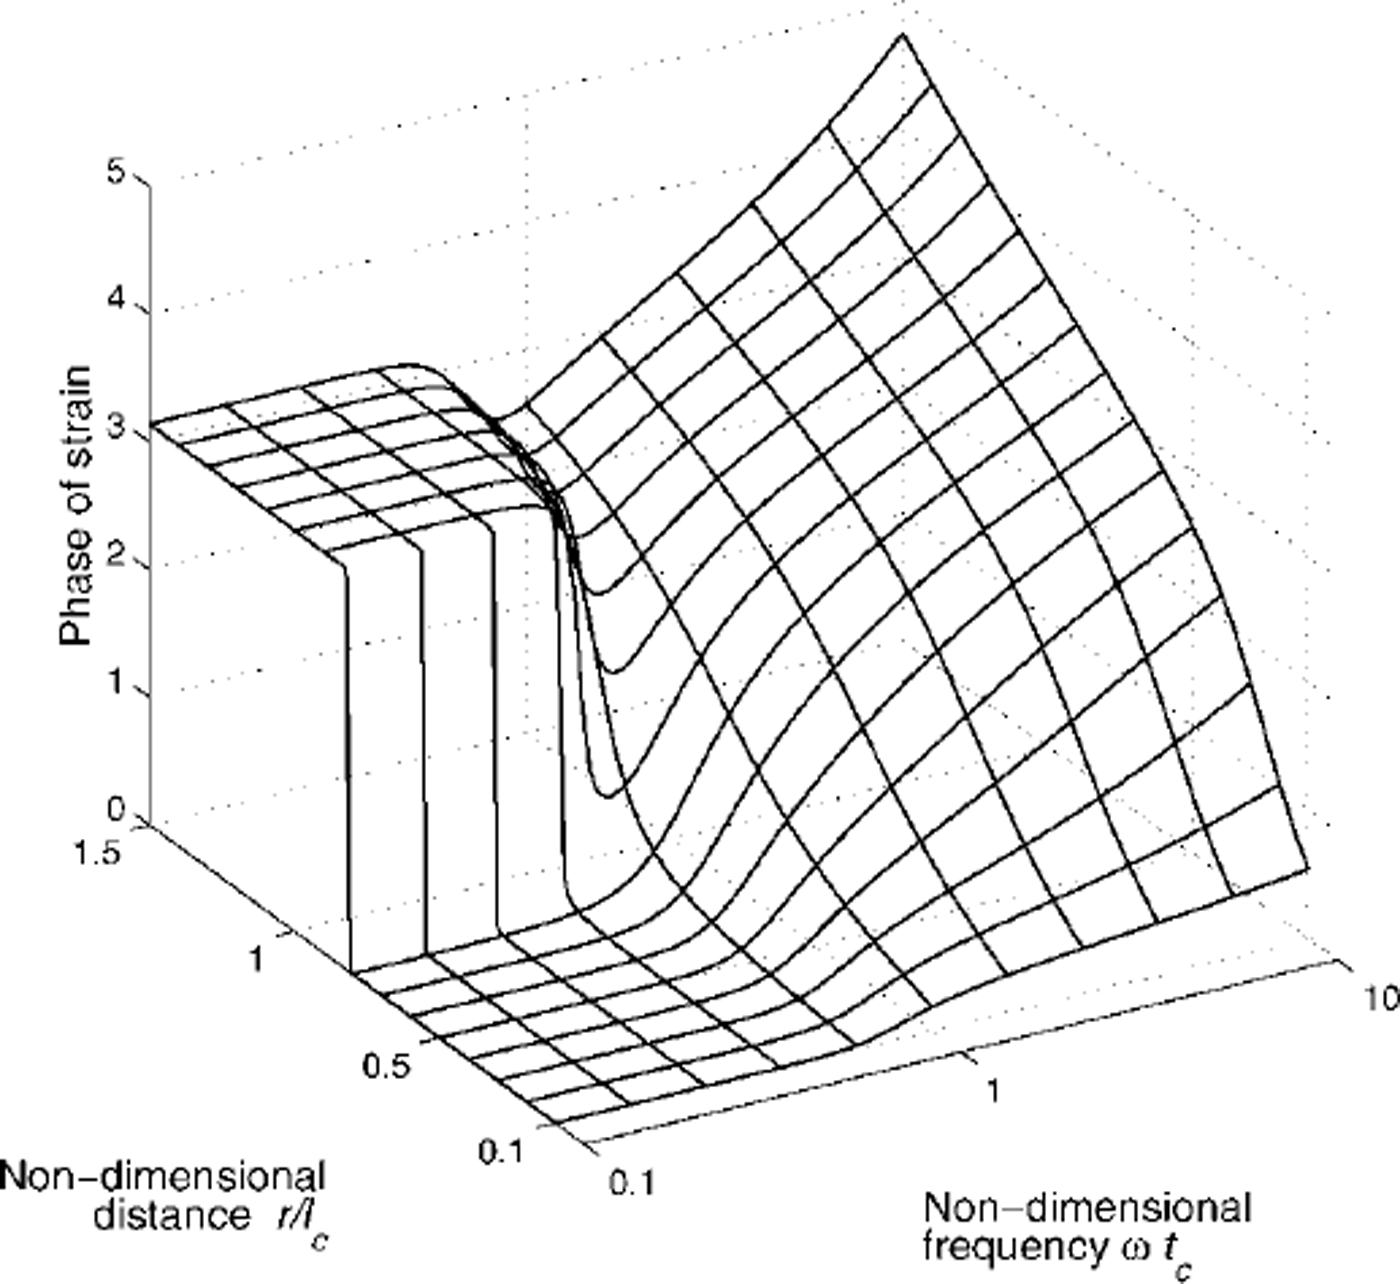
Fig. 5. Phase of the strain for deep water, as a function of forcing frequency and distance from the forcing.
In our field experiments, we measured the phase of the strain, with respect to the forcing, at various distances from the loading for a single frequency of forcing. Then the characteristic length can be found by fitting the argument of the strain in Equation (6) to the measured phases. This measurement procedure requires accurate knowledge of the distances and a computational fitting procedure. However, as we show in the next section, a good estimate of the characteristic length may be made this way.
Experimental Results
Figure 6 shows the loading rig deployed in October 1998 on first-year sea ice in McMurdo Sound, with the hydraulic ram having partially lifted the block out of the water. The rig stands on legs that form a square with 2 m sides, and the square block cut from the sheet had sides of approximately 1.5 m. The ice at this location was close to 1.75 m thick, but we could not lift the block entirely out of the water, as the hydraulic pump limited the maximum lift to about 0.4 m at the periods of around 10 s that we used. The peak force generated was therefore approximately 8000 N. The water depth was close to 30 m, and air temperature was around -20°C.

Fig. 6. View of the measurement set up on the sea ice off cap e evans, mcmurdo sound, antarctica, in october 1998. the block of tee can be seen partially lifted out of the water, and the instrumentation is in the sledge box to the left.
Three strain gauges, having length 0.5m, were placed with centres 7.3, 9.3 and 11.3 m from the centre of the rig. During operation the strain was digitized and recorded each 0.5 s, the resolution being 1 bit = 5.4 × 10⁻¹⁰ strain, though noise was about four times this number. The force applied to the ice was measured using a load cell between the hydraulic ram and the ice block, also digitized each 0.5 s. Note that 2 Hz is well above the Nyquist frequency for the signals encountered, and so this modest sampling rate is sufficient to unambiguously determine the various waveforms.
The load was cycled with period 9.26 s for 500 s and we synchronously demodulated the data to extract the phase of the strain with respect to the forcing, at the forcing frequency. The measured phases are shown by circles in Figure 7. The best-fit curve, found by adjusting the characteristic length and using the other measured parameters, is shown as a solid line and gives the characteristic length of 17.7 m. Since the theoretical response of the ice sheet does not depend strongly on the ice-sheet thickness (for a given characteristic length) or water depth, this estimate of characteristic length was insensitive to the precise water depth and the ice thickness used, so those parameters do not need to be measured accurately. Using the measured ice thickness, we find that the effective Young’s modulus is close to 2 × 10⁹ N m−2. For comparison, the phase that would be expected for the effective Young’s modulus of 6 × 10⁹ N m−2 is shown as a dotted line in Figure 7. That value was chosen as it has previously been taken as a typical value for the Young’s modulus of the ice sheet in McMurdo Sound (Reference SquireSquire, 1993). It is clear that the measured phases (for 9.26 s period motion) are inconsistent with the latter value, and we also see that the method described here easily resolves these two values of Young’s modulus.
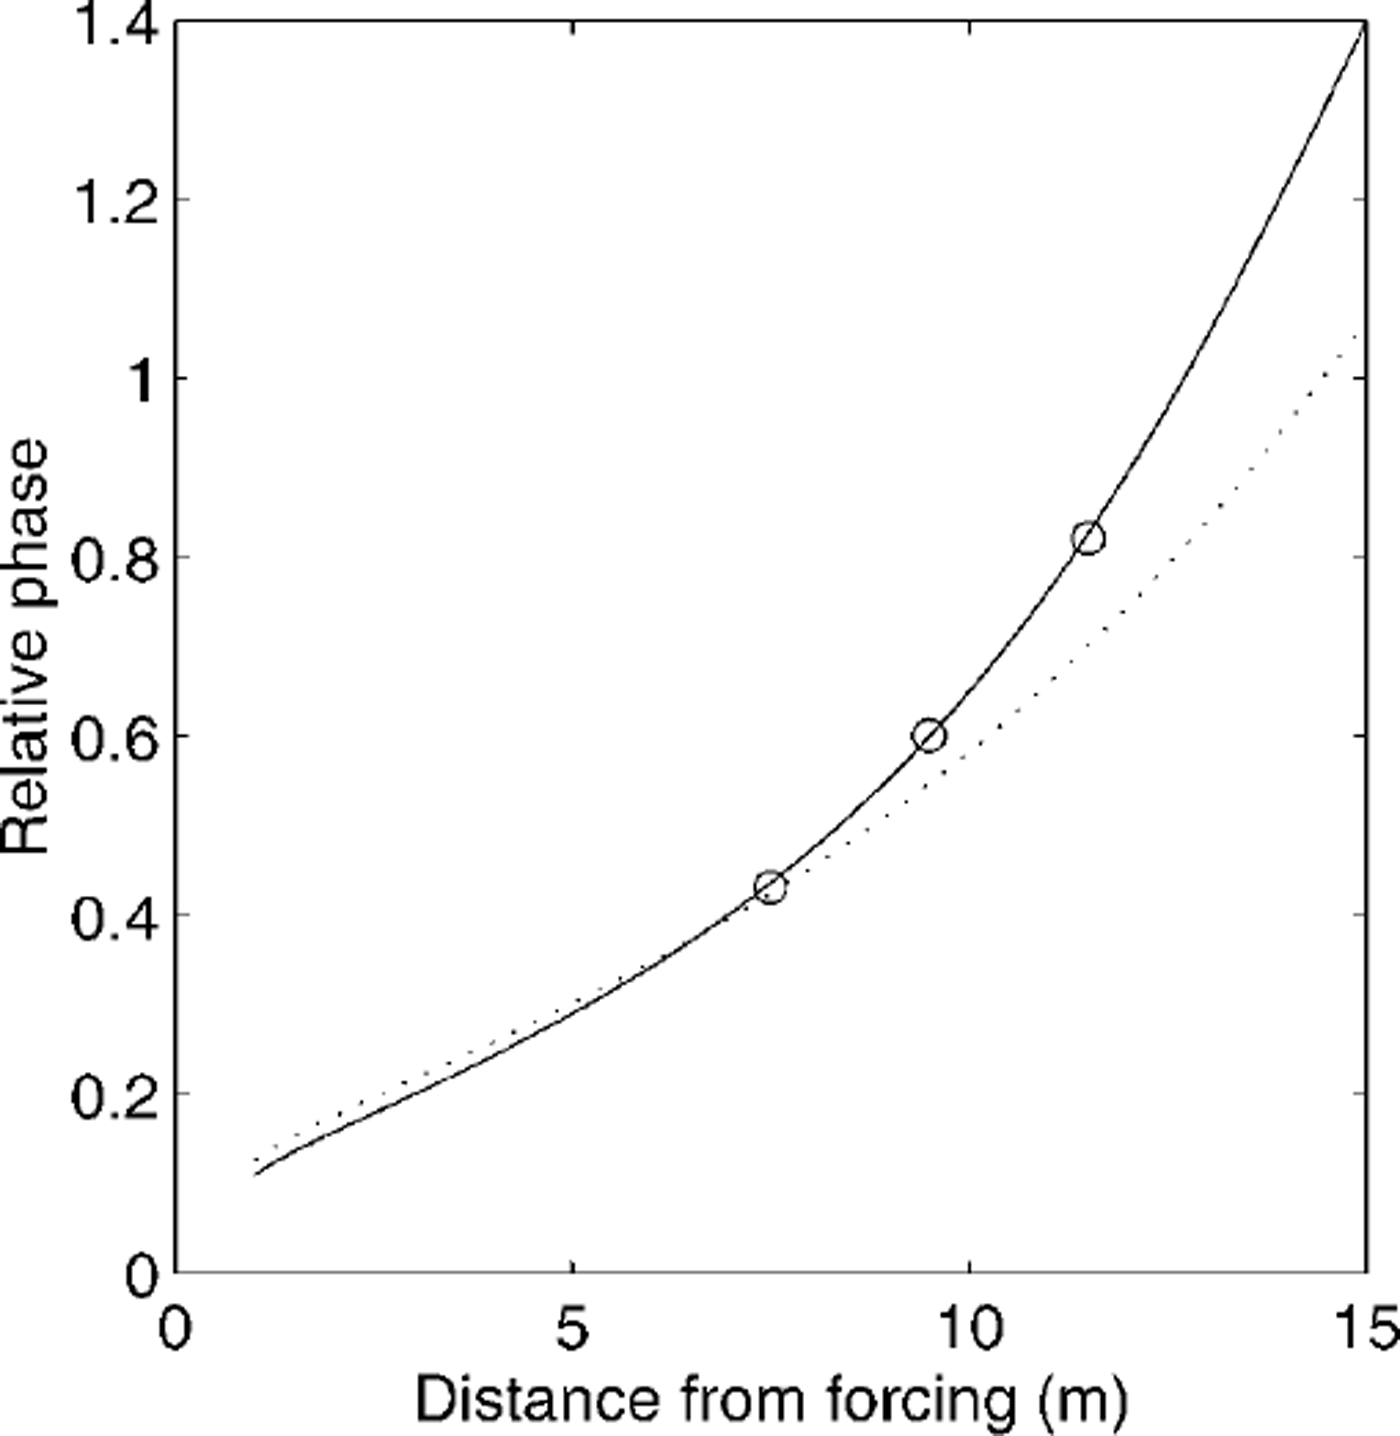
Fig. 7. The measured phases (circles), best fit phase (solid line) giving lc = 17.7 m (E ≈ 2× 10⁹ n m-2) and phase using E=6× 10⁹ Nm-2 (dotted line) for comparison, as a function of distance from forcing.
Summary and Conclusions
A dynamic method has been developed and applied to estimate the effective characteristic length of a first-year ice sheet. The dynamic method uses a stationary oscillating load with measurements of surface strain fitted to the theoretical solution for a homogeneous thin plate floating on a hydrodynamic base. Various possible measurement types were discussed, with experimental results presented using measurements of the phase of the strain at a single frequency. Because the forcing is controlled, the measurements may be synchronously demodulated over any length of time to give any desired rejection of measurement noise.
The effective Young’s modulus estimated this way is very close to the dynamic value measured by Reference DiMarco, Dugan, Martin and TuckerDiMarco and others (1993) at higher frequencies in multi-year sea ice. While their measurements and ours were made at similar air temperatures, there is no way of comparing the structure of the ice. We also found that the dynamic characteristic length implies an effective Young’s modulus that is substantially less than the value 6 × 10⁹ N m-2 which has previously been taken as a typical value.
In summary, we conclude that it is feasible to measure the dynamic characteristic length of ice sheets by forcing the ice and using localized measurements of the flexural response. Because the response is due to bending at the periods and length scales of interest, the resulting value is the characteristic length relevant to flexural motion. A portable version of the equipment used (e.g. sledge-mounted) would enable rapid and straightforward measurement of field values to enable comparison with laboratory-scale results.
The variation of characteristic length with frequency and distance remains a topic of interest. Future research will determine the details of how the characteristic length varies as a function of frequency of flexure and propagation distance, and what mechanisms are involved.
Acknowledgements
This work was made possible by grants from the Foundation for Science Research and Technology and the Marsden Fund.


