Introduction
Due to its climatic and physical conditions, Iceland presents an ideal test site to monitor various geo-dynamic processes. At present, ∽11% of the 103 000 km2 volcanic island is covered by glacier, represented mainly by four large ice caps: Vatnajökull (8100km2); Langjökull (953 km2); Hofsjökull (925km2); and Mýrdalsjökull (596km2) (Reference BjörnssonBjörnsson, 1978). The huge ice masses of these glaciers cover several volcanic systems with central volcanoes, crater chains and fissures (Reference Björnsson and EinarssonBjörnsson and Einarsson, 1990). The rift zone of the Mid-Atlantic ridge, which superficially crosses the island, is responsible for the high seismic and volcanic activity.
The southern part of this highly active Neovolcanic Zone, underlying the ice caps of Mýrdals- and Vatnajökull, has been the focus of several ESA earth observation projects since 1995. At present, ENVISAT-ASAR collects SAR data on a regular basis within the project ‘Hazard Assessment and Prediction – Long-term Observation of Icelandic Volcanoes and Glaciers Using ENVISAT-ASAR and Other Radar Data’ (ESA, ID142). The ASAR instrument is a side-looking C-band SAR antenna operating at a wavelength of 5.6 cm, where the image swaths IS2 (incidence angle 21.58) and IS5 (incidence angle 37.58) are continuously acquired over Vatnajökull ice cap for monitoring the subglacial volcanic activities.
On 1 November 2004 (ca. 22:00 GMT) a 6 day eruption at Grímsvötn caldera (a subglacial volcanic system beneath the western part of Vatnajökull) began, resulting in a tephra fall over part of the ice cap. This tephra layer was subsequently buried by snow during the following winter season.
Visual inspection of the SAR data acquired after the 2004 Grímsvötn eruption showed a distinct backscatter signal over the area where the ash was deposited. Further, significant temporal differences were observed in the SAR backscatter signals over the ash fan. These differences appear to be related to the snow accumulation history and suggest that the ash deposits can be used as a time reference marker for estimating accumulation rates by the analysis of time sequential SAR backscatter data. Due to the continuous SAR acquisition, the available data series provide a very valuable data basis for the investigation of snow accumulation history using the 2004 ash layer as a time reference marker. Given that the tephra layer does not change during time after becoming covered by snow, the observed changes in the backscatter signal should be predominantly related to changing backscatter conditions in the overlying snow pack. Apart from melt effects, which were excluded from the analysis, accumulation is the major parameter changing the conditions of the snow pack. The relation between SAR backscatter values and accumulation rates was determined by linear regression analysis between ground truth accumulation data and the temporal evolution of the SAR backscattering coefficient (σ 0) at the locations of two snow pits. With this approach it should be possible to estimate the accumulation distribution over large areas with a high temporal resolution for all regions where such reference horizons exist.
Test Site
Vatnajökull is a temperate ice cap located on the southeast coast of Iceland (Fig. 1). The glacier extends 150 km from west to east and 100 km from south to north. The entire ice cap is highly dynamic and ice surface velocities of 60–80 ma–1 at outlet glaciers are typical (Reference AdalgeirsdóttirAdalgeirsdóttir, 2003). The maritime climate in South Iceland is strongly influenced by the warm North Atlantic current, passing the south and east coast of the island. Due to relatively low summer temperatures and heavy winter precipitation, Vatnajökull shows high rates of surface mass exchange (Reference AdalgeirsdóttirAdalgeirsdóttir, 2003). Melting occurs in the accumulation area even during winter, which also influences the quality of SAR data acquired during these periods.
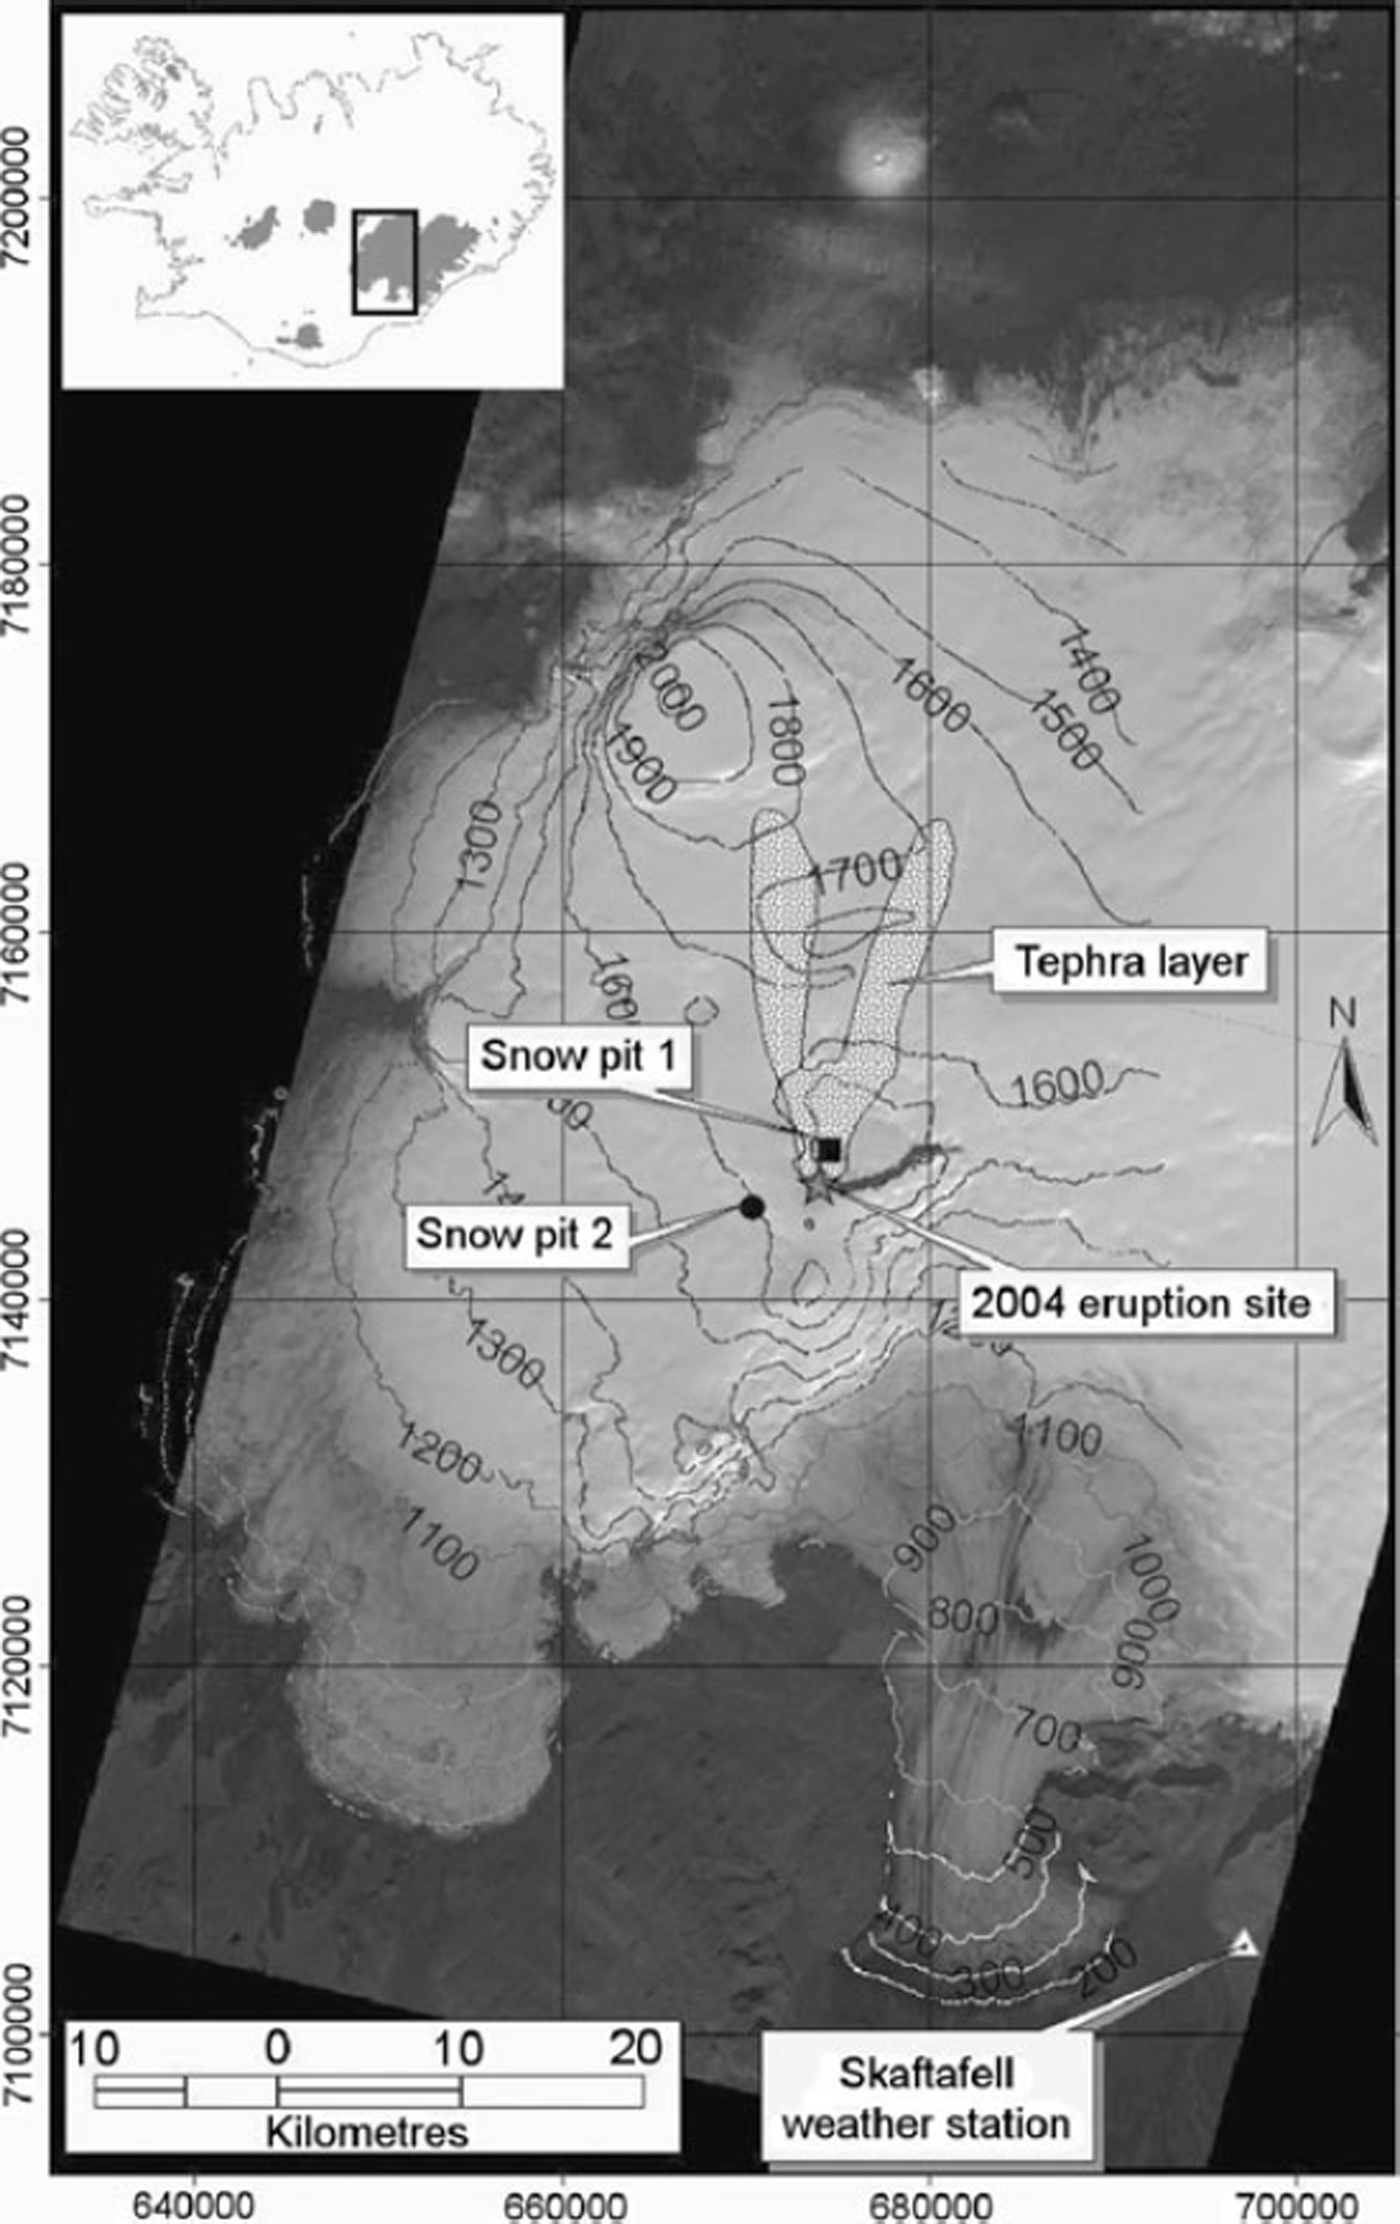
Fig. 1. ASTER-Mosaic (27 September 2004) of the western part of Vatnajökull, showing the location of the 2004 eruption vent, the extent of ash deposits, pit locations and Skaftafell weather station. The coverage is shown on the insert map (top left). Map projection: UTM, WGS 848 N, Zone 27.
Our investigations focus on the larger region of Grímsvötn caldera, situated in the central part of western Vatnajökull. The southern rim of the caldera protrudes through the ice cover at an elevation of 1722 ma.s.l., whereas the rest of the crater rim is covered by the ice cap. The caldera itself (∽1450ma.s.l.) is filled by the geothermally-fed subglacial lake Grimsvötn, which itself is overlain by glacier ice up to 250m thick, forming the inner surface at ∽1450ma.s.l. (Reference Björnsson and EinarssonBjörnsson and Einarsson, 1990).
Continuous mass balance observations have been carried out on the western and northern outlets surrounding the Grímsvötn caldera since 1991 (Reference AdalgeirsdóttirAdalgeirsdóttir, 2003). On the western part of Vatnajökull, the equilibrum line altitude (ELA) is located at 1200–1400ma.s.l. (Reference Björnsson, Palsson, Adalgeirsdöttir and GuðmundssonBjörnsson and others, 2005).
During the last several hundred years, Grímsvötn was the most active volcano beneath Vatnajökull (Reference Guðmundsson and BjörnssonGuðmundsson and Björnsson, 1991). Due to the ice cover, eruptions of Grímsvötn are phreato-magmatic. The most recent eruption occurred between 1–6 November 2004, after a dormant phase of only 6 years (Reference Sigmundsson and GuðmundssonSigmundsson and Guðmundsson, 2004). The eruption site was located at the southwest flank of the Grímsvoötn caldera. Analysis of the ENVISAT-ASAR data acquired during and shortly after the event showed that the magma–ice interaction melted an area of ∽0.4km2 of the glacier ice, ∽150m thick, around the eruption vent. The meltwater drained subglacially via the Grímsvötn caldera and Skeidarárjökull to the Skeidarársandur outwash plain (Reference Hardardóttir, Jonsson, Sigurdsson, Elefsen, Sigfusson and GislasonHardardóttir and others, 2005). No lava was formed during the eruption and all magma fragmented into pyroclasts that accumulated at the eruptive site or were carried by the eruption plume as tephra (Reference Sigmundsson and GuðmundssonSigmundsson and Guðmundsson, 2004). The prevailing southerly and southeast winds during the outbreak led to the deposition of a V-shaped ash layer north of the eruption site (Figs 1 and 2). In the ENVISAT-ASAR scene acquired on 13 November 2004, about one week after the eruption, the extension of the ash fan could be delineated. The fan comprises two branches that extend ∽19 km towards the Bárdarbunga caldera and cover an area of ∽88km2 on the glacier surface.
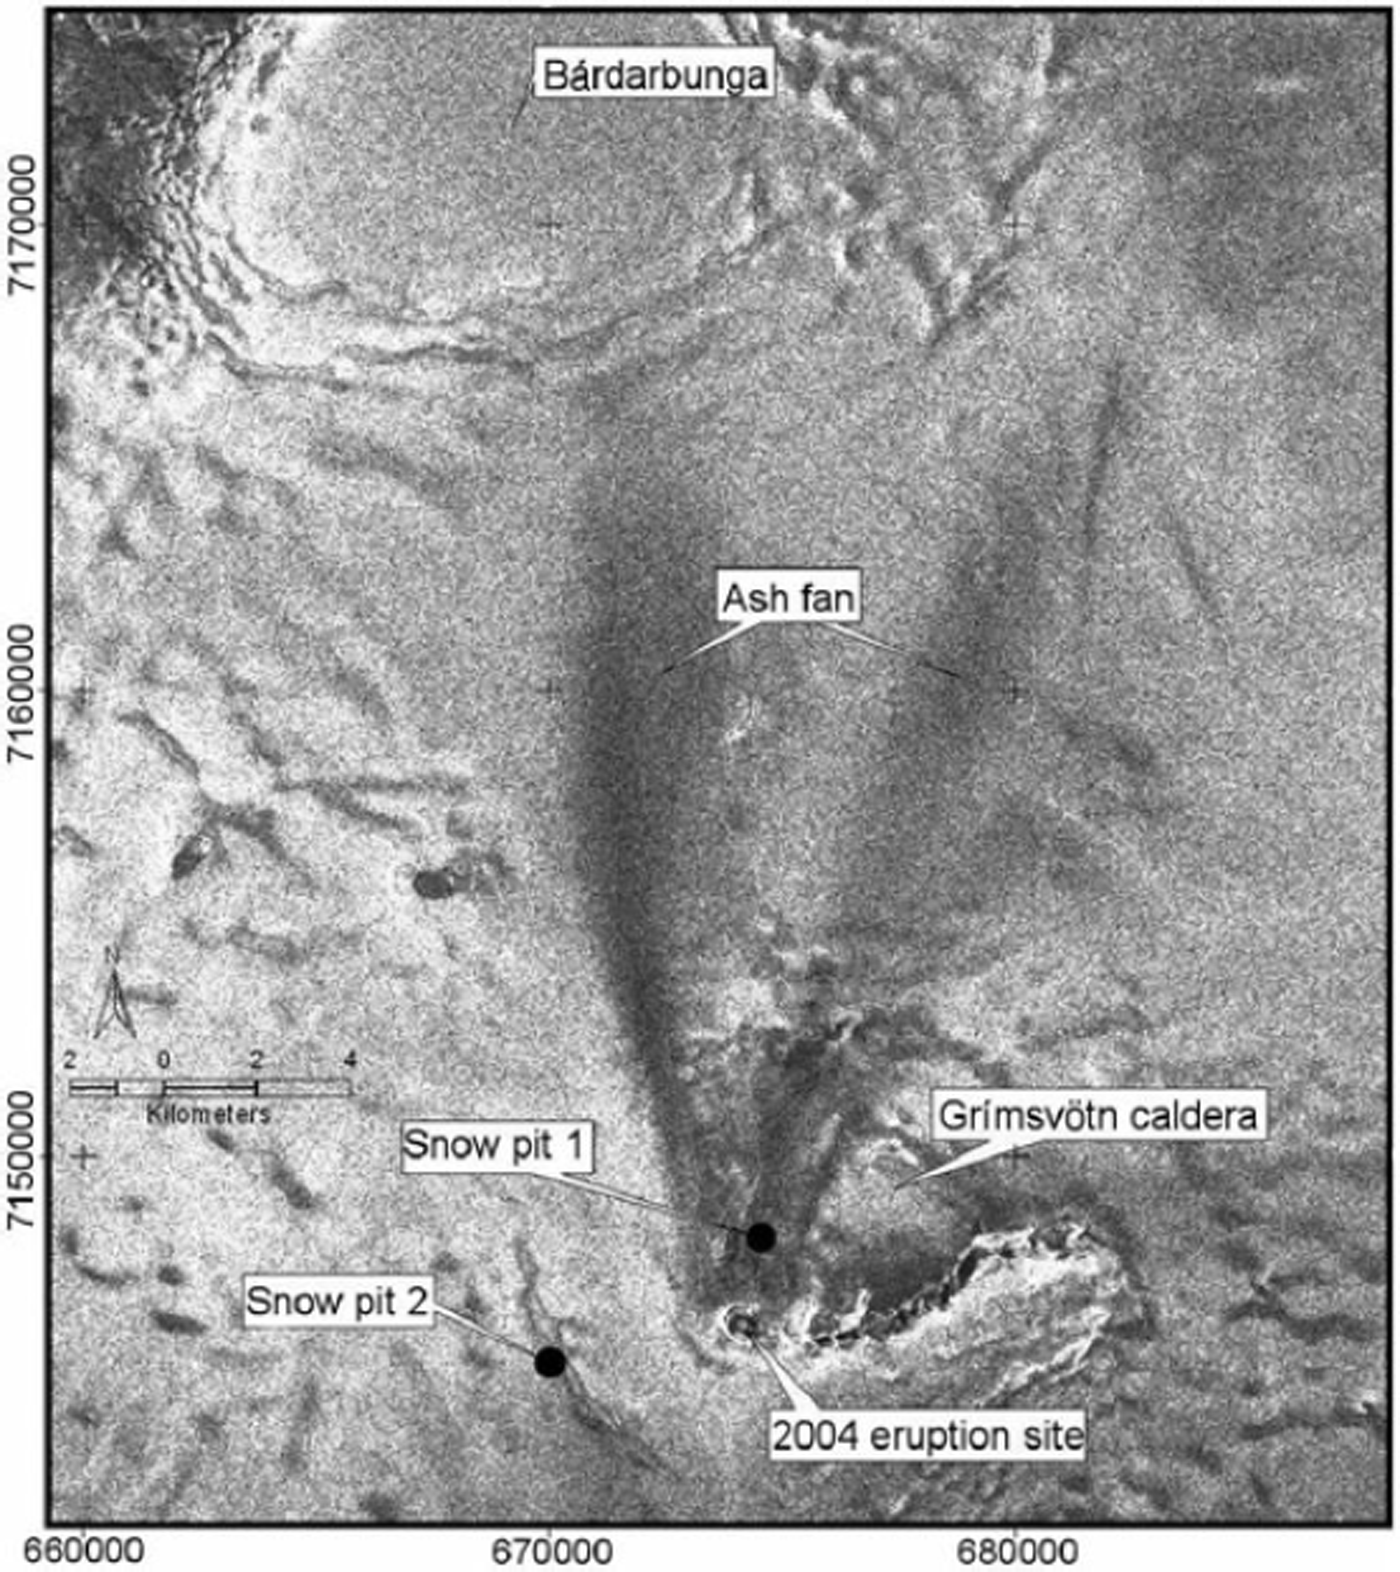
Fig. 2. Section of ENVISAT-ASAR image (13 November 2004) over the test site showing the extent of the V-shaped ash fan 7 days after the eruption. Even at a larger distance from the eruption site, where the ash layer becomes thinner, the ASAR backscatter values are reduced significantly. Locations of the two snow pits are marked with dots. Map projection: UTM, WGS 848 N, Zone 27.
Data and Methods
A fieldtrip was conducted about 6 months after the Grímsvötn eruption (6–13 April 2005) in order to investigate the structure of the snow layer which had accumulated in the Grímsvötn area. Two snow pits were dug and five shallow firn cores were drilled in the accumulation zone. In this study, the snow deposition history constructed from the two snow pits is used for interpretation of the radar signatures.
Snow pit 1 is located in the Grímsvötn caldera at a height of ∽1450ma.s.l. and about 1.8 km north of the eruption site (Fig. 2). The ash layer was found at a depth of 3.2 m. In the area around the snow pit, the ash accumulated continuously during the eruption, resulting in a thick tephra layer not penetrable by the SAR signal. An exact determination of the layer thickness was not possible due to the hard frozen conditions of the material (the thickness is at least 50 cm at pit 1, which corresponds to the maximum depth reached). Snow pit 2 is situated about 4 km southwest of the vent, at a height of ∽1564ma.s.l. outside the caldera (Fig. 2). At this location, no ash was deposited during the eruption. Therefore, this pit serves as an undisturbed reference for a SAR backscatter comparison. For quantification of precipitation, the water equivalent was determined by density measurements of snow samples on a vertical profile in both pits (Fig. 3). In addition, visual stratigraphy and the vertical temperature distribution were determined for identification of the deposition history (Fig. 3).

Fig. 3. Density profile and stratigraphy of (a) snow pit 1 and (b) snow pit 2, dug during the field campaign in April 2005. The ash layer was found at a depth of 3.2 m in pit 1. The thickness of the ash layer could not be determined, due to hard frozen conditions of the material (≥50 cm).
The remote sensing data used in this analysis are recorded by the ASAR instrument, a side looking C-band SAR antenna operating at a wavelength of 5.6 cm. ASAR is part of the payload of ENVISAT, successfully launched in March 2002. The satellite is on a 35 day repeat pass, providing images of the same ground target from the same orbit position every 35 days. Due to its beam steering capability the ASAR instrument can acquire images in seven different swaths, within the incidence angle range 15–458. By acquiring all swaths, both on ascending and descending orbit, it is theoretically possible to image the same ground target with a mean repetition cycle of 2.5 days. Basically, different polarizations can be chosen, whereas all images used in this study are acquired with vertical transmit and receive polarization (VV). The ground resolution of the scenes is ∽20m and the swath width about 100 km.
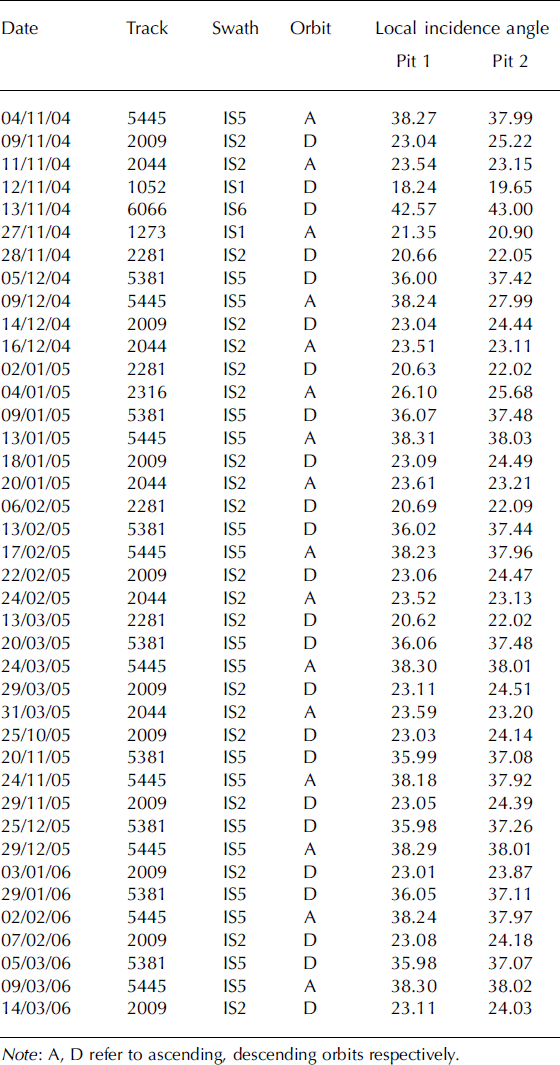
Due to frequent SAR acquisition, a total amount of 40 ASAR scenes could be analyzed in this study (Table 1). The study area was imaged during the period from the eruption in November 2004 until the field trip in April 2005 no less than 27 times by the ASAR instrument, from both ascending and descending orbits. For this period, data of the ASAR swaths IS1, IS2, IS5 and IS6 were available, covering an incidence angle range 14.1–42.88. Furthermore, 13 scenes (IS2 descending, IS5 ascending, IS5 descending) acquired during winter 2005/06 were investigated in order to analyze the temporal development of the local SAR backscatter conditions over an extended period.
Table 1. Specifications of all 40 analyzed ASAR scenes
For the quantitative backscatter comparison at the location of the two snow pits, precise absolute image calibration was performed for all ASAR images. The different error contributions of the SAR system (e.g. side looking geometry, antenna pattern) had to be removed in order to convert the image information to physical values. To obtain the radar backscattering coefficient σ 0, the individual calibration constant of every ASAR scene, included in the corresponding header file, was used (Reference Rosich and MeadowsRosich and Meadows, 2004). The local slope (i.e. local incidence angle) derived from a Digital Elevation Model (DEM) based on 1:50 000 topographic maps produced in the 1990s, was also considered in the corrections. The change in surface slope since the map production is thought to be negligible, as the two snow pits are situated in rather flat terrain. Finally, σ 0 values were converted to decibels (dB).
Individual radar pixels are not representative of the local backscatter value due to radar inherent speckle (Reference Lopes, Ridha and NezryLopes and others, 1990). In order to derive representative values, mean σ 0 (dB) was calculated for image windows of 20×20 multi-looked (5 in azimuth, 1 in range) pixels, centred at the coordinates of snow pits 1 and 2. Taking the ASAR ground resolution into consideration, these image chips correspond to an area of ∽16 000m2 on the glacier surface. The mean local incidence angles were calculated for the same image windows from the incidence angle maps, corresponding to the different ASAR swaths (Table 1).
In order to relate the snow pit measurements to meteorological events, data from the nearby Skaftafell weather station were provided by the Icelandic Meteorological office for the period under investigation. Skaftafell station is located on the southern sandur plain at the terminus of the Skeidarárjokull outlet, at a height of ∽100ma.s.l. The distance between the station and the test sites is ∽55 km. Daily mean values of temperature and precipitation were used for the interpretation of the SAR backscatter signals (Fig. 4).

Fig. 4. Daily mean temperature and precipitation for the period 1 November 2004 to 15 April 2005 recorded at the Skaftafell weather station. These data were used for reconstructing the accumulation history at the two snow pits and for inspecting the weather conditions at the ASAR acquisition dates (only SAR images under cold and dry conditions were chosen).
Analysis
Backscatter analysis
In the following section the biennial time series of the 40 ASAR scenes at the two snow pits are discussed. No summer scenes are included, as surface scattering at the wet/ melting snow surface is the dominant scattering mechanism during this season. No differences between the two pits can be observed during this period.
Visual inspection of the scenes shows that the ash fan is detectable on all 40 ASAR images. This was true even for the most recent scene in March 2006, ∽16 months after the eruption occurred. This indicates that the radar signal penetrates to the ash layer even after a second accumulation season.
The local incidence angles differ only slightly at the two snow pits (Table 1). At the undisturbed pit (pit 2), the σ 0 values remain stable (low variance) for the whole time series (if melt events are excluded) (Fig. 5b). At lower incidence angles the variability is somewhat higher. Images from different swaths show characteristic σ 0 values during the two years of observations. The IS2 descending scenes reveal a mean value of ∽0 dB, IS5 descending ∽–6 dB and IS5 ascending varies around –5 dB at pit 2. Volume scattering of dry snow is expected to be the dominant scattering mechanism in this area, indicating more or less temporally stable snow cover characteristics. On a few dates, namely at the onset of the time series in November 2004 (all swaths), on 20 March 2005 (IS5 descending) and on 25 October 2005 (IS2 descending) the σ 0 values are reduced significantly (Fig. 5). These sudden changes in backscatter intensity are related to a change of the scattering mechanism from volume to surface scattering caused by surface melt. On all these acquisition dates, higher temperatures and considerable amounts of precipitation were recorded at the Skaftafell weather station, providing a layer of wet snow in the region of pit 2. Consequences of these conditions for SAR backscatter are demonstrated in Figure 6.
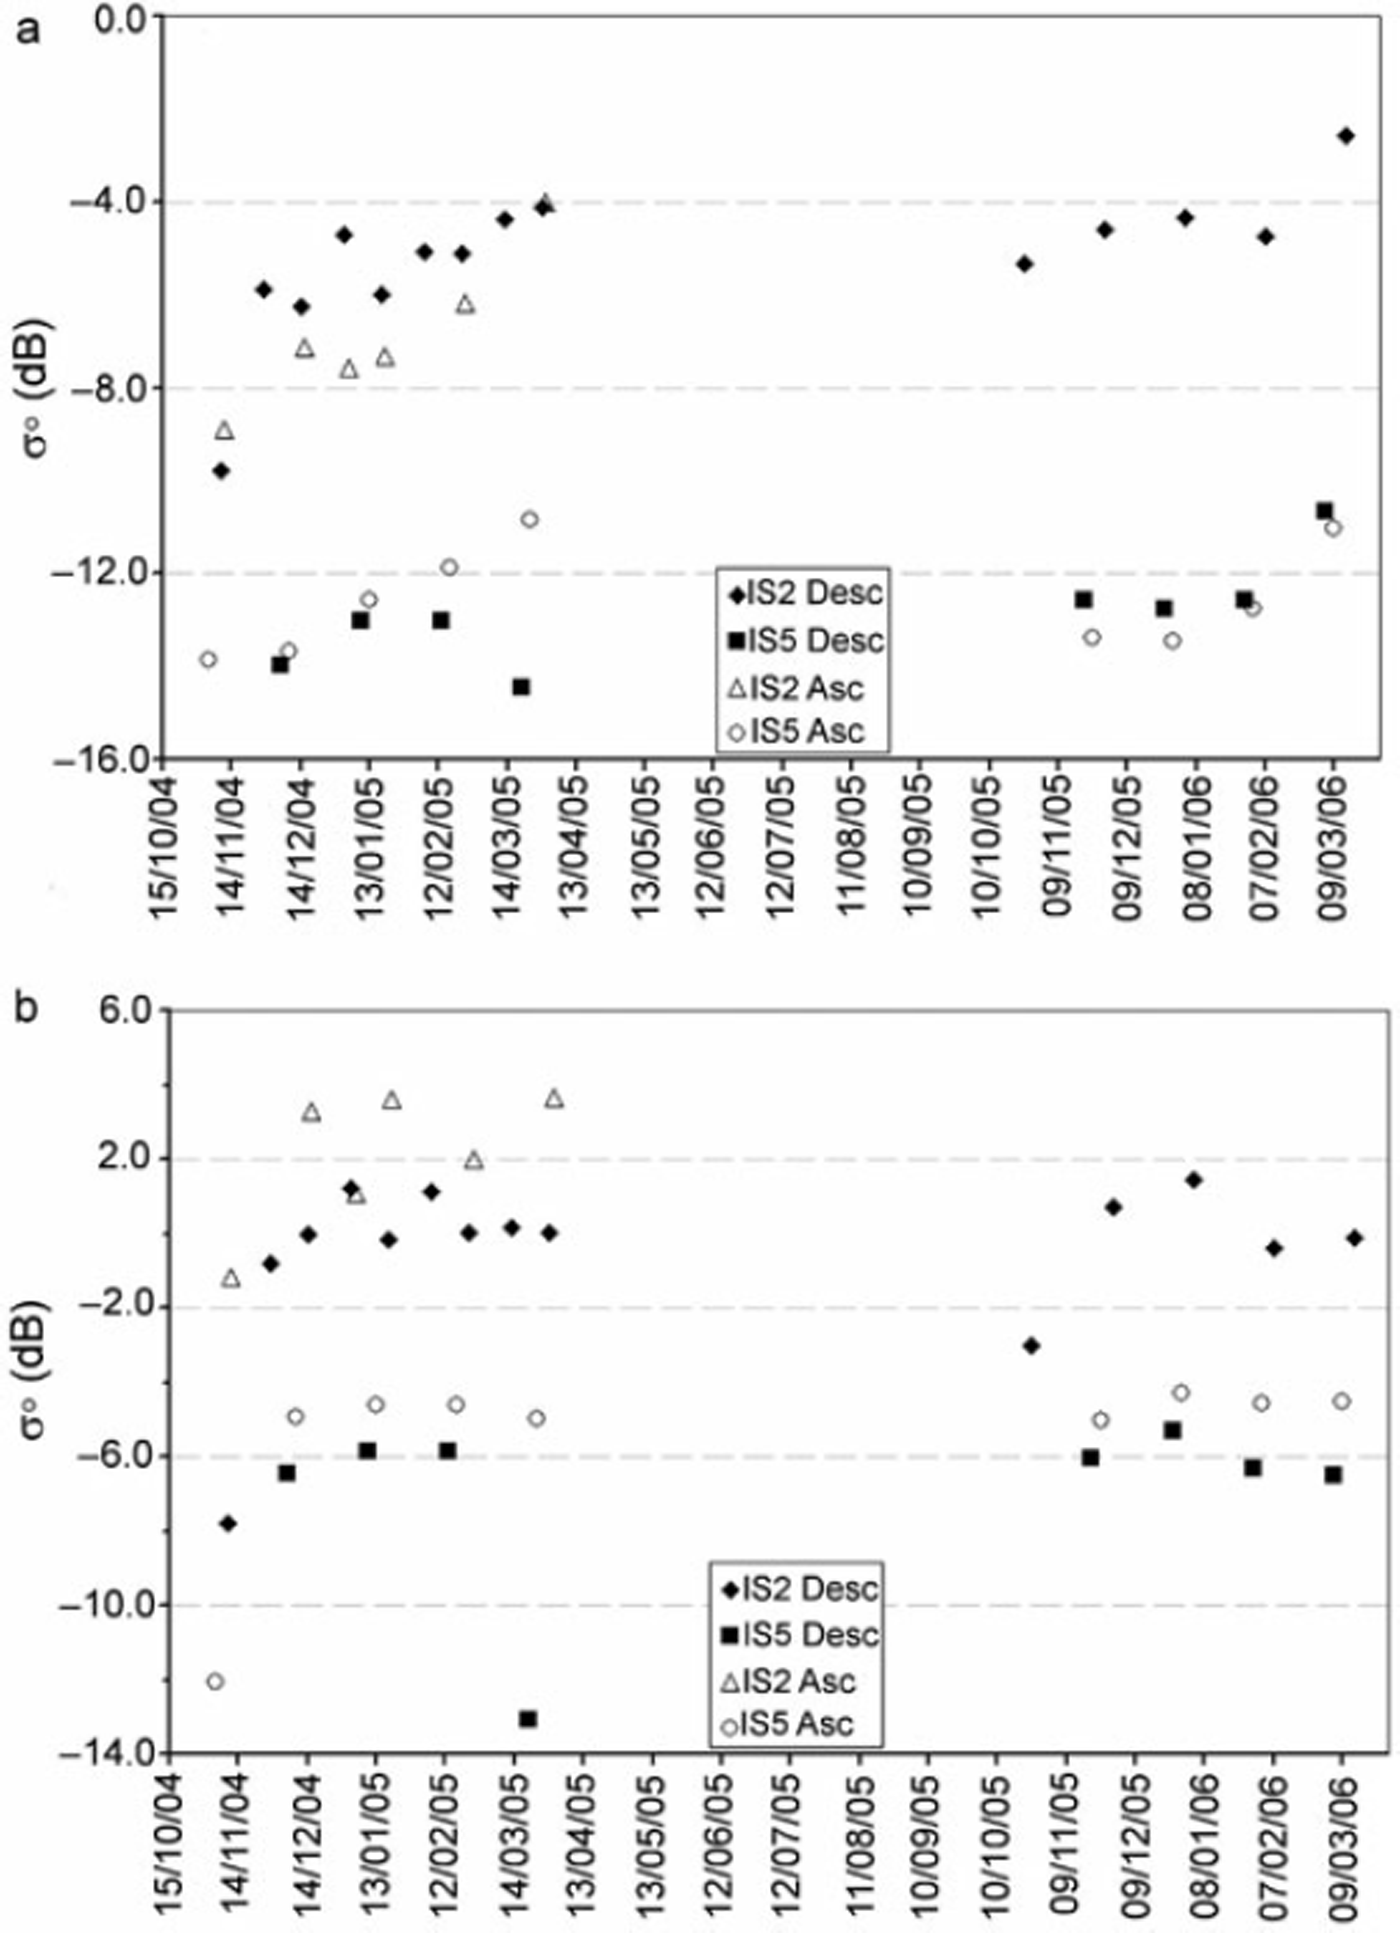
Fig. 5. Plots of the ENVISAT-ASAR backscatter time series at (a) snow pit 1 and (b) snow pit 2. Outliers, where the σ 0 backscatter values are reduced significantly, are included. In contrast to pit 2 (b), where values remain stable, a temporal increase in σ 0 is found at pit 1 in all ASAR swaths. Comparing pit 1 and pit 2, the σ 0 values of IS2 are generally lower by about 5 dB, and about 7 dB for IS5 at pit 1, due to the ash layer.
the mean density below the new snow of pit 2 is slightly higher than the density of pit 1. The total precipitation at Skaftafell for the period of investigation is 561 mm, which is about 80% of the mean precipitation at Grímsvötn. A comparison of the accumulation history for the two pits and the accumulated precipitation at Skaftafell shows good agreement (mean R2 (Pit 1, Pit 2) = 0.84, see also Fig. 7).
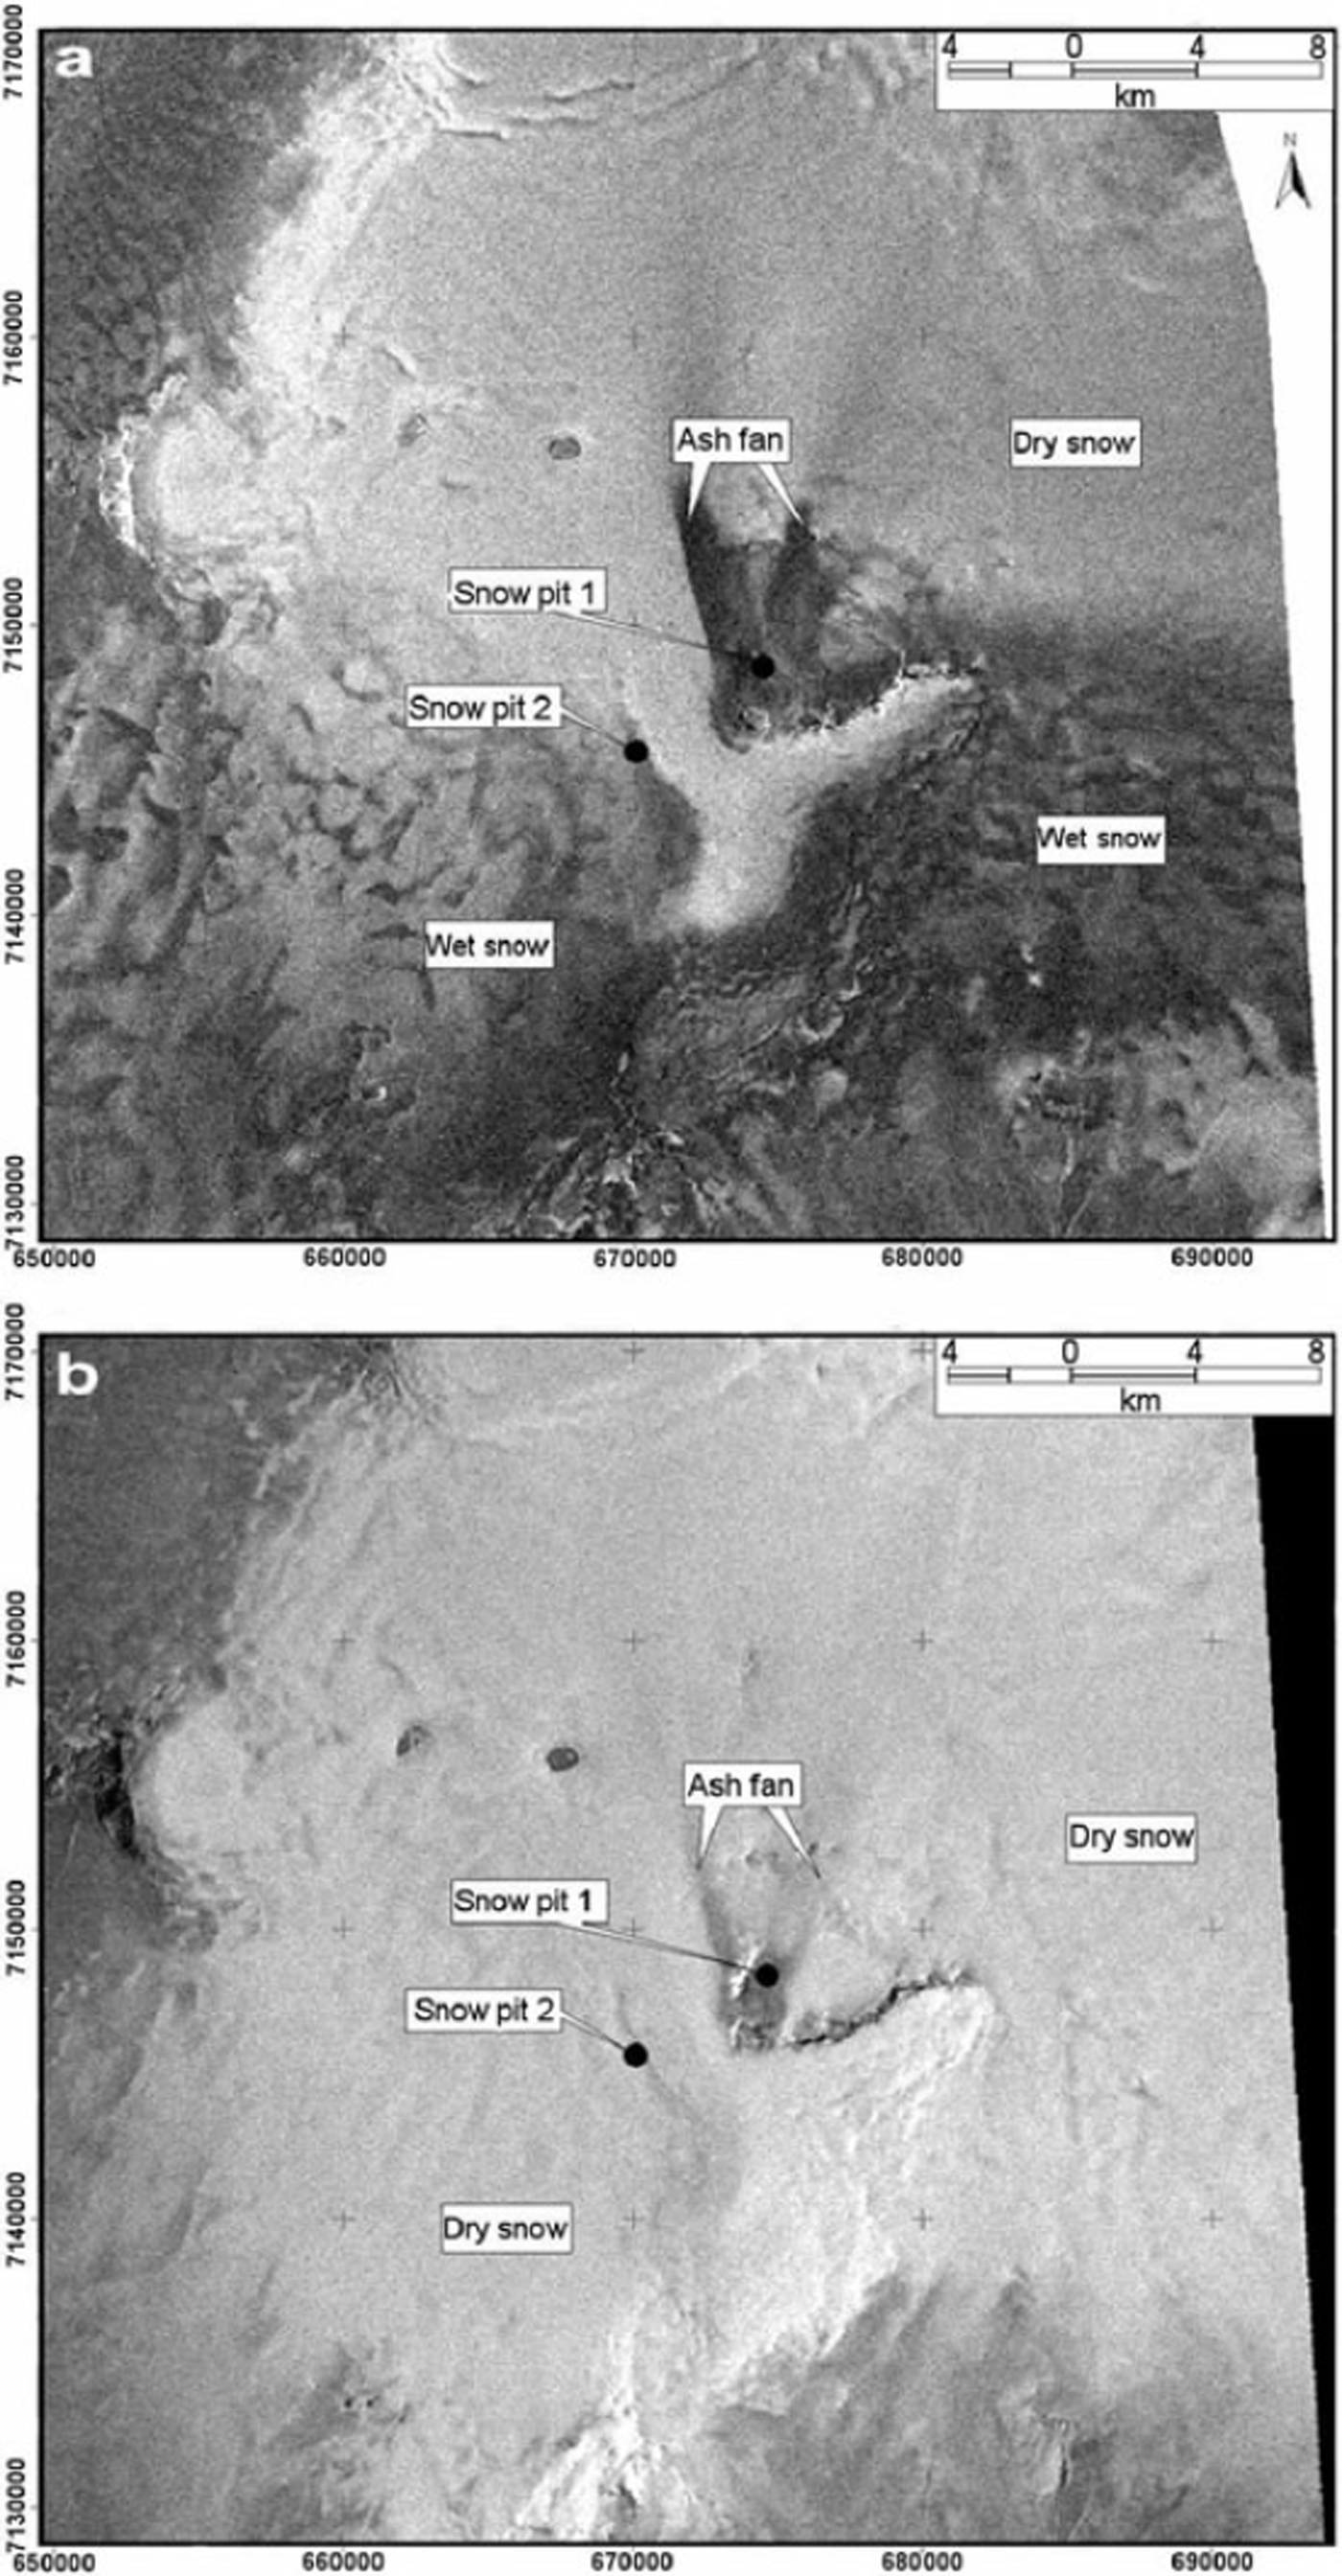
Fig. 6. ENVISAT-ASAR scenes showing the difference between (a) wet, 4 November 2004 and (b) dry, 18 January 2005 conditions at acquisition. In (a), the σ 0 backscatter values are reduced significantly over the southern part of the glacier. Map projection: UTM, WGS 848 N, Zone 27.
At pit 1, an increase in value of σ 0 is found in all time series of the different antenna swaths, whereas IS2 and IS5 show a rather similar behaviour. During the second winter after the eruption, the σ 0 values also increase with time (Fig. 5a). This suggests an increasing volume scattering contribution by the snow layer accumulating above the ice surface of the ash horizon. In the first 6 months after the eruption the values increase from –8.9 dB (11 November 2004) to –4.0 dB (31 March 2005) in the IS2 ascending scenes. In IS2 descending scenes, backscatter values increase from –9.8 dB (9 November 2004) to –4.1 dB (29 March 2005). Due to the higher incidence angle, the level of the IS5 values is generally lower, but the temporal increase is still pronounced. Values of IS5 ascending scenes rise from –13.9 dB (4 November 2004) to –10.7 dB (24 March 2005). In the IS5 descending series an increase is observed for the first three acquisition dates: –13.9 dB (5 December 2004) to –13.0 dB (13 February 2005). The last scene in the first winter period, however, gives a lower value: –14.4 dB (20 March 2005). This value is connected to the weather situation mentioned before.
Even in the second winter, the temporal increase of backscatter is maintained although it begins at a higher level. In the IS2 descending series the values increase from –5.3 dB (25 October 2005) to –2.6 dB (14 March 2006), in IS5 ascending images from –13.7 dB (24 November 2005) to –11.0 dB (9 March 2006) and in IS5 descending images from –12.6 dB (20 November 2005) to –10.7 dB (5 March 2006) (Fig. 5).
To conclude, the σ 0 values increase during the first accumulation period (winter) by 4.8 dB in IS2 ascending scenes, by 5.6 dB in IS2 descending scenes, 3.0 dB in IS5 ascending scenes and 0.9 dB in IS5 descending scenes for the first three acquisition dates. In the second accumulation period (winter) after the eruption the IS2 descending series increases by 2.8 dB, IS5 ascending images by 2.7 dB and IS5 descending images by 1.9 dB. Comparing the two pits, the σ 0 values of IS2 swaths are generally lower by about 5 dB and about 7 dB lower for IS5 swaths at pit 1, while the only considerable difference between the two locations is the existence of the ash layer at pit 1.
Accumulation history
In both snow pits, close to the eruption site (pit 1) and outside the crater (pit 2), vertical density profiles and stratigraphy were measured. The ash layer in pit 1 is a clear time marker, representing the eruption of 1–6 November 2004. A total water equivalent of 702 mm was derived from the density measurements in pit 1 for the time between 6 November 2004 and 9 April 2005 (Fig. 7). The stratigraphic comparison between the two pits resulted in assigning the same date to a thick ice lens in 3.20m depth in pit 2. The total water equivalent for the same period at pit 2 corresponds to 736 mm which leaves a difference of 34 mm between the two pits 5.5 km apart.
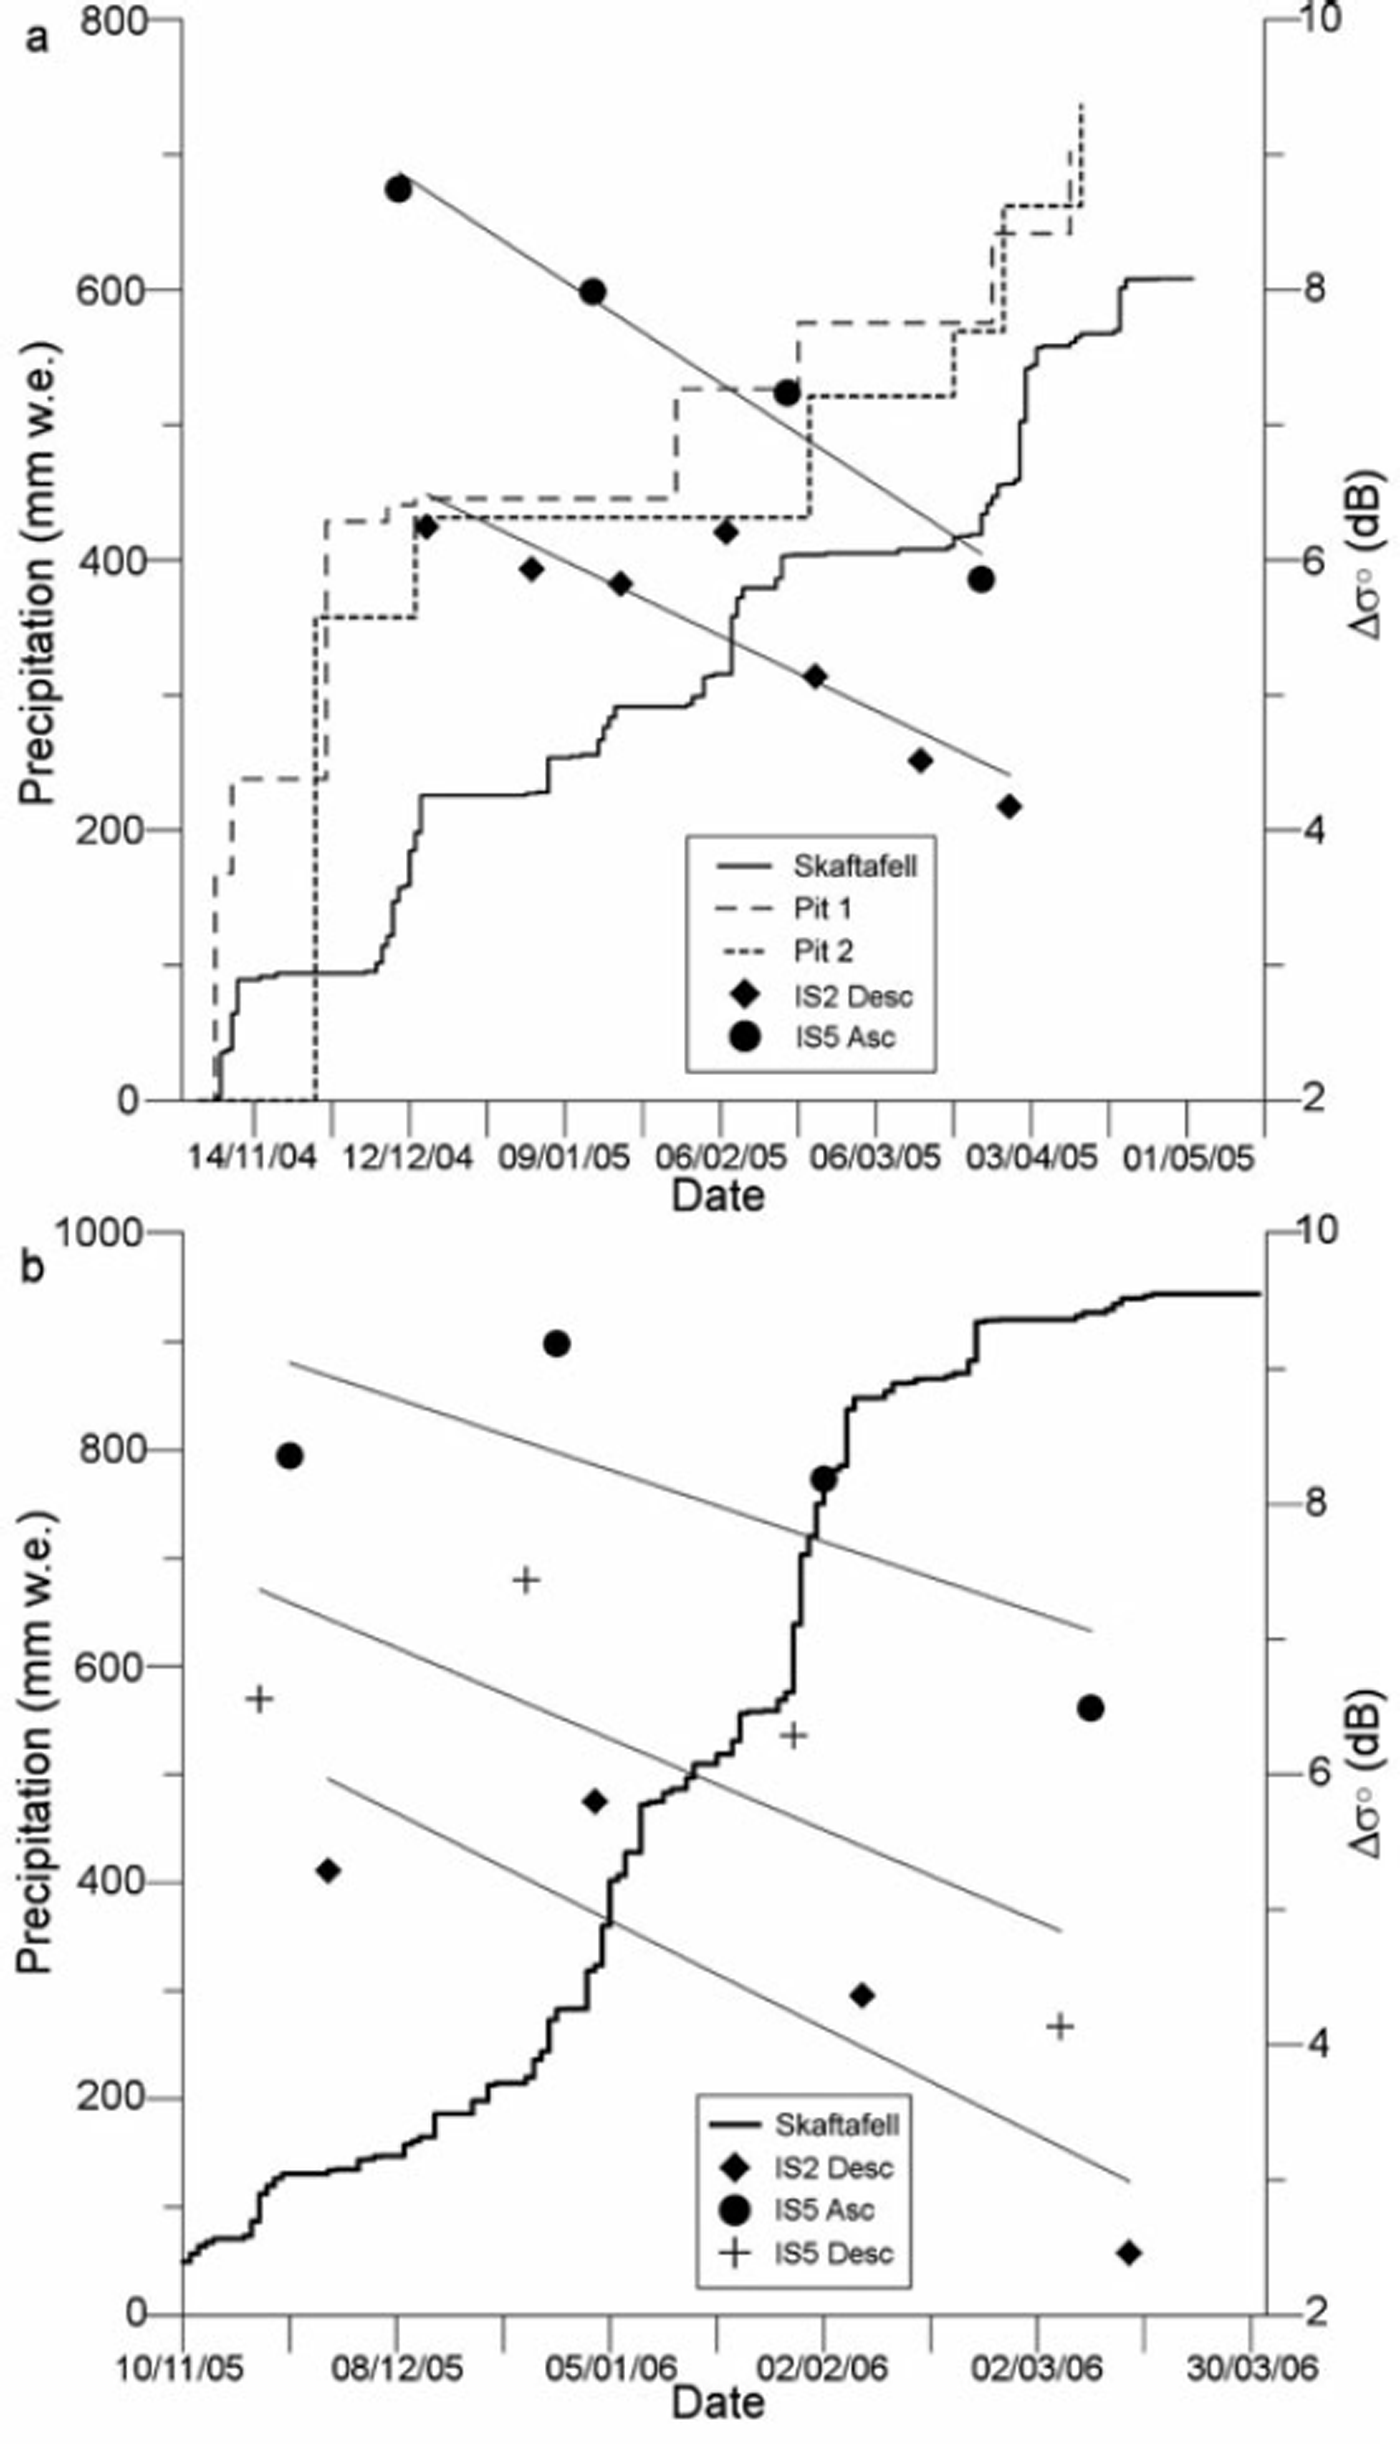
Fig. 7. Comparison of the accumulation history during the winter season and the Δσ 0 backscatter values (pit 2 minus pit 1) of different ENVISAT swaths. (a) Accumulated precipitation measurements from the snow pits and recordings from Skaftafell station for the period 2004/05. (b) Skaftafell station only for the period 2005/ 06. The lines represent the regression lines of the corresponding ASAR swaths, providing high (>0.8) R2 confidence values.
Using temperature and precipitation information from the Skaftafell station, the deposition history was reconstructed for both pits. Since both pits are situated well within the accumulation zone, it is assumed that no runoff took place even for the warmest periods during the winter 2004/05 and that potential rainfall was refrozen in the snow layer. Ice lenses and compact, laminated firn layers were associated with warm periods. Certain precipitation events recorded at the weather station, as well as strong melt events could be identified in the pits. Hence, due to the elevation difference,
Discussion
The radar backscatter data for the two locations on the glacier were compared with the derived accumulation history. The remarkable increase of the backscatter values at pit 1 in contrast to the lack of backscatter variation at pit 2 implied a direct connection between the accumulation above the ash layer and the backscatter conditions (Fig. 5).
The radar signal is able to penetrate into a dry snow layer, where the amplitude of the received backscatter signal mainly depends on volume scattering within the snow pack (Reference Henderson and LewisHenderson and Lewis, 1998). In the case of pit 1, the radar backscatter signal is still affected by the existence of the ash layer even after more than a year, which indicates a penetration depth of at least several metres. Compared with scattering in the undisturbed snow pack of pit 2, the mean σ 0 values are about 5 dB lower for IS2 and 7 dB lower for IS5, respectively. For our purpose it is important to assume temporally stable backscatter conditions of the ash layer. Because of the continuously frozen conditions after the first snowfall events it is very likely that the ash layer is unchanged since. The individual scattering properties of the ash layer, such as its surface roughness, permittivity and inner structure (grain size) can then be neglected in this study. It is also assumed that the ash layer functions as a surface scatterer, as indicated by the strong reduction of backscatter values even over a thin ash layer at the larger distance of the eruption site (Fig. 2). The fraction of volume scattering in the overlying snow pack could therefore be calculated from differences in σ 0 values at the two snow pit locations. It is anticipated that the ash layer can thus be used as a reference horizon with a known age in accumulation studies, calculating snow accumulation from the σ 0 differences.
In order to investigate the relation between snow accumulation and the differences between σ 0 values of the two pits (Δσ 0), a linear regression analysis was carried out (Fig. 7). For this study, only SAR images with cold and dry conditions on the glacier surface were chosen. In the case of wet conditions, scattering occurs at the surface and the underlying snow volume has no influence on the measurements. Due to the strong correlation between the measured accumulation in the snow pits and the precipitation data at Skaftafell weather station, the latter have been used for the analysis.
Introducing a linear relation between reduction in Δσ 0 values and increasing snow pack results in a high correlation between the two variables for the period between the date of eruption and the field trip. Only the IS2 descending and IS5 ascending series have been used, due to good temporal coverage for these swaths in this observation period. The analysis shows rather high R2 confidence values of 0.81 for IS2 descending and 0.86 for IS5 ascending. For an increase in snow thickness of 100mmw.e., Δσ 0 decreases by about 0.94 dB for IS5 and 0.97 dB for IS2, respectively. This relation between snow depth above the ash layer and reduction in Δσ 0 can be used to determine accumulation rates between individual SAR image acquisitions for dry snow conditions.
A similar investigation was made for the winter of 2005/06 where no in situ accumulation data are available for the glacier (Fig. 7). The comparison of the Skaftafell precipitation data and the radar data show a similar relation. However, the slope of the regression line is steeper for both swaths. This indicates that for this year the ash layer can still be used as a reference horizon for accumulation studies, but a new calibration is required for each accumulation period.
Conclusions
Results presented in this paper demonstrate that volcanic ash deposits on a glacier can be used as a time reference marker for measuring accumulation rates by the analysis of time sequential SAR backscatter data. The change in SAR backscatter values (σ 0) for a cold snow pack is strongly linked to the accumulation history above the reference horizon. In the absence of such a horizon (e.g. at pit 2) the snow pack shows a temporally uniform backscatter behaviour, indicating a more or less stable composition in time. Therefore, the gradient in temporally distributed σ 0 values over the reference layer provides a tool for the reconstruction of accumulation rates during an accumulation period.
Even after two seasons the ash layer from the 2004 Grímsvötn eruption can be used as such a reference layer for the determination of the increase in snow depth. The nearby undisturbed snow pack at pit 2 provides a control, in order to eliminate other factors influencing the backscatter coefficient. So far, the relation has only been tested for one accumulation period and a thorough investigation of the backscattering theory is required to quantify the method. However, comparison with weather data from a nearby station allows an approximate reconstruction of the accumulation history during the winter season. A new calibration for each accumulation period would increase the accuracy significantly.
One of the main advantages of our approach is its applicability to raster data in contrast to point measurements from conventional field investigations, which allows the computation of areal distributions of accumulation rates calibrated by known local data. The necessary existence of a reference horizon so far is a strongly limiting factor. The characteristics required to make such internal layers (e.g. ash or dust) usable as reference layers need to be determined. Such a study might prove that the frequent dust-fall events on alpine and Asian glaciers could be utilized for widespread accumulation investigations. For Vatnajökull, further monitoring of SAR backscatter and analysis of its spatial variations will provide an interesting insight into the areal accumulation distribution in the central part of the ice cap by investigating the signals over the recent and future ash layers. The analysis of multiple years of ENVISAT-ASAR data will allow development of annually calibrated accumulation retrieval algorithms. For this purpose, the establishment of several control sites over the ash layer and in adjacent regions is planned for future field activities. Data from these control sites will improve the quantification of the accumulation/backscatter relation considerably.
Even for a snow depth of 3.2 m, the analyzed SAR data reveal a difference in backscatter from 5–7 dB for the two pits. After the following winter season (2005/06), with additional snow accumulation, a difference in backscatter was still detectable. Observation of future differences between the two sites will provide more information on the penetration depth of the SAR signal under dry conditions on Icelandic glaciers, which is at least more than the observed 3.2m (700mmw.e.) in 2004/05 plus the ∽950mmw.e. in 2005/06.
Acknowledgements
We would like to thank ESA for the provision of the ENVISAT-ASAR data (ID 142). Sincere thanks are directed to the Bavarian Research Foundation, who funded this study. Thanks also to the Icelandic Meteorological office (Vedurstofa), Reykjavík, for the provision of the meteorological data, the National Energy Authority (Orkustofnun), Reykjavík, for providing a firn drill, and to the Icelandic Research
Council (RANNIS), Reykjavík, for the research permit (Declaration 5/2005). This paper was substantially improved following review comments from J. S. Walder, K. Dean and K. Russell.


