1. Introduction
Our knowledge of past climate conditions comes largely from ice cores and other sedimentary records. Interpretation of these records relies on the assumption that the stratigraphic layering has remained intact. for marine and lacustrine sedimentary cores, bioturbation and tectonic displacements are major concerns. for ice-core records, layer stratigraphy is usually assumed to have remained intact except possibly very close to the bed. However, the loss of correlation of δ18O (Reference Alley, Gow, Johnsen, Kipfstuhl, Meese and ThorsteinssonAlley and others, 1995) and other climatic indicators below 2750 m depth (some 270 m above the bed) in the Greenland Icecore Project (GRIP) and Greenland Ice Sheet Project 2 (GISP2) ice-core records, and visual observations of small-scale folding in the bottom third of the GISP2 core, point to the possibility of layer disturbance at considerable heights above the bed, even near an ice divide (Reference Alley, Gow, Meese, Fitzpatrick, Waddington and BolzanAlley and others, 1997). Layer disturbances due to varying flow over bed topography are generally expected to have wavelengths comparable to the bed topography and to be found within one wavelength of the bed. Therefore the small features seen in the Greenland cores are unlikely to be directly caused by bedrock topography. Folding of surface features such as sastrugi is unlikely, due to the longitudinal stretching of layers near ice-sheet centers.
Figure 1 shows a simple description of the deformation states near ice-sheet centers, with longitudinal stretching and horizontal shearing competing to flatten out or to overturn any ``wrinkles’’ in the layering. This is very different from the conditions near the bed or at the margins, where horizontal compression is common (Reference HudlestonHudleston, 1976; Reference Hambrey, Lawson., Maltman, Hubbard and HambreyHambrey and Lawson, 2000).
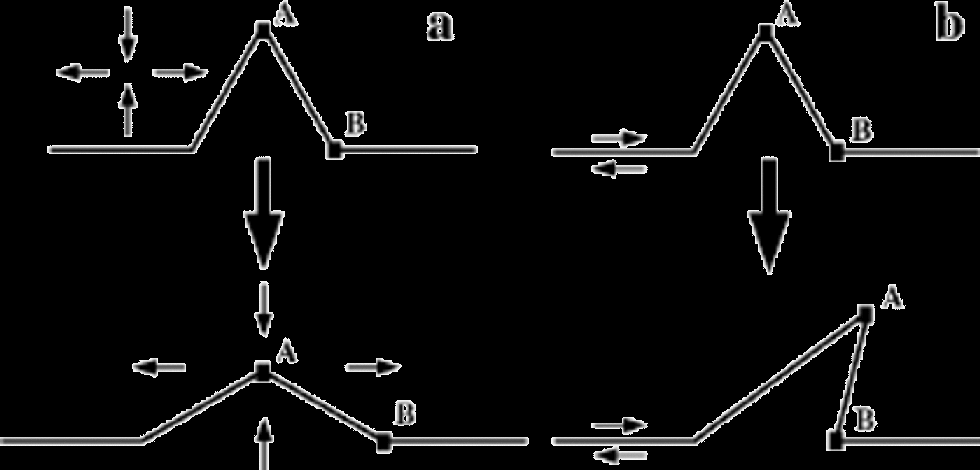
Fig. 1 Evolution of layer disturbances in steady-state flow fields typical of near-divide environments. (a) Pure shear deformation tends to flatten disturbances, while (b) simple shear can overturn the disturbance to cause recumbent folding.
Layer disturbances such as wrinkles (undulations, or open folds in annual layers) can lead to overturned or recumbent folds that have the potential to severely compromise the chronological interpretation of ice cores. In an ice sheet that has an overturned fold, an ice core could conceivably go through the same layer three times. the origin of layer disturbances has not yet been fully resolved. Jacobsen (2001) shows that the special arches found in layers under steady ice divides (Reference RaymondRaymond,1983) can act as a disturbance source for overturned folds if the divide then moves. More generally, transient flow may leave layers in disturbed orientations near bedrock bumps (Reference HudlestonHudleston,1976). Almost all of the various potential surface sources (sastrugi, accumulation variations) of layer disturbances are unlikely sources of wrinkles near ice divides, due to the strong stretching of annual layers near ice-sheet centers (Reference Waddington, J. F. and Alley.Waddington and others, 2001). Variations in rheology and anisotropy are the most likely sources of layer disturbances within an ice sheet (Reference Dahl-Jensen, Thorsteinsson, Alley and ShojiDahl-Jensen and others, 1997). Several authors have pointed out that asymmetry of the fabric might cause flow inhomogeneities that could lead to layer disturbances (Reference Azuma and Goto-AzumaAzuma and Goto-Azuma,1996; Reference CastelnauCastelnau and others, 1998).
Here we derive a criterion for folding of layer disturbances injected in an otherwise steady-state flow field in vertical uniaxial compression or pure shear stress, combined with a simple shear stress state. Assuming homogeneous strain-rates equations for particle tracks allows us to model the evolution of layers. Reference Waddington, J. F. and Alley.Waddington and others (2001) followed a similar approach to assess folding potential for isotropic ice. Here the effects of anisotropy on the folding criterion are explored using the anisotropic flow law formulated by Thorsteinsson (Reference Thorsteinsson2000, Reference Thorsteinsson2001, Reference Thorsteinsson2002).
Finally, we consider the origin of disturbances to the layering. Fast changes in stress state, which might arise as ice flows over bumps or as a divide migrates, can leave the fabric in a different symmetry to that which it would have developed in the new stress state. We will refer to fabric that has symmetry different from the fabric that would have developed under steady conditions as ``unadjusted fabric’’. Smaller-scale heterogeneity, such as stripes (Reference Alley, Gow, Meese, Fitzpatrick, Waddington and BolzanAlley and others, 1997), is also a potential source for layer disturbances at all depths. the deformation of a material with an unadjusted fabric can cause layer disturbances. We examine the effects of unadjusted fabric on the deformation, using both an analytical formulation for a given fabric (Thorsteinsson,Reference Thorsteinsson2000, Reference Thorsteinsson2001), and a model where the fabric evolves with the deformation (Reference Thorsteinsson2000, Reference Thorsteinsson2002).
2. Overturned Folds
2.1. Particle paths and deformation
For a homogeneous three-dimensional deformation field in vertical uniaxial compression or pure shear combined with simple shear, we can solve for the position of a particle at any given time using the coupled first-order differential equations (Reference RambergRamberg,1975)

where ![]() and
and ![]() is the velocity gradient; ui is the velocity component in direction
is the velocity gradient; ui is the velocity component in direction ![]()
![]() where z is vertical).
where z is vertical).
The particle path, in steady state, is then given by the solution to Equation (1)

where x0 = x(t =0) and z0 = z(t = 0). This solution assumes that the displacement at the origin xi = 0 is zero, and that the Lij’s are constants in time and space. Because ice in an ice sheet tends to move into regions of increasing shear, this assumption is not strictly correct. However, Reference Waddington, J. F. and Alley.Waddington and others (2001) show that the solution (Equation (2)) is still useful, and Jacobsen (2001) shows that finite-strain calculations can illuminate layer behavior where the simple solution (Equation (2)) is not applicable. We use Equation (2) to derive a criterion for folding below. All the shear deformation takes place in the ![]() plane, and we can formulate our equations in two dimensions, noting that variations in the y direction are allowed.
plane, and we can formulate our equations in two dimensions, noting that variations in the y direction are allowed.
2.2. Non-dimensional numbers
It is convenient to define several non-dimensional numbers, in order to simplify the equations. First we define the slope m
where A and B are two points on a layer, connected by a straight line (see Fig. 1).
We define a shear number, S, as
The shear number is a measure of how easy it is to deform the material in horizontal simple shear, relative to vertical pure shear or uniaxial compression.When S is large, shear dominates over compression and folding is likely. It is also convenient to define a stress ratio, ![]() as
as
where τ is the shear stress and σ is the vertical compressive stress.
Using local strain rates to define a characteristic time-scale
we non-dimensionalize time as T = t/T. We also use L, a characteristic length scale for the layer disturbance, to non-dimensionalize spatial variables, i.e. X = x/L and Z = z/L.
2.3. Passive folding
To derive a criterion for folding, we consider two particles, A and B, as shown in Figure 1. Particle A at time t = 0 is at x =0; z = A, xA(t =0; x0 =0; z0 = A), and particle B is at xB(0;L,0). for overturned folds to occur, particle A must reach an x position greater than that of particle B at some later time, xA(t;0,A) > xB(t;L,0). Reference Waddington, J. F. and Alley.Waddington and others (2001) used a similar folding criterion. An equivalent approach is to consider when a line with an initial slope m0 = A/L reaches vertical, and consequently, since the velocity gradient is uniform, overturns. By letting t → ∞ we find the smallest initial slope that can reach vertical. Using Equation (2) to solve for xA(t; 0,A) – xB(t;L, 0) >0, where t → ∞, we get
or using the non-dimensional notation
The time it takes particle A to overtake particle B (xA(t; 0,A) – xB(t; L, 0) = 0) is
or in non-dimensional form,
As discussed by Reference Waddington, J. F. and Alley.Waddington and others (2001), the shear number S is not uniform along particle paths as we assume here; layers tend to move toward regions of increasing simple shear, and the overturning time (Equation (8)) tends to be an upper limit. By calculating the finite strain along particle paths, Jacobsen (2001) assessed the error introduced by the uniform strain-rate assumption. the time error is small, and the assumption a good one, except in regions where Sm0 ≈1, and in regions strongly affected by bedrock topography.
2.4. Anisotropic strain rates
Ice obeys a power law with a stress exponent n ≈3; most other minerals of geophysical interest also haven > 1. the analytical anisotropic flow law that we use here is based on the homogeneous stress assumption (often referred to as the Reference SachsSachs (1928) model). the derivation of the velocity gradient, Lij, as a function of cone angle can be found in Reference Thorsteinsson2000, Reference Thorsteinsson2001. Cone angle α is a half-apex angle of a cone within which the c axes of all the crystals are assumed to be uniformly distributed. Vertically symmetric fabrics are widespread in polar ice sheets (Reference GowGow and others, 1997; Reference Thorsteinsson, Kipfstuhl and MillerThorsteinsson and others, 1997). the Appendix gives the equations for the non-zero components of the velocity gradient in uniaxial compression combined with simple shear (UC&SS) stress state, and in combined pure and simple shear (PS&SS) stress state, as functions of cone angle. the stress states considered are
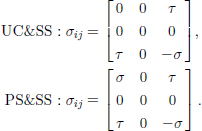
The anisotropy breaks the one-to-one correspondence between stress and strain-rate components that exists for isotropic materials. We can examine how the anisotropy changes the deformation rate, relative to the isotropic response, by plotting the ratio of anisotropic deformation rate to the deformation rate of a corresponding isotropic material subjected to the same stress state.
Figure 2 shows the normalized vertical deformation rate, ![]() as a function of cone angle α and the stress ratio
as a function of cone angle α and the stress ratio ![]() in combined uniaxial compression (σ) and simple shear stress (τ) state. the normalized deformation rate can be viewed as an enhancement factor for this particular deformation-rate component. the peak enhancement in vertical strain increases with increas- ing shear stress, and the maximum (for a given value of
in combined uniaxial compression (σ) and simple shear stress (τ) state. the normalized deformation rate can be viewed as an enhancement factor for this particular deformation-rate component. the peak enhancement in vertical strain increases with increas- ing shear stress, and the maximum (for a given value of ![]() ) moves from α ≃ 60˚ for
) moves from α ≃ 60˚ for ![]() to α ≃ 35˚ for
to α ≃ 35˚ for ![]() The vertical strain rate varies greatly as a function of cone angle. Figure 3 shows the
The vertical strain rate varies greatly as a function of cone angle. Figure 3 shows the ![]() component. the shearing rate L13 depends less on the relative magnitude of shear stress to compressive stress when
component. the shearing rate L13 depends less on the relative magnitude of shear stress to compressive stress when ![]() When
When ![]() the enhancement varies greatly with both
the enhancement varies greatly with both ![]() and α.
and α.
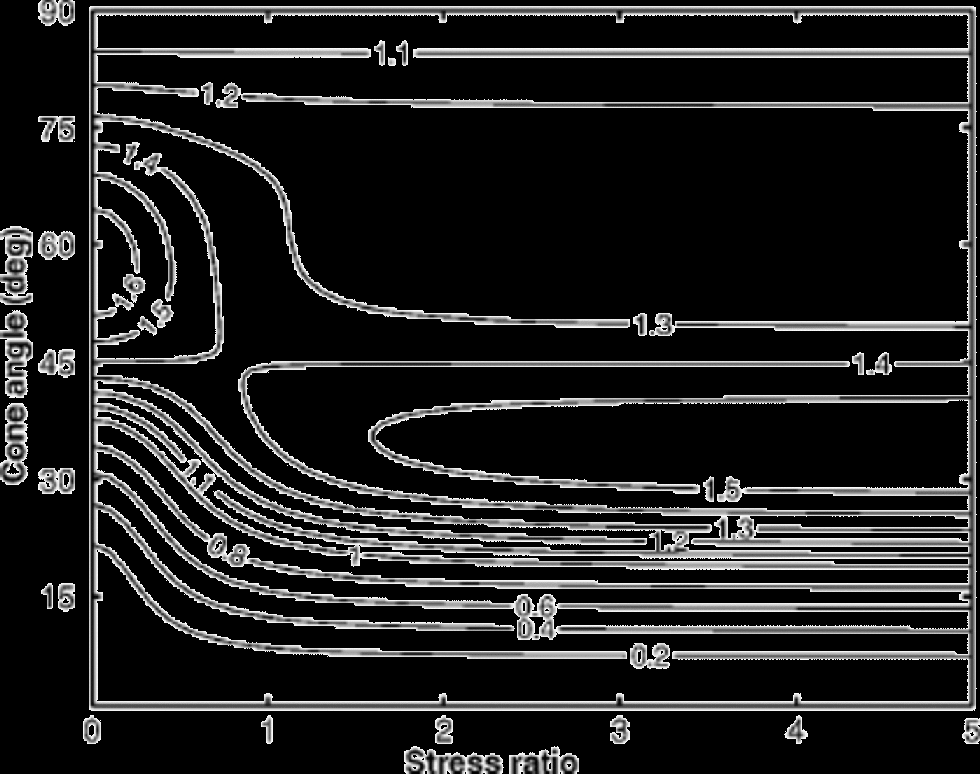
Fig. 2 The normalized vertical deformation rate, ![]()
![]() as a function of stress ratio
as a function of stress ratio ![]() and cone angle α, in
and cone angle α, in ![]() Note how the compressive deformation rate has a maximum near 60˚ when
Note how the compressive deformation rate has a maximum near 60˚ when ![]() and near 35˚ for larger shear stress.
and near 35˚ for larger shear stress.
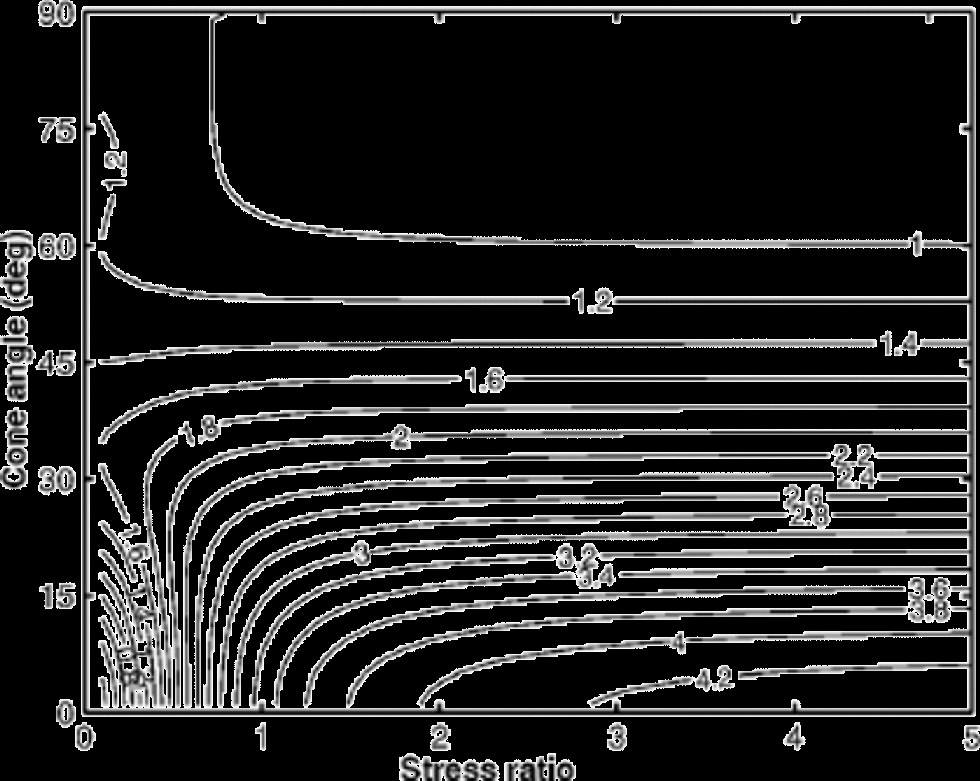
Fig. 3 The normalized shear deformation rate, ![]()
![]() as a function of the stress ratio
as a function of the stress ratio ![]() and cone angle α, in
and cone angle α, in ![]()
We now examine the dependence of the shear number S on the anisotropy and stress. Figure 4 shows the shear num- ber S as a function of cone angle and stress ratio ![]() in combined uniaxial compression and simple shear (UC&SS) stress state. the folding criterion (Equation (7)) shows that the slope, m, must be larger than S–1 for overturned folding to be likely. Figure 5 shows the shear number S as a function of cone angle and shear stress in combined pure and simple shear (PS&SS) stress state. Folding is more difficult in PS&SS than UC&SS since, with equal layer thinning, the extension in the x direction (and therefore layer flattening) is stronger in PS&SS. for isotropic material obeying a constitutive equation of the form
in combined uniaxial compression and simple shear (UC&SS) stress state. the folding criterion (Equation (7)) shows that the slope, m, must be larger than S–1 for overturned folding to be likely. Figure 5 shows the shear number S as a function of cone angle and shear stress in combined pure and simple shear (PS&SS) stress state. Folding is more difficult in PS&SS than UC&SS since, with equal layer thinning, the extension in the x direction (and therefore layer flattening) is stronger in PS&SS. for isotropic material obeying a constitutive equation of the form ![]() (Glen’s flow law (Reference GlenGlen, 1958)), where σe is the effective stress, it can be shown that
(Glen’s flow law (Reference GlenGlen, 1958)), where σe is the effective stress, it can be shown that ![]() in UC&SS and
in UC&SS and ![]() in PS& SS.
in PS& SS.

Fig. 4 Shear number S as a function of cone angle and stress ratio in UC&SS stress state. the slope m0 of a layer disturbance must be greater than S–1 for folding to develop.
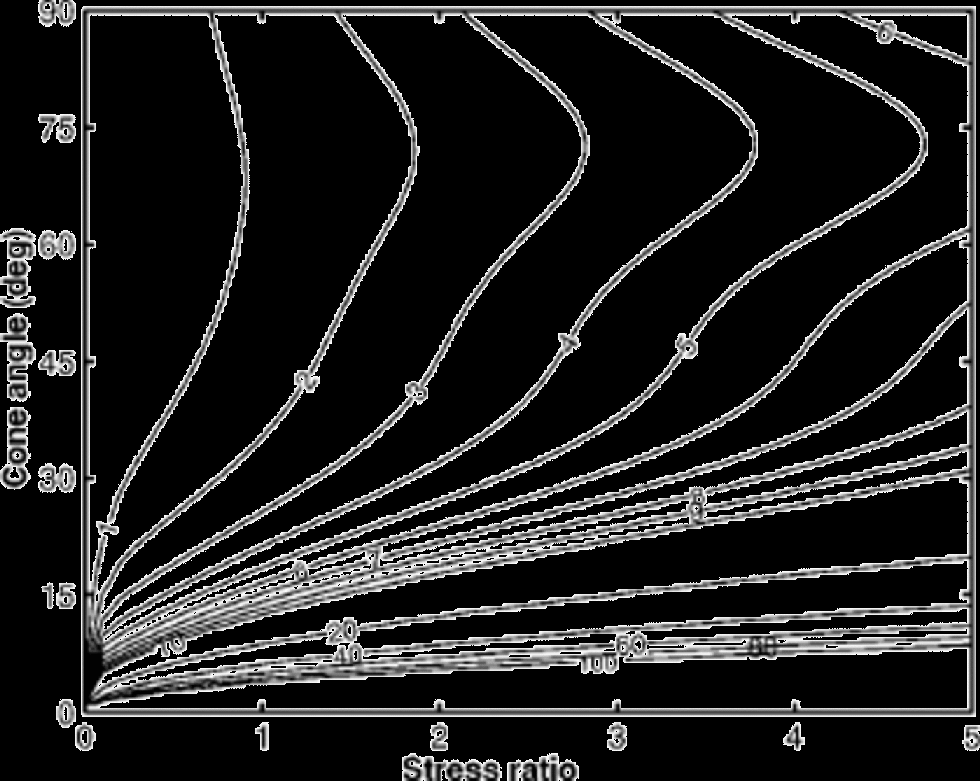
Fig. 5 Shear number S as a function of cone angle and stress ratio in ![]() stress state. the slope m0 must be greater than S–1 for folding to develop.
stress state. the slope m0 must be greater than S–1 for folding to develop.
The evolution of layers is calculated using Equation (2). Figure 6 shows the evolution of the same initial wrinkle in isotropic and anisotropic layers subjected to the same stress field. the initial amplitude is A =1, the initial base length is L = 10, and the initial slope of a straight-line segment between points A and B is m0 = 0.1. the stress state is PS& SS, with ![]() Under these conditions, point A will never overtake point B in the isotropic medium (Fig. 6a); overturned folding is unlikely to occur. In the anisotropic medium, on the other hand, folding occurs rapidly (T f ≈ 0.35) under the same conditions (Fig. 6b).
Under these conditions, point A will never overtake point B in the isotropic medium (Fig. 6a); overturned folding is unlikely to occur. In the anisotropic medium, on the other hand, folding occurs rapidly (T f ≈ 0.35) under the same conditions (Fig. 6b).
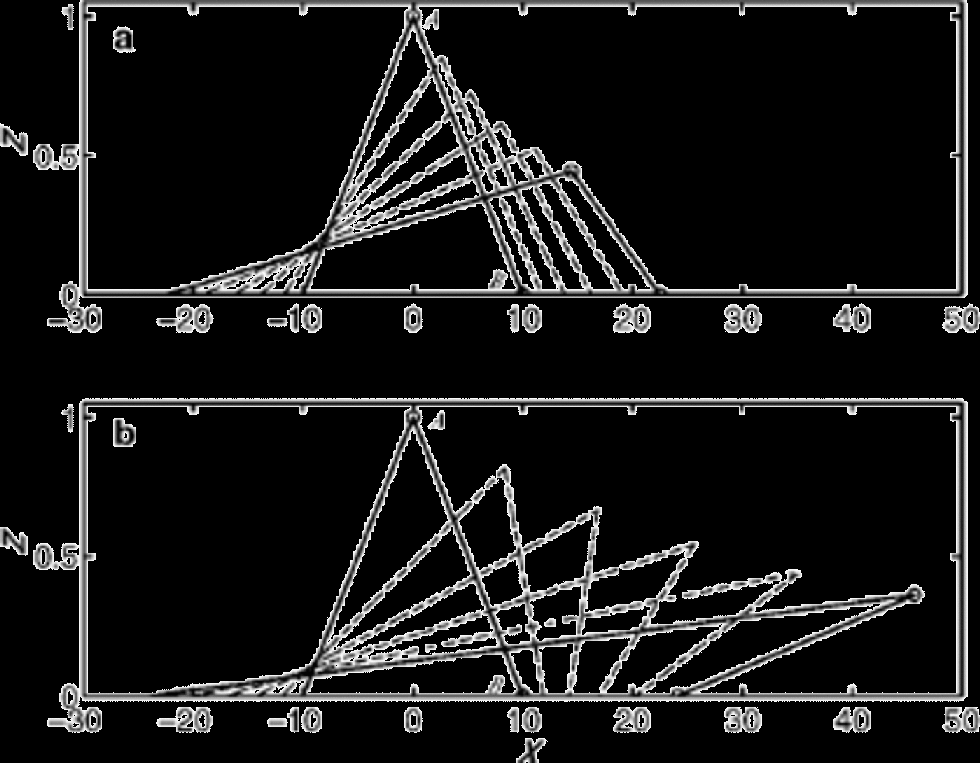
Fig. 6 Evolution of a wrinkle in PS&SS stress state. the ratio of shear to compressive stress is![]() (a) Isotropic material, α = 90˚. the line segment between A and B has a slope m0 = 1/10, and the top point A will never overtake the bottom point B (see Fig. 1). (b) Strongly anisotropic material, with a cone angle α = 20˚. In this case the wiggle overturns rapidly. the layer profiles are shown at equal time intervals, and at the same time in both panels.
(a) Isotropic material, α = 90˚. the line segment between A and B has a slope m0 = 1/10, and the top point A will never overtake the bottom point B (see Fig. 1). (b) Strongly anisotropic material, with a cone angle α = 20˚. In this case the wiggle overturns rapidly. the layer profiles are shown at equal time intervals, and at the same time in both panels.
3. Origin of Layer Disturbances
Near ice-sheet margins, horizontal compression tends to fold even apparently insignificant layer disturbances. Near a divide, however, horizontal extension (Fig. 1) prevents most disturbances from evolving into recumbent folds. Therefore special conditions are required to create layer disturbances that will fold. Unsteady ice-divide migration might provide layer disturbances on a scale comparable to the ice thickness (Jacobsen,2001), just as unsteady flow near margins can cause folds (Reference HudlestonHudleston,1976). There are also several possible sources for small-scale layer disturbances near ice divides. Sastrugi or accumulation variations at the surface seem unlikely sources for the small-scale disruption of stratigraphy observed at GRIP and GISP2 (Reference Waddington, J. F. and Alley.Waddington and others, 2001). Variations in rheological properties seem to be the most likely source of small-scale layer disturbances near ice divides. Differences in stiffness between horizontal layers in horizontal extension can cause boudinage (Reference SmithSmith, 1977; Reference Staffelbach, Stauffer and OeschgerStaffelbach and others, 1988; Reference Cunningham and WaddingtonCunningham and Waddington,1990), while variations in the anisotropy may lead to layer disruption in several ways. Inhomogeneous anisotropy causes inhomogeneous deformation, which after some time leaves wrinkles. Thus, if we can create wrinkles on a previously flat layer we have a mechanism to make folds. the problem then reduces to how to generate spatially heterogeneous fabric in flat layers.
3.1. Tilted cones
If the symmetry axis of the cone is non-vertical the deformationwill be a combination of pure and simple shear, even if the imposed stress state is only vertically directed pure shear stress (Reference Azuma and Goto-AzumaAzuma and Goto-Azuma,1996; Reference ThorsteinssonThorsteinsson, 2000). In contrast, vertically applied pure shear stress can only flatten and smooth disturbances in horizontally lying isotropic layers. to explore the deformation of a layer with variably tilted symmetry axes, we prescribe a sinusoidal variation of the tilt (to a maximum of ±40˚) of the cone symmetry axis (see Fig. 7a). This choice of spatial function for the tilt is completely arbitrary; the important point is that the tilt changes with X. We then apply vertical pure shear stress on the layer. Figure 7b shows the initially flat region within a layer, or a region, with a 20˚ cone whose symmetry axis tilt varies sinusoidally. Figure 7c shows the shape of the region after the applied deformation. the dashed box shows the shape of the same region if all the 20˚ cones are vertical; it has been subjected to ~2% vertical strain. Note that there is about 106 exaggeration for the vertical scale. the sense of shear is in the direction of the tilt (of the cone), creating the asymmetry in the resulting shape of the initial region. the ratio of maximum to minimum vertical strain rate, for a 40˚ and 0˚ tilt, respectively, is ~3.5. the troughs are displaced away from the center (X = 25), and the limbs thicken around the center. the spatially variable anisotropy has created wrinkles where none would be created if the ice were isotropic. Moreover, the wrinkles were created rapidly; note the small strain on the region with vertical cones (dashed box).
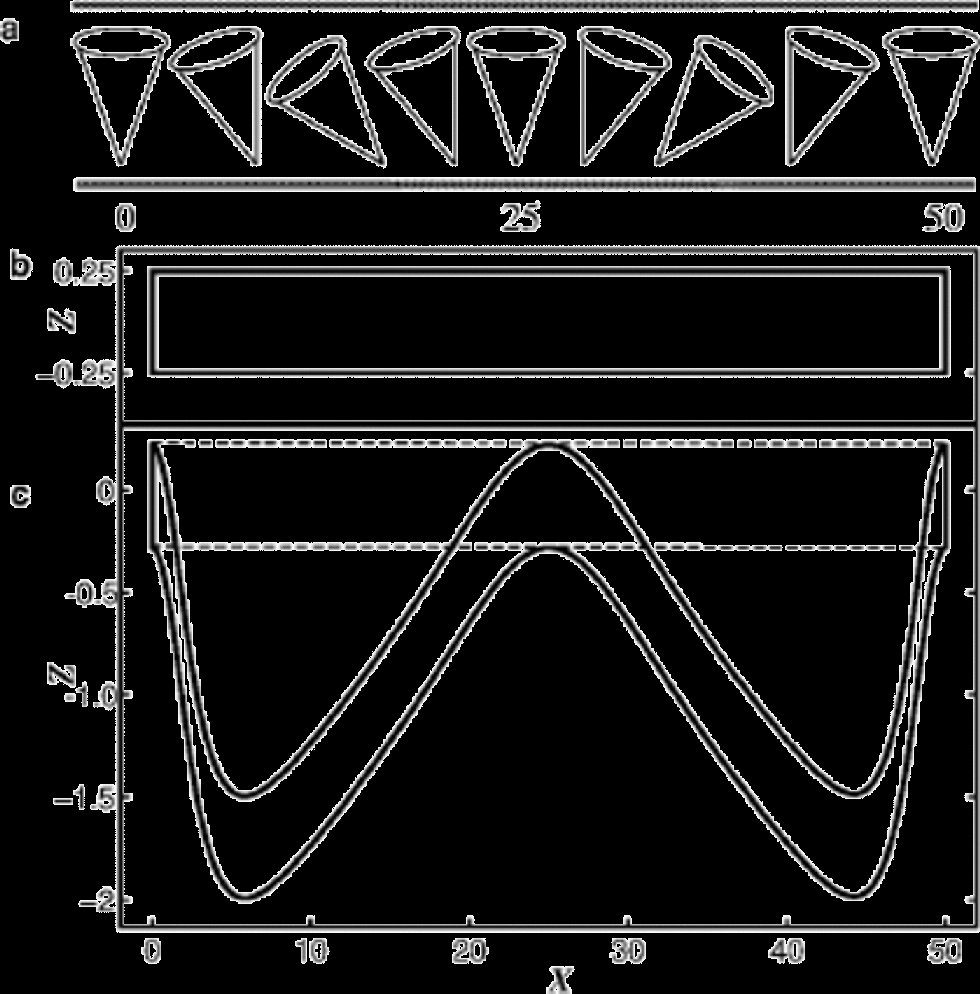
Fig. 7 (a) A layer with 20˚ cones that have a sinusoidal variation of the tilt angle, with a maximum tilt of ±40˚. (b) An initially flat region within a layer that has the fabric shown above, and (c) the same region after ~2% deformation in a pure shear stress field. the dashed box shows how the region responds if the cones are not tilted.
3.2. Evolution of tilted fabric
So far we have considered only cases in which the fabric is frozen (not evolving). In reality the fabric evolves during deformation, because the c axes of the ice crystals rotate due to intra-crystalline slip and constraints imposed by neighboring crystals (Reference Wenk and ChristieWenk and Christie, 1991). We use the fabric evolution model described in Thorsteinsson (2000, in press) to calculate the c-axes rotation and the velocity gradient as a function of time. Since the deformation rate changes continually during the deformation, we retain dimensional time in these calculations. the calculations were done at –10˚C and a compressive stress of 20 kPa. Other flow-law and model parameters can be found in Reference Thorsteinsson, Waddington, Taylor, Alley and D.D. BlankenshipThorsteinsson and others (1999) and Reference Thorsteinsson2000, Reference Thorsteinsson2001. However, our primary focus is on the differences attributable to cone tilts.
When the symmetry axis of the cone is tilted away from vertical, in vertical uniaxial compression, the strain rates are very different from those arising from the deformation of a vertically symmetric fabric. Figure 8 shows layer thickness as a function of time for layers with an initially 40˚ cone tilted by 0˚, by 20˚ and by 40˚ from vertical. the layer thickness h as a function of time is
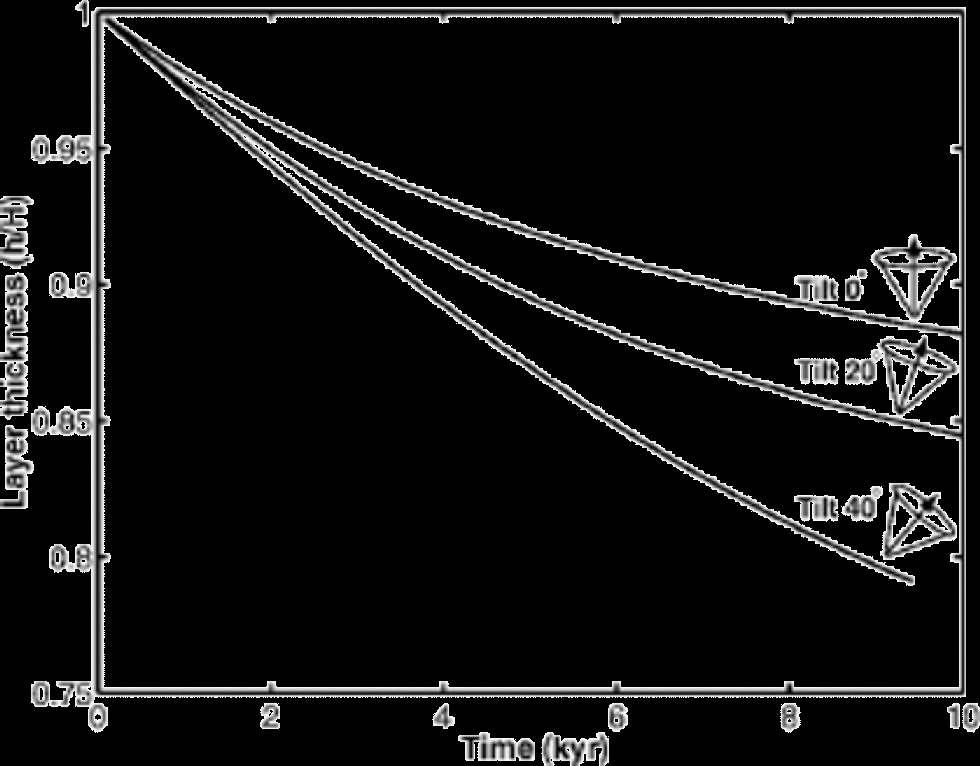
Fig. 8 Evolution of layer thickness, in uniaxial compression, as a function of time for different tilts of the original cone fabric. the three lines show the layer thickness for the initial condition of a 40˚ cone tilted by: 0˚ (top), 20˚ (middle) and 40˚ (bottom). the fabric then evolves freely in vertical uniaxial compression stress (using Reference ThorsteinssonThorsteinsson (2002) model, with mild-nearest-neighbor interaction and σ =–0.2 bar).
where H is the initial thickness of the layer. Since it is easiest to deform crystals oriented close to 45˚, the cone tilted by 40˚ has the highest vertical strain rate initially. the fabric-evolution calculations were carried out to 0.25 equivalent strain. the cone tilted by 40˚ accumulated 0.23 vertical strain at t ~ 8 kyr, the cone tilted by 20˚ accumulated 0.17 vertical strain at 10 kyr and the cone tilted by 0˚ accumulated 0.13 vertical strain at 10 kyr. If there is no fabric evolution (frozen fabric) then the cone tilted by 40˚ accumulated 0.21 strain at t ~ 8 kyr, the cone tilted by 20˚ accumulated 0.24 strain at 10 kyr and the cone tilted by 0˚ accumulated 0.21 strain at 10 kyr. the c axes rotate toward vertical, and, as Figure 9 shows, in the process they do not preserve the cone fabric, in the sense that the c-axis distribution tightens and migrates toward vertical. In addition, the boundary enclosing all of the axes can become elongated, and the c-axis density nonuniform.This demonstrates that a region of tilted cones will evolve to look very similar to adjacent regions with vertical fabric. the rate of layer thinning depends on how many crystals are close to, and pass through, the soft orientation, which is 45˚ in this case. Therefore the total strain for the cone tilted by 40˚ is greater when fabric evolution is active than for frozen fabric, but smaller when the tilt is 0˚.
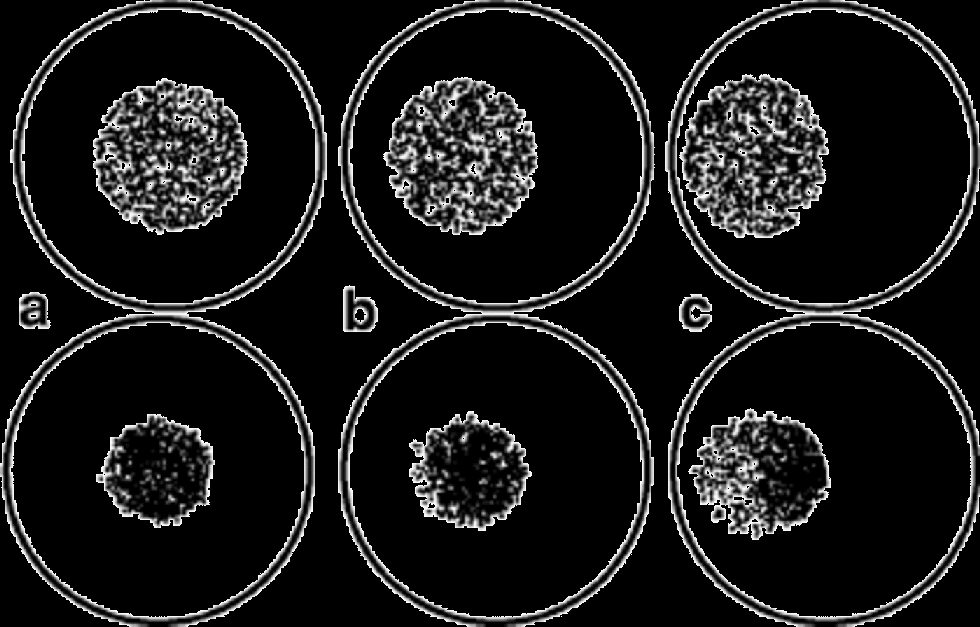
Fig. 9 Fabric evolution in uniaxial compression for 40˚ cones. the fabric is shown on Schmidt plots. Initial fabric is shown in the top row, and fabric after 8 kyr in the lower row. the cone is initially (a) vertical, (b) tilted by 20˚, and (c) tilted by 40˚.
Tilted cones are therefore transient features capable of generating layer disturbances.
3.3. Stripes
In a study of the GISP2 ice core, Reference Alley, Gow, Meese, Fitzpatrick, Waddington and BolzanAlley and others, 1997 found that the expected vertical c-axis fabric was interrupted by planes of grains, with the c axes oriented approximately in the dip direction of the planes. These features were called stripes because of their appearance when intersected by vertical thin sections. the stripes are typically one to very few grains in thickness. If they are orientated close to vertical, their length is a few grains, but if they are orientated further away from vertical, they tend to be longer. Reference Alley, Gow, Meese, Fitzpatrick, Waddington and BolzanAlley and others, 1997 hypothesized that stripes form through organized polygonization, such that after polygonization of the center grain the stress on neighboring grains will tend to rotate them so that they will be parallel to the polygonized grain. the stripe would then grow through internal spinning of grains at the end of a stripe, i.e. shear on the plane of the stripe would force the grain at the end into the same orientation.
From our exploration of the tilted cone fabric above, we know that non-vertical alignment of crystals will complicate the deformation, and potentially give rise to layer disturbances. Stripes have a tilted symmetry axis, relative to the bulk ice, and are therefore a potential source of small-scale folding. Moreover, if the density of stripes is spatially variable, increasing with depth for instance, then stripes might affect the flow on a larger scale.
4. Summary and Conclusions
Knowledge of the processes responsible for small-scale folding near ice-sheet centers is important in order to assess the integrity of ice-core records. Understanding the origin of layer disturbances near ice-sheet centers is a challenging problem. Several authors have suggested that anisotropy may play a significant role in that process (Reference Azuma and Goto-AzumaAzuma and Goto-Azuma,1996; Reference CastelnauCastelnau and others, 1998). We simulated the effects of tilted cones on the shape of a horizontal layer and found that tilted cones can indeed produce distorted layers in stress states that would not produce any wrinkles with isotropic ice. Accounting for fabric evolution does not change that conclusion.
The presence of rheological inhomogeneity and anisotropy changes the distribution of stress. In general, if the ice does not fracture or tear, then stress will be increased where the ice is relatively stiffer with respect to the applied stress. Similarly, where ice is made softer, stress will decrease. By taking the view that we can specify the stress pattern, we cannot incorporate this stress redistribution in our analysis. Therefore our results should be interpreted as a qualitative or semi-quantitative guide to the effects of anisotropy on folding.
We have shown that if regions of unadjusted fabric, i.e. fabric with different symmetry than expected in the current deformation field, exist in ice sheets, that fabric is a likely source of subsequent layer disturbances. the remaining question is then about the source of the anomalous fabric. Evidence from ice cores, such as stripes, shows that local heterogeneity can form, but the concentration or distribution of such features is not well known.
Under steady-state stress conditions, the vertically oriented anisotropy that tends to develop near ice domes can greatly reduce the slope of disturbances needed to generate overturned folds. Flow instabilities associated with an asymmetric fabric in initially flat-lying layers could be a source of layer disturbances that evolve into overturned folds, even in the dominantly extensile flow regime near ice divides.
Acknowledgements
We thank C. F. Raymond for valuable discussions that improved this work, the scientific editor T. H. Jacka, and two anonymous reviewers. This work was supported by grants OPP-9123660, OPP-9526707 and OPP-9815136 from the U.S. National Science Foundation.
Appendix
The Velocity Gradients
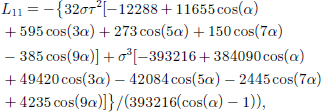
Here we give the non-zero velocity gradient components (Reference ThorsteinssonThorsteinsson, 2000), as a function of stress and cone angle, for the two stress states used. the velocity gradients below have been divided by A(T) in Glen’s flow law (Reference PatersonPaterson, 1994). A(T) = A0 exp[–Q/(RT)] incorporates the dependence of the deformation rate on temperature T.
In combined uniaxial compression and simple shear (UC&SS) stress, the non-zero velocity gradient components are
In pure shear and simple shear (PS&SS) stress, the nonzero velocity gradient components are


