1. Introduction
Thunderstorm activity draws current upward from the Earth. Some of this current returns to the Earth via the ionosphere. in this maimer, global thunderstorm activity-maintains a time-varying electric potential of approximately 250 kV, directed downwards, between the equipotentials of the lower reaches of the ionosphere (60- 90km) and the ground. in fair-weather regions, near ground level, a downward-directed geoelectric field of some 100 V m−1 can be measured. The geoelectric field is reponsive to global thunderstorm activity on time-scales of less than 1 hour. Measurements are optimised in regions where local diurnal variations in atmospheric conductivity are minor (principally over the oceans, in polar regions or high in some mountain regions). It is necessary to exclude data collected during periods of local electrical meteorological influence (high winds, falling or drifting snow and some types of cloud). Averaging to remove the day-to-day variability in global thunderstorm activity then results in a diurnal curve with a peak near 19UT, a minimum near 3UT and a range of some 30% of the mean. This is known as the global “fair weather” diurnal curve. Reference ReiterReiter (1992) provides a comprehensive review and background to geoelectric-field studies, and Bering (1995) gives a comprehensive interpretation of recent advances.
The hypothesis that the development of thunderstorm systems depends on the geoelectrical environment (see, e.g., Reference MarksonMarkson, 1981) remains controversial, but still has advocates. Recent accounts supporting this hypothesis include Tinsley and others (1989) and Tinsley (1996). Solar modulated galactic cosmic rays, sometimes supplemented by particles of solar origin, are postulated as the principal agent of solar influence on the geoelectric field. Cosmic rays control atmospheric conductivity in the crucial region between the tops of thunderstorms and the lower reaches of the ionosphere (see review by Reference Pomerantz and DuggalPomerantz and Duggal, 1974).
Solar influences on the geoelectric field differ between mid-latitudes and the polar regions (Tinsley, 1996). of specific relevance, a dawn-to-dusk potential is applied across the polar regions as a result of the interaction of the solar wind and the Earth's magnetic field (see, e.g., Tinsley and Heelis, 1993). The cross-polar potential results from the same interactions that generate auroral activity, and typically lies in the range 30-60 kV. It may, at times of increased solar activity, exceed 100 kV. The cross-polar potential may not be the dominant solar influence on the global geoelectric circuit, but it is of significant localised magnitude in the polar regions. The diurnal pattern generated as a station rotates beneath the cross-polar cap potential also aids detection.
Burns and others (1995) demonstrated that the fair-weather diurnal curve could be extracted with difficulty from data collected at the Antarctic coastal station of Davis. Attempts to extract a solar influence from the Davis data were encouraging, but not conclusive due to remnant local influences. The difficulty of eliminating local influences at this coastal site has led to an international effort (Australia, Russia, U.S.A.) to re-establish a geoelectric-field observatory at Vostok. Deployment in planned for the 1997-98 austral summer. Vostok's high altitude, low average wind speed and minimal cloud cover are significant advantages for measurements of the geoelectric field. The long periods of either continuous darkness or continuous light also assist in limiting the diurnal variation in atmospheric conductivity which may complicate the interpretation of geoelectric-field measurements. The planned project can be significantly enhanced by the operation of geoelectric-circuit measuring instrumentation at other polar plateau sites. The plan to reopen the site led us to rescale and analyze a 7 month Vostok geoelectric-field dataset. Our purpose was to confirm that Vostok is a suitable site for a renewed effort.

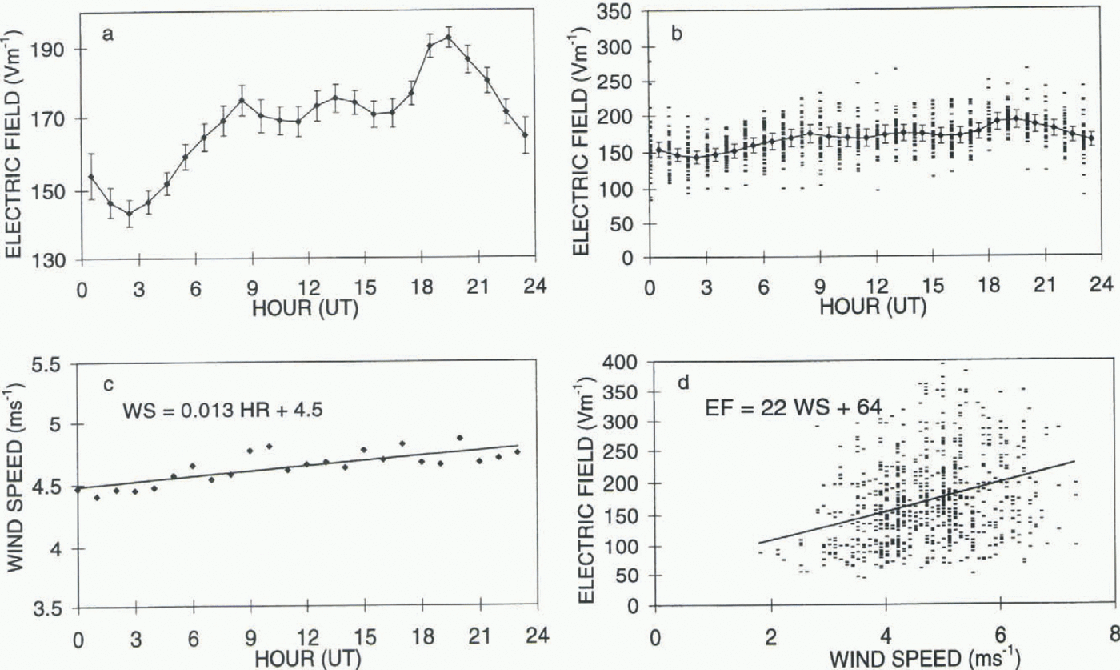
Fig. 1. (a) The average geoelectric-field diurnal curve of ike 36 selected days, (b) All the scaled data that contribute to the average geoelectric-field diurnal curve, (c) The hourly average wind speed for the 36 selected days. (d) The relationship between the geoelectric field and windspeed.
2. Instrumentation and Data
A rotating dipole electric-field mill, as described by Reference ParkPark (1976), was operated at Vostok from 1974 through 1980 under a U.S.S.R.-U.S.A. cooperative research programme. The electric-field mill was operated approximately 1.5 m above the snow surface. Data were recorded on duplicated chart records, one for Soviet and one for American scientists. Park (1976) published an analysis of March-November 1974 data, and Soviet scientists incorporated some analysis of the Vostok data in their research on the geoelectric field in polar regions (Reference Bandilet, Kozelova, Chernysheva and SheftelBandilet and others, 1982; Frank-Kamenetsky, 1983). We have been able to locate charts covering the interval May December 1979, for which concurrent hourly meteorological data are available.
The chart data were scaled to determine the average geoelectric-field value at the midpoint of each UT hour. The data series is not complete over the interval. Times when the values were off-scale or rapidly varying due to local influences were not included in the dataset. Occasionally the instrument failed or charts and ink ran out. The calibration of the data is as initially determined for the equipment before it was deployed at Vostok in 1974. The possibility of variation in calibration with time is noted. To our knowledge, no further calibration of this instrumentation was undertaken.
Hourly-resolution wind-speed and -direction, temperature and pressure data are available, as well as a list of times when falling or drifting snow and ice was observed. The wind-speed data are derived from the wind run in the 10 minutes prior to the hour for which they are noted. Wind direction was noted, on the hour, to 16 compass-point accuracy.
The average daily value of the measured electric field varies considerably. So as to avoid a bias in the diurnal averages, our initial data selection was made on the basis that a Complete 24 hours of electric-field values were available and suitable for analysis. Days when drifting or falling snow or ice was noted were rejected. The power station was located approximately 200 m to the northwest of the electric-field mill. When the wind was from the northwestern quadrant, occasional high values of the electric field were obtained. Typically the wind at Vostok comes from the west-southwest. Data were generally rejected when the wind came from the northwestern quadrant. We allowed some leniency when only a few of the 24 hourly wind direction values came from the edge of this quadrant and no effect on the electric-field dala was apparent. in this manner, 36 days of data were selected for further investigation.
3. Analysis and Results
Figure la shows the average diurnal curve of the 36 days of selected data. The long-term variation in the selected data-set was removed before estimating the uncertainties in the average diurnal curve. This was achieved by scaling the data such that each daily average equalled the average of the entire datset (169 Vm−1). All scaled data are plotted separately in Figure lb, using a wider-range plot. The error bars plotted in Figure la and b are ± one standard error (standard deviation divided by the square root of the number of samples). The average diurnal curve has a minimum at 2.5UT, a maximum at 19.5 UT, a range of 29% of the mean value, and a shape broadly consistent with the fair-weather curve. A similar curve is derived from Vostok data by Park (1976), although the range is approximately 23% of the mean.
Plots of electric field against temperature and pressure show no consistent trend, but a significant relationship is apparent between electric field and wind speed. Plots of electric field against wind speed, and the average hourly wind-speed values for the 36 days are also shown in Figure lc and d. The straight-line slope amounts to 22 [V m−1] per [ms−1]. The range of the average wind-speed values is 0.44 ms , corresponding to a possible electric-field variation of some 10 V m−1 . This compares with the magnitude of the diurnal elctric-field range of 49 V m−1 . The possible wind-speed influence is sufficient to affect the estimate of the range, but not the general shape, of the average diurnal electric-field curve.

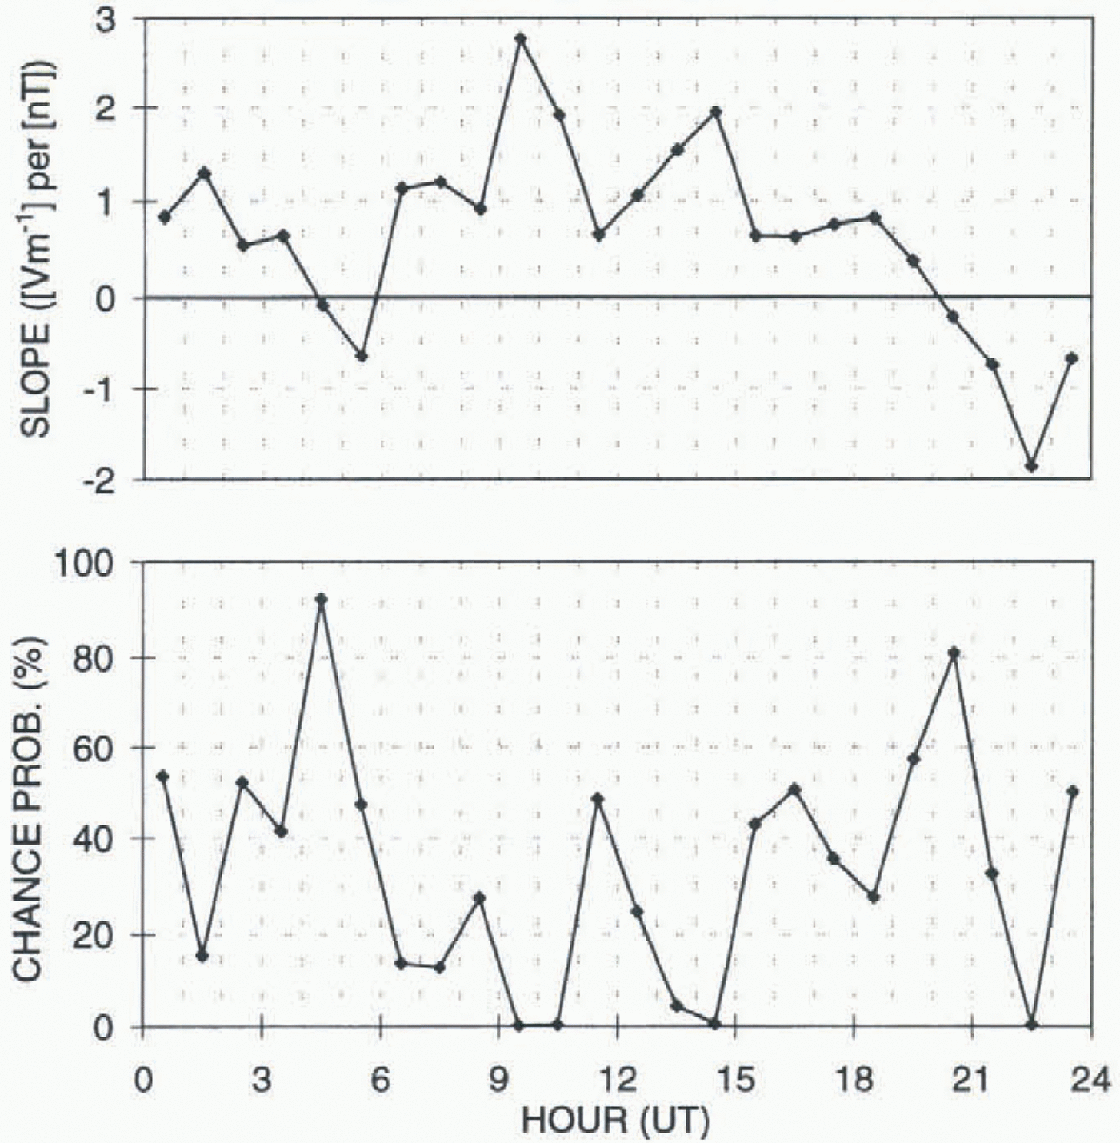
Fig. 2. The slope of the straight-line fit for the scaled geoelectric-field values and the IMF By component, for each UT hour; and the probability that the association is due to chance.
A closer examination of the data suggests that some of the association of wind speed and electric field may be due to a chance association of a seasonal variation in the electric-field magnitudes and a seasonal variation in average wind speeds. When the date range of elctric-field and wind-speed data compared is restricted to autumn (August-October: 18 days) the straight-line gradient reduces to 7 [V m−1] per [m s−1]. Similarly for winter data (May-July: 13 days), the gradient is 14 [V m−1] per [m s−1].
Park (1976) reported a reduction in the daily average electric-field value measured at Vostok of 15%, 1-3 days after the passage of a sector boundary of the Interplanetary Magnetic Field (IMF). A sector boundary is defined as when the general IMF orientation changes from toward the sun to away from the sun, or vice versa. The amount of data considered suitable from the 1979 dataset after consideration of known meteorological influences is insufficient for a direct repeat of Park's analysis. We investigate the association of IMF By the geoelectric field in order to define more directly the nature of the solar influence. Tinsley and Heelis (1993) discuss the magnitude of IMF y influences on the geoelectric field expected via changes in solar-wind-induced plasma convection at high-latitude polar sites.
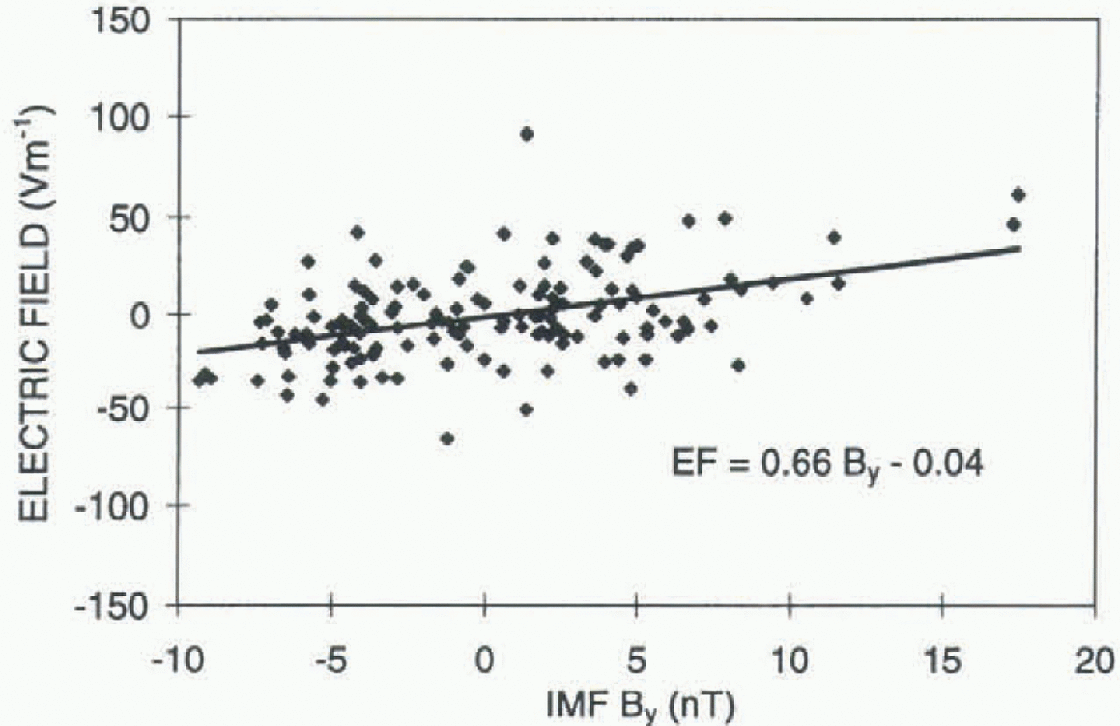
Plotted in Figure 2 is the slope ([V m−1] per [nT]) obtained from straight-line fits of the scaled electric-Held values against IMF By, for each UT hour. IMF By measurements were not available at all times, and the number of pairs of points available for each UT hour ranged from 33 to 36. The probability that the straight line is due to chance is plotted separately in Figure 2. The chance correlations are less than 5% for live hours: 9UT (for convenience, the value centred on 9.5UT is listed in this manner; similarly for other times in the description which follows), 10UT, 13UT and 14UT when the slope is positive and of average magnitude 2 [V m−1] per [nT], and 22UT when the slope is negative. The probability that the correlations for these hours are due to chance are 9UT 0.14%; 10UT 0.43%; 13UT 4.7%; 14UT 0.64%; and 22UT 0.5%). Figure 3 shows a combined plot of the 9UT; 10UT, 13UT and 14UT scaled elctric-field values, further adjusted by subtracting the average diurnal value of the appropriate hour to allow intercomparison, against the IMF By values. A straight line yielding a slope of 0.7 [V m1] per [nT] best fits these data.

Fig. 3. Scaled geoelectric-field values, corrected for average diurnal trends for 9UT, 10UT, 13UT and 14UT, compared with the IMF By component.
The manner in which the electric-field data are scaled, combined with the fact that for a large fraction of the individual UT hours the association with IMF By is positive, means that we have likely reduced the magnitude and significance of the association. Forcing each daily average electric-field value to be equal to the grand average of the 36 days has also likely generated the “significant” negative correlation at 22UT. The scaling is, however, desirable to reduce the large variation in the absolute magnitude of the electric-field values which may be due to changes in local conductivity, wind-speed influences and variations in the daily global thunderstorm activity.
Both the electric field and IMF By are self-correlated over intervals longer than the hourly separation of data points. However, we decided to ivestigate the relationship between IMF Byand the scaled electric-field values, which were further corrected to allow for the average diurnal trend depicted in Figure 1, across the 6-18UT time range for which contiguous positive correlations in excess of 0.5 [V m−1] per [nT] were measured for the individual UT hour correlations. Ίο achieve a reasonable correlation it is necessary for a range of IMF By values to be recorded across the time interval selected, so not all days can be expected to yield significant correlations. To make some allowance for chance associations, only linear fits with “random” chance correlations of < 1 % are considered. Nine of the 36 selected days met this criterion, eight of which yielded positive slopes. Two large-magnitude slopes of -8.5 [V m−1] per [nT] and +15 [V m−1] per [nT] were measured; the remainder yielded an average slope of 4 [V m−1] per [nT].
Discussion and Conclusions
This analysis has confirmed the result of Park (1976), that the global fair-weather geoelectric-field curve can be observed at Vostok. This high, Antarctic-plateau site has a considerable advantage for recording geoelectric-field data relatively free of local contamination, compared with the coastal Antarctic site of Davis.
IMF By is significantly positively correlated with the geoelectric field al 9UT, 10UT, 13UT and 14UT, when Vostok is magnetically linked to the dayside interaction region between the solar wind and the Earth's magnetic field. Magnetic noon at Vostok occurs near 13UT. The positive association of geoelectric field and IMF Byappears on occasions to persist while Vostok rotates across the magnetic footprint of the entire dayside magnetosphere. The magnitude is of the order of 3 [V m−1] per [nT].
We have been able to show a more direct association of solar variability and the geoelectric field at Vostok than was reported by Park (1976), but a direct test of the Park result requires a larger dataset.
Acknowledgements
The electric-field measurements at Vostok, Antarctica (1974-80), were carried out under a Soviet-American cooperative research agreement. Funding for collaborative visits by Russian scientists to the Australian Antarctic Division for work on this project was provided by the Australian Antarctic Foundation. The assistance of J. French with computing advice and I. Smolskaia with some Russian transliteration is gratefully acknowledged.


