Introduction
Developments in oil exploration and production off the eastern coast of Canada are limited by the presence of icebergs and sea ice. Icebergs affect operations in two ways. First, because of the large mass of individual icebergs, drilling or production platforms must be designed to either withstand loads which an iceberg could impart to a structure or be capable of avoiding an iceberg. Second, subsea equipment on the ocean floor is at risk owing to collision with or scour from iceberg keels.
At the preliminary stages of platform selection and design, an understanding of the numbers of ice-bergs which pass a location, their temporal and spatial distribution, and their mass, draft, and general linear dimensions are essential. Petro-Canada Exploration Inc. has for the past several years been developing this understanding. This paper does not address all the concerns mentioned but rather it is the intent here to summarize data on the physical dimensions of icebergs in the Labrador Sea and, to a limited degree, on the Grand Banks of Newfoundland. Further, some discussion of relevant relationships between some of the more commonly measured dimensions are presented.
The relationship of height to draft has been widely used in the past (e.g. Reference RobeRobe 1976). This paper will show that other relationships demonstrate stronger correlations and that the applicability of any derived relationship is sensitive to the location where it is applied. The actual location for which such relationships are developed may itself influence the relationships, making them inappropriate for use in other iceberg-prone areas.
A discussion showing how these relationships may be used to calculate the draft and mass of icebergs in the Grand Banks region is presented.
Data Presentation Of Measured Iceberg Parameters Off Labrador
The Data
Most of the data was collected by the Labrador Group of Companies in support of exploratory drilling activity in the Labrador Sea during the period 1973 to 1978. These data are restricted to the period from July through October, which is most favourable for drilling. The largest numbers of observations were made in August (49%), followed by September (26%), July 119%), and October (6%). The frequency of observations noted here is not comparable with the frequency of occurrence of icebergs as the data are biased by the scope and extent of the drilling program. The data were taken from well sites located between 52°N and 60°N lying on the offshore banks (Saglek, Nain, Makkovik, and Hamilton). A summary of the descriptive statistics is presented in Table I. Information on the areas of icebergs at the waterline, which was collected by the International Ice Patrol (IIP) in 197G, (US Coast Guard 1979) is used in conjunction with relationships between physical dimensions, which were derived from measurements on icebergs in the Labrador Sea, to calculate further physical dimensions.
Table 1. Statistics Of Icerergs

Types of icebergs
The complex shapes of icebergs defy simple classification. Several differing classifications were employed and these have been reduced to five common forms: pinnacle, drydock, domed, blocky, and tabular. The tabular iceberg is regarded as having undergone a minimum of degradation and erosion whereas the other forms bear witness to such activity in varying degrees.
The pinnacle iceberg was the most commonly observed form (36%), followed by tabular (29%), domed (16%), drydock (15%), and blocky (4%) icebergs. ¡f one simplifies this to a binary classification composed only of tabular and non-tabular forms, the data suggest that the latter occur more than twice as often as the less degraded forms (71% versus 29%).
Physical dimensions
The water line length (defined as the longest horizontal dimension at the water plane) of icebergs in Labrador seas is shown to have a median value of 94 m with an extreme measured value of 550 m. The histogram presented in Figure 1b) illustrates the skewness of the data. Table I shows the statistics of the data.
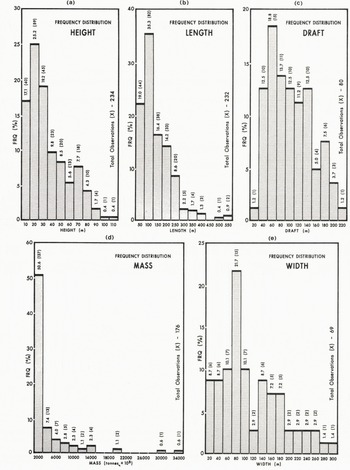
Fig. 1. Frequency distributions of selected ratios between physical dimensions of icebergs: (a) height (b) length (c)draft (d) mass, and (e) width.
The maximum height (defined as the distance between the waterline and the highest point of an iceberg) measured in Labrador seas was 103 m with a median value of 23.5 m. The frequency distribution is presented in Figure 1(a). Further research may show that this dimension exhibits different relation-ships to other dimensions depending upon the degradation of the iceberg. For example, the ratio of height to mass is quite different for partially degraded (tabular) icebergs than for extremely degraded (pinnacle) icebergs although the actual measured height on these two types may be similar.
Draft is a particularly important dimension. For example, to those interested in iceberg scour, a knowledge of draft provides a means of determining the probable numbers of recent scour marks and the areas where scour is most likely to occur. Also, accurate knowledge of draft enables calculation of the depths needed to bury equipment in order to protect it from interaction with iceberg keels. Data from Labrador (Fig.l(c)) show a median value of 89 m for draft and a maximum value of 202 m. This upper value is similar to an upper value of 187 m measured off west Greenland (Danish Hydraulic Institute 1979).
The estimated mass of an iceberg is an estimate based upon one of several models which employ information on dimensions and shapes. Results, to date, from the Labrador Sea indicate that most masses (78%) in this area are less than 2 × 10⁶ tonnes. Maximum estimated masses are approximately 30 × 106 tonnes with median and modal values of 390 × 103 and 50 × 103 tonnes respectively. Figure 1(d) and Table I show the data and data statistics.
Relationships Between Measured Dimensions Of Icebergs
Relationship of length to other dimensions
Table II shows relationship of length to height as approximately 3:1; however, this ratio is highly variable, ranging from 0.5:1 to 50:1. Figure 2(c) illustrates this variability.
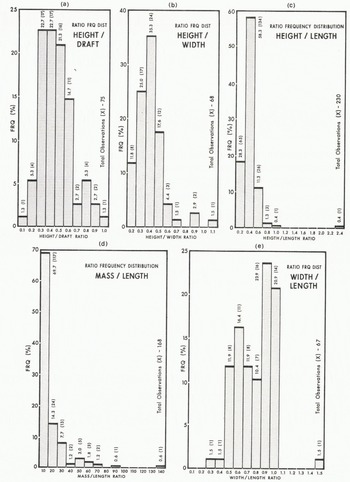
Fig. 2. Frequency distributions of selected ratios between physical dimensions of icebergs: (a) height : draft, (b) height : width, (c) height : length, (d) mass : length, and (e) width : length.
Table 2. Statistics For Iceberg Ratio Data
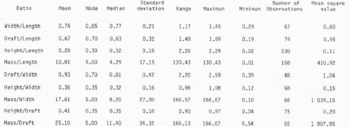
The ratio of width to length shows width to be some 80% of the length. This relationship demonstrates that use of the waterline length as an effective diameter of the iceöerg is not unduly conservative.
The ratio of mass to length is approximately 4 × 10³ to 5 × 10³ tonnes of mass per metre of length, if averaged over all iceberg sightings. Examination of the raw data shows that a simple ratio such as this cannot be used as a predictive tool because the ratio of mass to length is proportional to actual iceberg size; that is, the ratio between mass to length increases as the mass of the iceberg increases. The range in ratios is illustrated in Table II and Figure 2(a) and is between 130 × 103 tonnes of mass per metre of length at approximately 30 × 106 tonnes and 1 × 10³ tonnes of mass per metre of length at approximately 30 × 103 tonnes.
The central tendency measures of the ratio of draft to length vary from 0.6 to 0.7 using the data from Labrador. Lewis and Benedict (1981) estimate that icebergs may increase their draft after rolling by as much as 20%. Figure 3(c) and Table II show that less than 10S of the drafts exceed waterline length with two extreme cases where draft exceeded the waterline length by 50 to 60S. The mass of these icebergs ranged from 400 × 103 to 600 × 103 tonnes.
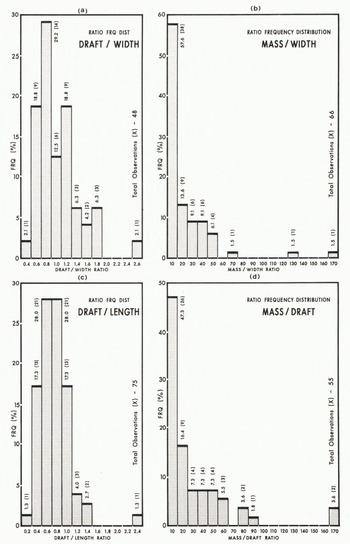
Fig. 3. Frequency distributions of selected ratios between physical dimensions of icebergs: (a) draft : width, (b) mass : width, (c) draft : length, and (d) mass : draft.
Relationships of dimensions of an iceberg to its draft
Ratios of height to draft are a popular method for estimating the drafts of icebergs (e.g. Reference RobeRobe 1976) despite obvious flaws. An iceberg which is only slightly degraded may have the same height as a degraded iceberg. Assuming that they both have similar linear dimensions, the degraded iceberg must have a smaller total mass and would thus presumably float higher in the water and consequently have a smaller draft (assuming similar underwater shapes) than the more massive, slightly degraded iceberg. If this tenet holds true one might expect that the ratio of height to draft probably varies not only with mass but also with shape, making this particular relationship a poor predictive tool. This paper is not intended to criticize the past use of this relationship (at a time when less data were available for icebergs), but rather to suggest that other relationships are simpler to use and provide better estimates.
Table II and Figure 2(a) show that the bulk of the data indicates a ratio between 0.2 and 0.6.
The ratios of mass to draft have the same inherent problem as the ratios of mass to length in that both sets of ratios are a function of iceberg mass. The ratio of mass to draft varies between 166 × 103 tonnes of mass per metre of draft at 30 × 106 tonnes to 940 tonnes of mass per metre of draft at 30 × 103 tonnes of mass.
Functional Relationships
The measurement of the dimensions of icebergs, is dangerous, time-consuming and expensive. In many cases it is possible to obtain one or more above-water dimensions from visual or photographic information. When this information is coupled with a suitable functional relationship it may be possible to infer, to a first approximation, the dimensions of other variables such as draft.
To define potential relationships a simple regression of the logarithmically transformed values was undertaken. These relationships were defined for each of the classifications of iceberg type (tabular, domed, pinnacle, blocky, drydock) as well as for all types combined. The functional relationships are presented in the power function format (Y = axh) in Table III, which also includes the correlation coefficient and the number of observations. As an example,
Table 3. Functional Relationships Between Parameters Of Iceberg Dimensions Y X N
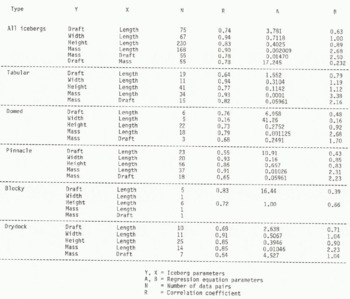
The correlation coefficient is 0.83, and 230 pairs of observations were used to define the relation.
In employing these relationships one should note their strength and the size of the data set, and review the applicability of such a mathematical form which uniquely defines a dependant y-value from a specified input and is defined from a model with minimal variance.
Use Of Functional Relationships To Estimate Other Dimensions Of Icebergs
Length is the simplest and probably the most accurate dimension which can be measured for an iceberg. It would be beneficial, therefore, if other dimensions which are difficult, costly or dangerous to attain, such as draft, could be estimated from data which can be collected more easily. To this end, an evaluation of the accuracy or applicability of some of the identified dimensional relationships is made. As draft and mass are the two most critical parameters with regard to offshore oil exploration or engineering design, emphasis will be given to their calculation in the ensuing discussion.
In an earlier paper (Hotzel and Miller in press) it was demonstrated that the power curve equation for mass to draft derived for tabular and pinnacled icebergs in Labrador seas worked reasonably well when applied to data collected off the coast of west Greenland (Danish Hydraulic Institute 1979). From zero to 110 m, calculated drafts compare extremely well, with 86% of the calculated data lying within ±25% of the line, indicating a perfect correlation between observed and predicted values (see Fig. 4). Given that the technique used to measure iceberg drafts is imprecise, the accuracy of the estimates is believed to be close to, or within, the accuracy of the technique.
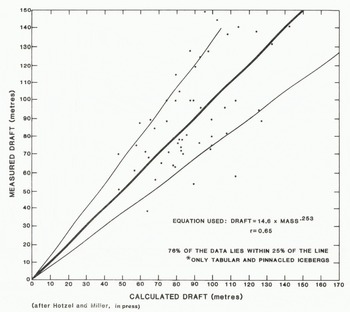
Fig. 4. Measured draft vs calculated draft for 49 icebergs* off Greenland using a power curve equation
At the larger sizes (> 3 × 10⁶ tonnes) the power curve equation appears to underestimate draft. Two possible explanations for this are that there are insufficient numbers of observations at these larger masses so that the power curve equation is imprecise and that a better relationship could be attained if the present data were partitioned.
It is believed that some of the relationships such as power curves for length to draft ratios calculated from data from the Labrador Sea may represent a distinct statistical ensemble and may not apply in other areas where icebergs occur. Investigation of the dependence of the statistical relationships concerning iceberg characteristics at different sites is currently underway.
Estimation Of Mass And Draft Of Icebergs On The Grand Banks
In 1976, the IIP measured the waterline areas of some 104 icebergs on the Grand Banks of Newfoundland from aerial photography (US Coast Guard 1979). As one of the few publicly available and rigorous data sets of measurements of icebergs made on the Grand Banks, these data provided an opportunity to use some of the power curve relationships developed from the data from the Labrador Sea.
As the IIP data were presented as waterline areas it was necessary to estimate a more commonly measured linear dimension from these areas, and waterline length was chosen. Certain basic assumptions about iceberg shape were made: that the planimetric section of the iceberg was circular in form and the length was taken as twice the characteristic circle radius. Values of length calculated in the initial phase of this study were used to calculate draft, using the power curve formula
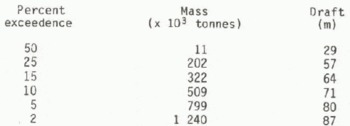
The cumulative frequency distribution of these data is presented in Figure 5. It is interesting to A cumulative frequency distribution of mass was also produced and from this a table showing percentage exceedence valuesFootnote * is presented (Table IV). The cumulative frequency distributions indicate that on the Grand Banks, during the period of measurement, the median mass and draft are 11 × 103 tonnes and 29 m respectively, with extreme icebergs at the 5% exceedance level some 800 × 10μ tonnes mass and 79 m draft.

Fig. 5. Cumulative frequency distribution for drafts calculated from IIP data.
Table 4. Percentage Exceedences Of Icebergs On The Grand Banks (From Iip (1976))
Concluding Remarks
This paper summarizes a series of measurements of the physical dimensions of icebergs collected by the Labrador Group of Companies in support of offshore exploration for oil and gas. In addition, functional relationships amongst iceberg dimensions and ratios between the major linear dimensions are presented. The use of these relationships in estimating other dimensions and the applicability of these relations in other regions is discussed. The derived functional relationships have been used, together with data on waterline areas, to calculate preliminary estimates of mass and draft of icebergs for the Grand Banks. Work is now underway to upgrade and refine the relationships and their regional and physical dependencies.


