1. Introduction
Dissipated energy is a physical quantity that can be used to estimate the protective effects of natural or artificial obstacles against natural hazards. For example, mountain forests play a significant role in protection against rockfalls and avalanches (Reference FührerFührer, 2000). The energy-dissipation capacity of trees has been quantified from experiments and simulations (Reference Bartelt and StöckliBartelt and Stöckli, 2001; Reference Dorren and BergerDorren and Berger, 2006; Reference Dorren, Berger and PuttersDorren and others, 2006). Against rockfalls in particular, different artificial defence techniques (Reference DescoeudresDescoeudres, 1997) can be used to dissipate energy. Flexible ring-net barriers are an example of how structures can be designed on the basis of dissipated-energy criteria (Reference Peila, Pelizza and SassudelliPeila and others, 1998; Reference Anderheggen, Volkwein, Grassl, Mang, Rammerstorfer and EberhardsteinerAnderheggen and others, 2002; Reference Cazzani, Mongiovì and FrenezCazzani and others, 2002). Recently designed rock sheds are also able to dissipate the energy of blocks hitting the edge of the slab via irreversible structural damage, damage to the concrete, plastic deformation of the steel reinforcement and plastic buckling of the specially designed metal supports (Reference Delhomme, Mommessin, Mougin and PerrotinDelhomme and others, 2005).
In avalanche science, the effects of snow avalanches on obstacles are mostly studied through the forces and pressures applied to the obstacle (Reference Schaerer and SalwaySchaerer and Salway, 1980; Reference McClung and SchaererMcClung and Schaerer, 1985; Reference Norem, Kvisterøy and EvensenNorem and others, 1985; Reference Schaer and IsslerSchaer and Issler, 2001; Reference Berthet-Rambaud, Limam, Baroudi, Thibert and TaillandierBerthet-Rambaud and others, 2008; Reference Sovilla, Schaer, Kern and BarteltSovilla and others, 2008a,Reference Sovilla, Schaer, Kern and Barteltb; Reference Thibert, Baroudi, Limam and Berthet-RambaudThibert and others, 2008). Regarding the flow, these forces represent the rate of variation of the linear momentum of the avalanche. Other investigated parameters are most often flow deviation, snow deposition around the obstacle and effects of obstacles on the run-out distance (Reference Larsen and NoremLarsen and Norem, 1996; Reference Harbitz, Domaas and EngenHarbitz and others, 2000; Reference JόhannessonJόhannesson, 2001; Reference Naaim, Taillandier, Bouchet, Ousset, Naaim-Bouvet, Naaim and Naaim-BouvetNaaim and others, 2004; Reference Cui, Gray and JόhannessonCui and others, 2007; Reference Faug, Chanut, Naaim and PerrinFaug and others, 2008a,Reference Faug, Gauer, Lied and Naaimb). The energy dissipated during avalanche–obstacle interactions has not been addressed frequently. Only Reference Sheikh, Verma and KumarSheikh and others (2008) have specially and experimentally estimated the amount of energy dissipated in the flow interaction processes with various obstacles (mounds, blunt bodies and catch dams) using the conversion of the kinetic energy of the flow into gravitational potential energy. Most papers dedicated to the energy of avalanches have focused on the seismic energy dissipated into the ground for the purpose of avalanche size classification, model validation, indirect velocity measurement (Reference Firstov, Sukhanov, Pergament and RadionovskiyFirstov and others, 1991; Reference Nishimura and IzumiNishimura and Izumi, 1997; Reference Suriñach, Vilajosana, Khazaradze, Biescas, Furdada and VilaplanaSuriñach and others, 2005; Reference Vilajosana, Suriñach, Khazaradze and GauerVilajosana and others, 2007a,Reference Vilajosana, Khazaradze, Suriñach, Lied and Kristensenb) or avalanche detection (Reference Leprettre, Martin, Glangeaud and NavarreLeprettre and others, 1998).
A global energy balance is helpful to determine how mechanical energy is internally dissipated by frictional processes as well as how structures slow avalanche motion by consuming part of the flow (kinetic) energy. In an avalanche, internal energy dissipation involves irreversible processes such as the viscous shear work, inelastic collisions, material fracture, abrasive wear, air drag as well as basal sliding on rough ground surfaces. For example, a global energy-balance approach was adopted by Reference Bartelt, Buser and PlatzerBartelt and others (2006) to determine how the kinetic energy associated with the random motion of snow granules influences the internal energy fluxes and therefore the motion of the avalanche (Reference Buser and BarteltBuser and Bartelt, 2009). More importantly, a global energy balance can be helpful in designing structures with different energy dissipation functions. By generating internal deformations in the flow, both natural (trees, vegetation and ground roughness) and man-made structures (deflecting and catching dams, earth mounds) will lead the avalanche to dissipate its own energy. Dissipative structures may also ‘absorb’ a part of the energy by undergoing volumetric dissipative damage (plastic deformation) or other frictional processes (material wear or total destruction).
The purpose of this paper is to present an energy calculation based on the deformation measured on a structure impacted by an avalanche (section 2). The internal energy is calculated from the elastic potential energy and the kinetic energy of the structure. Energy dissipation is calculated from the internal damping of the material and the plastic deformation (section 3). Finally, the mechanical work done on the structure, at the boundary, by the avalanche forces is deduced from the energy balance (section 4). Results are discussed and compared to the kinetic energy flux of the avalanche (section 5).
2. Test Site, Experimental Device and Data
2.1. Test site
Experiments were carried out at the Lautaret full-scale avalanche site in the southern French Alps (45.033° N, 6.404° E). This site has been used by the Cemagref research institute since the 1970s (Reference IsslerIssler, 1999; Reference Naaim, Taillandier, Bouchet, Ousset, Naaim-Bouvet, Naaim and Naaim-BouvetNaaim and others, 2004). It has been extensively described in recent papers (Reference Berthet-Rambaud, Limam, Baroudi, Thibert and TaillandierBerthet-Rambaud and others, 2008; Reference Thibert, Baroudi, Limam and Berthet-RambaudThibert and others 2008; Reference Baroudi and ThibertBaroudi and Thibert, 2009), so only a brief description is provided here. Different avalanche paths located on the southeast slope of Mont Chaillol (max. 2600m a.s.l.), near Lautaret Pass (2058 m a.s.l.), are used for experiments with artificially released avalanches. Avalanche path No. 1 is used for the experiment presented in this paper. It is 500 m long with an average slope of 368, reaching 40° in the starting zone. Dry snow avalanches released in early winter generally exhibit a density of 80–160kg m−3 in the starting zone and 300–350 kg m−3 in the deposition area. Typical release volumes vary from 500 to 10 000 m3, and the maximum front speed can reach 30–40 m s−1 (Reference Meunier, Ancey and TaillandierMeunier and others, 2004).
2.2. Experimental device
The structure is a 1 m2 plate supported by a 3.5 m high steel cantilever beam fixed in the ground, facing the avalanche (Fig. 1). The plate can be moved along the beam to be located exactly at the surface of the initial snow cover prior to avalanche release. A strong concrete foundation was built to support the structure. It is set up in the avalanche path nearly 150 m downhill from the starting zone, i.e. in the area where avalanches generally reach their maximum velocity.

Fig. 1. View of the macroscopic structure and the two different levels of mechanical models: (a) the thick steel plate supported by a steel HEB beam, and (b) the cantilever beam with an additional concentrated mass for the plate.
Strains are measured at the bottom of the beam with four precision strain gauges placed in the maximum bending moment area. Gauges are linked to the data acquisition system in the shelter using quarter-bridge wiring. An additional ±490 ms−2 accelerometer is placed on the beam to measure high-frequency vibrations of the structure in the direction of the avalanche. Vibration data are used for the modal study of the structure. Data acquisition equipment includes a National Instruments SCXI-1000 high-frequency logger with a sampling rate of 3000 Hz to ensure the recording of dynamic effects. Signals are filtered with a four-pole Butterworth (–24dBoctave−1) filter with a cut-off frequency set to 1 kHz to ensure a bandwidth without aliasing. This structure is used to measure avalanche impact pressures and other important parameters (acceleration, velocity, etc.). The impact pressure history is obtained by deconvolving the strain histories with the frequency response function of the structure (Reference Berthet-Rambaud, Limam, Baroudi, Thibert and TaillandierBerthet-Rambaud and others, 2008; Reference Thibert, Baroudi, Limam and Berthet-RambaudThibert and others, 2008; Reference Baroudi and ThibertBaroudi and Thibert, 2009).
2.3. Data
We have used the data of the artificial avalanche released on 26 March 2008 (Reference Baroudi and ThibertBaroudi and Thibert, 2009). This avalanche started as a 0.2 m thick layer of small dry (-1.1 °C) rounded particles (density ρ = 160 kgm−3) in the starting zone. By the time it reached the structure, it had formed a 1 m thick dense flow. The deformations measured in the maximum bending area of the structure are plotted in Figure 2.
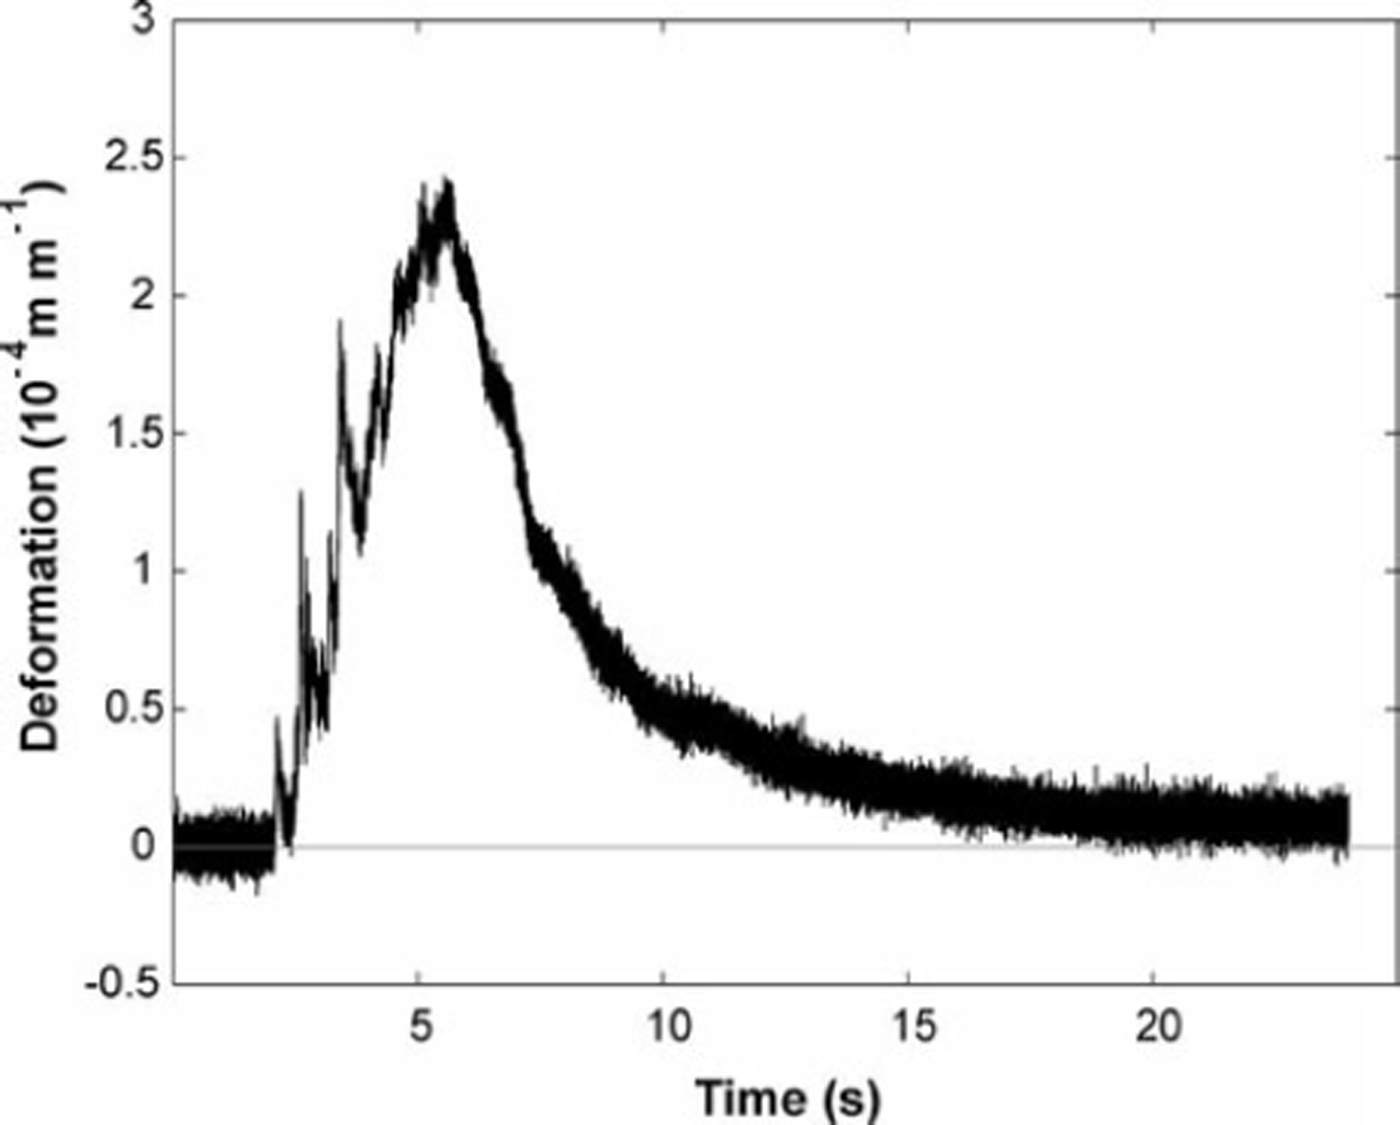
Fig. 2. Deformation measured during the avalanche released on 26 March 2008.
The velocity of the avalanche at the structure location, deduced from video analysis, and the reconstructed pressure, are plotted in Figure 3 (Reference Baroudi and ThibertBaroudi and Thibert, 2009). From image analysis, the avalanche-structure interaction can be divided into two steps that are consistent with the pressure profile of Figure 3:
-
1. For the first 2–3 s, a saltation layer (a mixture of air and ice particles with a high air content) impacts the structure.
-
2. Then a dense layer of snow impacts the structure for nearly 15 s with decreasing velocity (Fig. 4). The height of the flow is constant and equals 1 m until the flow stops and the snow is deposited around the structure. Snow density in the deposition area is 300 kgm−3.
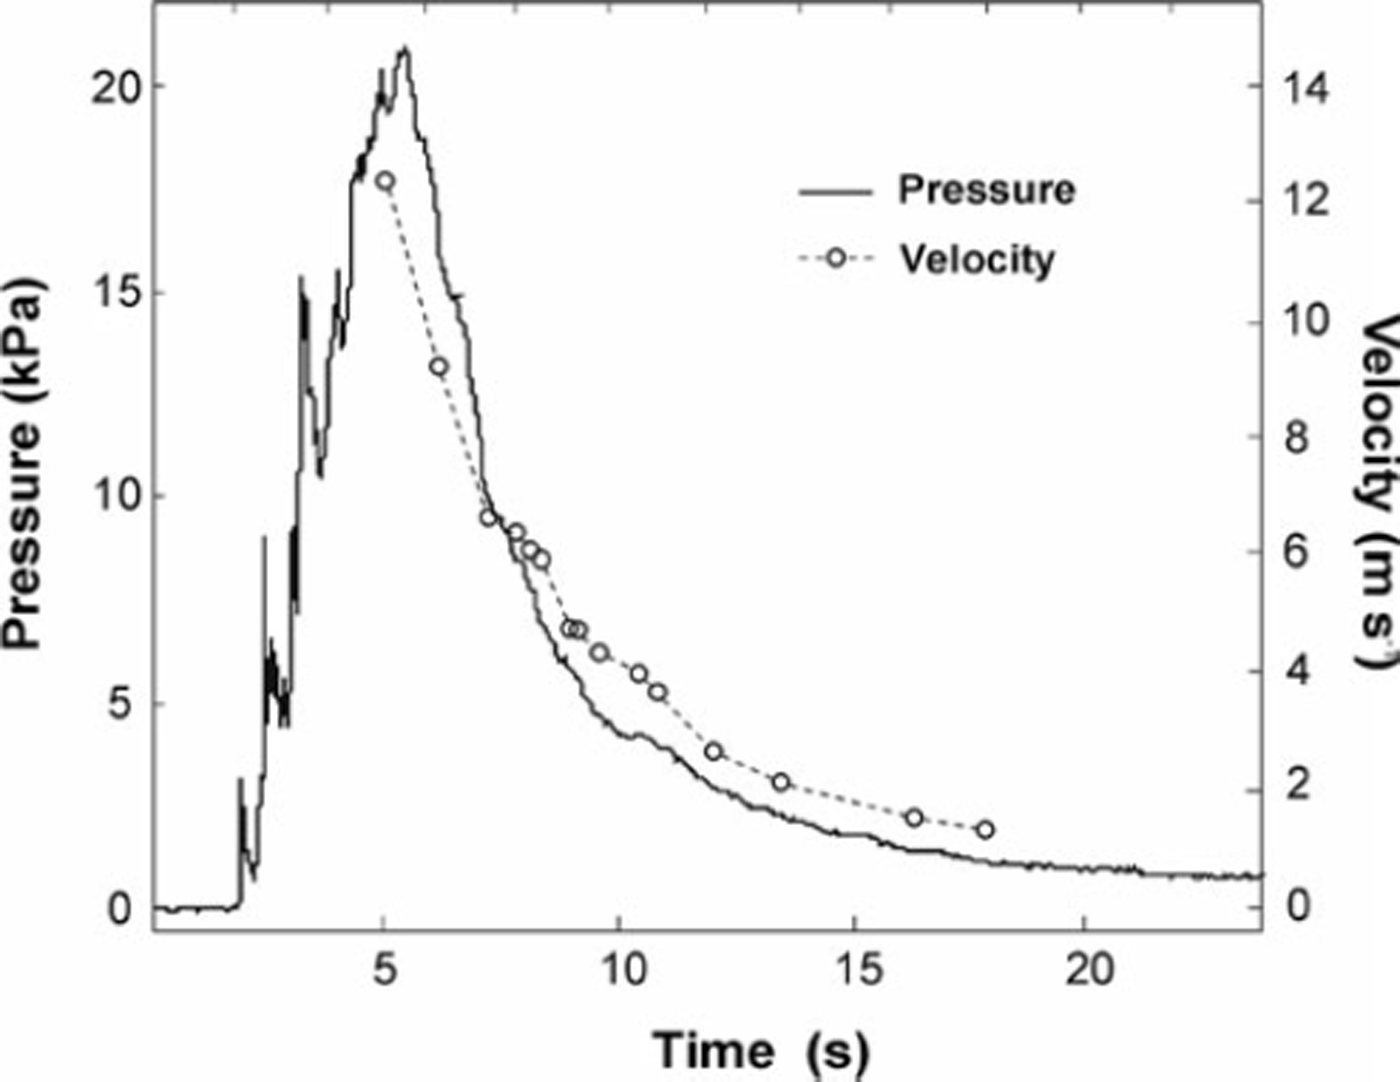
Fig. 3. Velocity and reconstructed pressure of the avalanche released on 26 March 2008.
The snow-structure interaction forms a dihedral dead zone of dense snow (ρ = 420 kg m−3) stuck on the plate as described in Reference Thibert, Baroudi, Limam and Berthet-RambaudThibert and others (2008) for another avalanche event.
3. Method
A methodology to estimate the work (energy) done on a structure by an impacting avalanche and the work rate (power) is presented here. Both the total injected and dissipated energy are estimated. The principle is to apply the theorem of mechanical work of a system (Reference MalvernMalvern, 1969) to the impacted structure. The elastic potential energy and kinetic energy of the structure are calculated from the experimental deformations and an adequate mechanical model of the structure. Then the energy dissipation due to potential plastic deformation and internal material damping are calculated. Finally, the mechanical work done at the structure boundary by the avalanche forces is deduced from the energy balance.
3.1. The model of the structure
The structure of interest is an elastic beam and a plate (Fig. 1a). The plate integrates the impacting pressure of the avalanche spatially. This beam is mechanically modelled by a Bernoulli–Euler beam (Fig. 1b). The plate is modelled, for the spectral response, as an additional concentrated mass (Fig. 1b). A comparative study on the adequacy of various models to describe the behaviour of the structure under dynamic loading has already been performed by the authors in a previous paper (Reference Thibert, Baroudi, Limam and Berthet-RambaudThibert and others, 2008). In that paper, a finite-element model using thin-plate discrete Kirchhoff triangular (DKT) elements (Reference Batoz, Bathe and HoBatoz and others, 1980) and a Bernoulli-Euler beam model with an additional concentrated mass (Fig. 1b) were used to investigate the dynamic behaviour. The numerical results, the eigenfrequencies and the deformation frequency response functions were compared to in situ impact hammer tests and to other direct measurements (deformation and acceleration) when the structure was impacted by the avalanche (Reference Thibert, Baroudi, Limam and Berthet-RambaudThibert and others, 2008). It was found that both models correctly capture the observed frequency behaviour of the macro-sensor and that the first to third eigen modes of the structure are accurately represented by the beam model. This implies that elastic potential and kinetic energies of the structure can also be described accurately by the beam model. The parameters of the model are as follows: the moment of inertia of the beam section is l=1.29 × 10⁻⁴ m4, its cross-sectional area is A = 100 × 10−4 m2 and its Young’s modulus is E=210 GPa. The density of steel is ρ s = 7850 kg m−3. The additional plate mass is M p=190 kg and the damping factor is £=0.33%.
Consider the resultant of the loads applied by the avalanche on the structure being F e. The system on which the avalanche force F e is doing work We is the beam-plate macro-sensor. According to the theorem of mechanical work applied to our system (Reference MalvernMalvern, 1969; Reference MauginMaugin 1992), the rate of change of mechanical work U+K is equal to the power (work rate) d/dt (W e - Wdis) of the forces working on the beam. Therefore, noting time derivatives by a dot above the variable:
where U is the total deformation energy (potential energy of elastic deformation), K is total kinetic energy, W e is the work of external forces, and W dis =W f + W p is the dissipative work due to the internal friction forces and plastic deformation. The work done by the avalanche impact forces on the structure is calculated by integrating Equation (1), given that the work is related to the work rate as follows:

Because we have only measured deformation e(xi,y = h,t) at a few points xi, the whole spatial distribution e(x,y = h,t) should be ‘interpolated’ using the Euler-Bernoulli beam model in order to calculate the spatial integrals along the structure. For this, we have used the deformations given by the Euler-Bernoulli beam model and the avalanche impact force F e reconstructed by inverse analysis. The force is obtained from the measured deformation histories e via a regularized deconvolution problem:

where ω = 2Trf is the angular frequency, φ a regularization filter and h the deformation frequency response function of the structure. This deconvolution procedure is described in detail in several papers (Reference Berthet-Rambaud, Limam, Baroudi, Thibert and TaillandierBerthet-Rambaud and others, 2008; Reference Thibert, Baroudi, Limam and Berthet-RambaudThibert and others, 2008; Reference Baroudi and ThibertBaroudi and Thibert, 2009). By applying this dynamic force to the beam model of Figure 1b, we solve the equations of motion for the displacement v(x,t):
using homogeneous initial and boundary conditions:
where spatial derivatives are noted by a prime. Equation (3) is used to compute deformation histories as an equivalent of Equation (4) written in the frequency domain. Finally, this dynamic force is applied to the beam to obtain the whole strain distribution over time by solving the motion equations for the Euler-Bernoulli beam model as:
where m=1…n, and x= (x 1 , x 2 ,…,xn) are the spatial discretization of the beam and FT– 1 denotes the inverse Fourier transform.
3.2. Reversible energy calculation
The elastic and kinetic energies are reversible energies that are mechanically relocated outside of the system once it is unloaded. The potential energy of the elastic beam, U, comes essentially from the bending strain energy:

where v(x) and v"(x) = (d2 /dx2)v(x) are the displacement and curvature, respectively. The deformation at the fibre located at height y from the neutral axis of the beam section is calculated as e(x,y;t)=-y.v"(x,t). Equation (6) can also be expressed in terms of deformation:

where 2h is the height of the HEB profile (Fig. 1a).
The potential energy of shear is negligible compared to the bending strain potential energy. The ratio of shear and bending strain energies is given by:
with a Poisson’s ratio v of 0.3, and a shear correction factor 77 of 1.2 (Reference Timoshenko and YoungTimoshenko and Young, 1956). Using the numerical values for I, A and L given in section 3.1, Equation (8) results in a ratio of 1% and therefore a negligible shear elastic component in the energy balance.
The kinetic energy is the second reversible energy. It is composed of the translational and the rotational displacement contributions. Assuming small rotations θz
≈ ∂v/∂x of the beam sections, the rotational kinetic energy ![]() can be neglected compared to the translational kinetic energy of the beam and the plate. The main component of the kinetic energy of the structure, K, is therefore given by:
can be neglected compared to the translational kinetic energy of the beam and the plate. The main component of the kinetic energy of the structure, K, is therefore given by:

where Mp and vp denote the mass of the plate and its velocity, respectively.
3.3. Dissipated energy
As opposed to the elastic and kinetic energies which are reversible and mechanically relocated outside of the system, two main forms of irreversible energy dissipation are related to internal friction and potential plastic deformation. Both correspond to a heat source in the structure.
The dissipation power due to internal friction is:

where the structural viscous damping force is ![]() and C=2psωξ.
and C=2psωξ.
The dissipation power related to the volume undergoing plastic deformation V p is:

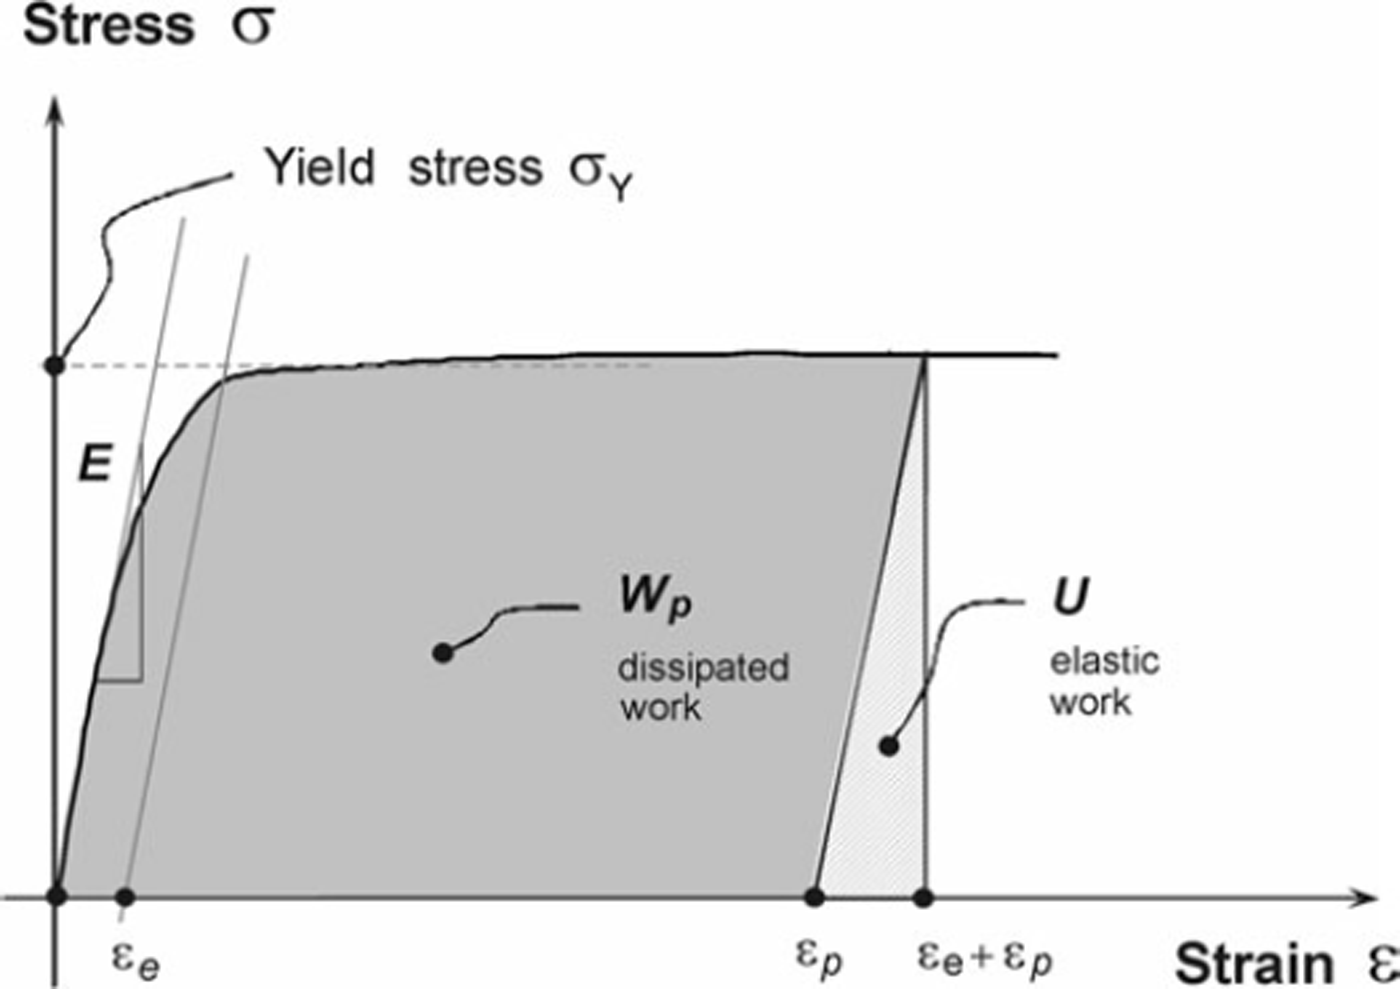
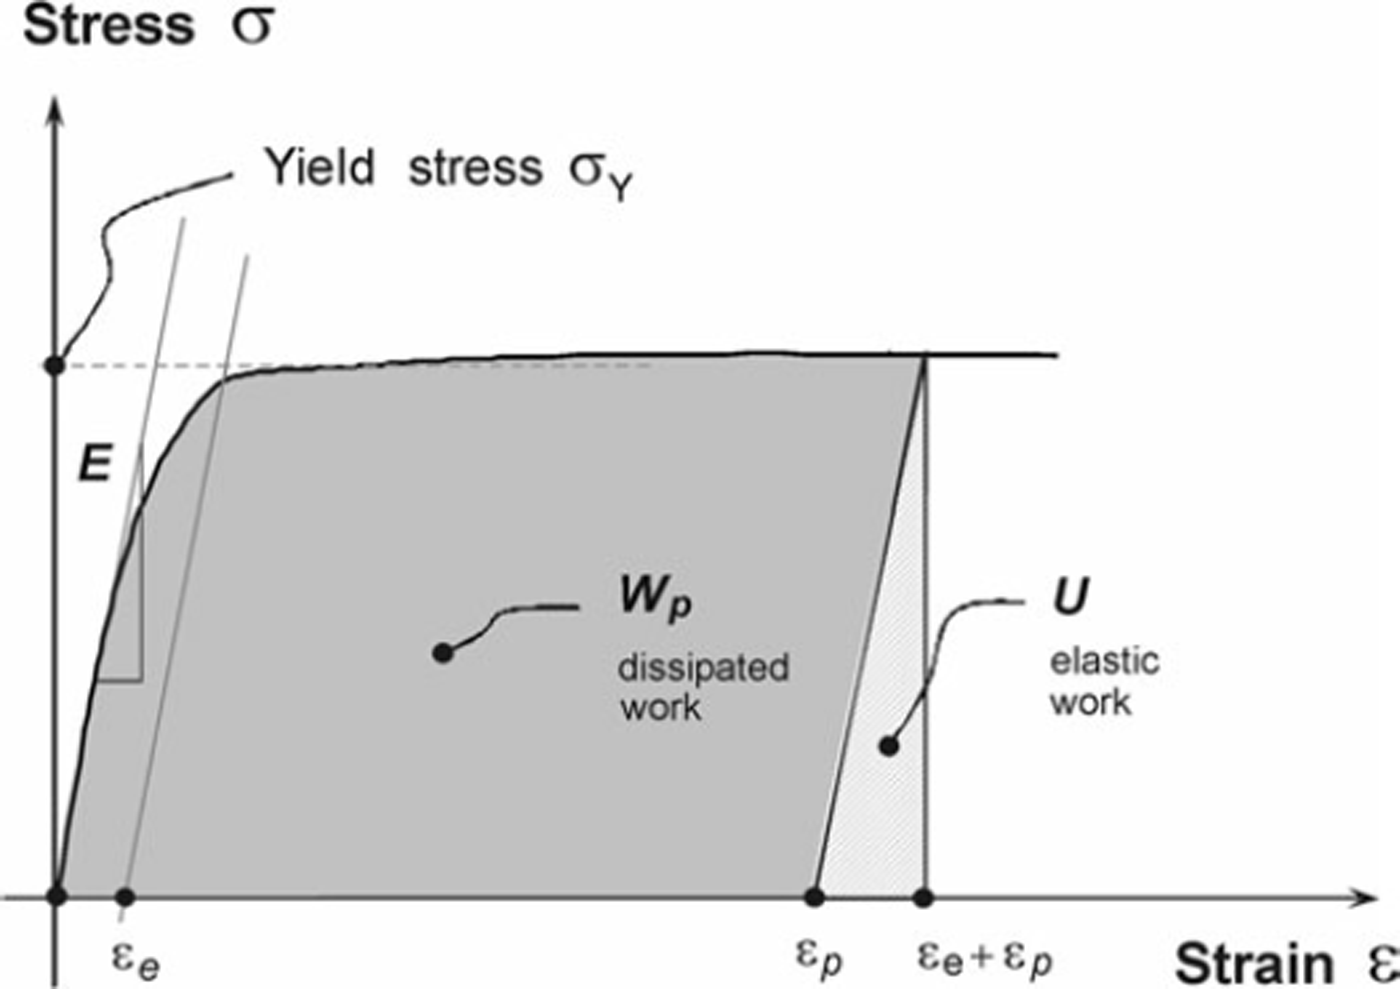
where the irreversible plastic deformation, ϵ p, is given by ϵ p = ϵ – ϵ e, where ϵ e denotes the reversible elastic part (Fig. 4).
4. Results
4.1. Check using synthetic data
To check the calculation method presented in the previous section, we have calculated an energy balance for the structure using an a priori known load history. The energy balance can therefore be calculated independently by the left- and right-hand sides of Equation (1).
A constant force of 10 kN (an equivalent of P = 10 kPa on the 1 m2 plate) is applied for 2 s at the free end of the beam after a loading time of 1 s (load rate = 10kNs−1; Fig. 5). Following the method presented above, the total work done on the structure is calculated from the left-hand terms of Equation (1). The elastic energy, U, is the main component (Equation (7)) and reaches 30J. Because the calculation takes dynamic effects into account, before the beam reaches its steady state, the kinetic energy component (Equation (9)) is responsible for the small energy fluctuations in the total work (Fig. 5). When the beam is unloaded at t = 3 s, the work done by the elastic forces is the opposite and yields a residual energy content of +0.06J. This non-zero residual value is the irreversible dissipative work due to internal damping (Equation (11)) that is converted into heat during the loading and unloading steps. There is no plastic dissipation here, as the strain remains under the yield strain.
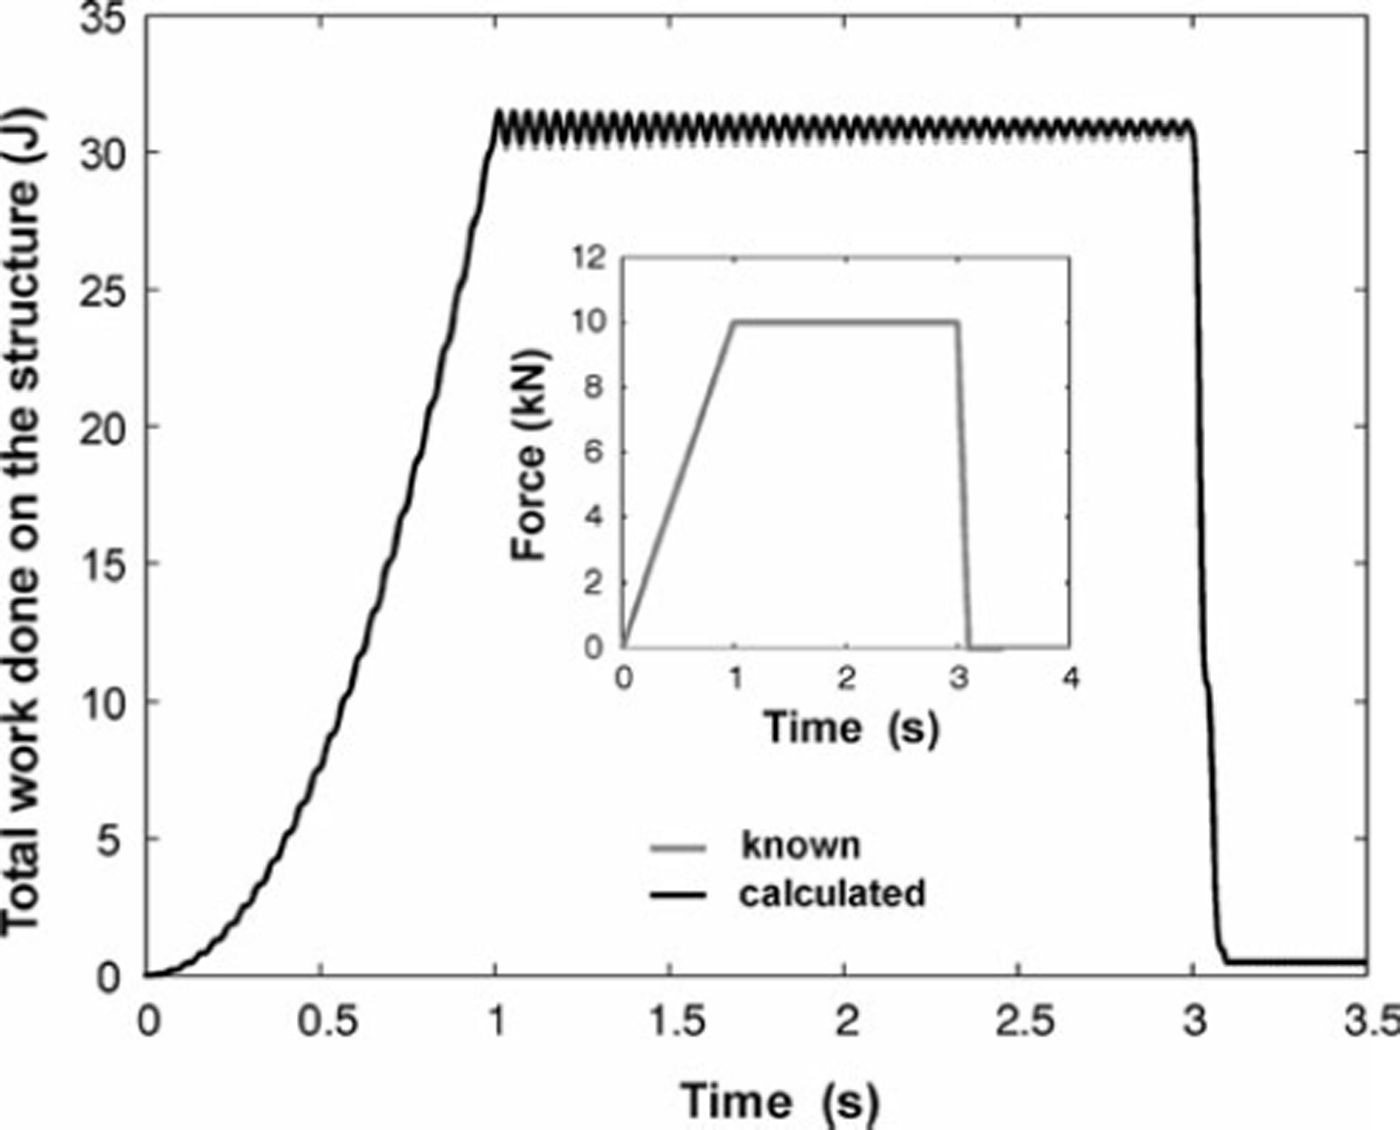
Fig. 5. Total work done on the structure as calculated from Equations (8), (10) and (11) using the deformations along the beam given by Equation (5).
This result is checked by directly calculating the work done by the applied force (right-hand side of Equation (1)). This can be done in two different ways:
-
1. Assuming static loading conditions, the relation between the beam tip displacement, 8, and the applied force, F, at the free end of the beam is given by δ = FL3/3EI (Reference Timoshenko and YoungTimoshenko and Young, 1956) which results in 8 = 5.3 mm. The elastic component in the energy balance is therefore U = Fδ/2 = F 2 L 3/6EI which gives U= 26.4J, in reasonable agreement with the computed value (Fig. 6). The restrictive assumption of static loading neglects displacement rates, exchanges between potential and kinetic energy and friction dissipation. It is therefore reasonable that we find a lower value.
-
2. The work done on the structure by the applied force at the free end can be calculated under dynamic conditions as well, quantifying the right-hand side of Equation (1) from Equation (2):
(12)
where F(δ) represents the force applied at the free end for tip displacement 8. The work We is therefore the area under the curve of Figure 6 where F(δ) is the force plotted as a function of the tip displacement computed by the Euler-Bernoulli beam model. Oscillations result from the dynamic calculation and exchanges between elastic potential- and kinetic-energy components. The area under this curve is 30J, which confirms the estimation of We from the integration of the local deformation along the beam from Equations (7), (9) and (10) and the energy balance (Equation (1)).
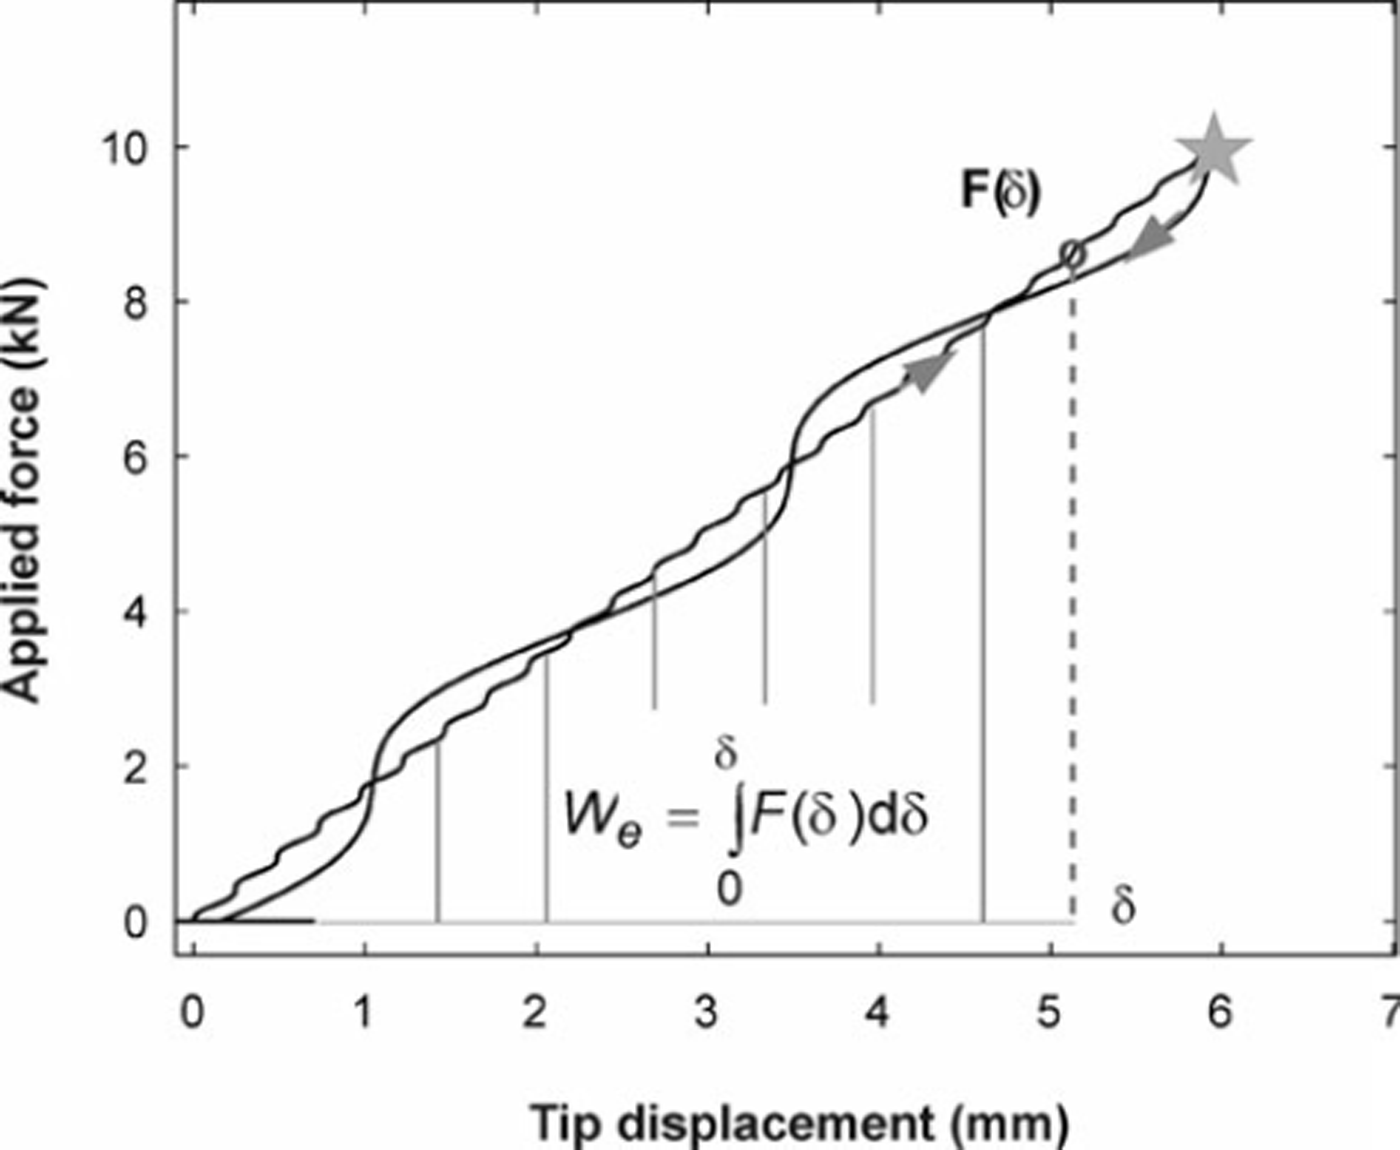
Fig. 6. Two methods of calculating total work done on the structure (see text): from the static tip displacement at nominal load (star); and using the computed tip displacement from the Euler-Bernoulli beam model (curve). Oscillations from the dynamic calculation are exchanges between elastic potential- and kinetic-energy components.
4.2. Work and power applied to the structure
The pressure applied on the structure by the avalanche released on 26 March 2008 only results in elastic deformation (Fig. 2), far below the elastic limit of 1.2 × 10⁻³ m m−1. There is consequently no power dissipated by plastic deformation within the structure (Equation (1)). The irreversible power is only due to internal damping (Fig. 7a). This power is proportional to the square of the displacement rates of the material. It is therefore mainly dissipated in the first seconds of the impact when the structure has the highest displacement velocities v. The corresponding quantity of energy integrated over the [0, 25 s] time range results in very little total work, amounting to <0.1 J (Fig. 7b).
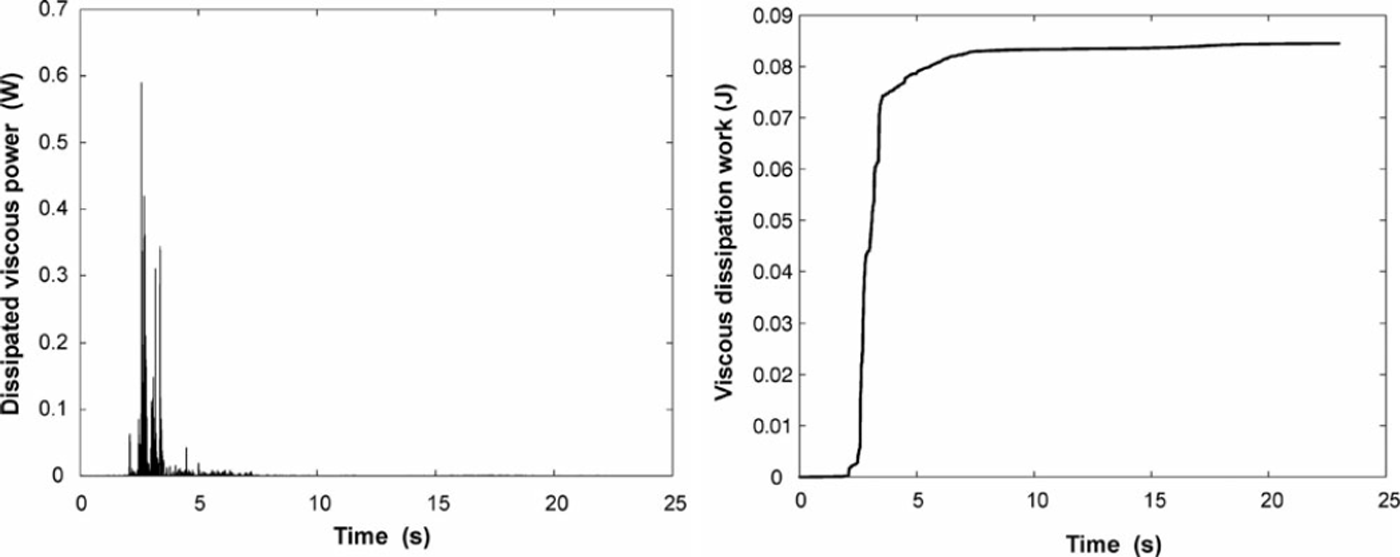
Fig. 7. (a) Irreversible power due to the internal friction ![]() , and (b) cumulative dissipative work due to the internal friction (converted into heat).
, and (b) cumulative dissipative work due to the internal friction (converted into heat).
The total power, d/dt(U+ K)+ W dis , injected in the structure by the impact of the avalanche (Fig. 8) is therefore mainly reversible with prevailing U and K terms. As observed for the power due to internal friction, the kinetic energy of the structure, K, is only high on impact when the displacement terms v are highly time-variable (Fig. 9a). After t =2.5 s, the loading of the structure is mainly static, resulting in negligible time-derivative terms v in Equation (9). The internal power is therefore mostly due to the bending strain potential U which represents >98% of the total power. It reaches >300 W for the 1 m2 of the structure exposed to the flow of the avalanche.
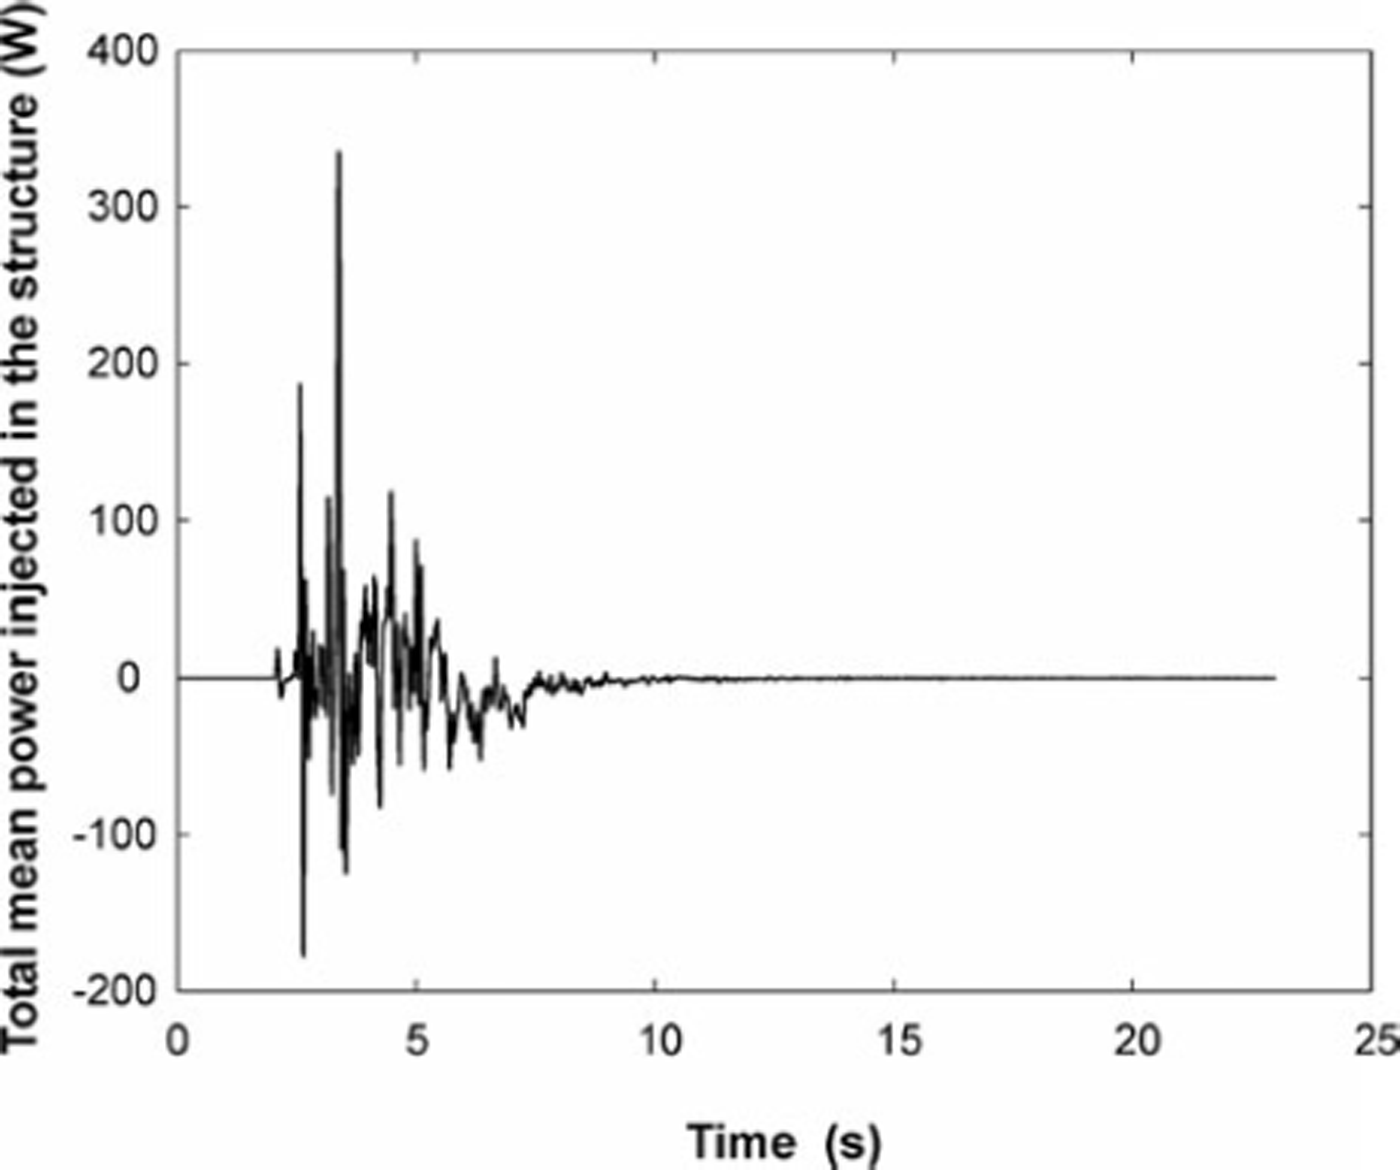
Fig. 8. Total power (J s−1) injected in the structure (1 m2) by the avalanche impact.
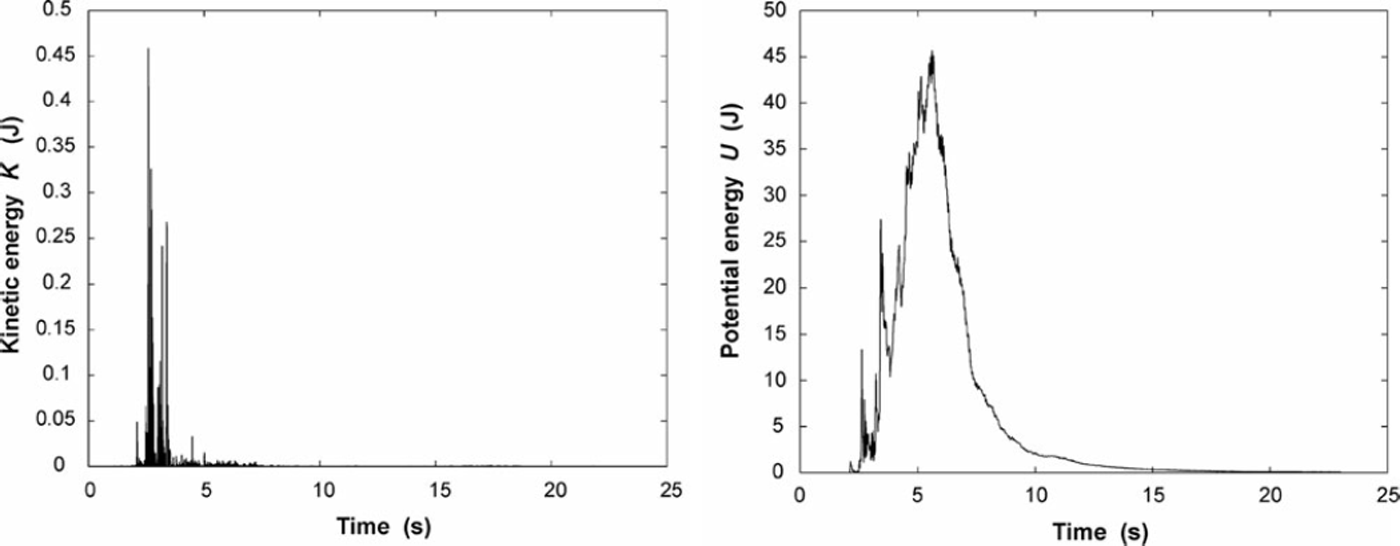
Fig. 9. (a) Kinetic energy K of the structure. As the loading by the avalanche is mainly static after 2–3 s, K decreases rapidly. (b) Elastic potential energy U injected in the structure by the avalanche. This is the main part of the energy (>98%) of the structure.
5. Discussion
Since the deformations of the structure remain in the elastic range, there is no plastic deformation and the total amount of energy injected in the structure is mainly the elastic potential energy. For a given force, this energy is limited by the stiffness of the beam. This explains the very small amount of energy that is injected in the structure. The beam is designed to remain elastic because it is designed for pressure measurements. Its function is therefore to measure the rate of change of the linear momentum of the avalanche which is mainly a change in the flow direction, and not a velocity (kinetic energy) reduction. With a maximum of 340 W of injected power when the loading rate is highest, and a value of 45J when the impact pressure reaches its maximum of 22 kPa, both the power and energy of the structure remain very low compared to the energy content of the avalanche.
It is, however, important to note that the maximum of power is injected in the structure in the head of the avalanche (the time period of highly increasing pressure; Fig. 3), before the pressure applied on the structure reaches its nominal value, while in the tail of the avalanche (t> 14 s; Fig. 3) this energy is relocated outside of the structure in the avalanche flow. This is related to the definition of the work rate which is a product of the pressure by a displacement rate. This result can also be explained from Equation (1) where we find the dissipative term W dis and the kinetic term K to be negligible, resulting in a work rate done on the structure, We, mainly equal to d/dt(U). With the assumption that the structure is impacted under quasi-static conditions, its deformation is proportional to the pressure (see equation 6 in Reference Baroudi and ThibertBaroudi and Thibert, 2009). Equation (7) states therefore that the potential energy is proportional to the square of the pressure. The work rate done on the structure is consequently proportional to the product of the pressure by the pressure rate. This product is indeed maximum before t= 5 s, as can be seen in Figure 3.
Regarding the amount of energy injected in the structure, admitting that the avalanche is described with a simple Voellmy-Salm model (Reference SalmSalm, 1993) or sliding-block model (Reference Bartelt, Buser and PlatzerBartelt and others, 2006), the kinetic power of the avalanche, $, through a cross-sectional area S can be estimated from the velocity of the flow, v, and expressed as (Reference Landau and LifshitzLandau and Lifshitz, 1994):
where p is the density of the avalanche. Using S= 1 m2, a mean density of 230 kg m−3 (Reference Baroudi and ThibertBaroudi and Thibert, 2009) and the velocity values of Figure 3 as a mean value over cross-section S, the kinetic power is plotted in Figure 10. With a mean velocity of 6ms−1 over the time range, the flux of kinetic energy is typically 25 kJ m−2 s−1.
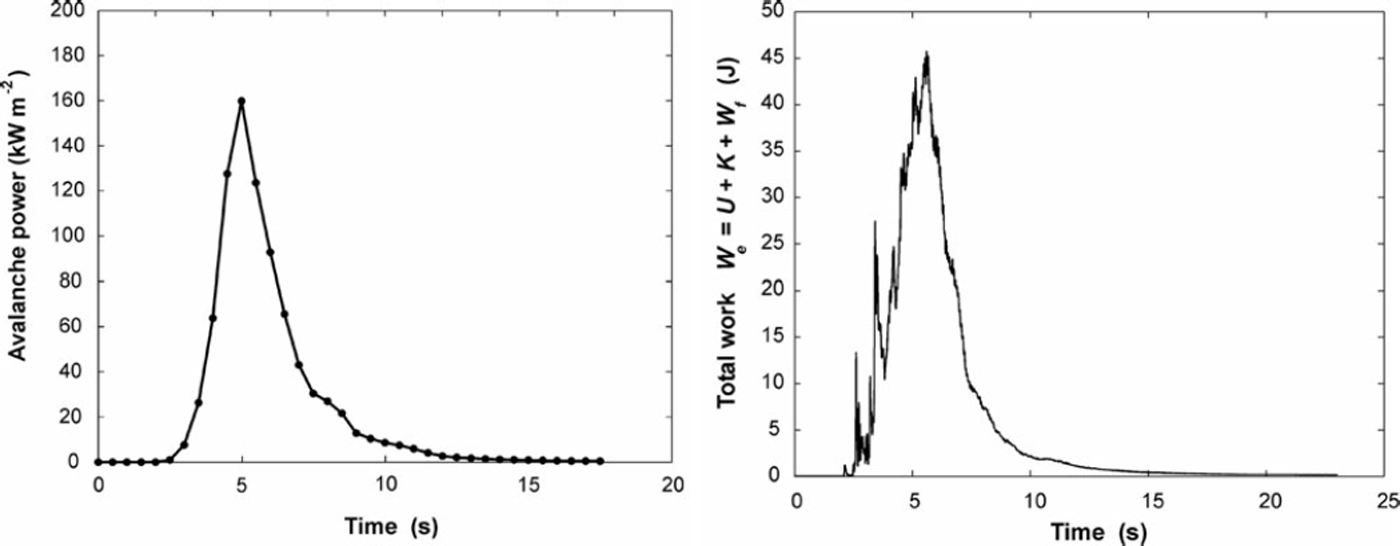
Fig. 10. (a) Kinetic power of the avalanche through a 1 m2 surface (i.e. kinetic energy flux per unit time, Jm−2 s−1). (b) Total work done on the structure by the avalanche forces.
The highest power injected in the structure (340 W at t=7.5s) is therefore only 0.4% of the kinetic power available in the avalanche at the same time. This makes it unlikely that the structure will dissipate a substantial amount of the avalanche’s energy by internal elastic deformations. We may therefore ask, in the event of plastic deformation, what the injected power could be.
To answer this question, we calculate the ratio of plastic dissipative work to elastic work (at the elastic limit). We first assume that the beam undergoes plastic deformation (plastic damage) at the clamped section, leading to formation of a plastic hinge. We assume that the residual tip displacement of the beam is 3.5 cm (i.e. 1 % of the beam length) after one cycle of loading-unloading. Then the dissipated irreversible plastic work is given by:
where the plastic moment at the hinge is Mpl = σywp. For the HEB beam made of structural steel with a yield stress of 250 MPa, a rotation discontinuity of 0 p = 1/100, and a plastic bending resistance of wρ = 0.001 m3 for HEB240 (Reference Timoshenko and YoungTimo-shenko and Young, 1956), the result is Wρl ≈ 2.6 kJ. Assuming a linear deformation profile along the beam, the elastic strain energy at the elasticity limit (ϵY= 12 × 10−4 m m−1) would be 1.2 kJ. The plastic energy dissipated in the structure is therefore here just around twice the elastic potential energy that can be stored reversibly. This is related to the limited volume of material subjected to plastic deformation (of the order of 10−3 m3).
However, the overall dissipated power remains unknown in this calculation because the time history of deformation is not defined. Time-measured plastic deformation data are required. Such data are available for aluminium devices impacted by avalanches on our experimental site. These devices are set up on path No. 2 and have been presented in a previous study (Reference Berthet-Rambaud, Limam, Baroudi, Thibert and TaillandierBerthet-Rambaud and others, 2008). These small aluminium targets are made of plate structures (length L = 2 5 cm and width b = 5 cm) fixed at one end to a tripod and free at the other. They are embedded by a rigid cubic piece located between the support and the aluminium plate, and placed horizontally and normal to the avalanche direction. The plate is sufficiently thin (h = 11 mm) to allow a cantilever-beam behaviour (h/L≈0.04; Fig. 11).
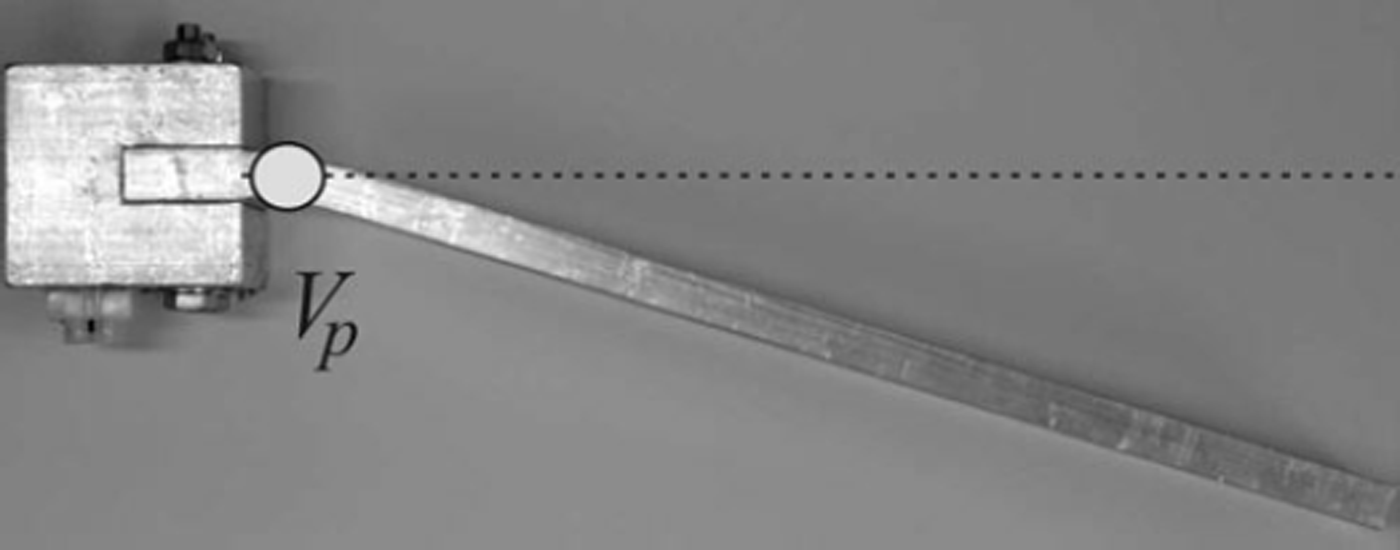
Fig. 11. Aluminium plate device used to calculate the plastic deformation power. The plate is shown after it has been damaged by the avalanche impact. V p is the plastic hinge. The dashed line is the initial position of the plate.
A strain gauge is located on the downhill face of the aluminium plate at the location of the plastic hinge. It is therefore possible to estimate deformation as a function of time, and derive elastic, plastic internal work rate using the method exposed in section 3. As an example of the calculation, consider the deformations recorded during an avalanche released on 15 February 2007 (Fig. 12). Plastic deformation is limited to very short time periods: it occurs on the first impact (around 57.8 s) and later at 58.7 s.
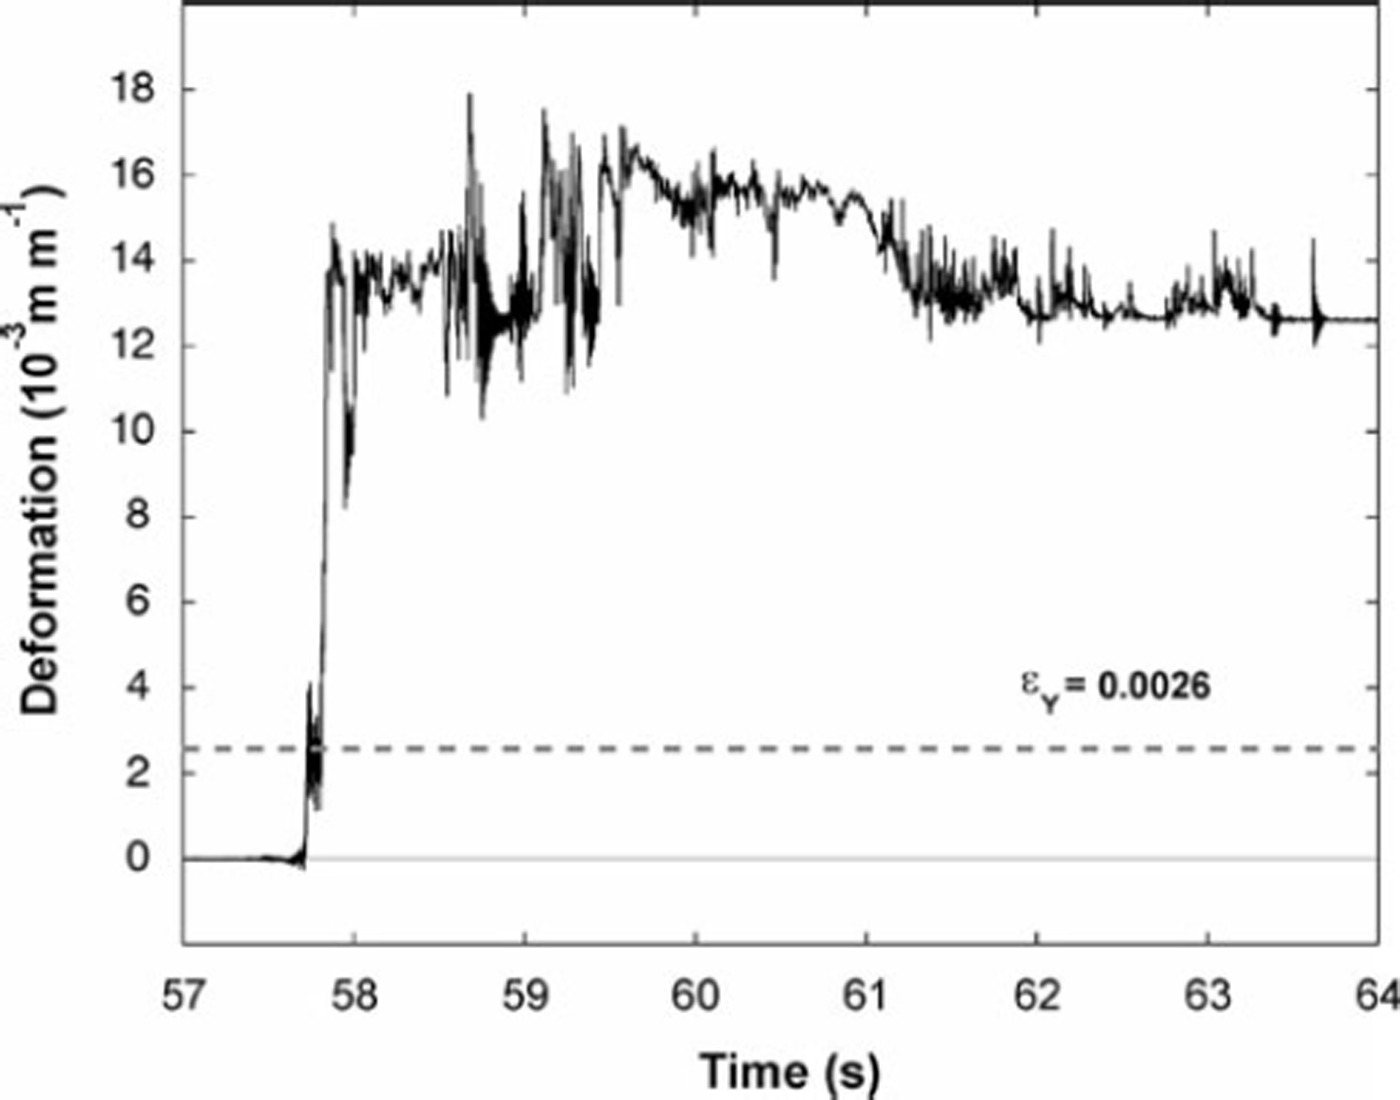
Fig. 12. Deformations recorded on the aluminium plate device during the avalanche released on 15 February 2007 (Fig. 12) at the Lauraret avalanche test site (path No. 2). The yield strain is indicated by a dashed line (2.6 × 10⁻³mm−1). Plastic deformation occurs between 57.6 and 58.7 s.
The plastic power, ![]() , is calculated from the plastic strain rate defined by the plastic deformation increment per unit time
, is calculated from the plastic strain rate defined by the plastic deformation increment per unit time ![]() , and integrated over the volume of the plastic hinge, Vp, which is about hb2 = 6.6 × 10⁻⁶ m3:
, and integrated over the volume of the plastic hinge, Vp, which is about hb2 = 6.6 × 10⁻⁶ m3:

To be compared with the kinetic energy flux of the avalanche, this power has to be normalized with respect to a m2 area. The result is shown in Figure 13. The power dissipated by the structure reaches values of about 0.5, 1 and 2.2 kWm−2 during the three main steps of plastic deformation. Regarding the avalanche characteristics (dense dry; ρ=120kgm−3; v=20ms−1 on impact), the kinetic power of the avalanche is around 500 kWm−2. This example illustrates that dissipated energy remains limited to <1% of the kinetic energy of the flow on impact.
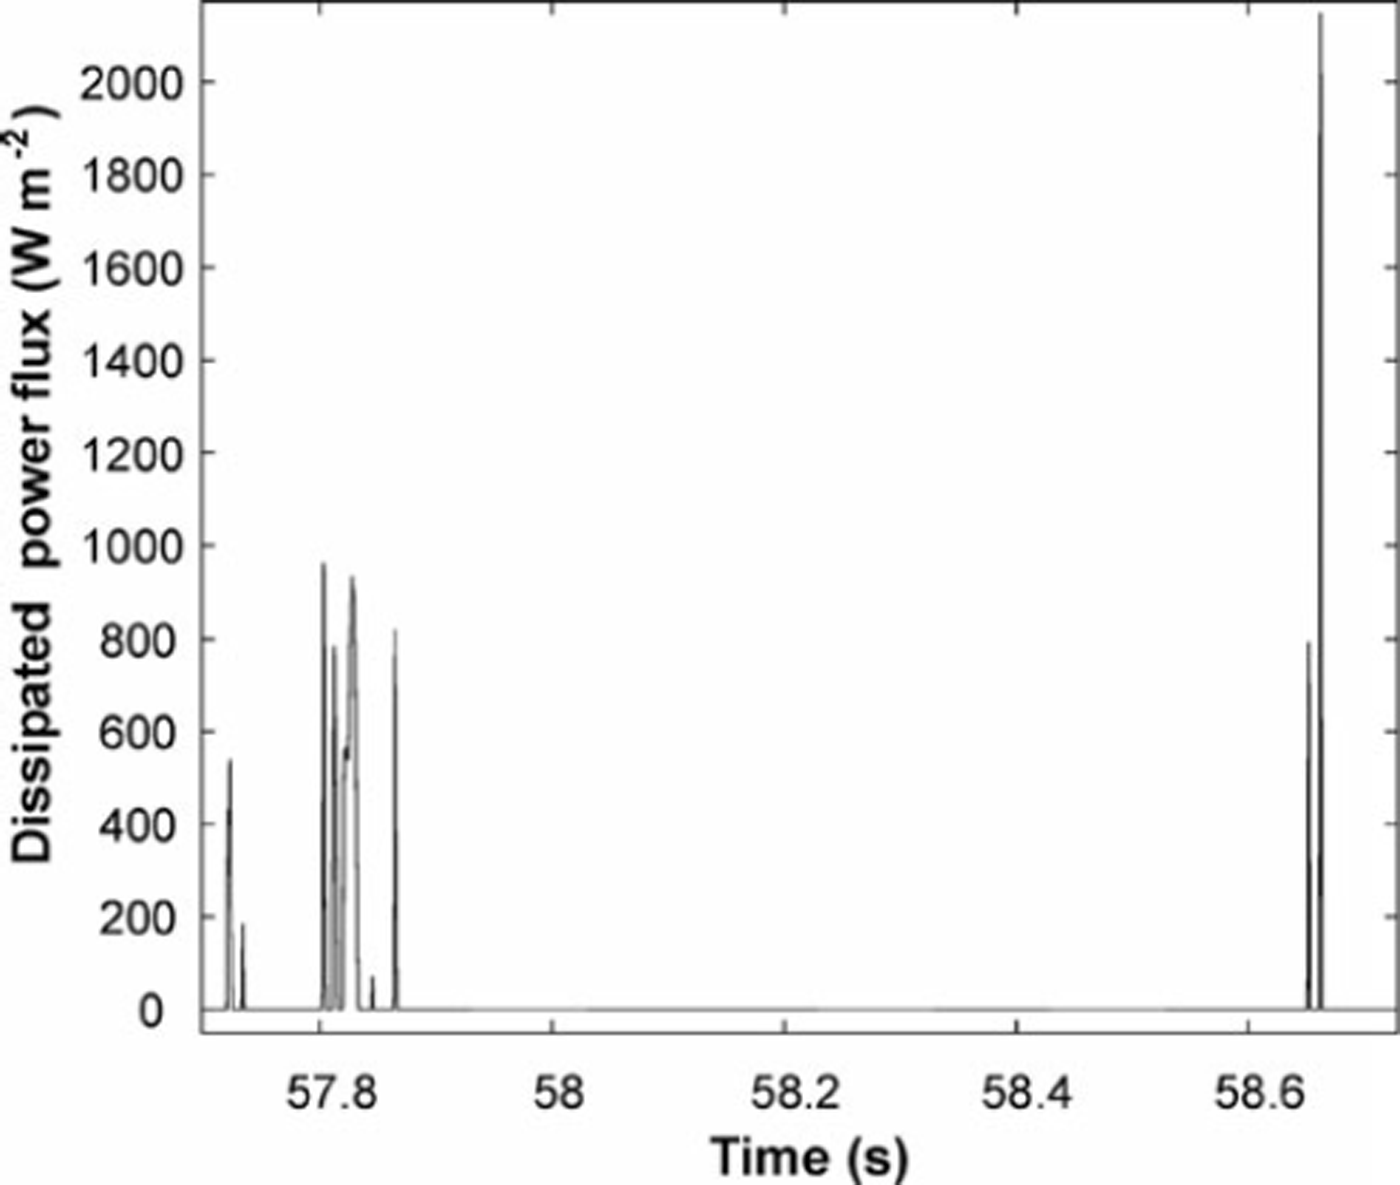
Fig. 13. Total power (J s−1) dissipated by the aluminium device (m−2) due to avalanche impact.
Additional plastic deformation in the structure does not therefore significantly enhance the energy dissipated by the cantilever beam with respect to the energy content of the flow. This is explained by the limited plastic hinge volume, V p, in the cantilever-beam bending mode (volume integration in Equation (15)), which is <10−5 m3.
6. Conclusion
The purpose of this study was to calculate the energy and power balance between an avalanche and an impacted cantilever-beam structure. During an avalanche impact, mechanical work (energy) is injected in the structures via the interface. The energy injected in (work done on) the structure by the avalanche is of two types: reversible and irreversible. Strain energy (elastic potential energy) is reversible. Internal friction work (work of viscous forces), plastic work and any work leading to damage (material fracture) are examples of dissipative or irreversible work. This irreversible work is converted into heat.
The elastic potential energy and the kinetic energy of the structure are calculated from the experimental deformation and a mechanical model of the structure. The model is first validated by in situ hammer tests. The energy dissipated by internal material damping is then calculated. The main energy component is the elastic potential term. The kinetic and viscous terms are negligible because of the very low displacement rate of the structure during the impact.
Finally, the mechanical work done on structure (at the boundary) by the avalanche forces is deduced from the energy balance. The work and power injected in the structure are very small compared to the kinetic flux of the avalanche. This is explained by the very high stiffness of the structure which has been designed to remain elastic. Nevertheless, an important result is that the maximum of power of the avalanche is injected in the structure before the pressure reaches its maximum value. This occurs during the very beginning of the impact when the head of the avalanche impacts the structure. In a quasi-static approach, this maximum is given by the maximum of the product of the pressure by the pressure rate. This result could be important for the design of defence structures where the single pressure variable is mostly considered.
Calculations and complementary experiments show that additional plastic deformation in the structure does not significantly enhance the energy dissipated by the cantilever beam with respect to the energy content of the flow. This is explained by the limited plastic hinge volume in cantilever-beam bending mode. As the total mechanical power done on the structure is much smaller than the kinetic energy flux of the avalanche, it is unlikely that the structure will dissipate much of the avalanche’s energy by internal deformation (viscous and plastic). Rather, energy dissipation due to the avalanche–structure interaction is expected to occur in the flow, and therefore the energy approach developed in this paper should be considered mainly as a tool to investigate avalanche processes.
An important result that we identified in our analysis is the power imparted by the avalanche head to a structure. If a structure (or tree) can withstand this impact, then the flow will be diverted, increasing the internal energy dissipation and slowing the avalanche. This effect must be quantified to assess the defensive capacity of breaking mounds and mountain forests. A precondition to utilize this effect is that the avalanche head does not destroy the structure.
Dissipation of energy in the structure could nevertheless be a possible way to design protective dissipative structures for small avalanches in order to limit the dynamic loads. Specific and exchangeable parts of a structure can be designed to dissipate energy and ensure its viability. For example, a very high volume of plastically deformable material can be concentrated in steel fuse-type elements which are able to dissipate thousands of kWm−3. This technique could be applied to more complex structures interacting with an avalanche.
To design such dissipative structures in future, numerical methods should be used (e.g. finite-element, finite-difference, finite-volume and discrete-element methods) to solve motion equations in the structure together with relevant constitutive material models.
Acknowledgements
This work was supported by the ANR-OPALE and Alcotra Interreg III DYNAVAL and Alcoltra Interreg III DYNAVAL (2007–2013 No. 48) projects. We thank all those who contributed to measurements during the avalanche release work. We also thank P. Bartelt and an anonymous reviewer for helpful comments and suggestions.

