Introduction
Net accumulation history reconstructed from ice cores can be used to detect the response of glaciers to climate change, and to predict possible variations of glacier mass balance and water resources. This kind of work is particularly important on the Tibetan Plateau, where direct observations are relatively scarce. In the past two decades, a series of ice cores have been recovered across the Tibetan Plateau: Dunde ice core from the Qilian mountain in northwest Tibet (Reference Tandong, Zichu, Qinzhao and GYao and others, 1991,Reference Tandong and Thompson1992), Guliya ice core from the Kunlun mountain in west Tibet (Reference ThompsonThompson and others, 1997; Reference Tandong, Thompson, Yafeng, Dahe and KeqinYao and others, 1997; Reference YaoYao,1999) and Dasuopu (DSP) ice cores from the Himalaya in southTibet (Reference Thompson, Yao and Mosley-ThompsonThompson and others, 2000). Records in all these ice cores have shown variability of climate over the Tibetan Plateau.
Because of the great impact of the Indian monsoon rainfall on the south Asia economy, the monsoon has been studied extensively, but over the past 100 years empirical seasonal forecasts of the monsoon have been made with only moderate success. Even recent modeling efforts have not been successful (Reference WebsterWebster and others, 1998). A long time series of reliable data for large contiguous spatial domains is not available except for India and north Australia, which limits our ability to determine rainfall patterns in the monsoon regions. Previously published results suggest that variation of the Indian monsoon is closely linked to the greater heat capacity of the ocean relative to the surrounding land masses (Reference Fein and StephensFein and Stephens, 1987). Some studies show that the Himalaya and the Tibetan Plateau play an important role in the evolution of the boreal summer monsoon (Reference Yanai, Li and SongYanai and others, 1992). However, while much work has been done on monsoon and annual precipitation in India, there exists only limited knowledge concerning precipitation variations in the Himalaya.
Recently, Reference Shrestha, Wake, Dibb and MayewskiShrestha and others (2000) studied precipitation records in Nepal and found the all-Nepal weighted average precipitation record agrees well with the precipitation records from northern India, while it does not compare well with the all-India weighted average precipitation record. This suggests that the precipitation climatology of the Himalaya region behaves differently from the southern part of the subcontinent, and the all-India average precipitation record does not provide a valid representation of the entire subcontinent (Reference Shrestha, Wake, Dibb and MayewskiShrestha and others, 2000). Therefore, research on precipitation in different areas is critical for increased understanding of monsoon variability.
A study of ion concentrations in the DSP ice core revealed that the Xixabangma area is sensitive to fluctuations in the intensity of the south Asian monsoon (Reference Thompson, Yao and Mosley-ThompsonThompson and others, 2000). In this paper, the annual accumulation (An) from the DSP ice core, which is a more direct measurement of monsoon variability than are ion concentrations, is recovered. Based on this record, a monsoon precipitation series is developed to study interannual and inter-decadal variability over the last 200 years in the central Himalaya. This record is compared with precipitation records from India and Nepal. Additionally, singular spectrum analysis (SSA) is applied to the DSP An record to examine interannual variability. Finally, the possible relationships among DSP net accumulation, temperature and solar activity are considered.
Data and Methods
DSP glacier (28˚23’N, 85˚43’ E), with an altitude of >7000m a.s.l. and a total area of 21.67 km2, is located on the northern slope of the Himalaya. A combination of glaciological and meteorological factors−glacier thickness >200m, flat topography, high accumulation and low mean annual temperature−makes this glacier well suited to recovery of long-term, high temporal-resolution ice-core records.
Generally, the climate of south Asia is dominated by a monsoon circulation system. the summer monsoon dominates the climate from May to September, and westerly circulation dominates from November to March. the influence of these two circulation systems is not evenly distributed, and the bulk of the annual precipitation received in the Himalaya arrives during the summer monsoon season. At the DSP col, the average annual An is ~1000 mmw.e., as determined by snow-pit and shallow-core studies and by the measurement of a 12-stake accumulation network established during a reconnaissance survey in July 1996 (Reference ThompsonThompson and others, 2000).
Meteorological observations were made from 15 August to 3 October 1997 at the summit of DSP glacier. These data, although incomplete, show that the daily maximum temperature was <0˚C, and mean temperatures at noon for September were lower than –4˚C, which indicates that there is little energy available for evaporation and melting. No surface snow melting was observed. Under current meteorological conditions the thickness of the layer accumulating at the summit each year should correctly reflect the original precipitation. Therefore the An record reconstructed from DSP ice cores is expected to provide a well-dated and regionally representative precipitation history with excellent temporal resolution.
In 1997, three ice cores were recovered from DSP glacier using an electromechanical drill in dry holes. the first core (C1) was 159.9 m long and was drilled at 7000m a.s.l. down the flowline from the top of the col, and two cores (C2 and C3), 149.2 and 167.7 m long, respectively, were drilled to bedrock 100 m apart on the col at 7200ma.s.l. Visible stratigraphy showed no hiatus features in any of the cores.
C2 was brought (in a frozen state) to the Lanzhou Institute of Glaciology and Geocryology (LIGG), C3 was brought (also frozen) to the Byrd Polar Research Center, Columbus, OH, U.S.A., and C1 was split between the two institutes. All cores were analyzed over their entire lengths for oxygen isotopic ratio (δ18O), chemical composition and dust concentration. Most of the results presented here are from C2, which was cut into 4110 samples for δ18O, Cl–, SO4 2–, NO3, Na+, K+, Mg2+ and Ca2+ analyses. Borehole temperatures were –14˚C at 10m depth and –13˚C at the ice–bedrock contact, demonstrating that DSP glacier is frozen to its bed.
The high annual accumulation allows preservation of distinct seasonal cycles in δ18O and ions, which make it possible to reconstruct an annual record for the upper part of the cores. We established the time–depth relation for the cores using the well-preserved seasonal fluctuations of δ18O and ions, which all show a maximum in the winter dry season. We dated the core by counting annual peaks of δ18O with additional reference ion peaks. A clear annual record is present in C2 to a depth of 93 m and an age of AD1800. the annual-layer counting was verified at 42.2 and 35.5 mby the location of a 1963 and 1953 beta radioactivity horizon produced by the 1962 and 1952 atmospheric thermonuclear tests. Due to high accumulation, low temperature and strong seasonality, these time estimates carry little uncertainty.
Although the annual-layer thickness can easily be measured throughout DSP ice cores by δ18O and ions, the layers do not directly represent the thickness originally deposited at the glacier surface, because these layers are thinned and stretched as new snow accumulates and the ice flows outward from the center. from mass continuity, the vertical velocity is proportional to the accumulation rate, and vertical velocity can be approximated from the mean change in layer thickness per year (Reference BolzanBolzan, 1985; Reference ReehReeh, 1988). In this way, we can recover the annual accumulation from DSP ice core. Moreover, peaks of δ18O and ions appear in the spring dry season, so accumulation recovered in the core represents precipitation from spring to spring. This is the most relevant way to define a year because most of the annual precipitation on DSP falls during the summer monsoon season (June–August). Our accumulation record is therefore essentially a monsoon season record.
Comparison Between DSP An and Precipitation Variations Over Nepal and India
A comparison between DSP An fluctuation and precipitation fluctuation over Nepal shows good agreement (Fig. 1) (R = 0.3; sig. =95%). the DSP An record represents conditions at a single location, and a dating error of just 1year may affect the statistical correlation; therefore, a 3 year running mean was applied to both records, giving R = 0.47 (sig. =99%).
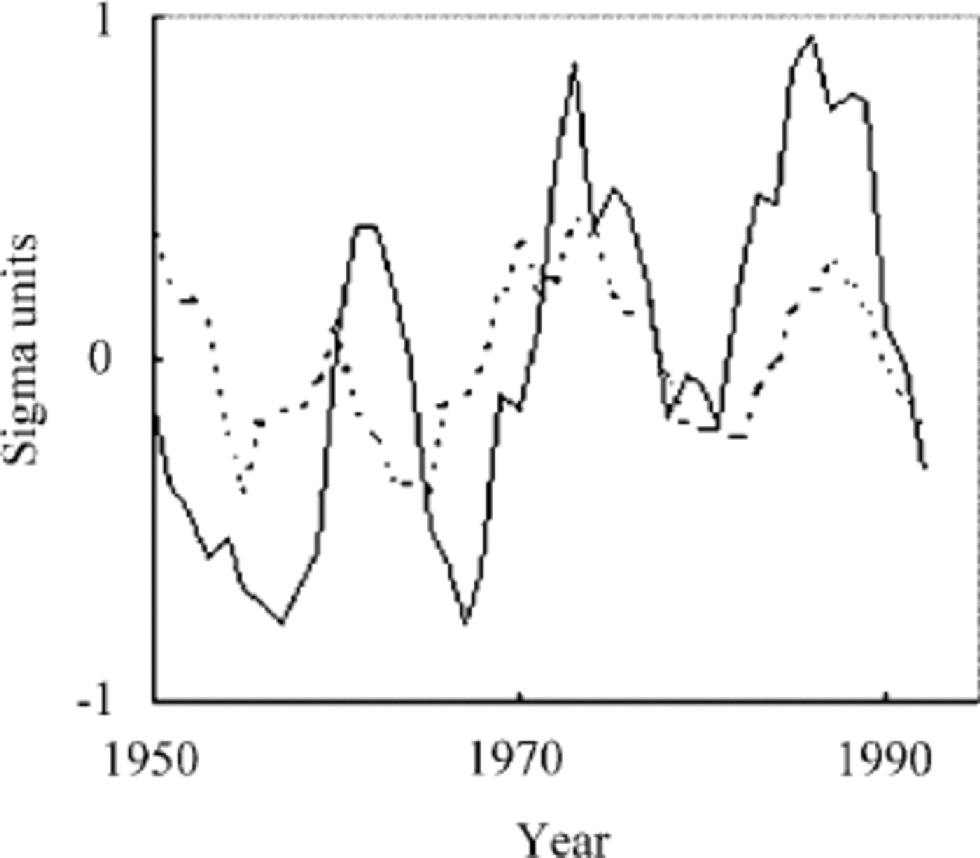
Fig. 1 Three-year running mean of DSP An (solid line) and Nepal precipitation (dashed line) anomalies, 1950–95.
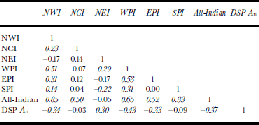
We applied empirical orthogonal function (EOF) analysis to DSP An and the summer (June–September) precipitation for all-India and for separate Indian regions (Reference Sontakke and SinghSontakke and Singh, 1996) to identify the pattern of spatial correlations. India was divided into six zones: northwest India (NWI), north central India (NCI), northeast India (NEI), west peninsular India (WPI), east peninsular India (EPI) and south peninsular India (SPI), following Reference Sontakke and SinghSontakke and Singh (1996). the first three eigenvalues computed with the AD 1850–1995 data explain about 70% (40.27%, 17.71% and 12.92%, respectively) of the total system variance. Their eigenvectors are shown in Table 1. In the EOF1 associations, DSP An and NEI precipitation are positively correlated, and anticorrelated with all-Indian and NWI, NCI, WPI, EPI and SPI rainfall, which reflects the regional distribution of monsoon rainfall. the correlation coefficient between DSP accumulation and all-Indian and regional monsoon rainfall record for the period 1850– 1995 is shown in Table 2. This coincides with the result of EOF1.
Table 1. EOF results: eigenvectors and per cent explained variance

Table 2. The relation coefficients among DSP An, all-India and regional Indian precipitation, 1850–1995 (italicized numbers suggest the relation coefficient is significant at the 95% level)
In a recent study, Reference Krishnamurthy and ShuklaKrishnamurthy and Shukla (2000) identified large climatic variations in Indian monsoon precipitation by examining the daily-rainfall dataset prepared from observations at 3700 stations. They concluded that the intra-seasonal variability of rainfall during a monsoon season is characterized by the occurrence of active and break phases. During the active phase, the rainfall is above normal over central India and below normal over northern India (foothills of the Himalaya). This pattern is reversed during the break phase. the cumulative curves of the anomalies of the DSP An and NEI show a striking positive relationship, while DSP An vs WPI and all-Indian monsoon rainfall anomalies show a striking inverse relationship during AD 1850–1995 (Fig. 2). Based on these associations, we identified distinct climatic regimes in monsoon precipitation, with a significant change around 1930. the period 1850–1930 is characterized by more wet years over the Himalaya and NEI and by more dry years over WPI and EPI, while the period 1930–95 is characterized by more dry years over the Himalaya and NEI and by more wet years over WPI and EPI. Thus, precipitation over the high mountains of the Himalaya as well as over the foothills has varied inversely with central India monsoon rainfall on a multi-decadal time-scale.
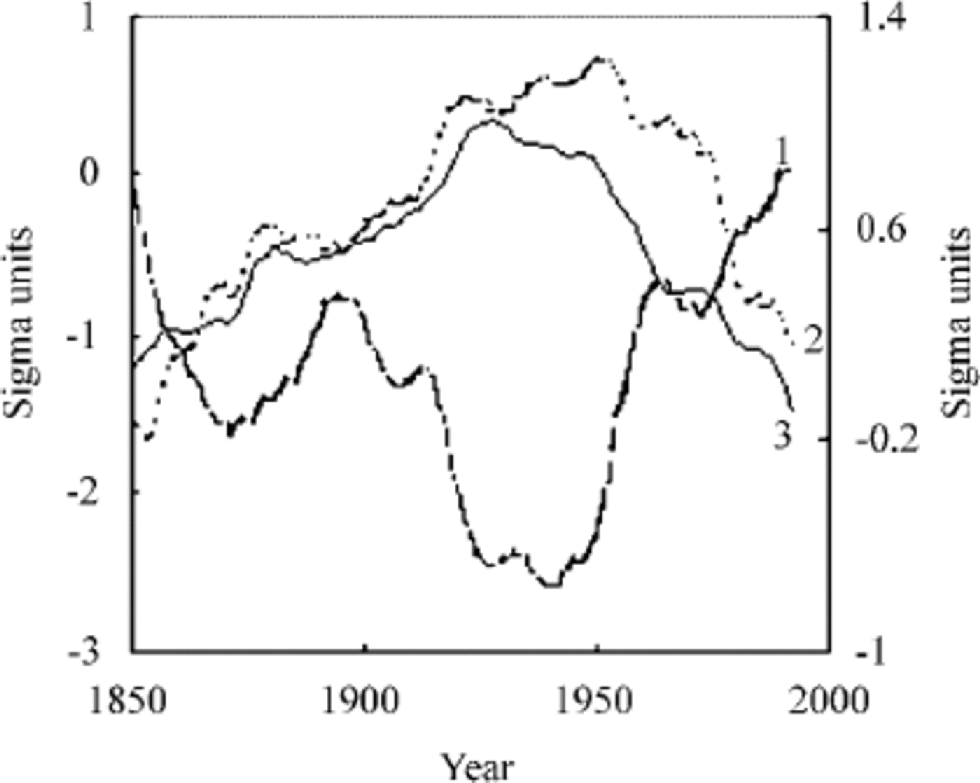
Fig. 2 Cumulative curves of DSP An (line 2), NEI (line 3) and WPI (line 1) precipitation, 1850–1995.
Variability of DSP An Over Past 200 Years
The reconstructed standardized yearly accumulation from the DSP ice core is shown in Figure 3d. It demonstrates significant interannual and inter-decadal variability, but no obvious trend in the past 200 years is detected.
For identifying interannual and inter-decadal variability in DSP An, we performed SSA (Reference Vautard, Yiou and GhilVautard and others, 1992) on the record. Mathematically, SSA is based on eigenvalue– eigenvector decomposition of a time-series lag–covariance matrix. We concentrate here on periods of 5 years and longer. Use of a window=30 lag permits the study of periods of 5– 30 years (Reference Vautard, Yiou and GhilVautard and others, 1992). the results show that EOF1 is a data-adaptive running mean. Eigenvalues 2–12 form five pairs. the first pair of EOFs (EOF2 and EOF3) represents a 9.2 year oscillation, which explains 9% of the total variance; the second pair of EOFs (EOF4 and EOF5) represents a 6.7 year oscillation, which explains 7% of the total variance; the third pair of EOFs (EOF6 and EOF7) represents a 25.6 year oscillation, which explains 6% of the total variance; the fourth pair of EOFs (EOF8 and EOF9) represents a 5.3 year oscillation, which explains 4.6% of the total variance; and the fifth pair of EOFs (EOF11 and EOF12) represents an 11.3 year oscillation, which explains 3% of the total variance.

Fig. 3 Reconstructed components from SSA of annual DSP An anomalies, using a 30 year window: (a) reconstructed inter-decadal oscillations (standard deviations); (b) reconstructed interannual oscillations (standard deviations); (c) reconstructed trend (standard deviations); (d) DSP An time series (mm); (e) solar irradiance (Wm–1).
The trend, based on the use of EOF1, explains roughly 9% of the total variance, and clearly exhibits the trend of DSP An in the past 200 years. Figure 3c shows the reconstructed trend, together with the raw data. from 1800 to 1820, DSP An ranged between 0.5 and 1.2mw.e. and was followed by a significant increase of 1.0–1.7 m which persisted until 1880. Since 1880, An has decreased gradually to its present levels.
Reconstructed inter-decadal oscillations (light solid line in Fig. 4a) are dominated by EOFs 6, 7, 11 and 12, together explaining 9% of the total variance. the large variance explained by this inter-decadal oscillation component is clearly shown in Figure 3a. Interannual oscillations are based on EOFs 2, 3, 4, 5, 8 and 9, together explaining 20.6% of the total variance. the amplitudes of both the inter-decadal and interannual modes varied substantially over the last 200 years, and were strongest during 1840–80.

Fig. 4 Comparison between DSP An (dashed line) and thermal contrast between Tibetan Plateau and Indian Ocean (solid line).
Connection to Tibet Temperature and Indian Ocean Surface Temperature
We have shown that the DSP An record is connected with Indian monsoon rainfall. Comparison between Tibetan Plateau temperature (TPT; data from Liu, 2000) and Indian Ocean temperature (IOT, which is the mean sea-surface temperature (SST) in the region 5˚ S–15˚N, 80– 100˚ E) shows that there are distinct increasing trends in both TPT and IOT time series during 1954–95, while there is no distinct trend in DSP An since 1954. Table 3 gives the correlation coefficients among them. Clearly DSP An agrees well with TPT in the period 1954–95 ![]() while it does not compare well with the IOT record. However, a strong anti-relationship between DSP An and IOT is evident on a longer time-scale during the period AD 1878–1995
while it does not compare well with the IOT record. However, a strong anti-relationship between DSP An and IOT is evident on a longer time-scale during the period AD 1878–1995 ![]() This result can be further tested by the cumulative anomalies of DSP An and IOT, which show strong evidence of association between increased An and decreased IOT during 1884–1930; from 1930 onward, association between decreased An and increased IOT is evident.
This result can be further tested by the cumulative anomalies of DSP An and IOT, which show strong evidence of association between increased An and decreased IOT during 1884–1930; from 1930 onward, association between decreased An and increased IOT is evident.
Since the monsoon is essentially a thermally driven large-scale circulation, it is logical to expect that variability of DSP An should correspond with the thermal contrast between the plateau and the Indian Ocean (Fig. 4). An index of this
Table 3. The relation coefficients among DSP An, Tibetan Plateau temperature (TPT), Indian Ocean temperature (IOT) and thermal contrast between Tibetan Plateau and Indian Ocean (TC)

thermal contrast (TC) is defined as the difference between TPT and IOT anomalies. Table 3 also gives the correlation coefficients between TPT, IOTand TC. Figure 4 shows the relationship between DSP An and TC. the correlation coefficient between them is 0.42 (Table 3), which is significant at the 99 % level. It shows that the combined TC index that contains TPT and IOT correlates more strongly with DSP An (R =0.42, sig. =99%) than does either TPT (R =0.3, sig. = 95%) or IOT (0.02). This suggests that we may be able to predict monsoon rainfall variability as a function of modeled temperature variability.
Connection to Solar Activity
Many studies have shown that surface temperatures and solar activity both increased during the past 400 years, with close associations apparent in pre- and post-industrial epochs (Reference Lean, Beer and BradleyLean and others, 1995; Reference ReidReid, 1997). These results are supported by recent numerical modeling results (Reference HaighHaigh, 1996; Reference Balachandran, Rind, Lonergan and TBalachandran and others, 1999; Reference Shindell, Rind, Balachandran, Lean and LonerganShindell and others, 1999). This being the case, we can suggest a physical mechanism which satisfies the connection between DSP An and solar irradiance. the land and sea-surface temperature show similar behavior, but because the thermal capacity of the ocean is many times that of atmosphere over land, the SST record, as well as the air temperature over the ocean, shows a lag of several years relative to the land temperature (Reference Friis-Christensen and LassenFriis-Christensen and others, 1991). This may suggest that temperature over land, especially over the Tibetan Plateau, increases as solar irradiance strengthens, while the SSTor atmospheric temperature over the ocean lags for some years in response to changes in solar irradiance. the same result is found in Greenland, where δ18O lags Δ14C by about 40 years, probably because of the thermal inertia of the mixed layer of the oceans (Reference Stuiver, Braziunas and GrootesStuiver and others, 1997).
In Figure 4 we compare DSP An and solar irradiance. the comparison shows a weak negative correlation between the two records, with a correlation coefficient of –0.2 at the 95% confidence level. In the last century, DSP An decreased 415 mm, while solar irradiance increased about 2.2 Wm–2. the corresponding regression coefficient is about –190 20 mm(W m–2)–1, indicating that on average a 0.5Wm–2 change in solar irradiance at the top of the atmosphere is associated with an 85 mm change in DSP An.
Detected oscillations at periods close to 9–12 years and 25 years in DSP An are similar to those observed in the solar irradiance time series (Reference White, Lean, Cayan and DettingerWhite and others, 1997). to isolate decadal and inter-decadal signals in the DSP An and solar irradiance record, a band-pass filter was applied to both records (Fig. 5a). the oscillation in the 18–26 year band contributes 2% of the DSP An total variance and 1% of the solar irradiance variance. These fractions of variance for interdecadal signals are small because of the dominance of variance in the trend and the high frequencies (for the DSP An record, the high-frequency oscillation at 2–5 years contributes over 40% of the total variance). Cross-regression is conducted between these band-passed records of DSP An and solar irradiance, and the results show a maximum correlation of –0.76 at a 4 year lag, with a 99% confidence level (Fig. 5b). Decadal oscillations in both the DSP An and solar irradiance records show the same characteristics as interdecadal signals. Band-pass components at 9–13 years contribute 3.5% of the DSP An total variance and 5.4% of the solar irradiance variance. Cross-regression between these two band-passed records shows maximum correlation of –0.44 at a 3 year lag, with 95% confidence level.
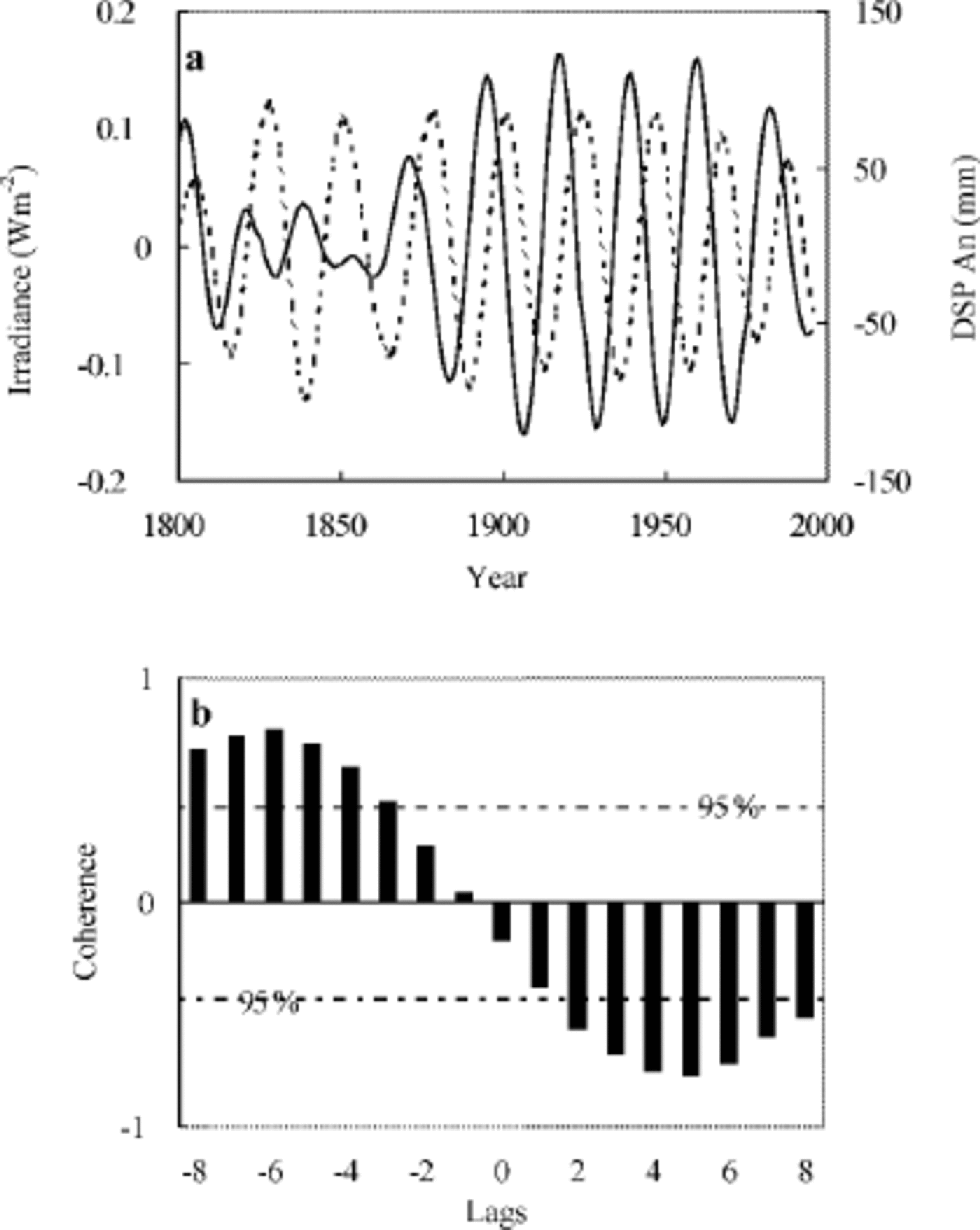
Fig. 5 (a) Reconstructed components of DSP accumulation (dotted line, righth and scale) and solar irradiance (solid line, lefthand scale) at 18–26 year periods. (b) Coherence between the reconstructed components in (a) as irradiance leads or lags.
To examine secular signals, a low-pass filter (460 years) is appliedto the two records. the extracted signals are illustrated in Figure 6. the low-pass components capture 9% of the DSP An variance and 83% of the solar irradiance variance. the DSP An low-pass time sequence displays fluctuations with peaks near 1855 and 1920, with a trough near 1895, while the solar irradiance low-pass time sequence displays fluctuations with peaks near 1852, and troughs near 1820 and 1900. It appears that there is a negative correlation between the DSP An and solar irradiance, with variation of solar irradiance leading by 20–40years. the apparent relationship between DSP An and solar activity since 1800, if real, can be satisfactorily explained by the difference in thermal capacities between the ocean and the land in response to changing solar activity. This possibility deserves further research.
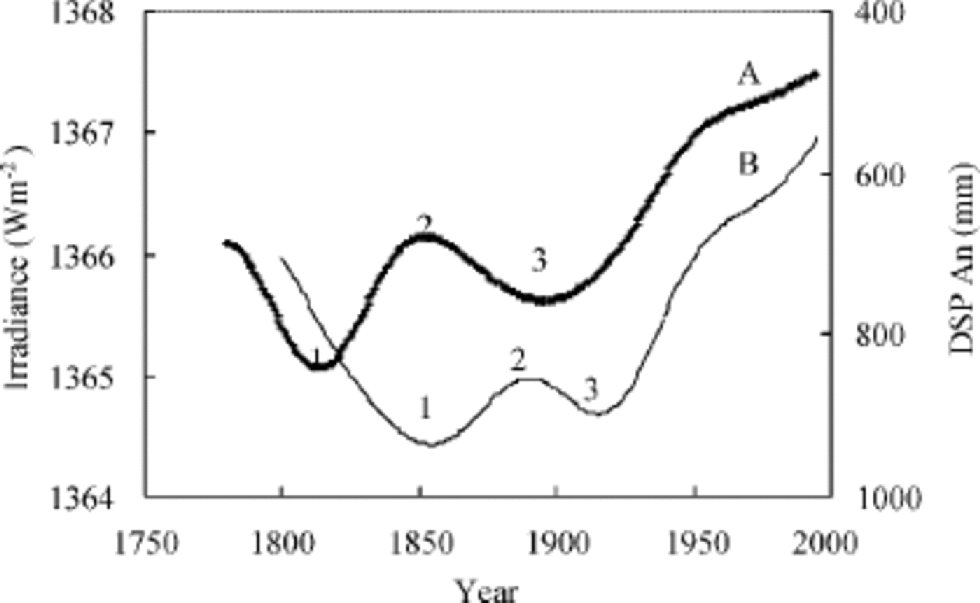
Fig. 6 Reconstructed components of DSP accumulation (lineB, righthand scale) and solar irradiance (line A, lefthand scale) at 460 year periods (note the scale for DSP An is inverted). the numbers along line A correspond to those along line B.
Summary and Conclusions
A 200 year accumulation history record from DSP glacier is successfully reconstructed. the record reflects the variability of monsoon rainfall over the high Himalaya. Correlation analysis indicates that the DSP An record is in good agreement with rainfall in Nepal and northeast India.There exists a high correlation between the Tibet–IndianOcean thermal contrast and DSP An. When the thermal contrast is strong, An tends to be large, even though both the Tibetan Plateau and the Indian Ocean become warmer and warmer in recent decades, and when it is weak, An tends to be small. This suggests that we can predict monsoon-rainfall variability by modeling temperature variability.
SSA was applied to decompose the DSP An record into trend and periodic oscillations. the first EOF component shows that a wet period persisted in the Himalaya during 1820–1930, but no obvious secular trend is detected. DSP An’s secular variationbears some resemblace to solar activity. Variation of accumulation lags solar irradiance, with average lags ranging from 20 to 40 years as periods increase from decadal to century scale.
Acknowledgements
This work was supported by the Ministry of Science and Technology of China (grant No. G1998040800), the Chinese Academy of Sciences (grant Nos.KZCX2-301,KZCX1-10-02), the Innovation Fund of the Chinese Academy of Sciences (grant No. 210506) and the National Natural Science Foundation of China (grant No. 40101006).


