Introduction and Background
Antarctic radio-echo sounding (RES) data, acquired at 60 MHz, show a number of strong reflections from with in the ice sheet. Several individual internal reflectors are discrete and continuous over large (>100km) distances. Such electromagnetic (e/m) reflections in ice occur at boundaries to dielectric contrast. The causes of the reflectors are thought to be (1) ice-density changes, to a depth of ~ 800 m, and (2) acidic layers of ice derived from atmospheric aerosol products (including volcanic-derived material). Consequently, below 800 m, internal radio-echo layering is caused mainly by acidic layering with in the ice sheet (Reference MillarMillar, 1981).
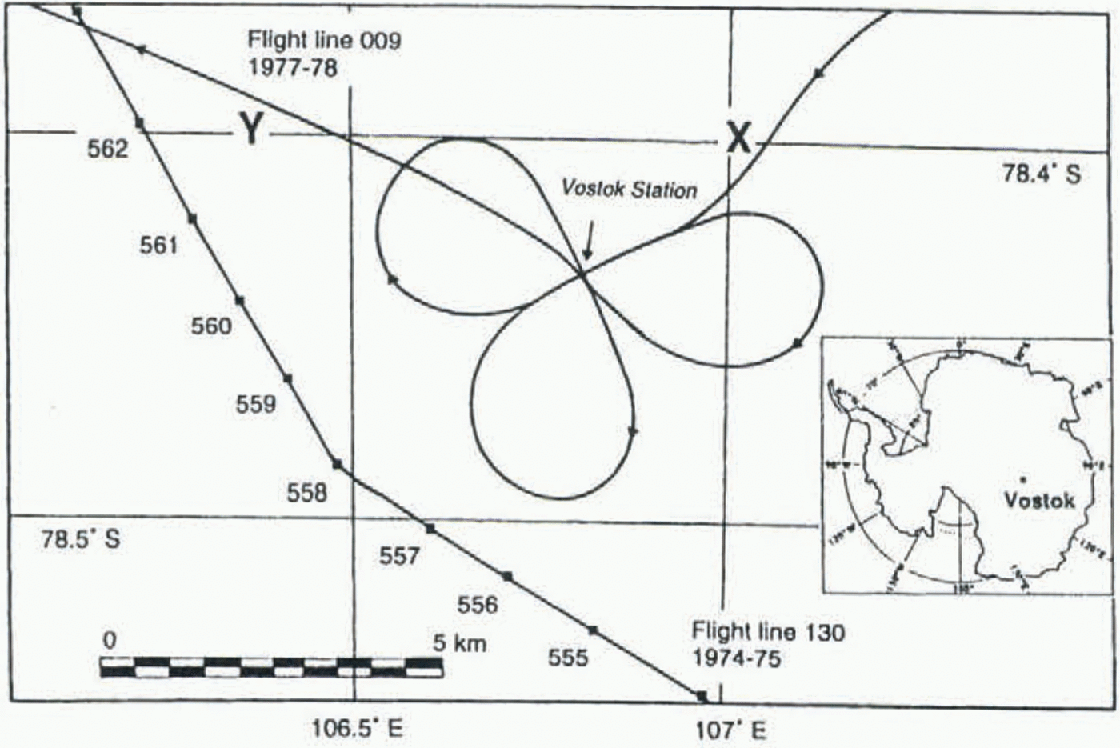
An extensive analogue radio-echo sounding dataset of the Antarctic ice sheet, collected by the SPRI (Scott Polar Research Institutc)-NSF(U.S. National Science Foundation)-TUD (Technical University of Denmark) consortium between 1968 and 1979, is held in archive at SPRI, University of Cambridge, U.K.. Approximately 50% of the ice sheet is covered by RES flight-tracks. A significant proportion of these data were collected over the eastern half of East Antarctica, including several flight-lines over the Vostok station area (Fig. 1).
During the 1980s, a deep (~2400 m) ice core was taken from a site in close proximity to Vostok station. An unprecedented palaeoclimate record resulted from interpretation of the Vostok ice core (e.g. Reference Barnola, Raynaud, Korotkevich and LoriusBarnola and others, 1987). However, the ice-core data have yet to be compared directly with RES data collected near the coring site. Previous correlations between ice-core data and RES information have proven valuable for the interpretation of ice-core data and the glaciology of central regions of ice sheets (e.g. Reference MooreMoore, 1988;

Fig. 1. The location of Vostok station and position of RES flight-lines 130 and 009. Note that flight 009 passes over Vostok station four times. The locations of Α-scopes recorded along line 130 are identified as CBD numbers (1 CBD=15 s flight time). Markers Xand Y refer to the beginning and end of the RES section in Figure 3. The location of Vostok station in Antarctica is given in the inset.

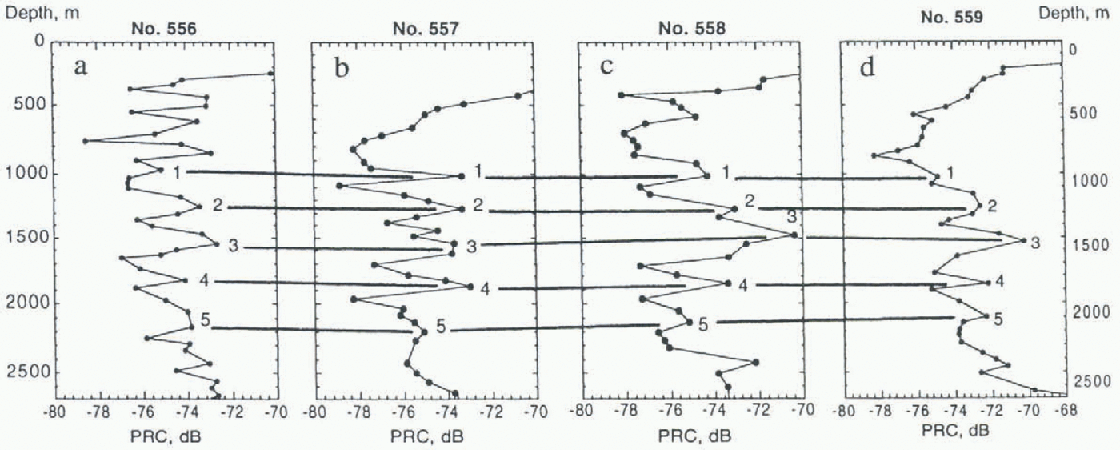
Fig. 2. PRC information derived from A-scope RES data. The locations of the PRCs are shown in Figure I. PRC nos. 556 (a), 557(b), 558(c) and 559(d). Note that five distinct PRC maxima are identified on each record, and correlated across the PRC dataset.
Reference Hvidberg, Dahl-Jensen and WaddingtonHvidberg and others, 1997). in this paper, wc analyze 60 MHz RES data from Vostok station in order to provide a complete record of the internal RES signal. These RES data are compared with ice-chemistry information gathered from previous analyses of the Vostok ice core. Our results now make it possible to compare theVostok ice core with other Antarctic ice cores using radio-echo sounding information.
The Nature and Analysis of Internal Radio-Echo Layers
RES data were recorded in two different formats during Antarctic RES operations. The first comprises graphs of two-way travel time vs signal strength from single e/m pulses, known as Α-scopes, recorded every 15 seconds (or each CBD unit). The second form represents a series of single e/m returns, collected in a time-dependent manner in which signal strength is identified by brightness rather than an axis variable. When plotted as two-way c/m wave travel-time vs real time, these time-dependent data yield pseudo-cross-sections of the ice sheet, or Z-scope data (Fig. 2). Internal radio-echo layering can be identified, and traced across the ice sheet, from analysis of both types of record. Quantitative information about the reflectivity of individual layers can be gained by processing A-scopc data to determine power reflection coefficients (PRCs).
PRCs are calculated from A-scope data thai are adjusted to account For geometric spreading, refraction and dielectric absorption of radio waxes in ice, and two-way antenna gain of the RES apparatus (Reference Robin, Evans and BaileyRobin, 1969; Reference ParenParen, 1981). The equation used is:

where R is the PRC, Ρ is the amplitude of the received radio wave relative to the transmitted power, G is the two-way antenna gain, D is the dielectric absorption, and the remaining term denotes geometric spreading and refraction of radio waves in ice (where λ0 is the radio wavelength in air, h is the ice depth of an internal layer, r0 is the terrain clearance of the aircraft and n is the refractive index of ice). Note that P, G, D, R and the geometric spreading term are in units of dB, i.e. they are logs of power ratios.
According to Millar (1982), PRCs from a single ice layer at depths of >800 m, where contrast in the real part of the dielectric constant can be ignored, can be related to the “loss tangent” difference between the layer and the surrounding ice (Δ tan δ), by the equation:

where λ is the radio wavelength in ice and l is the ice-layer thickness. Equation (2) holds if l is less than 0.25 λ The loss tangent is related to high-frequency conductivity, σ∞, by:
where ![]() is the permittivity of free space,
is the permittivity of free space, ![]() is the permittivity of the ice, and ƒ is the radar frequency. Thus, the difference in high-frequency conductivity (Δσ∞) bei ween a radio-echo layer and the surrounding ice can be calculated from R.
is the permittivity of the ice, and ƒ is the radar frequency. Thus, the difference in high-frequency conductivity (Δσ∞) bei ween a radio-echo layer and the surrounding ice can be calculated from R.
It should be noted thai the reflecting horizons responsible for radio-echo layers are probably noi single layers but rather groups of closely spaced layers of ice (Reference HarrisonHarrison, 1973; Millar, 1982). A second point to note is that PRCs are determined from a digitised version of A-scope maxima, and thus represent an upper envelope of power returns. Thus, each data point displayed in the PRC graph corresponds with an A-scope peak.
The Internal Radio-Echo Layer Signal at Vostok
A-scope and Z-scope RES data are available for the Vostok station region (Reference Kapitsa, Ridley, Robin, Siegert and ZotikovKapitsa and others, 1996). A-scope data were acquired during a 1974 flight near (<5 km from) Vostok station, whilst Z-scope data were collected during a 1977 pass directly over the station. Flight 130/1974 passed from the south to the west of Vostok station, whilst flight 009/1977 passed four times directly over the station during a traverse from east to west (Fig. 1). Two issues arise from our use oft he data collected during these particular (lights. The first is that we can compare the results from two independent datasets. Consequently, correlation between Z-scope and A-scope data will indicate the robustness of our analysis and the applicability of our work to other regions of Antarctica and other RES data. The second is that Z-scope data from flight 009/1977 were recorded directly over Vostok station along four different flight-line orientations (Fig. 1). Variation in the Z-scope data from these four passes indicates the relation between radio-echo reflections and orientation that is inherent in Antarctic RES data.

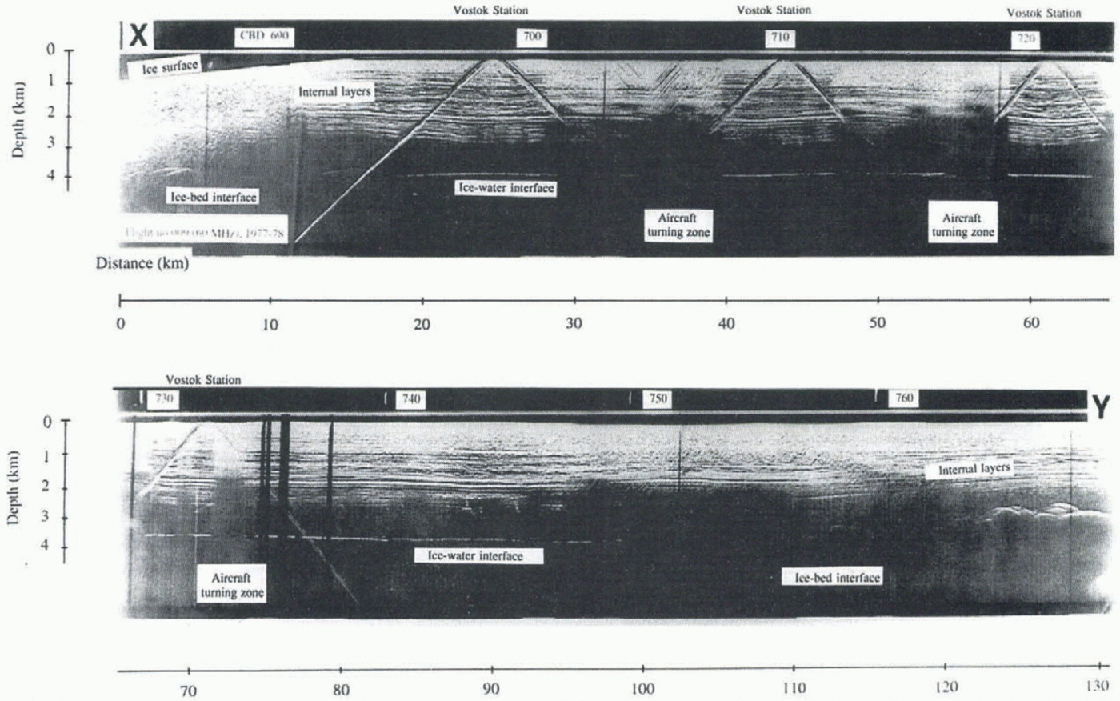
Fig. 3. Time-continuous, Z-scope data around Vostok station, during four successive passes over the station buildings (indicated by surface hyperbolae). The diagram illustrates flow variation in orientation of the aircraft produces variation in the recorded RES signal. The location of markers X and Y is shown in Figure I.
Because internal ice layers are observed to fold gently with horizontal distance (see Z-scope data in Fig. 3), it is inappropriate to combine PRC calculations from separate A-scope data since there may be no exact common depth relationship (although an approximate one should exist). Consequently, we avoid unwanted smoothing of the PRC signal by not combining data calculated from individual A-scopcs together.
In order to examine whether internal radio-echo horizons can be traced across the ice sheet through consideration of A-scope data alone, four PRC records from adjacent A-scope data were compared (Fig. 2). Five distinct PRC maxima corresponding with obvious internal layers can be observed in all PRC records (Fig. 2). in record no. 557, the first of these layers is at ~1000 m and the fifth is at ~2100 m (Fig. 2). The exact depth of the radio-echo layers varies by a few tens of metres between each CBD site (Fig. 2), indicating a gentle undulation of internal layering with horizontal distance. Due to the PRC strength of these layers, and because they can be traced continuously over several km, we conclude that these five horizons (1) represent distinct radio-echo markers with in the ice column and (2) will be evident in adjacent regions of the ice sheet.
Z-scope data from Vostok station indicate further flow internal layers can be traced continuously across the ice sheet (Fig. 3). Several prominent internal layers are traceable across the full extent of the Z-scope section in Figure 3.
The surface parabola on the Z-scope signal indicates e/m reflections off Vostok station buildings, and so locates accurately the position of the station with respect to the traverse (Fig. 3). By analyzing the Z-scope reflections from directly beneath the station, the qualitative radio-echo layer signal from the Vostok ice-core site can be established.

Fig. 4. Chemical, acidity and PRC profiles along the Vostok ice core, (a) Sulphate concentration (b) nitrate concentration, (c) acidity value, (d) ionic balance, (e) PRC from RES data (record no. 557, figs 2 and 3), (f) H2SO4 concentration, calculated by subtracting the total SO4 −2 amount by the contribution of sea salt, Νa2SO4 and CaSO4. Graphs a-d and fare adapted from Reference Legrand, Feniet-Saigne, Saltzman, Germain, Barkov and PetrovLegrand and others (1988).
Vostok Ice-Core Information
It is likely that RES reflections are caused by layers of high acidity and therefore high electrical conductivity (Millar, 1982). Acidity itself is related to the chemical composition of the ice. Since the conductivity profile along the Vostok ice core has not been established, we compare our PRC calculations with the ionic and acidity signal measured from the core (e.g. Legrand and others, 1988). Variations in (i) sulphate concentration (SO4 2-), (ii) nitrate concentration (NO3 −), (iii) acidity (observed H+ concentration), (iv) ionic balance (total ionic budget in μEql−1) and (v) H2SO4 (a compound related to volcanic-derived products) with depth are linked to the PRC! and Z-scope signals from Vostok station in Figure 4. These independent chemical, acid and ionic signals show a reasonable depth correlation with each other, where five depth-dependent maxima are identifiable (Fig. 4). Layers one (at 900m), two (at 1240 m), three (at 1550 m) and five (2100 m) correlate well across all ice-core information (Fig. 4). However, layer four (at 1700-1800 m) is not observable on the SO4 2- and NO3 − records.
Comparing RES and Ice-Core Data
Prominent acid layers (and therefore the RES PRC signal), and other ice layers that form the palaeoenvironment record, are similar in that they are spatially continuous over the ice sheet and deposited at discrete intervals. However, measurements in the two datasets are independent of each other. Thus, we can consider the RES signal an independent stratigraphie control on the ice-core palaeoenvironment data.
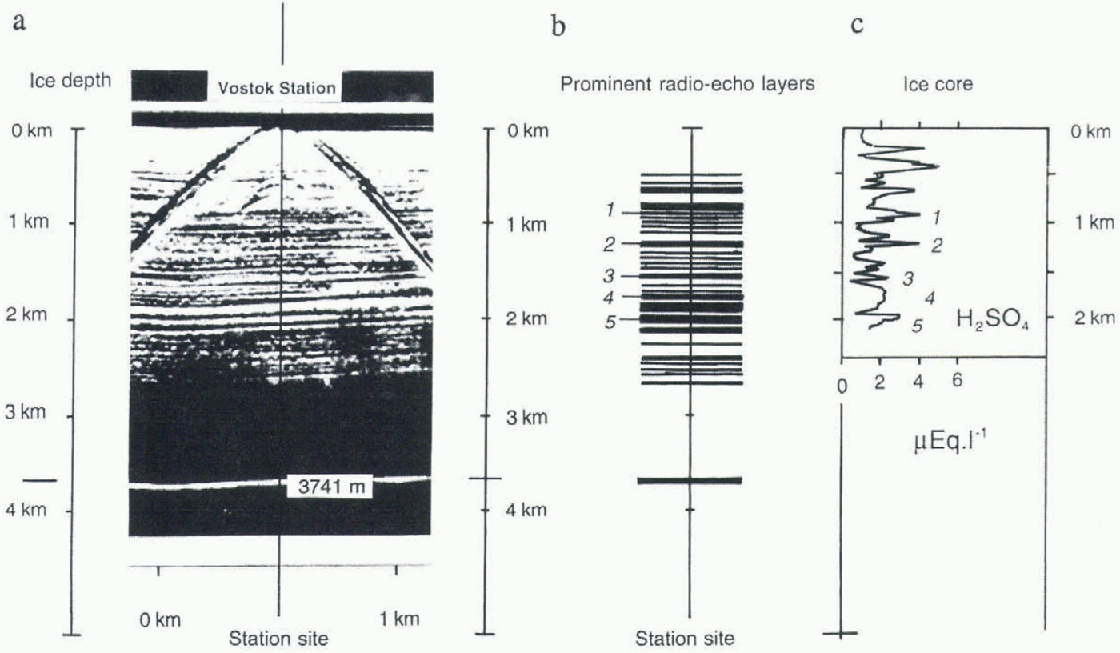
We compare the ice-core chemical signature with (1) Z-scopc RES data from directly over Vostok station and (2) PRC RES information derived from A-scope record no. 557 (Fig. 2). For the case of Z-scope data, prominent internal reflectors compare very well with the depth locations of H2SO4 peaks (Fig. 5). From this correlation we conclude thai radio-echo maxima are related to the peaks in the ice-core acidity and chemical signature.
The PRC record indicates five distinct internal layers (at 1000, 1300,1600, 1900 and 2100 m; figs 2 and 4). Similarly, the ice-core chemical record shows five distinct acid horizons (at 900, 1200, 1500, 1800 and 2000 m; Fig. 4). If these two datasets are related, then there is an apparent offset of 100 m between internal layers at Vostok and the location of the PRC record (CBD 557, Fig. 1). There are two possible explanations for a mismatch between ice-core acidity peaks and the prominent internal radio-echo layers. The first is that the two datasets are unrelated and no match should be expected. The second is that the two datasets are directly related, and the difference between the ice depths at which they occur can be assigned to general folding of internal layers from the ice-core site (where the acid measurements were taken) and ~5 km southwest of Vostok station (where the PRC data were collected). Evidence to support the latter explanation exists in the Z-scope data from Vostok station (Fig. 3), where the internal reflectors can be observed to undulate by around 100 m of vertical displacement over a distance of ~5km.
Attention is drawn to the correlation between the RES layering and the H;¡S04 record (Legrand and others, 1988). Major volcanic events are thought to disturb the H2SO4 signal strongly (Legrand and Delrnas, 1987; Legrand and others, 1988). Therefore, the H2SO4 maxima in the ice core are probably related to volcanic events. Correlation between our RES layering and the H2SO4 supports the link between RES layering and volcanic deposits (figs 4 and 5).

Fig. 5. Comparison between ice-core and RES Z-scope data from the Vostok station site, (a) RES data from Vostok station. The location of the station is established by the radio-wave surface reflections from the station buildings (as in Fig. 3). (b) A representation ofdistinct internal layers from directly beneath Vostok station, (cj The ice-core H2SO4 record. Note that five prominent layers identified in the Z-scope can be correlated well with the ice-core H2SO4 record.
Analysis of Z-Scope with Respect to Orientation Over Vostok Station
Flight 009/1977 passed over Vostok station four times (Fig. 1). The bcamwidth of the RES signal, perpendicular to the direction of the aircraft, was of the order of a few degrees. Consequently, as the aircraft banked before and/or after each pass of the station, e/m reflections from the ice sheet were lost (Fig. 3). However, RES data, penetrating to the ice-sheet base, were recorded when over the station since the aircraft had levelled off at these positions.
The reflection of e/m radiation from a dielectric boundary may be influenced by the polarisation of the e/m signal. Flight 009/1977 recorded RES data over Vostok station at CBDs 700, 710, 720 and 730 (Fig. 3) along bearings of 240°, 155°, 60° and 315° (Fig. 1). These data provide an opportunity to examine flow e/m reflections may be altered by antenna orientation. The antenna was similarly aligned on the first and third passes and on the second and fourth passes over Vostok station. Thus, there are two sets of data, recorded at approximately perpendicular alignments, from which to assess the change in RES signal with orientation. There are two points to consider: the first is flow RES dala vary within two recordings along approximately similar orientations, and the second is to determine the change in two RES signals recorded at 90° to each other.
Qualitatively, the appearance of RES data recorded along the same orientation (at CBDs 710 and 730, and 700 and 720) is similar (Fig. 3). For the former two passes over Vostok station (at 155 and 315°), individual internal radio-echo layering is evident and clear, with little convergence/ divergence of layers. However, the second pair (orientations at 60° and 240°) shows a more noisy signal, with some converging of individual layering. We conclude from this simple analysis that polarisation effects may occur within RES data. in the absence of A-scope information and time-dependent power return data for individual layers (ESM data) for flight 009/1977, we are unable to make a more quantitative analysis of this phenomenon.
Although the quality of Vostok RES data is related to flight orientation (Fig. 3), a large number of continuous internal reflectors can be identified in all passes over the station. For example, a strong reflector located al ~2000 m can be observed in all the data directly over the station (Fig. 3). Moreover, this layer (identified on the PRC records as layer five; Fig. 2), can be traced continuously from Vostok station to location Y (Fig. 3). Thus, polarisation effects (or inhomogeneity of the ice layers) do not alter our analysis of the RES signal at Vostok station.
Conclusions
We have identified five strong internal radio-echo layers from analysis of A-scope and Z-scope data from Vostok station (figs 2 and 3). The radio-echo layers were compared with Vostok ice-core chemical information, such as acidity and ionic balance (Legrand and others, 1988). in doing so, we have indicated that internal reflectors may be caused by variation in ice chemistry. in particular, we demónstrale the relationship between radio-echo layering and the H2SO4. record. These layers correlate reasonably well in depth with chemical signals in the Vostok ice core that are indicative of high acidity. This is because high acidity enhances the electrical conductivity, thus producing a pronounced increase in the dielectric constant. The H2SO4 chemical signal is likely to derive from an aerosol product, deposited widely across Antarctica, that arose from volcanic activity (Millar, 1982; Legrand and Delmas, 1987). Since internal radio-echo layering is related to discrete volcanic events rather than to palaeoclimate, it should represent an independent signal thai could aid in the correlation between ice cores.
Acknowledgements
Funding for this project was provided by U.K. Natural Environment Research Council grant CR9/2532 to M.J.S. and J.A.D. Assistance was given to R.H. by the Trans-Antarctic Association. We (hank the Director of SPRI for his support of this project. We also thank V. Morgan and two anonymous referees for constructive reviews.


