Introduction
Recent warming at high latitudes in Europe has had significant hydrological, ecological and economic effects (Reference SolomonSolomon and others, 2007). In an examination of the possible consequences of climatic change on water resources in Norway, Reference SælthunSælthun and others (1990) suggested that the duration of the period of snow cover would be considerably reduced, possibly by 1–3 months, with a consequent major impact on hydropower generation. Reference Vikhamar-Schuler, Beldring, Førland, Roald and Engen SkaugenVikhamar-Schuler and others (2006) concluded that both the duration of the snow season and the mean annual maximum snow water equivalent would decrease almost everywhere in Norway; the onset of the snow accumulation period would be later than in the present climate and the snowmelt period would start earlier.
The number of snow days in all parts of Norway and the maximum snow depth in warmer regions of the country are sensitive to temperature changes (Reference DyrrdalDyrrdal, 2010). Analysis of data from 585 stations demonstrated that there had been a general decrease in the number of snow days per winter season, particularly in the southeast of the country; negative trends typically became steeper after 1990 (Reference DyrrdalDyrrdal, 2009). Of the stations examined by Reference DyrrdalDyrrdal (2009), 18 are in Nordland county (fylke), which has an area of >38 000 km2 and lies across the Arctic Circle (Fig. 1). Nordland includes two of Norway’s largest ice-covered areas, Svartisen and Okstindan. All the water issuing from their glaciers, and much of the water formed by snowmelt, is used for hydropower generation. Thus, information about variations of the region’s seasonal snow cover, together with an assessment of their causes, is an essential requirement for water resource management.

Fig. 1. Nordland county, Norway. Snow meltwater, together with water discharging from the glaciers supplied by the Svartisen and Okstindan ice caps, is used in hydropower generation. Black dots indicate the locations of the 40 stations from which annual snow-cover records are discussed. Open squares show the location of three long-term meteorological stations. The boundaries of Nordland county are shown by dashed lines, the Norway/Sweden border by a heavy line. The inset shows the location of Nordland.
The coastal topography of Nordland includes steep-sided fjords and numerous islands, which rise in places to >1100 ma.s.l. Among mountains close to the coast are those at West Svartisen ice cap, where the highest point (1594m) is only 10 km from the head of a fjord. Mountains near the border with Sweden include the county’s highest point, Oksskolten (1916 m), which is adjacent to Austre Okstindbreen, the largest glacier of Okstindan.
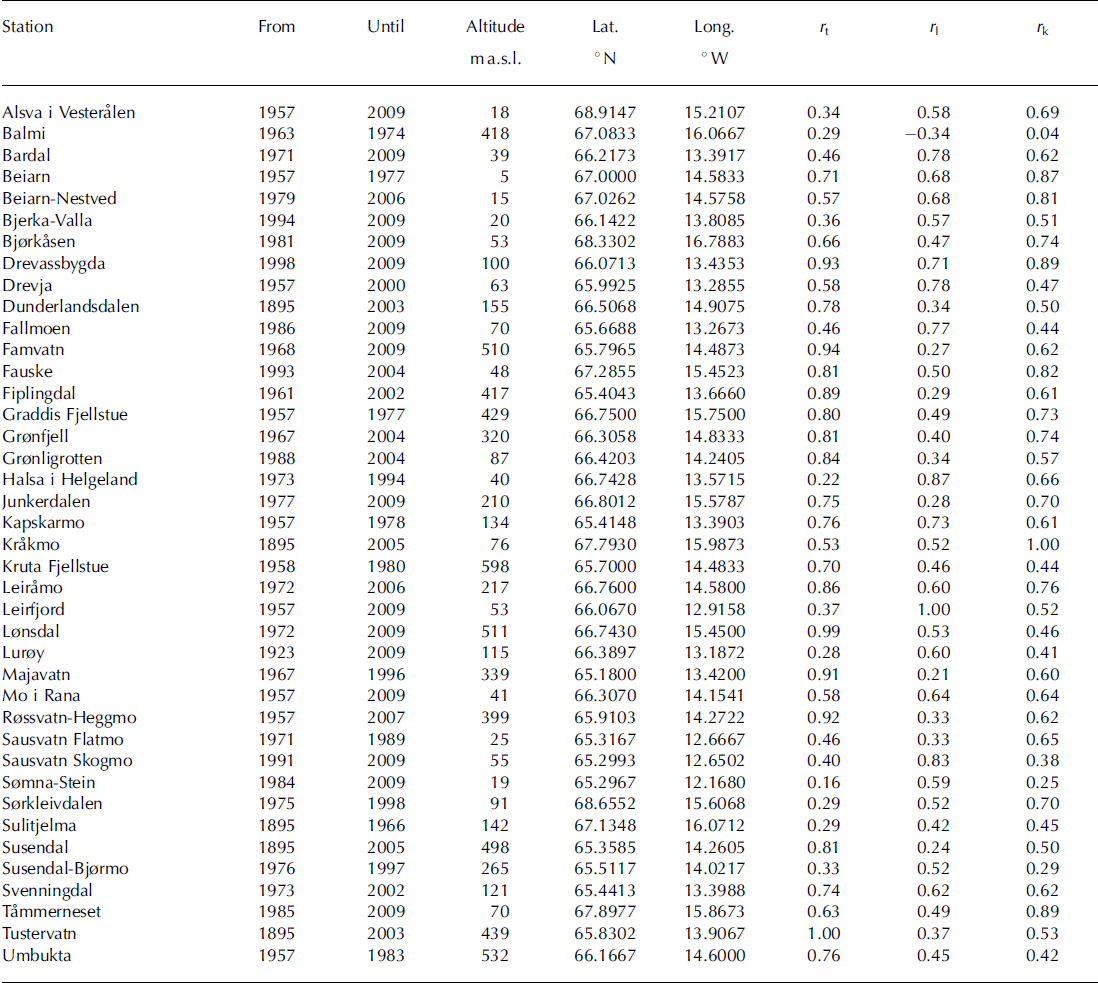
Snow depths have been measured on a daily basis at a few Nordland stations since 1895. At some stations, the mean annual period of continuous snow cover exceeds 200 days. Here data from 40 stations (Table 1) are used in a study of the depth and duration of the winter snow cover since the late 19th century. The aims of the project were to examine temporal patterns in the data and to explore trends in relation to changes of temperature and atmospheric circulation. A particular objective was to assess the influence of the North Atlantic Oscillation (NAO) on the variability of annual snow depths and snow-cover duration in Nordland, and its relationship to spatial differences of the snow-cover record.
Table 1. The 40 Nordland stations used in the analysis of snow-cover variations. The columns indicate the length of the station record used, the altitude and location of the station, and the correlation coefficient of the maximum snow depth record with that at Tustervatn (r t), Leirfjord (r l) and Kråkmo (r k)
Climate
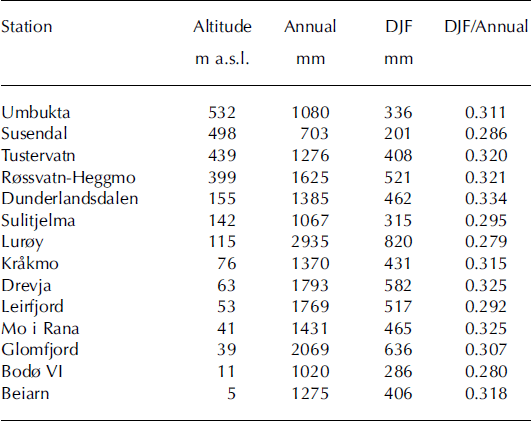
Snowfall in Nordland begins in autumn (September-November (SON)). In most of the county, ∼30% of the annual precipitation falls in winter (December-February (DJF)) and snow depths attain a maximum in that season. Both annual and DJF precipitation totals have a wide range, and there is no simple relationship between precipitation amount and altitude (Table 2). Although there are large differences of annual and seasonal temperatures within Nordland, year-to-year variations throughout the county are strongly correlated: data from Bodø, Hattfjelldalen and Glomfjord (Fig. 1) have correlation coefficients of 0.89–0.97. Reference NordliNordli (2009) noted a temperature increase of ∼1°C between 1910 and 1930. Temperatures were particularly high in the 1930s (Reference TheakstoneTheakstone, 1990) and in the 1990s and 2000s, when annual and DJF means were >0.5°C and >0.6°C above the long-term average, respectively.
Table 2. The mean annual and winter (DJF) precipitation at stations in Nordland, with the ratio of the winter and annual values
The climate at both regional and local levels is affected by variations in the dominant atmospheric circulation. Reference Hanssen-Bauer and FørlandHanssen-Bauer and Førland (2000) reported that 1950–94 temperature and precipitation trends in Norway were related to changes of sea-level pressure patterns. Reference Raben, Theakstone and TørsethRaben and others (2000) identified the synoptic conditions associated with heavy precipitation and with periods of dry weather at Tustervatn (Fig. 1) through winter 1994/95, and a study of air-mass trajectories during winter 1997/98 revealed the coupling between atmospheric circulation and precipitation at the site (Reference TheakstoneTheakstone, 2008). A 7 year study (1997–2004) demonstrated a strong relationship between winter precipitation at Tustervatn and the NAO; five principal moisture source areas and transport routes to the site were identified (Reference TheakstoneTheakstone, 2011).
The North Atlantic Oscillation
The land–sea temperature distribution over the North Atlantic and the adjacent land mass is determined to a large extent by the phase of the NAO (Reference Shabbar, Huang and HiguchiShabbar and others, 2001). The NAO fluctuates between positive phases, during which pressure centres near the Azores and Iceland become stronger and are displaced to the south, and negative phases, when the pressure centres become weaker and are displaced to the north (Reference HurrellHurrell, 1995; Reference OsbornOsborn, 2006). In the positive phase, stronger and more frequent winter storms cross the North Atlantic, and strong westerlies on a more northerly trajectory around the margins of the Arctic are accompanied by colder, drier winters in the Greenland–Iceland region, by above-average temperatures over northern Europe and by higher than normal sea surface temperatures for large parts of the North Atlantic (Reference RogersRogers, 1997). In the negative phase, storms are weaker and less frequent because of the reduced pressure gradient. Although blocking events in the North Atlantic do occur during positive phases of the NAO, they are less frequent and considerably shorter than during negative phases.
Data and Definitions
Daily measurements of snow depth (cm), together with a subjective assessment of the snow cover on a scale of 1 (no snow) to 4 (full cover), are made at a network of stations operated by the Norwegian Meteorological Institute (met.no). In an analysis of long-term snow series at selected stations, Reference Dyrrdal and Vikhamar-SchulerDyrrdal and Vikhamar-Schuler (2009) made use of the subjective scale to define the duration of the winter snow cover. Here, however, it is defined as the period between the first and last days on which a depth of ≥ 1 cm was recorded. If there are several such periods, the longest is used to determine the start and end days (onset and termination) of the period. The maximum snow depth is the highest value recorded between 1 September and 30 June. If that value occurred on more than one occasion, the latest is taken as the date of the maximum snow cover. Winters are identified by the year in which they start (e.g. winter 1995 is that of 1995/96).
Results
Depth of the winter snow cover
Snow depth monitoring in Nordland began in 1895 at five stations: Tustervatn, Susendal, Dunderlandsdalen, Sulitjelma and Kråkmo (Fig. 1). The Tustervatn record was maintained until 1955 and was resumed in 1958, eventually ending after winter 2003. Monitoring at Susendal continued until winter 2005, with a break in 1939–41. The Dunderlandsdalen record extends until 2003, with a gap in 1917. At Sulitjelma, monitoring ended with the 1966 data. Kråkmo station operated until winter 2005. Temporal trends of maximum snow depths at the four stations where monitoring lasted for >100 years were similar, although the averages differed significantly (Tustervatn 1.53 m, Dunderlandsdalen 1.34 m, Susendal 1.12 m, Kråkmo 0.64 m). Depths decreased sharply in the 1920s and increased in the following two decades (Fig. 2). An increasing trend from the late 1950s peaked in the 1970s, and a sharp increase in the 1990s was followed by a marked decline (Fig. 2).
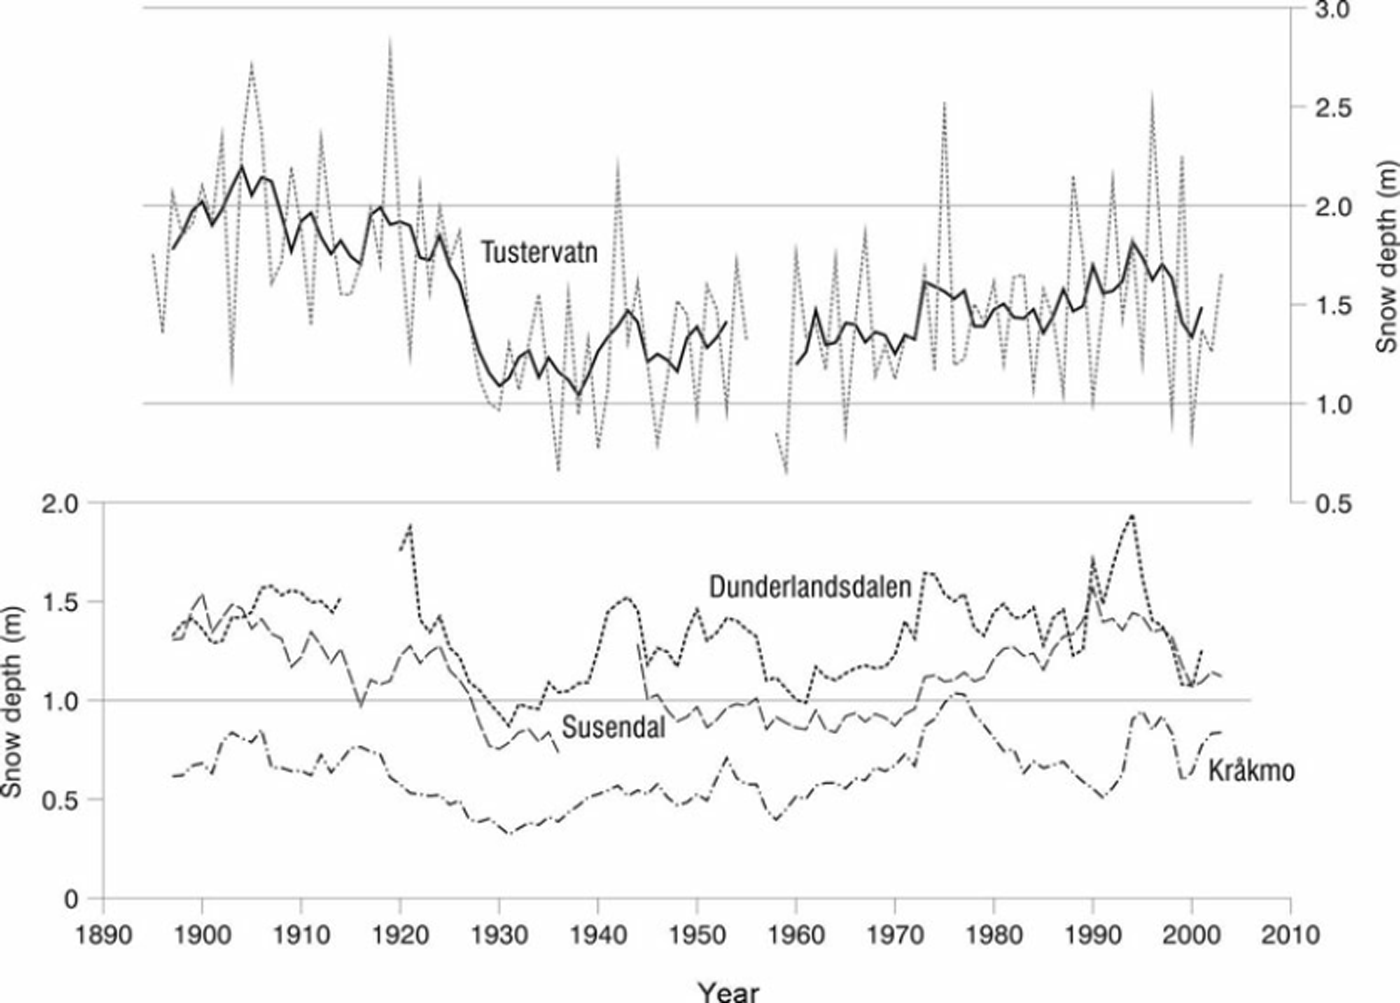
Fig. 2. Annual maximum snow depths at four Nordland stations where records span >100 years had similar trends, despite differences in the mean values. Annual values at Tustervatn are linked by broken lines. Five-year running mean values for all four stations are shown by solid lines. Gaps in the records at Tustervatn, Dunderlandsdalen and Susendal result from periods during which the stations were closed.
Several ‘deep snow’ winters stand out in the Nordland data, and most are apparent in the Tustervatn record (Fig. 2). In 1919, absolute maximum snow depths were recorded at both Tustervatn (2.78 m) and Dunderlandsdalen (3.70 m). In 1975, when 26 of the stations listed in Table 1 were operating, 16 recorded their maximum depth. Only 3 of those stations (Lønsdal, Graddis Fjellstue and Beiarn) were north of the Svartisen ice caps. At most of the 16 stations, the greatest snow depth was registered in late January or early February, but at 3 high-lying sites (Kruta Fjellstue, Famvatn and Røssvatn-Heggmo) the maximum occurred in April. Other winters when multiple maxima occurred were 1996 (6 stations: Sørkleivdalen, Bjørkasen, Tammerneset, Kråkmo and Fauske in the north of the county, and Grønfjelldal further south) and 1999 (5 stations: Fallmoen, Drevassbygda and Bjerka-Valla in the south of the county, and Junkerdalen and Beiarn-Nestved further north). Winters in which no station registered an absolute maximum but overall values were high (>1.50m) include 1904, 1905 and 1922, in each of which the ground at Tustervatn was snow-covered from October until May. Winters with particularly low maxima (<0.60m) include 1959 (16 stations), 1998 (29 stations) and 2007 (16 stations), in each of which there was no continuous snow cover at Tustervatn until late autumn.
Correlations between all stations were explored inorderto assess spatial coherence of the maximum snow depths. Tustervatn is one of the higher stations in southern Nordland. It had a strong (r≥0.70) relationship with 19 stations (the ‘Tustervatn group’), including Dunderlandsdalen and Susendal (Table 1). Most were above 200ma.s.l. (mean altitude 298 m) and south of 678300 N; many were close to the border with Sweden (Fig. 1). Only 4 of the 20 stations (mean altitude 36 m) for which correlations were weaker (r<0.70) were above 100 m. Of the 12 ‘Tustervatn group’ stations that were operating in the ‘deep snow’ winter of 1975, 8 recorded their greatest snow depth that year. The strong correlation of the snow depth record at these stations in southern Nordland suggests that they share a common pattern of winter storms. This was substantiated by an analysis of stratigraphic variations of ions and oxygen isotopes in the 4.8 m of snow that accumulated at 1470ma.s.l. on the glacier Austre Okstindbreen, 25 km northeast of Tustervatn, during winter 1997: analytical results of the chemistry of daily precipitation at Tustervatn throughout the winter permitted dates to be assigned to much of the snowpack stratigraphy, and indicated their shared history (Reference TheakstoneTheakstone, 2008).
Kråkmo, in northern Nordland, had a strong (r≥0.70) relationship with 11 stations (mean altitude 145 m). Of these, 7 were in the ‘Tustervatn group’ but north of Tustervatn itself; the other 4 were in the north of the county (Table 1; Fig. 1). The mean annual maximum snow depth at the ‘Kråkmo group’ stations (0.90 m) was much less than that at the ‘Tustervatn group’ (1.30 m), and for those that did not have a strong relationship with Tustervatn the value was only 0.39 m. All six stations at which the maximum snow depth occurred in 1996 were in the ‘Kråkmo group’.
Leirfjord, a coastal station in southern Nordland, had a strong (r≥0.70) relationship with 8 stations; 2 of them (Kapskarmo and Drevassbygda) were in the ‘Tustervatn group’. Most of the ‘Leirfjord group’ stations were west of higher terrain which extends from Majavatn to Okstindan, and only Kapskarmo was >100ma.s.l. (Table 1; Fig. 1). The mean annual maximum snow depth was 0.82 m. Six of the stations were operating in 1975; four of them recorded their greatest snow depth in that winter.
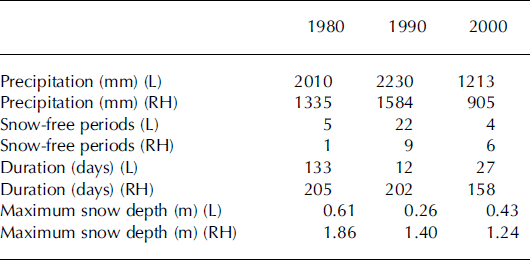
Temporal trends of maximum snow depths were similar at stations within the groups identified above, but between-group differences were apparent. Spatial variations of the maximum snow depth reflect the interaction of terrain, temperature and the trajectories of air masses transporting moisture to Nordland. This is evident in the different snow conditions at Lurøy (115 m) and Røssvatn-Heggmo (399 m) in the winters of 1980 (cold), 1990 (mild) and 2000 (cool) (Table 3). Further evidence of the effects of local (geographical) factors on snow depths is provided by the absence from the record at high-lying stations of the decline of the maximum snow depth at lower stations in the 1980s (Fig. 3).
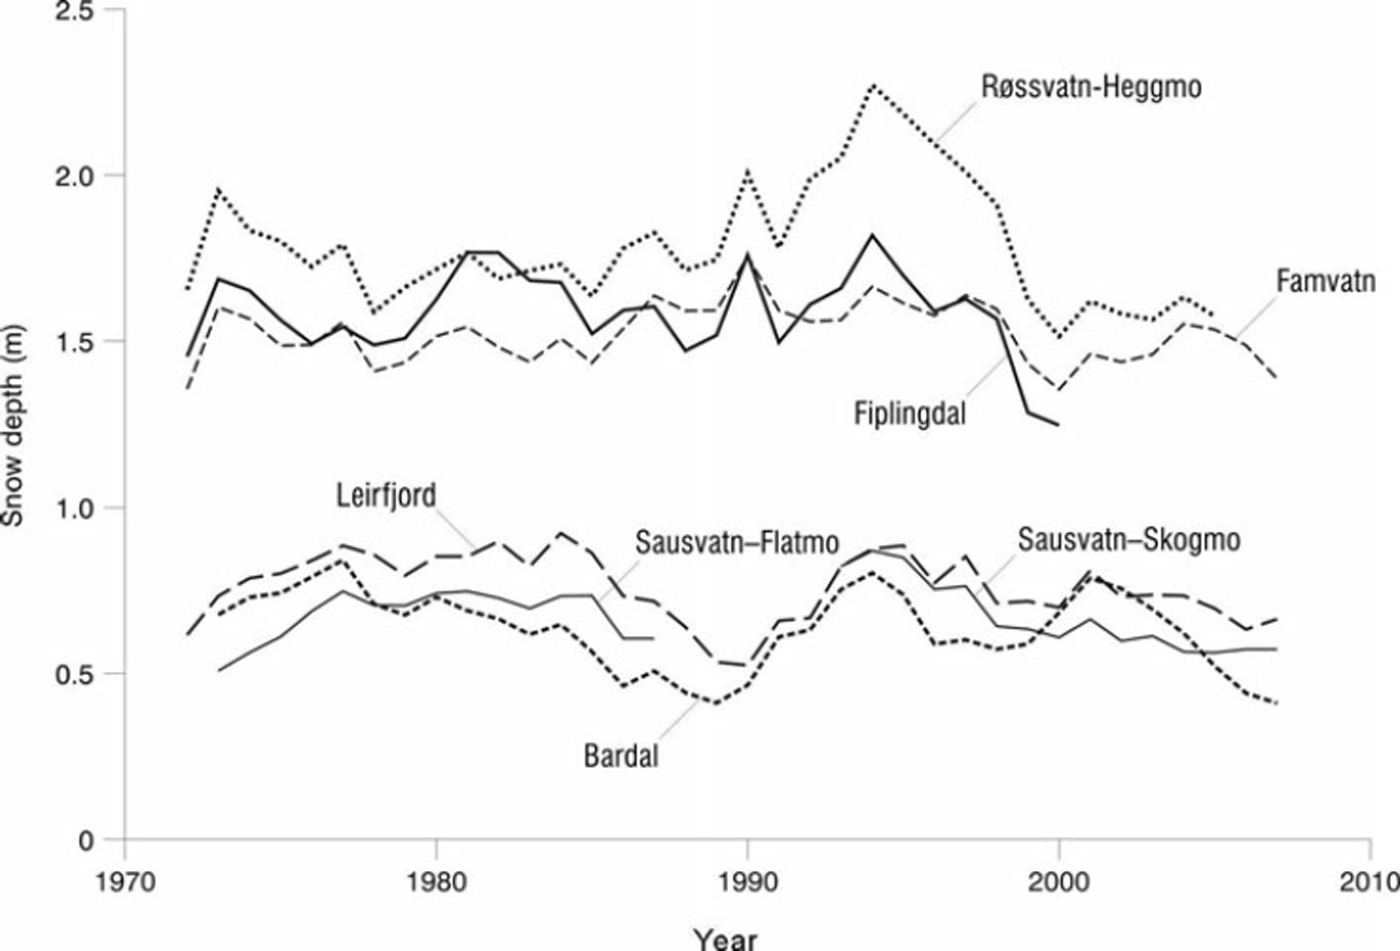
Fig. 3. Maximum snow depths at high-altitude stations in the ‘Tustervatn group’ are ∼1 m more than those in the lower-lying stations of the ‘Leirfjord group’. Within-group trends, shown here as 5 year running means, were generally similar.
Table 3. Precipitation, number of snow-free periods after the first snowfall, duration of the longest period of continuous snow cover and maximum snow depth at Lurøy (L) and Røssvatn-Heggmo (RH) in the 1980, 1990 and 2000 winters (1 September–31 May)
Duration of the winter snow cover
At most Nordland stations, the duration of the period of continuous snow cover, D, (hereafter, simply ‘duration’) is related to its start date, S: the earlier the start, the longer is the duration. At Tustervatn (Fig. 4),
where S=0 is 1 September. It follows that
where E is the end date of the period of continuous snow cover. Thus, the range of end dates is considerably lower than that of start dates. This reflects the rapid increase of radiation and temperature inputs to the surface energy balance in spring. At Tustervatn, the mean start date between 1895 and 2003 was day 67 (6 November) (coefficient of variation (CoV) 0.22). The mean end date was day 273 (1 June) (CoV 0.04). During the 1920s and 1930s, start dates tended to become later and end dates became earlier (Fig. 5). The increase in the duration of the snow cover in the early 1940s did not result from an abrupt change of the start date, but reflected a much later end to the period of continuous snow cover.
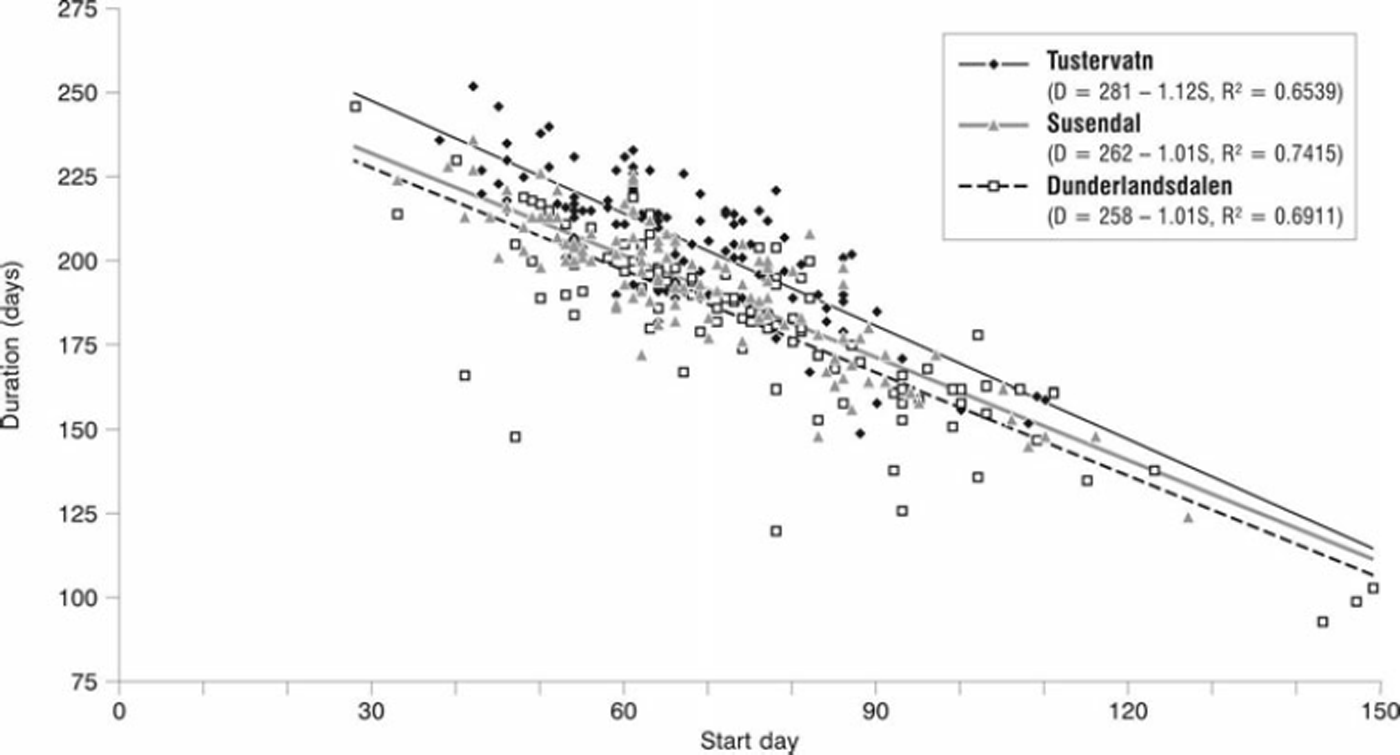
Fig. 4. The start date and duration of the period of continuous snow cover at three Nordland stations with records spanning >100 years were closely related. The relationship was similar at each of the stations. The straight lines are best-fit linear relations.
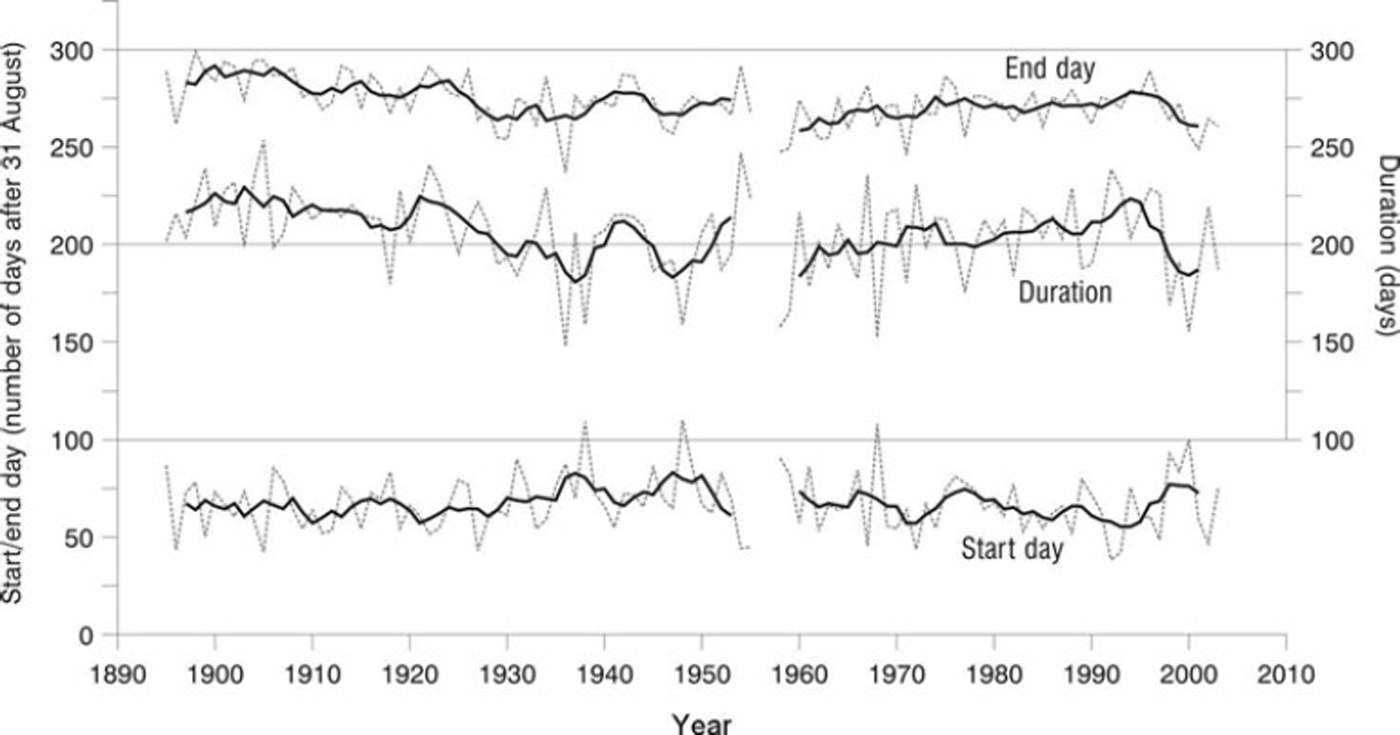
Fig. 5. The duration of the period of continuous snow cover at Tustervatn decreased through the first three decades of the 20th century. It increased sharply in the early 1940s, reflecting an earlier start and later end to the period, but decreased later in the decade. An increasing trend through much of the second half of the 20th century ended in the 1990s. Broken lines link annual values. Solid lines are 5 year running mean values. Winters are designated by the calendar year in which they start.
The S/D relationships at Tustervatn, Susendal and Dunderlandsdalen were very similar (Fig. 4). The duration of the continuous cover at Kråkmo was ∼90 days shorter than at the other stations that had >100 years of record, and the year-to-year variations were more pronounced (CoV 0.40, compared with 0.10, 0.11 and 0.15 for Tustervatn, Susendal and Dunderlandsdalen, respectively). However, temporal trends were similar (Fig. 6). A decrease in the duration in the 1920s was followed by a generally increasing trend for >50 years, albeit with marked shortening of the period in the 1940s and around 1990 (Fig. 6).
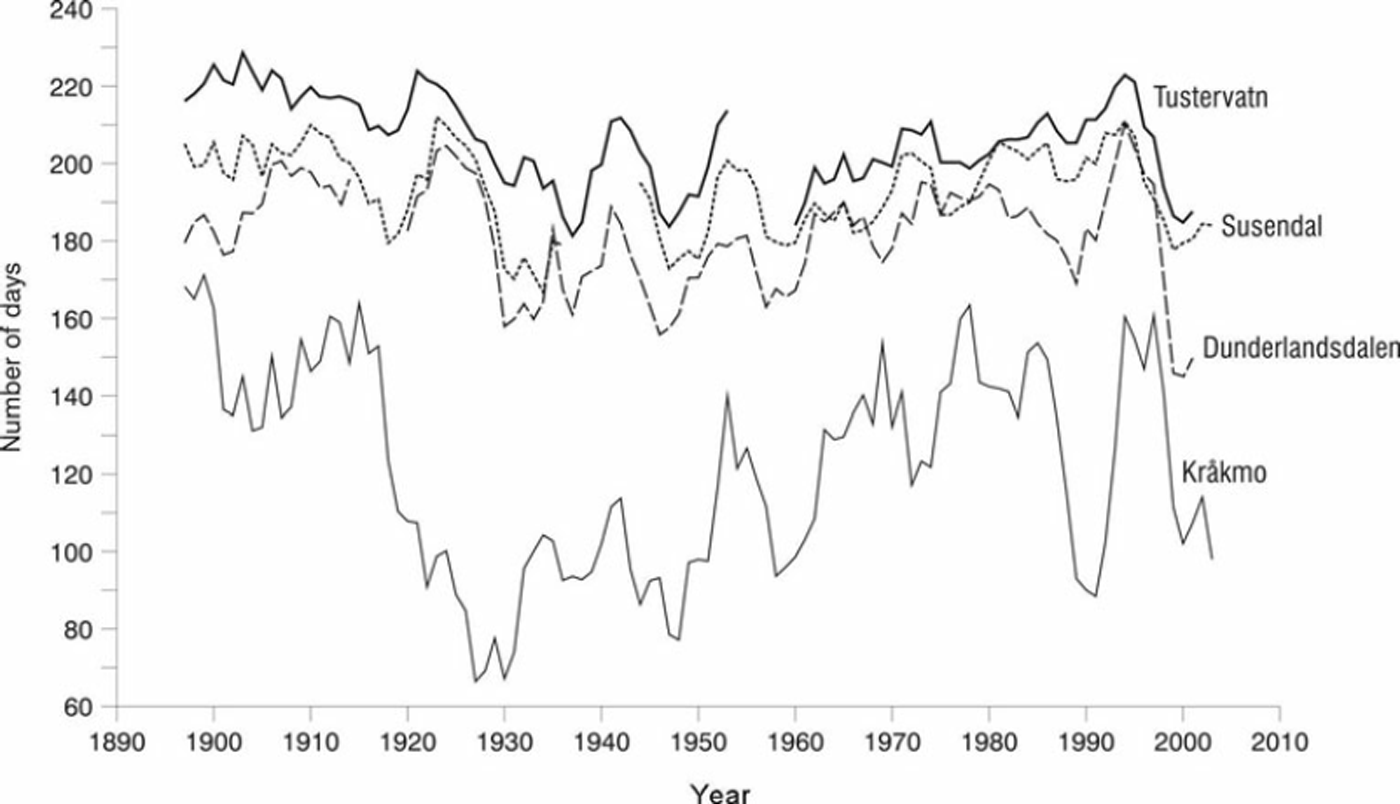
Fig. 6. At the four Nordland stations with the longest records, temporal trends of the duration of the continuous snow cover, indicated by 5 year running mean values, were similar, but the variations, particularly around 1990, were more pronounced at Kråkmo (76 m a.s.l.) than at the three higher stations, Dunderlandsdalen (155 m), Tustervatn (439 m) and Susendal (498 m).
The decreased duration of the snow cover around 1990 was particularly evident at low-lying stations and those in northern Nordland, including Alsva i Vesterålen (18m a.s.l.), Bardal (39m) and Leirfjord (53 m). It was much less pronounced at higher stations towards the southern border of the county, including Famvatn (510 m), Fiplingdal (417 m) and Røssvatn-Heggmo (399 m), where both the depth and duration of the snow cover were greater (Fig. 7). At the lower stations, several episodes of snow accumulation, followed by complete melting, may occur before the onset of the period of continuous cover. Thus, in the winters of 1988–95, Alsva i Vesterålen experienced as many as 12 periods of snow cover lasting 1–31 days before the start of the continuous cover period, whilst at Røssvatn-Heggmo there generally were no more than 3 such periods, rarely lasting >9 days.
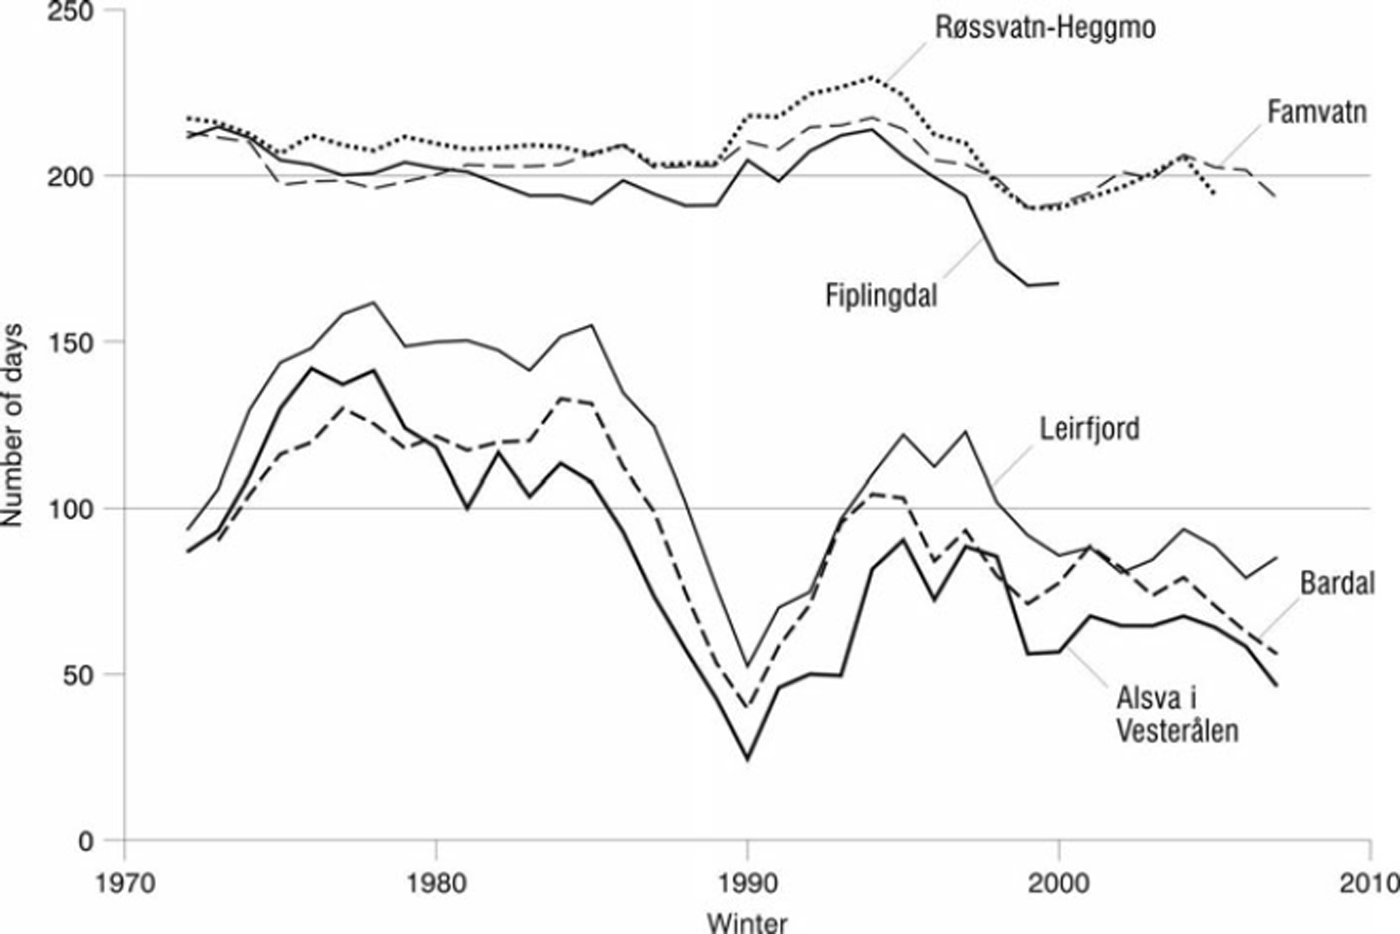
Fig. 7. The duration of the period of continuous snow cover at low-altitude stations in Nordland decreased in the 1980s, but this was not apparent at higher-altitude stations, where the period generally was ∼100 days longer. The plotted data are 5 year running mean values.
Influence of the NAO
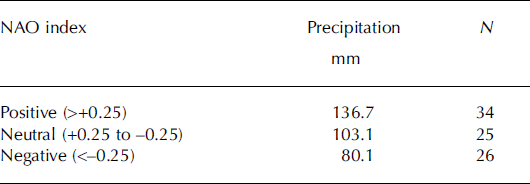
The NAO is the primary source of variability of the North Atlantic climate on many timescales (Reference MarshallMarshall and others, 2001), and a significant part of recent climate variations in Norway can be related to it (Reference BenestadBenestad, 2001). Winters generally are warmer when the DJF NAO index is high than when it is low (Fig. 8), and frequent winter storms bring snow to Nordland when the DJF NAO index is positive. Long-term variations of winter precipitation at Tustervatn are closely related to the index (Reference TheakstoneTheakstone, 2011), as was evident during the 1997–2004 study (Table 4).
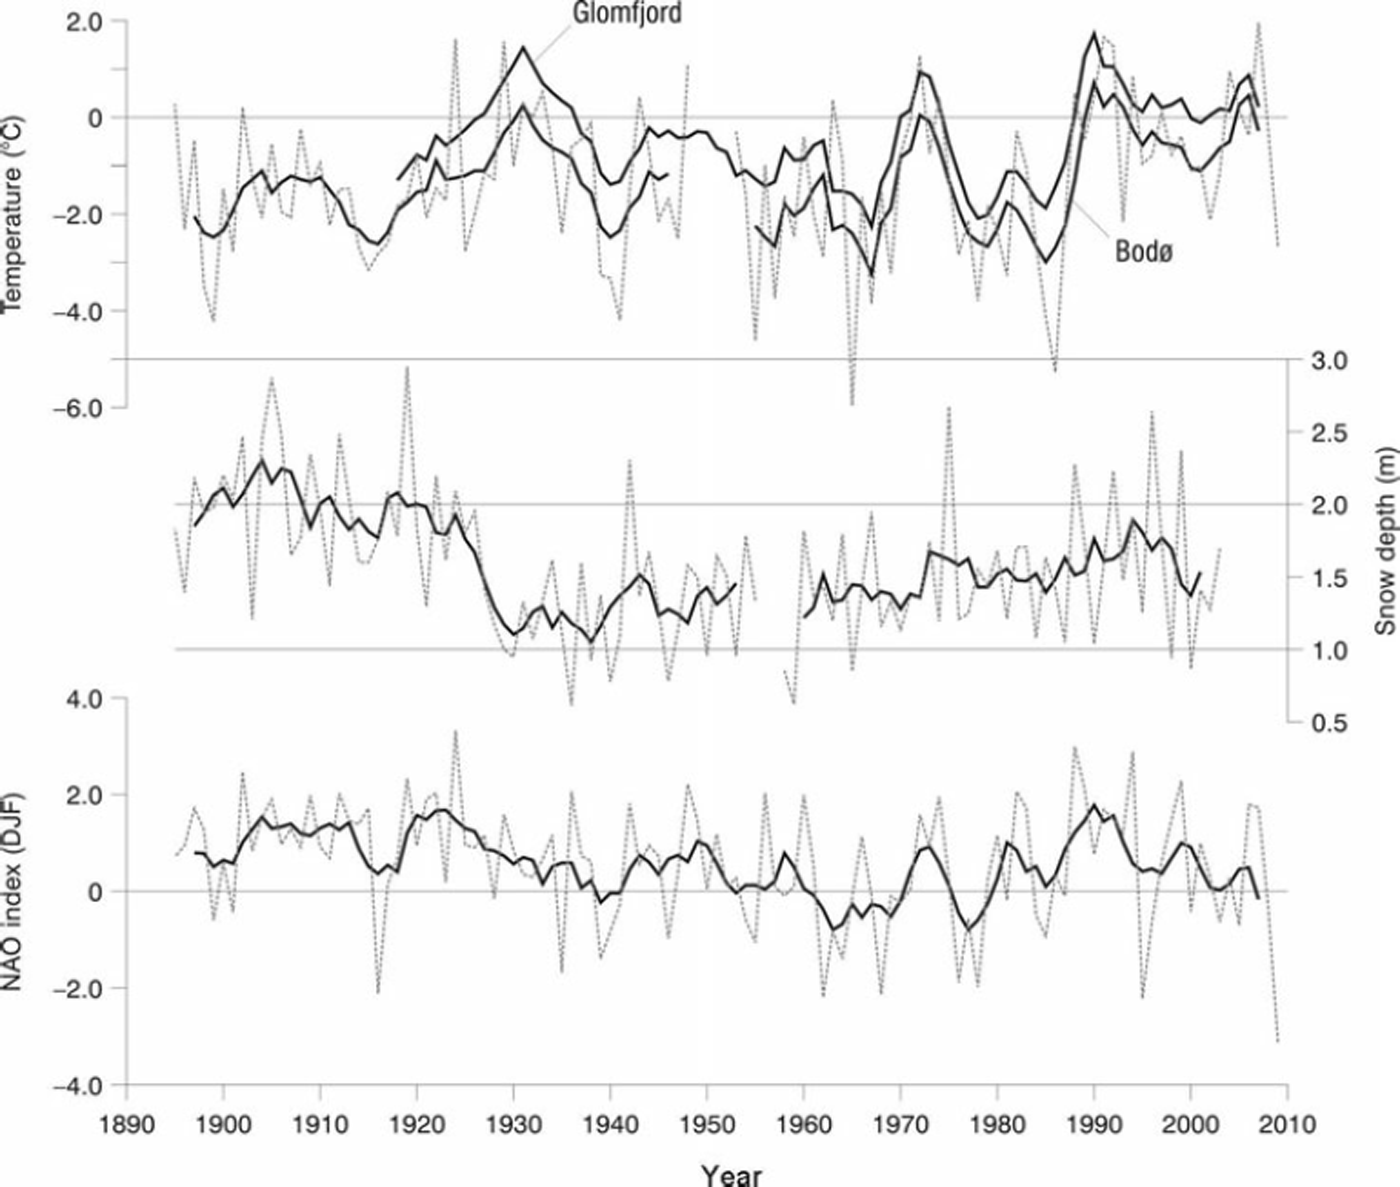
Fig. 8. The annual maximum snow depth at Tustervatn reflects the influence of the winter North Atlantic Oscillation (DJF NAO) index and the mean winter temperature of the region. Broken lines link annual values. The solid lines are 5 year running mean values.
Table 4. The relationship of the monthly NAO index and mean monthly precipitation at Tustervatn, September 1997–September 2004. N is the number of months
The DJF NAO index has varied considerably since the last years of the 19th century (Fig. 8). Apart from the 1916–18 winters, it was high until the 1920s. Subsequently, as it declined and North Atlantic storms became weaker and less frequent, snow depths decreased sharply (Fig. 8). For much of the second half of the 20th century, snow depths increased as the index tended to become more positive, although it had a decreasing trend through the 1950s and 1960s, and DJF temperatures generally were low. The maximum snow depth at Tustervatn was <1.50m in 55 of the 1895–2003 winters; the DJF NAO index was negative in 22 of them. The lowest maximum (0.78m) was in winter 1940, when the index value was –0.82. The maximum depth was ≥1.50m in 54 winters; the index was negative in only 10 of them.
The start of the period of continuous snow cover is influenced by both the NAO and autumn temperatures. Trends in the start date have mirrored those of the SON NAO index (Fig. 9). For most of the 20th century, the index was negative. In the 1940s, as values increased and autumn temperatures rose, the onset of the continuous snow cover was delayed. Declining index values in the 1960s, 1980s and 1990s, and increasing values in the 1970s, were reflected in changes of the onset of the continuous snow cover (Fig. 9).
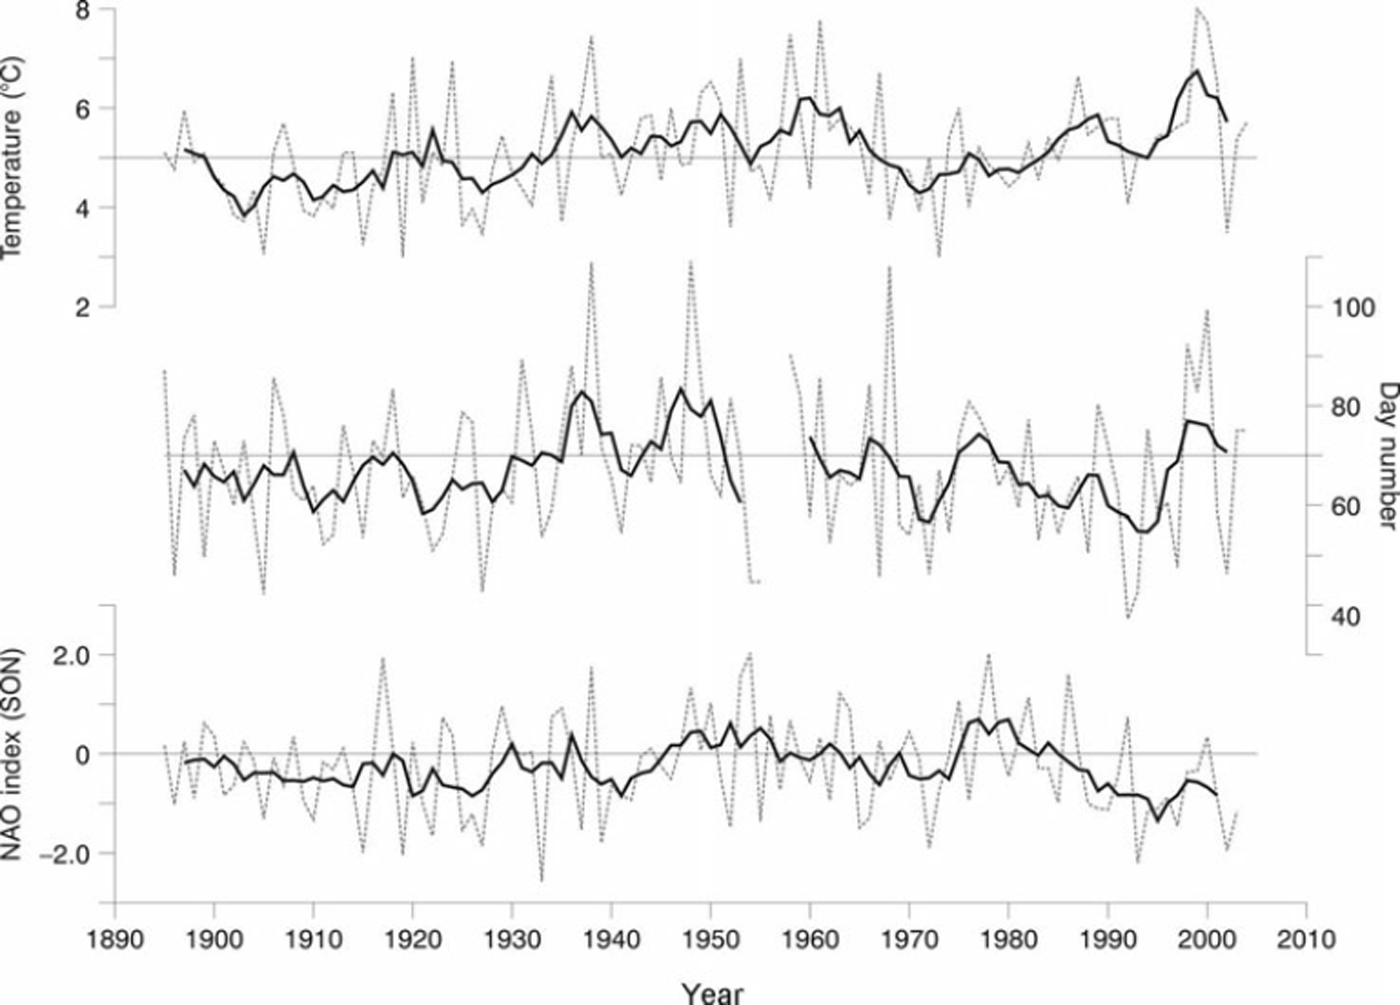
Fig. 9. The onset of the period of continuous snow cover at Tustervatn is influenced by the autumn (SON) NAO index and the air temperature. The day number of the period is referenced to 1 September. Temperature values are from Bodø and Glomfjord. Broken lines link annual values. The solid lines are 5 year running means.
Discussion
Both the length of the snow season and the depth of the snow cover have decreased in much of Norway during recent decades (Reference Dyrrdal and Vikhamar-SchulerDyrrdal and Vikhamar-Schuler, 2009). Increasing temperatures, and the consequent later start to snow accumulation, may have been responsible for negative trends in the number of snow days (days with 50% or more snow cover or snow depth >1 cm) and the maximum snow depth in both 1931–60 (55 stations) and 1961–90 (298 stations), while some positive trends in maximum snow depth in colder regions might be explained by increased winter precipitation (Reference DyrrdalDyrrdal, 2010). Between 1957 and 2007, the number of snow days decreased, but there were clear geographical differences: the number was largest in inland mountainous areas and in the north of the country (Reference DyrrdalDyrrdal, 2009). In Nordland, where the winter snow season lasts for up to 200 days, the duration and maximum depth of the seasonal snow cover have varied through the last 110 years. The values at each site reflect the interaction of synoptic conditions, temperature and terrain. An increase of contaminants in the snow in recent years may have caused accelerated melting, thereby shortening the snow season (Reference PainterPainter and others, 2007).
The NAO strongly influences the climate and snow regime in Nordland. To a large extent, the phase of the NAO determines the land–sea temperature distribution over the North Atlantic and the adjacent land mass (Reference Shabbar, Huang and HiguchiShabbar and others, 2001). Changes of atmospheric circulation may cause variations of North Atlantic Ocean sea surface temperatures at the monthly to seasonal scale (Reference SeagerSeager and others, 2000), and the variability of Atlantic weather systems is influenced by the seasonal NAO. Blocking episodes, which, because of their persistent nature, can have a significant impact on monthly and seasonal temperature and precipitation, are related to the NAO index: 67% more winter blocking days occur when the index is negative than when it is positive (Reference Shabbar, Huang and HiguchiShabbar and others, 2001). Blocking events are often associated with high pressure to the north of a centre of low pressure on the same latitude (Reference Buehler, Raible and StockerBuehler and others, 2011): at Tustervatn, extended periods of dry winter weather occur when a blocking anticyclone is centred over or to the east of Scandinavia, with low-pressure centres to the north or south (Reference Raben, Theakstone and TørsethRaben and others, 2000). The higher frequency of blocking events in winters with a negative NAO index is reflected in the Tustervatn snow depth records: the average maximum snow depth in such winters (1.32 m) was considerably lower than in those with a positive index (1.62 m).
Topography, in particular the location and orientation of mountain ranges, moderates the effects of the atmospheric controls on snow accumulation, with consequent spatial variations in the long-term records of snow-cover timing and depth. The problem of assigning a simple role to elevation/precipitation relations is shown by the maximum snow depths on a roughly west–east transect from Drevja (63 m), through Tustervatn (439m) and Røssvatn-Heggmo (399m) to Famvatn (510m) in three recent winters (Table 5). The large spatial variability of precipitation and the limited nature of the widely spaced data, especially at higher altitudes, make it difficult to model snow accumulation. Reference Schuler, Crochet, Hock, Jackson, Barstad and JóhannessonSchuler and others (2008) used a linear model of orographic precipitation to estimate snow accumulation on West Svartisen ice cap, where the spatial pattern of accumulation is not reproduced accurately by elevation-dependent relations. Reporting that the model captured the asymmetric pattern of winter accumulation across the ice cap, and also reproduced the time series of area-averaged winter mass balances of several glaciers in the region, they concluded that the model is a useful tool for estimating the distribution of precipitation in space and time. However, deviations of up to 30% between observed precipitation and values predicted by the model did occur.
Table 5. Maximum snow depth (m) at four Nordland stations on an approximately west–east transect in three successive winters

Analysis of the time series of the maximum snow depth and snow-cover duration in Nordland based on an assumption of linearity is unlikely to be informative or useful: the variations of the seasonal snow cover through more than a century of observations (Figs 2 and 5) indicate a dependence on a variety of regional and local factors, with the NAO having a principal role.
Conclusions
Many processes influence snow accumulation in the >38 000 km2 of Nordland county, including local and regional topography, the trajectories of winter storms and the frequency of snowmelt events during the winter. The temporal variability of snow depth and snow-cover duration is influenced strongly by variability of the atmospheric and oceanic circulations in the North Atlantic area that affect temperature and precipitation, particularly the NAO. At the seasonal scale, the maximum depth of the snow cover, reflecting the frequency and intensity of winter storms, is influenced by the DJF NAO index, and the onset of the period of continuous snow cover is related to the SON index. The dates of the termination of the period of continuous snow cover have a narrower range than those of its onset. This reflects the stronger influence of air temperatures in spring, when daylight hours are increasing rapidly, than in the autumn. Geographical differences in the influence of the NAO are probably responsible, in part, for spatial differences of the snow-cover record, such as that between the northern stations of the ‘Kråkmo group’ and those of the more southerly ‘Tustervatn group’.
Snow observations are of very great importance in Nordland, especially in a period of changing climate. Spatial differences of snow accumulation and melting, superimposed on temporal variations, must be monitored with care in order to manage the county’s water resources effectively. Continuing studies of the chemistry of snowpacks at selected sites in relation to the trajectories, frequency and intensity of winter storms should be of value in this respect.
Acknowledgements
I am grateful to Anita Verpe Dyyrdal for providing copies of her met.no reports, and to Nick Scarle for drafting the figures. Helpful comments from two anonymous referees and the Scientific Editor were appreciated. Data are from the Norwegian Meteorological Institute eKlima database.


