Introduction
Methanesulphonic acid (MSA) is an atmospheric oxidation product of marine biogenic dimethylsulphide (Reference Saltzman, Savoie, Zika and ProsperoSaltzman and others, 1983, Reference Saltzman, Germain, Legrand, Feniet-Saigne, Barkov and Petrov1991; Reference Prospero, Savoie, Saltzman and LarsonProspero and others, 1991). MSA is transported as part of the primary aerosol to the Antarctic continent and deposited in the snowpack (Reference Wolff, Wolff and BalesWolff, 1996). Antarctic snow and firn studies show that MSA is deposited in higher concentrations during the summer months, when there is increased biological activity (Reference Legrand, Feniet-Saigne, Saltzman and GermainLegrand and others, 1992, Reference Legrand, Wolff and Wagenbach1999; Reference Wolff, Wolff and BalesWolff, 1996; Reference Legrand and PasteurLegrand and Pasteur, 1998; Reference MinikinMinikin and others, 1998), and in some studies also during glacial periods (Reference Pasteur, Mulvaney, Peel, Saltzman and WhungPasteur and others, 1995). For related reasons, MSA is considered to be a useful indicator of past sea-ice extent (Reference Welch, Mayewski and WhitlowWelch and others, 1993; Reference Peel and DelmasPeel, 1995; Reference CurranCurran and others, 2002) and has the potential to provide records in this context over several thousand years. One major complication, however, is that MSA is known to move through firn; it appears to relocate from summer layers into winter layers where it is thought to bond with available cations (Reference Mulvaney, Pasteur, Peel and SaltzmanMulvaney and others, 1992; Reference PasteurPasteur, 1996; Reference Wolff, Wolff and BalesWolff, 1996; Reference Pasteur and MulvaneyPasteur and Mulvaney, 1999, 2000; Reference CurranCurran and others, 2002). A further complication is that this effect is not ubiquitous and appears to depend on site parameters such as accumulation rate. Understanding any post-depositional changes in MSA within firn and ice is therefore critical for the data to be interpreted effectively. Reference Legrand, Feniet-Saigne, Saltzman and GermainLegrand and others (1992), Reference PasteurPasteur (1996) and Reference Pasteur and MulvaneyPasteur and Mulvaney (2000) conducted laboratory experiments to investigate MSA
movement in solid ice, but their experiments were on only a few samples and their results were inconclusive. This study addresses the issue of MSA stability in stored ice cores by observing its variation across several consecutive core width samples through ion chromatography. Variation along the core axis is expected to be a function of seasonality, but variation across the core widths is more likely to be related to post-recovery movement. Other species were also analyzed in the same samples, but their concentrations are not presented here as their distributions did not show any significant variation across core width.
Method and Results
The ice core used in this study was from the 20 cm diameter thermally drilled section of the Dome Summit South (DSS) core, Law Dome, East Antarctica. The sampled core sections were drilled in January 1988, and oxygen isotope ratio samples removed from the core edges immediately. At the time of this study, the core had been in storage horizontally for 14.5 years at –18 to –20˚C within sealed plastic bags in a capped cardboard tube. The core interval selected was from below the bubble close-off depth (approximately 70 m) at 75.44–77.37 m below the 1987/88 summer snow surface. Two sections were targeted within this interval to coincide with the summer peaks previously defined through chemical analyses of the DSS site (Reference Morgan, Wookey, Li, Skinner and FitzpatrickMorgan and others, 1997). The MSA record at this depth has not moved into the winter ice, although there is some evidence of movement into autumn ice in the upward direction (Reference CurranCurran and others, 2002).
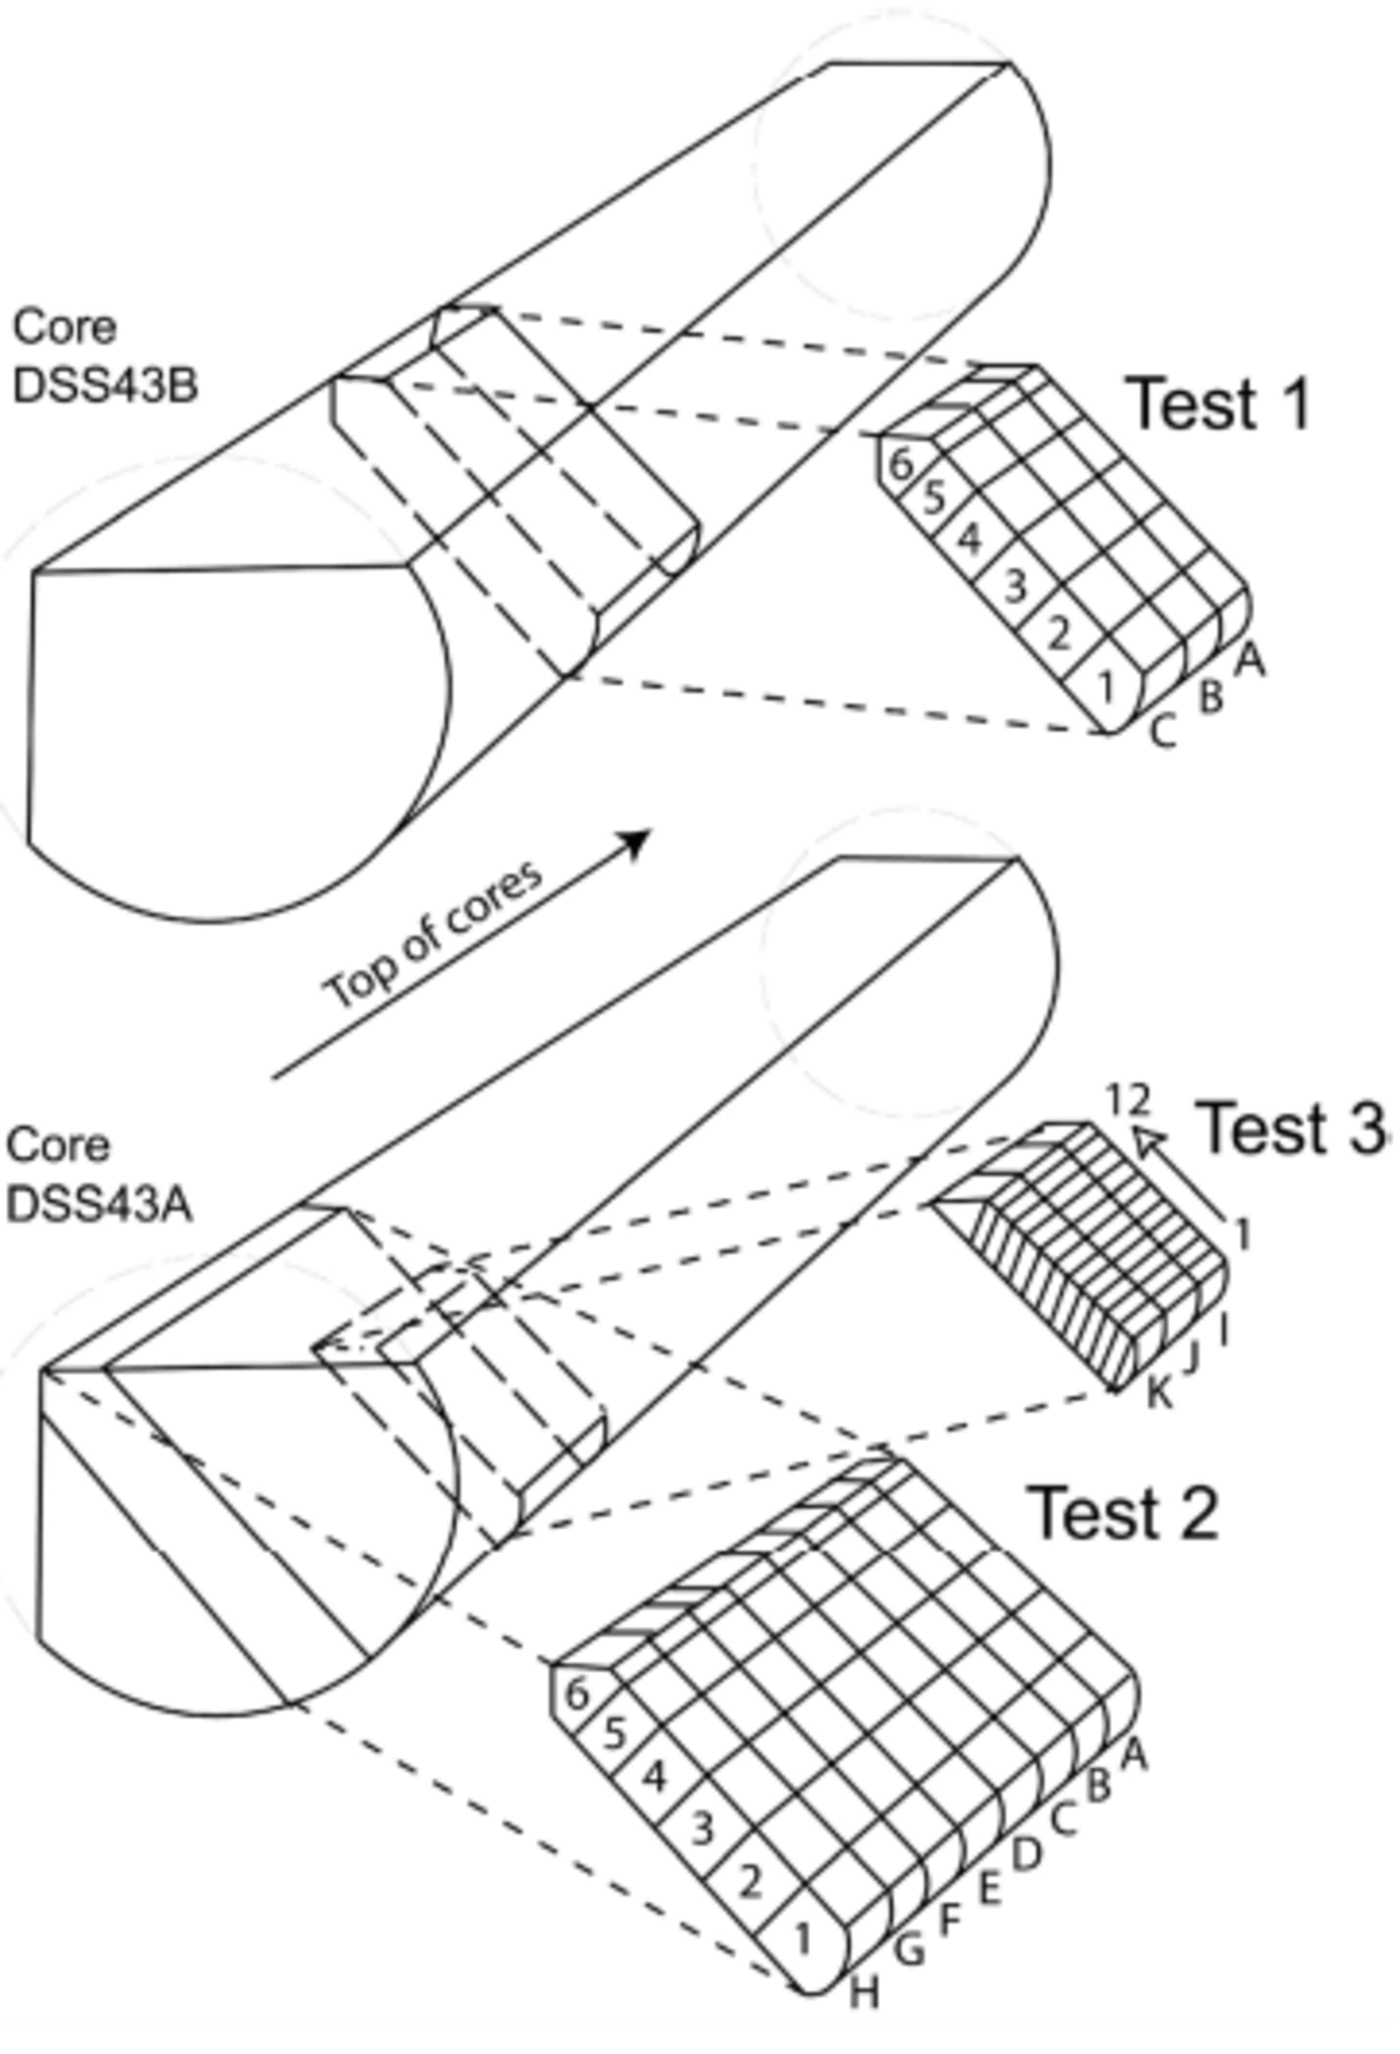
Due to previous sampling of these core sections immediately after drilling, it was not possible to obtain a complete 20 cm cross-section of the core, but two sections of 18 cm (tests 1 and 2) and one of 8 cm (test 3) were used (Fig. 1).

Fig. 1. Sketch of ice-slab positions for tests 1–3. Test 1 is from core DSS43B, and tests 2 and 3 from DSS43A. Note that the slab used in test 3 is not a radial segment (diagram not to scale).
In test 1, three ice sticks of 3×3×18 cm were cut consecutively across the core width (lines A–C). Eight ice sticks of the same dimensions were cut consecutively for test 2 (lines A–H) (Table 1; Fig. 1). Each of these ice sticks was cut into six contiguous 3 cm samples across the core width using a microtome blade within a laminar-flow hood in a freezer laboratory at the Antarctic Cooperative Research Centre. Care was taken not to remove more than approximately 2 mm from the outermost core edge. For test 3, three consecutive ice sticks of 5×4×6 cm were cut into 12 contiguous 0.5 cm samples with a band-saw (note there was a loss of approximately 2 mm between each sample due to the band-saw blade action). This ice segment was not cut across the middle of the core, so the distances across core are corrected to their radial positions. These samples were not cleaned with a microtome due to the small sample width and the low potential for MSA contamination under laboratory conditions.
Table 1 Core section locations and sampling details

The samples were analyzed using a DX500 microbore (2 mm) ion chromatograph according to the method of Reference Curran and PalmerCurran and Palmer (2001).
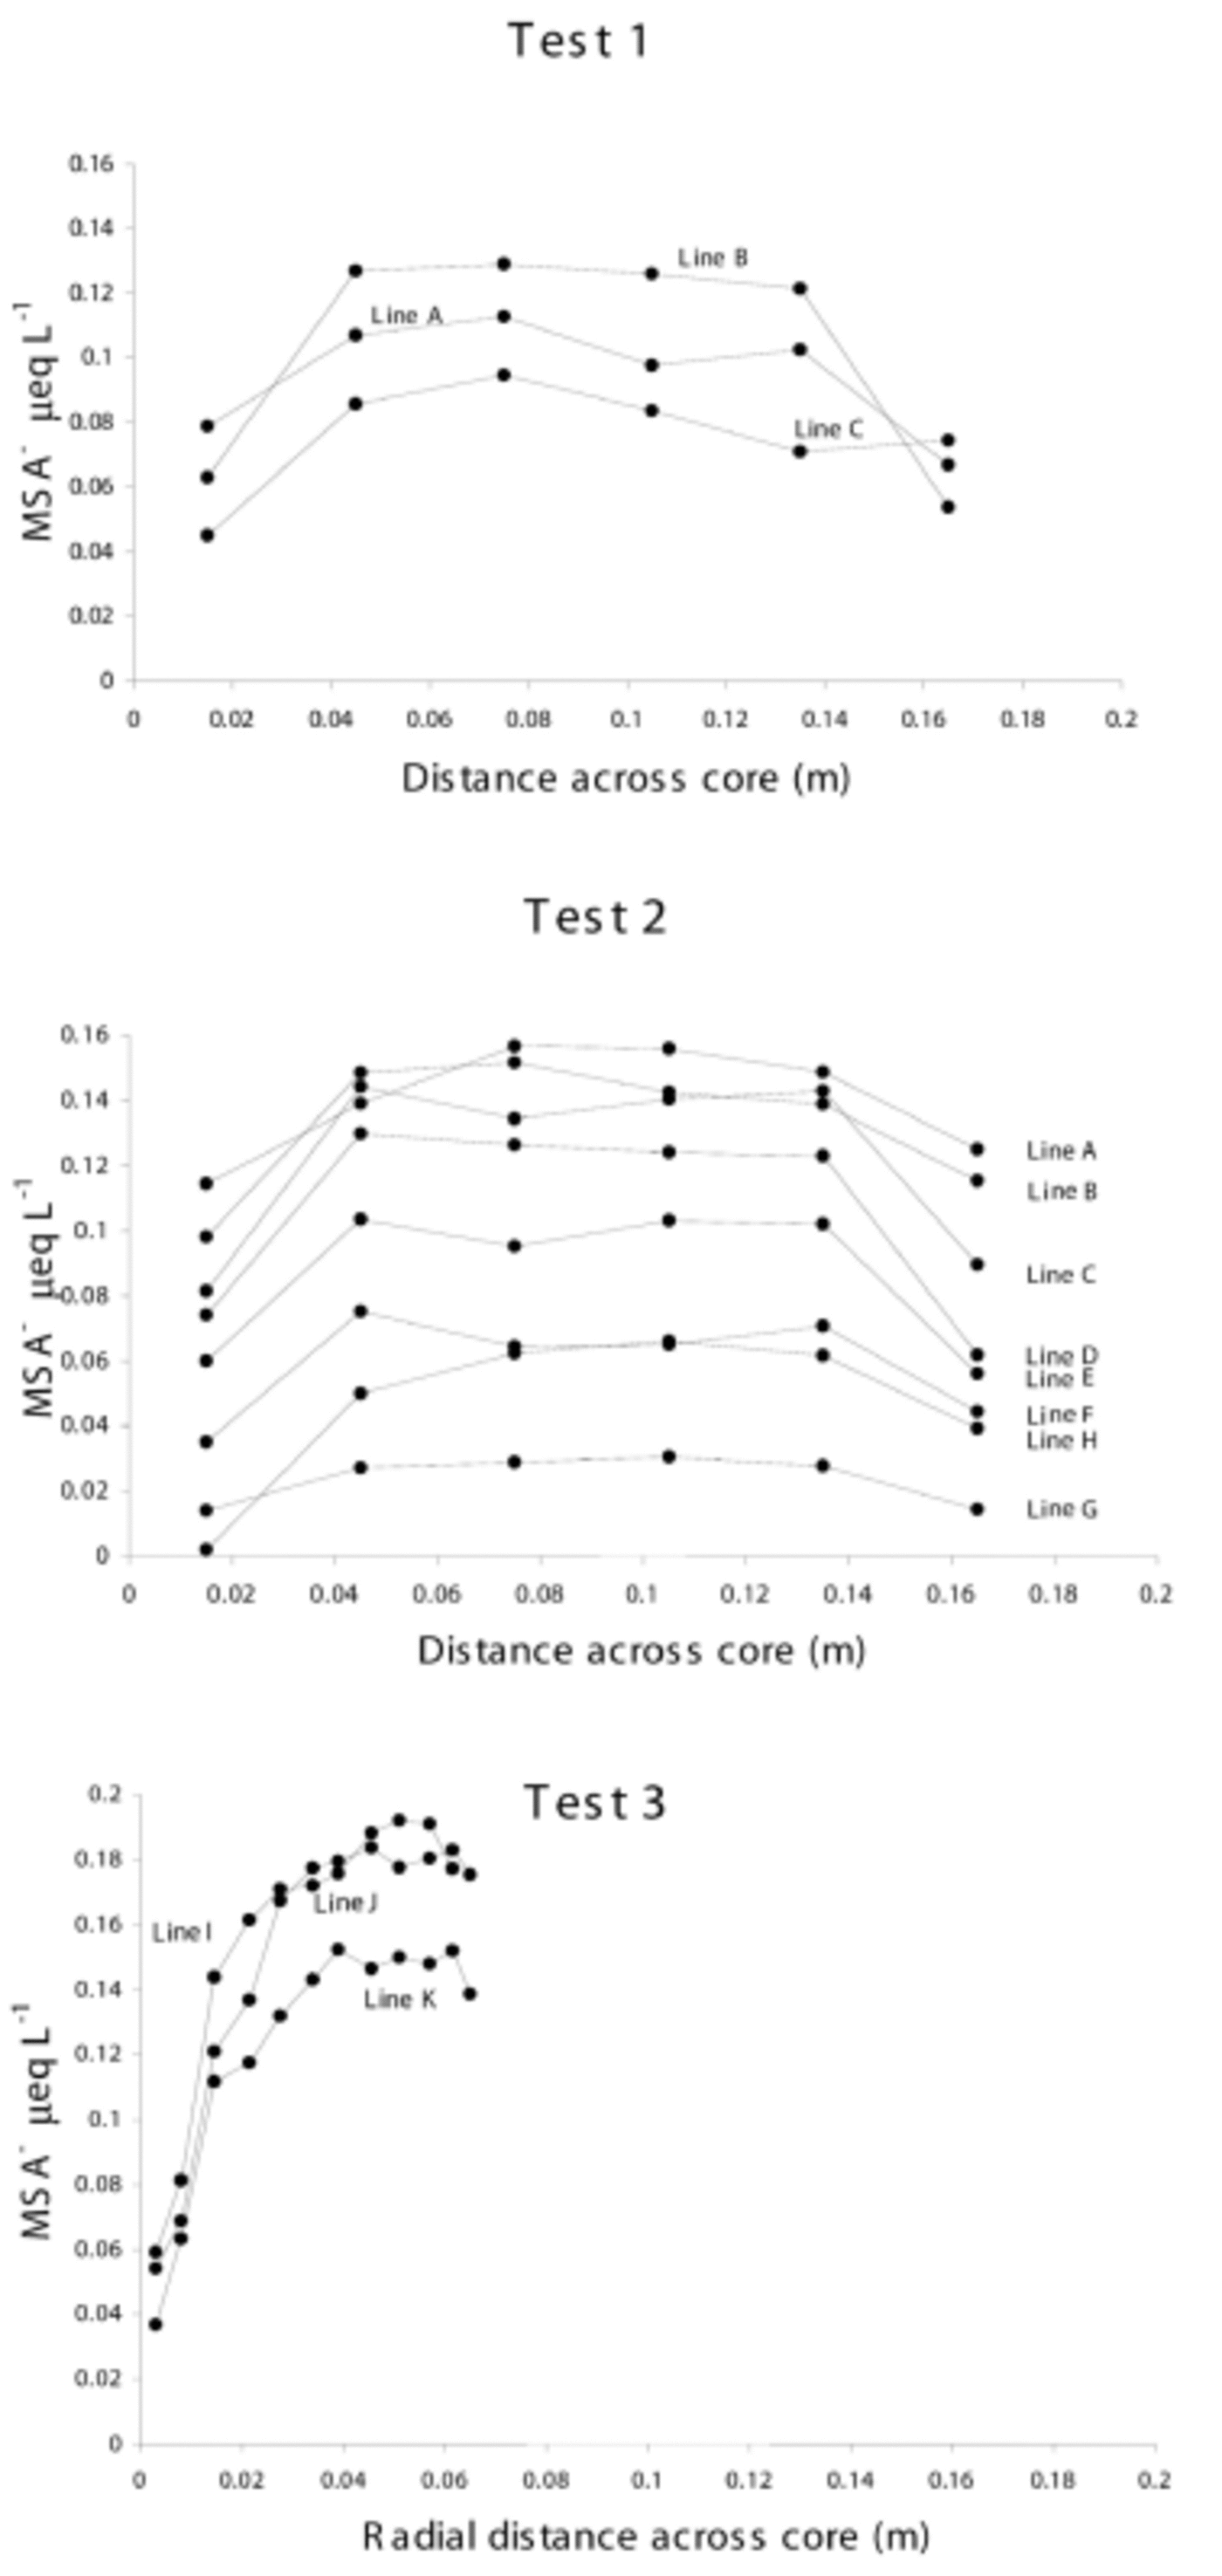
The results from tests 1–3 are provided in Figure 2, showing MSA distribution across the core widths. Each point represents the mid-sample position. The relative difference between line positions is caused by seasonal variation.

Fig. 2. MSA concentrations across core widths from tests 1–3. All samples are plotted with their mid-sample positions, and the core width axis denotes distance from original core edge to sampled core edge. The relative vertical positions of lines are due to seasonal variation.
Test 1
Lines A–C follow similar symmetrical patterns across the core width, with relatively uniform MSA concentrations through the core centre. However, in the outer 3 cm, MSA levels decrease to approximately 48% of their internal values (except for the last sample in line C which is not a typical result when compared with the other tests).
Test 2
Lines A–H follow the same symmetric pattern observed in test 1; each line has a relatively stable centre, and decreases at either core edge. In this test, there is an average depletion at the core edge of 42% of the central values.
Test 3
This core section represents only one side of the core and does not reach the true centre of the original core, but the results follow the MSA distribution pattern observed in tests 1 and 2 over the outer 3 cm. The average depletion was 29% of the central values.
Discussion and Conclusions
The distribution of MSA across the widths of the stored ice cores has been shown to follow a consistent pattern of depletion towards the core edges. This apparent alteration of the MSA distribution is interpreted here as occurring during the lengthy storage period, but the possibility of alteration during the drilling process needs to be eliminated, given that the core was thermally drilled. The thermal drilling action would have created a thin layer of liquid around the core during the drilling process, which would have dissolved some of the compounds in direct contact with it. This effect is not expected to have penetrated into the core, however, and is not considered to have been the cause of MSA depletion over the outer 3 cm of core (although it cannot be completely ruled out at this stage). Reference Legrand, Feniet-Saigne, Saltzman and GermainLegrand and others (1992) compared two different methods of solid ice-core cleaning: progressive wash-melting with ultra-pure water and mechanical scraping. The wash-melting procedure showed MSA concentrations reduce towards the centre of the core, yet the results from scraping did not show the same pattern. They concluded that the ultra-pure water used to melt the samples had in some way contaminated the outer core. Reference PasteurPasteur (1996) suggests this phenomenon is due to MSA solubility. In contrast, Reference Legrand, Feniet-Saigne, Saltzman and GermainLegrand and others (1992) observed no trend in a scraped core. The graph they present, however, does indicate a trend of MSA loss towards the core edge, consistent with the findings of this study. Another factor discussed but not explored is the variance in storage temperature between the cores used in their tests; some stored at –15˚C and some at –3˚C. Storage temperature undoubtedly plays an important role in MSA diffusion, as noted by Reference PasteurPasteur (1996), but is yet to be clarified.
The core used in this study was originally 20 cm wide, but 2 cm was removed during the initial sampling phase, leaving 18 cm of core to be stored for 14.5 years. The lack of full core diameter has proved useful in assessing the influence of thermal drilling: tests 1 and 2 show approximate symmetry in MSA distribution across the 18 cm width despite the fact that the furthest sample in each line (sample 6) represents the edge that was not in contact with the thermal drilling action. If MSA edge-loss had been caused by the drilling method alone, the concentration at 18 cm would not be expected to be the same as at the actual core edges, but would instead be somewhat higher. The symmetry observed in this study therefore indicates that MSA movement has occurred during the storage period. This symmetry also suggests that core orientation during storage is not a factor, i.e. gravity has not contributed to the movement mechanism.
The observed MSA edge-losses indicate diffusive loss to the atmosphere (although it is possible that the effect is related to other processes such as inward diffusion of a species that destroys MSA). In order to see whether the pattern of loss is consistent with diffusion, and to estimate the diffusion coefficient, D, the diffusive process for a simplified ice core has been modelled.
It is assumed that the ice core has an initial MSA concentration that is uniform across its cross-section and the concentration gradients are ignored in the vertical direction (i.e. along the core axis).
For this geometry, the diffusion equation
with concentration C(r, t) as a function of radius, r, and time, t, may be written as
The initial condition of uniform concentration is added to the boundary condition that the concentration is zero on the outer edge (which is in contact with the atmosphere) and the partial differential equation is solved. This gives C(r, t) as a series expansion:
Other symbols are as follows: R is the core radius, C0 is the initial concentration, J0 and J1 are Bessel functions of the first kind of order zero and one, respectively, and λn = βn/R, where βn denotes the nth zero of J0, i.e. solutions of J0(x) = 0, for x > 0.
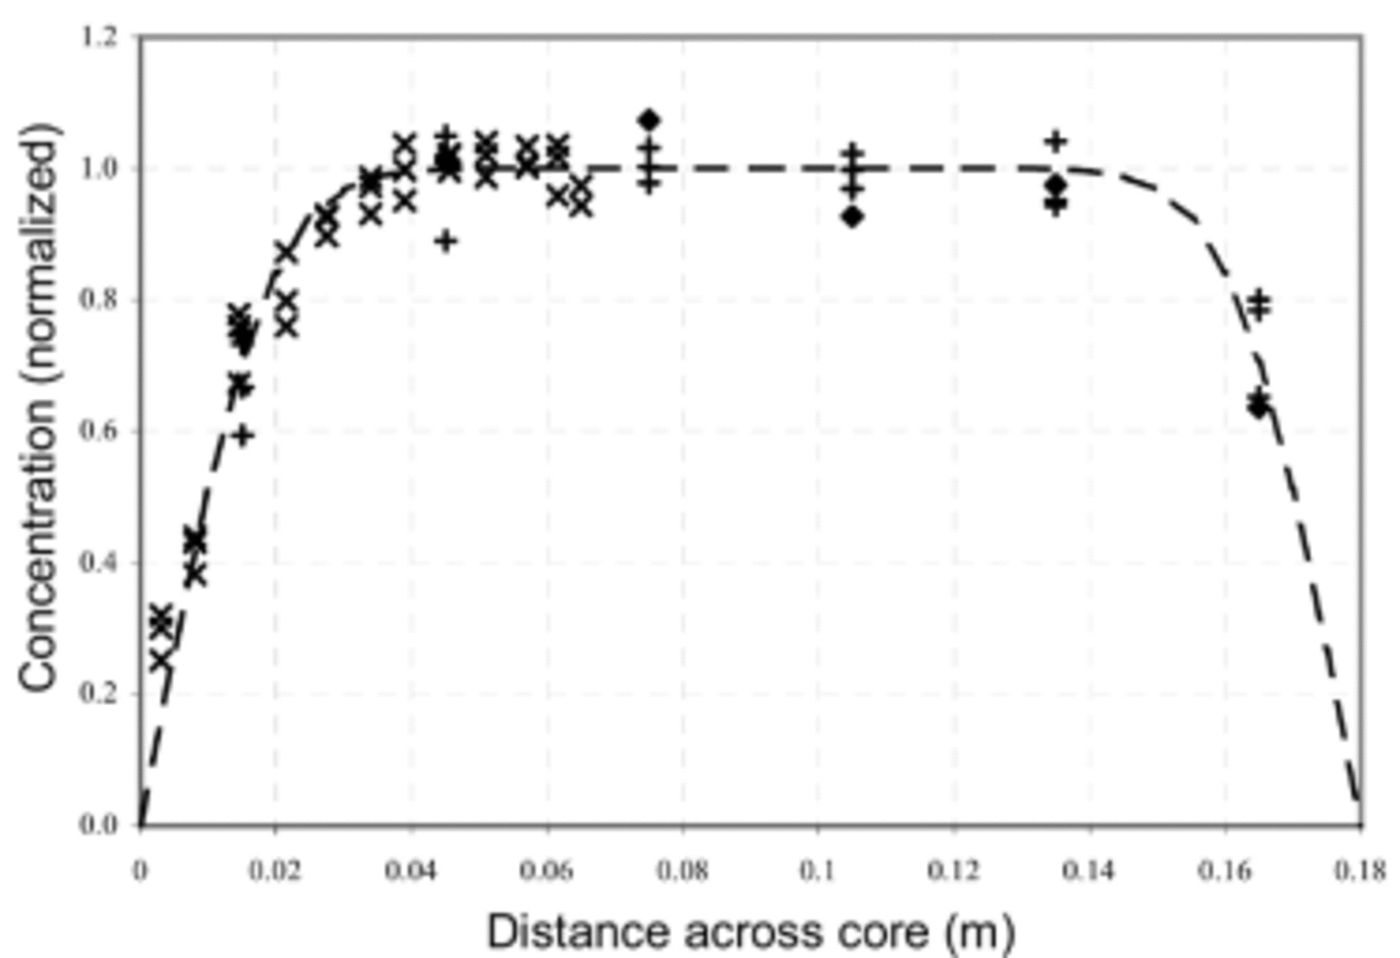
Figure 3 shows the measured concentration data together with C(r, t) for t = 14.5 years and with a diffusion coefficient, D = 2×10–13 m2 s–1. For this comparison, only lines which are close to the summer concentration maximum have been used. This selection was made for two reasons: firstly, the lower MSA concentrations are more subject to analytical noise, and secondly, the model assumption that ignores axial diffusion breaks down where strong axial gradients in MSA are present. Inspection of the seasonal variation between the lines (Fig. 2) shows that gradients are indeed smallest near the lines chosen (test 1 line A; test 2 lines A–C; and test 3 lines I–K). The nominal separation between lines is around 3 cm, which is the approximate extent of diffusive movement at the core edges during the 14.5 years of storage. This observation justifies neglecting axial diffusion.

Fig. 3. A subset of the measured profiles of MSA concentration across the cores and the model solution (dashed curve) for t = 14.5 years and D = 2×10–13 m2 s–1. Symbols denote measured data as follows: ♦ for test 1 (line A), + for test 2 (lines A–C) and x for test 3 (lines I–K).
The observed diffusion coefficient of 2×10–13 m2 s–1 applies for a temperature range of –18 to –20˚C through the storage period. For comparison (Reference Wolff, Wolff and BalesWolff, 1996), this is more mobile than water molecules (2×10–15 m2 s–1 at –10˚C), HCl (10–17m2 s–1 at –20˚C) or HNO3 (10–14m2 s–1 at –15˚C) and somewhat less mobile than HF (2×10–12 m2 s–1 at Summit Greenland, ~–30˚C).
This quantification of the diffusion of MSA in solid ice has implications for the preservation of seasonality deeper in the core. From the observed mobility, we would expect diffusive movement in the vertical direction to eventually obliterate the observed seasonality. At Law Dome, however, where the summer–winter separation is ~35 cm ice, this process would require centuries to millennia to smooth away seasonality completely. At present, there are no measurements with sufficient age and resolution to confirm this.
There is the observation, however, that the MSA signal does not show temporal smoothing even on short distance scales, and even after a few hundred years. This fits with studies of movement of MSA within firn (Reference Wolff, Wolff and BalesWolff, 1996; Reference CurranCurran and others, 2002) which show that although MSA moves, it is not diffusive in character, but appears to concentrate MSA in higher sea-salt layers, typically in winter, or at least autumn and spring. MSA, while mobile, is influenced by the concentrations and gradients of other species, producing the limited vertical motion and unexplained relocation discussed in the literature.
Reference Mulvaney, Pasteur, Peel and SaltzmanMulvaney and others (1992) and Reference Pasteur and MulvaneyPasteur and Mulvaney (2000) rule out simple diffusion driven by a concentration gradient and point out that a eutectic mixture containing MSA, which is highly soluble, can remain liquid to temperatures of –70˚C. They postulate therefore that the mechanism for MSA movement is most likely to be in liquid phase along grain boundaries, driven by gravity or capillary pressure. They go on to suggest that vapour-phase transport is another possible mechanism based on their studies in firn core. Vapour-phase diffusion can be discounted in this investigation because the ice was taken from below the bubble close-off depth where there is no air movement. Also, gravity-driven transport can be discounted because of the symmetry observed in the core-edge loss regardless of core orientation during storage. This leaves capillary pressure in liquid at grain boundaries as a possible driving mechanism (and agrees with the proposed mechanism of Reference Mulvaney, Pasteur, Peel and SaltzmanMulvaney and others (1992)).
Other trace-ion species were analyzed during this investigation, including the cations sulphate, sodium, magnesium and calcium (not shown here). Sulphate and other species levels did not alter significantly across the core widths in this investigation. The horizontal MSA diffusion discussed here is therefore considered to be unrelated to the distribution of the other species.
The ramifications of MSA movement through ice during storage are important with respect to sampling procedures and data interpretation. Generally, chemistry samples are taken from the mid-core area. This study shows that for MSA in particular the central section of the core does contain the best-preserved fraction, but it also demonstrates that consistency is required in the sampling procedure; deviation from the centre could skew the results by a factor of 2 or more. It also implies that samples cut from near the ends of cores that have been in lengthy storage should be treated with caution or discarded, and that samples prepared for analysis and left in storage for any length of time could be affected by MSA diffusion.
The diffusion coefficient calculated in this investigation indicates that core width, sample size and storage duration need to be considered in any sampling strategy where MSA analysis is required.
Acknowledgement
N. Petrie is thanked for laboratory support.


