Introduction
The nitrate (NO3 –) record in polar ice cores is expected to contain information about past atmospheric concentrations of nitrogen oxides (NO x = NO + NO2) due to the close link between NO3 – and NO x . the increase in atmospheric NO x concentrations in the Northern Hemisphere caused by rising fossil-fuel combustion since approximately 1940, for example, is reflected in higher NO3 – concentrations in Greenland snow (Reference Neftel, Beer and FinkelNeftel and others, 1985). However, past studies have shown that factors other than atmospheric NO x concentrations also influence NO3 – records (Reference Wolff and DelmasWolff,1995). In Greenland as well as in Antarctica, reversible deposition of NO3 – and net losses in the top snow layers have been observed. It has been suggested that either re-evaporation of nitric acid (HNO3) (Reference Dibb, Talbot, Munger, Jacob and Fan.Dibb and others, 1998; Reference Mulvaney and WolffMulvaney and others, 1998; Reference Röthlisberger, Hutterli, Sommer and MulvaneyRöthlisberger and others, 2000a) or photolysis of NO3 – in the top few centimetres of the snowpack (Reference Honrath, Guo, Peterson, Dziobak and Arsenault.Honrath and others, 2000; Reference JonesJones and others, 2000) causes such post-depositional alterations.
In earlier studies, relationships between NO3 – and accumulation rate have been proposed (Reference HerronHerron, 1982; Reference Legrand and KirchnerLegrand and Kirchner, 1990; Reference YangYang and others, 1995), with generally higher accumulation rates associated with lower NO3 – concentrations and higher NO3 – depositional fluxes. In a more recent study based on a macroscopic deposition model, Reference Fischer and KipfstuhlFischer and others (1998) found a second-order polynomial dependence of average firn concentration and inverse snow accumulation.
Based on a compilation of NO3 – data from more than 50 Antarctic sites covering various temperature and accumulation regimes, it has recently been suggested that temperature is also a key parameter in defining NO3 – concentrations in Antarctic snow and ice, with lower temperatures leading to higher NO3 – concentrations preserved in the snow (Reference Röthlisberger, Hutterli, Sommer and MulvaneyRöthlisberger and others, 2000a). Elevation has also been linked to NO3 – concentrations, for both Greenland and Antarctica (Reference Mulvaney and WolffMulvaney and Wolff, 1994; Reference Yang, Mayewski, Linder, Whitlow and TwicklerYang and others, 1996), but no statistically significant relationship has been found in a more recent study (Reference Kreutz and Mayewski.Kreutz and Mayewski, 1999). the inherent connection between temperature, accumulation rate and elevation makes it difficult to distinguish between the separate effects, and no firm conclusions about their relative importance have yet been reached.
Here, we provide a detailed description of the processes involved in NO3 – re-emission and a discussion of how temperature and accumulation rate affect those processes. In analogy to the compilation of NO3 – data from Antarctic sites, NO3 – data from many Greenland sites have been gathered in order to illustrate the effect of temperature. Also, we outline how calcium (Ca2+) can inhibit NO3 – re-emission.
Another aspect that has been discussed lately is the effect on NO3 – concentrations of snow layers containing large amounts of sulphuric acid (H2SO4) of volcanic origin. Most studies focused on a few well-known volcanic eruptions during the Holocene which showed post-depositional displacement of NO3 – away from the H2SO4 peak. This behaviour has been found in single events in Greenland and Antarctica (Reference Legrand and KirchnerLegrand and Kirchner, 1990; Reference ClausenClausen and others, 1997; Reference Röthlisberger, Hutterli, Sommer and MulvaneyRöthlisberger and others, 2000a). However, the mechanisms leading to this effect are only vaguely understood, and hypotheses have not been tested on a large number of cases, because of a lack of sufficient high-resolution data.
In this paper, new high-resolution data from the NorthGRIP (North Greenland Ice Core Project) ice core are used to investigate in more detail the effect of volcanic H2SO4 on NO3 –. Volcanic events from the early Holocene, the Last Glacial Maximum (LGM) and some earlier glacial periods are compared and a hypothesis of the mechanism is given.
Data
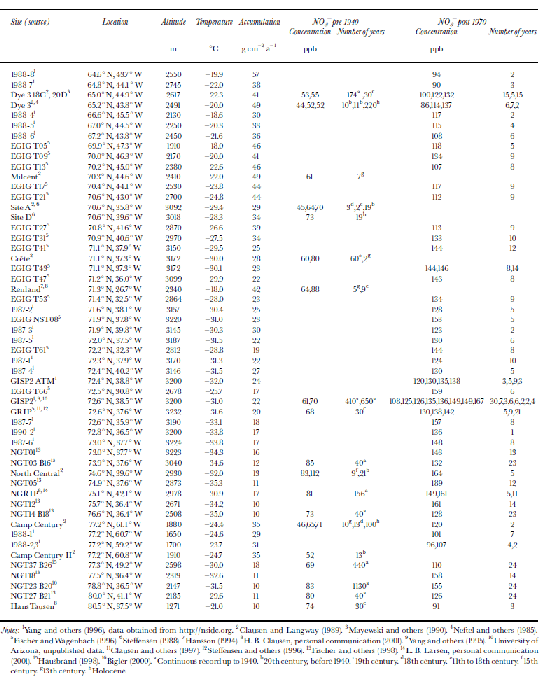
Many of the NO3 – data used in this paper are compiled from earlier studies (see Table 1 for sources). Furthermore, data from selected sections of the NorthGRIP ice core (75.1˚N, 42.05˚W; 2978ma.s.l.) are presented. These sections were analyzed during the NorthGRIP 2000 field season with a continuous flow analysis (CFA) system, as described in Reference RöthlisbergerRöthlisberger and others (2000b). Among other compounds, nitrate (NO3 –), sulphate (SO4 2–) and calcium (Ca2+) have been measured at a resolution of approximately 1cm.
Table 1. Temperature, accumulation rate and NO3 –concentration for Greenland locations used in this study
 Temperature and Accumulation Rate
In Figure 1, average NO3 – concentrations for different Greenland locations are indicated. In order to account for the anthropogenic increase in NO3 – concentrations in Greenland, the data have been split into two separate sets, one indicating concentrations from before 1940, which are unaffected by the anthropogenic emissions, and one from after 1970.The data and their sources are listed inTable 1. for both pre-1940 and post-1970, a decreasing trend in NO3 – concentration with increasing temperature is found (Fig. 2). A similar trend has been found in Antarctica (Reference Röthlisberger, Hutterli, Sommer and MulvaneyRöthlisberger and others, 2000a), where also generally higher concentrations are found at sites with lower temperatures, except for very low-accumulation sites (e.g. Dome C). At Dome C, the concentrations in the top few centimetres can be very high (up to 1000 ppb), but at greater depths, only 15 ppb are preserved, despite the low temperatures (annualmean temperature ≈ –54˚C).
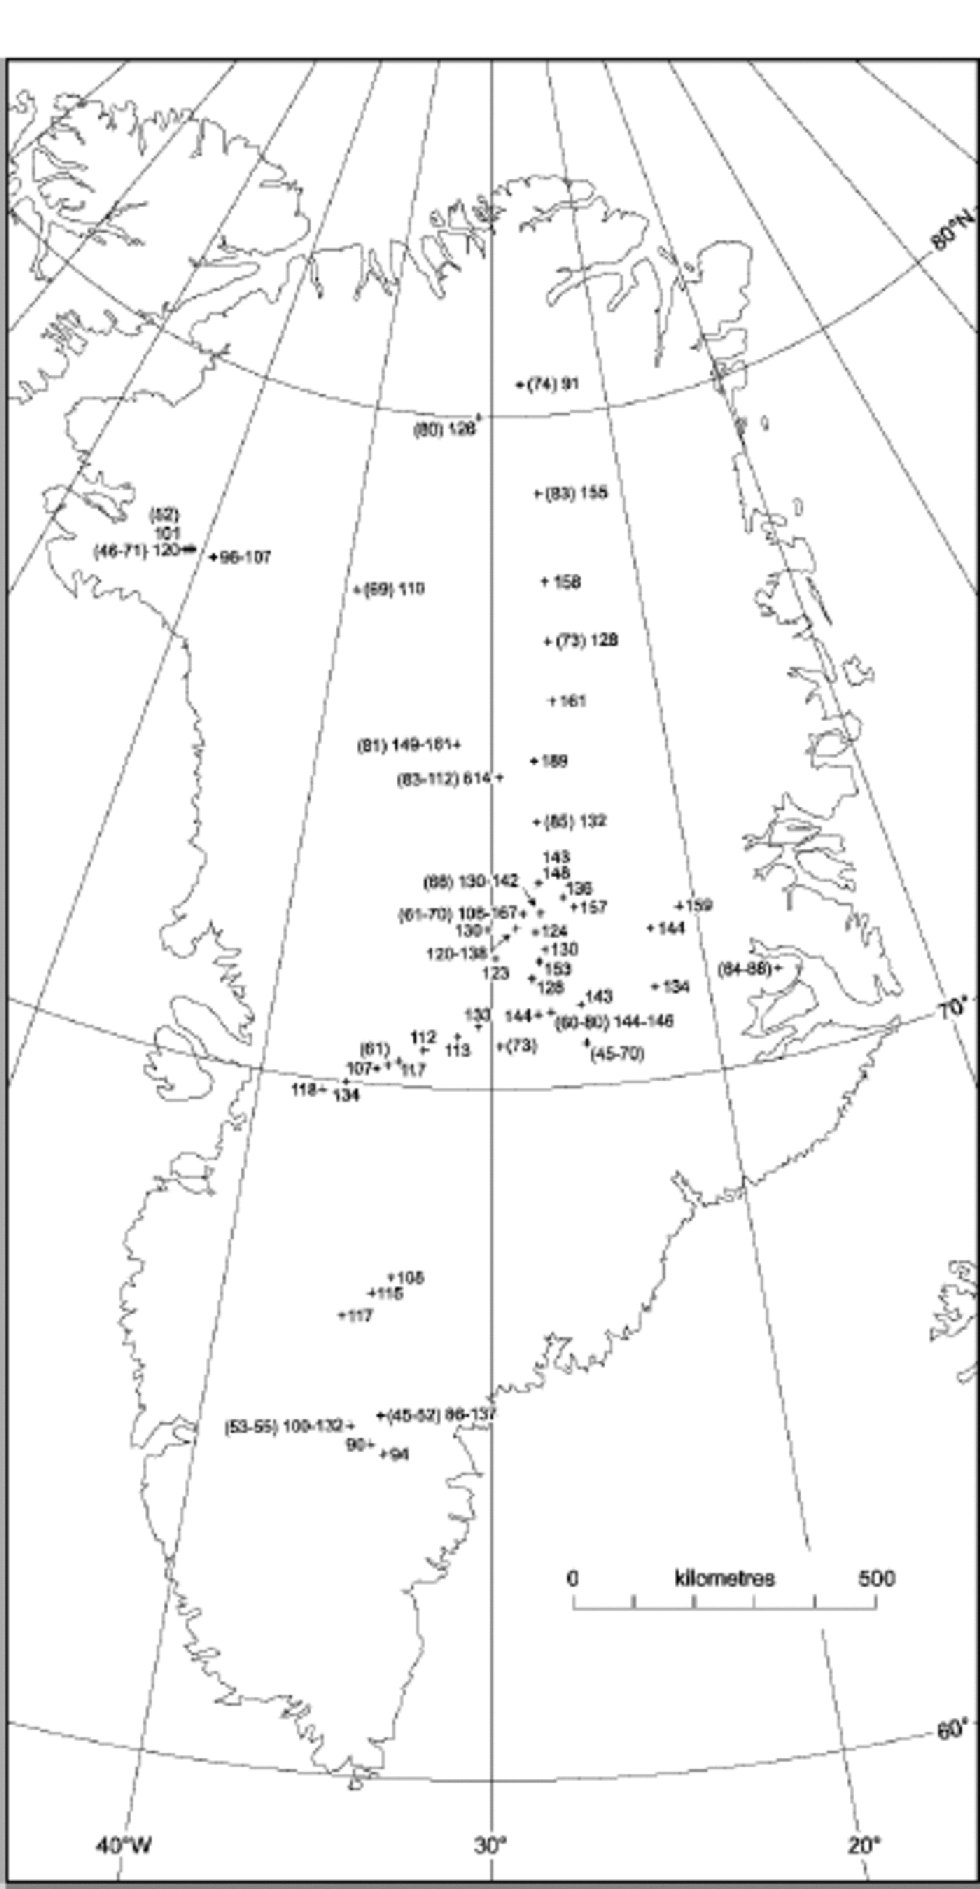
Fig. 1 Spatial distribution of NO3 – across Greenland. Concentrations in snow deposited before 1940 are shown in parentheses; the other values correspond to concentrations in snow deposited after 1970. All concentrations are in ppb.

Fig. 2 NO3 – concentrations vs average temperatures in Greenland and Antarctica with linear trends (triangles: post-1970; squares: pre-1940; solid lines: Greenland; dots and dashed line: Antarctica). the data points at temperatures below –52˚C correspond to sites with very low accumulation rates and are not used for the calculation of the linear fit shown.
When NO3 – concentrations are plotted against accumulation rate, higher NO3 – concentrations are found at sites with lower accumulation rates (Fig. 3), but again, NO3 – concentrations at very low-accumulation sites do not agree with the general trend. Considering the close relationship between temperature and accumulation rate (Fig. 4), it seems difficult to separate their effects on NO3 – concentrations. Only a detailed consideration of the underlying microphysical processes allows for assigning a temperature or accumulation-rate dependence.
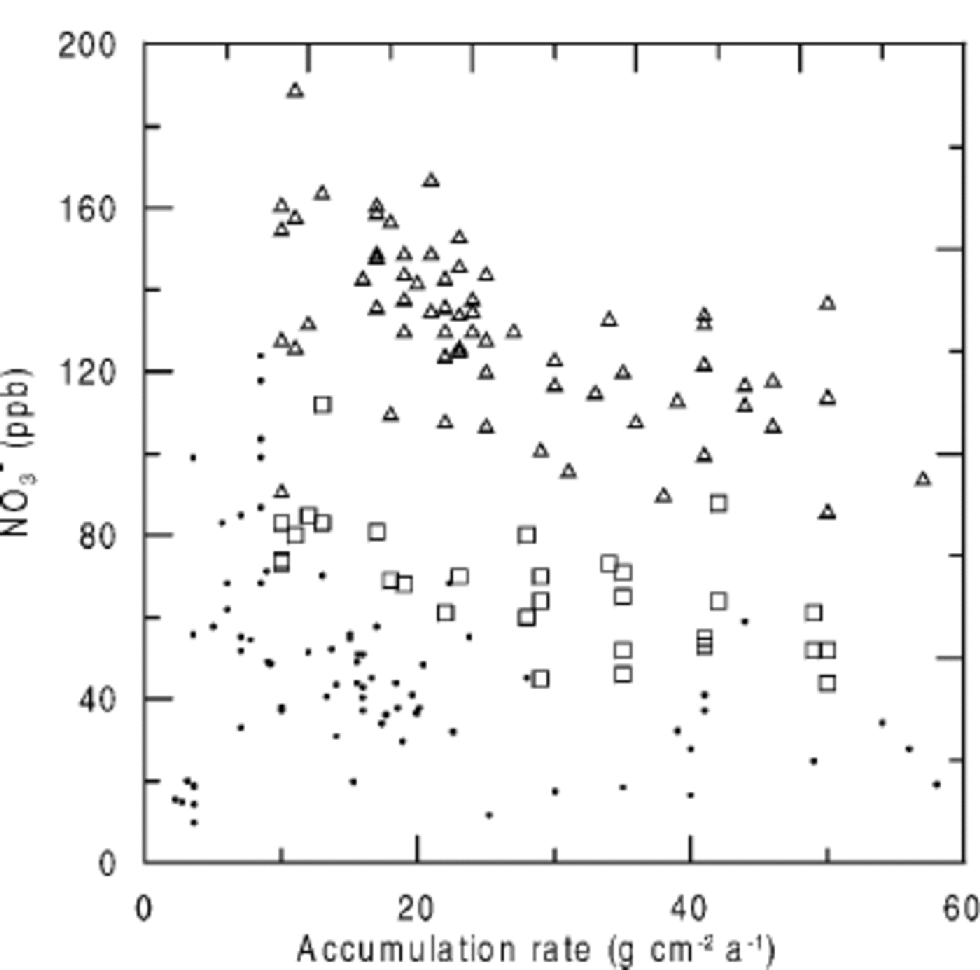
Fig. 3 NO3 – concentrations vs accumulation rate in Greenland and Antarctica (triangles: post-1970; squares: pre-1940; dots: Antarctica).
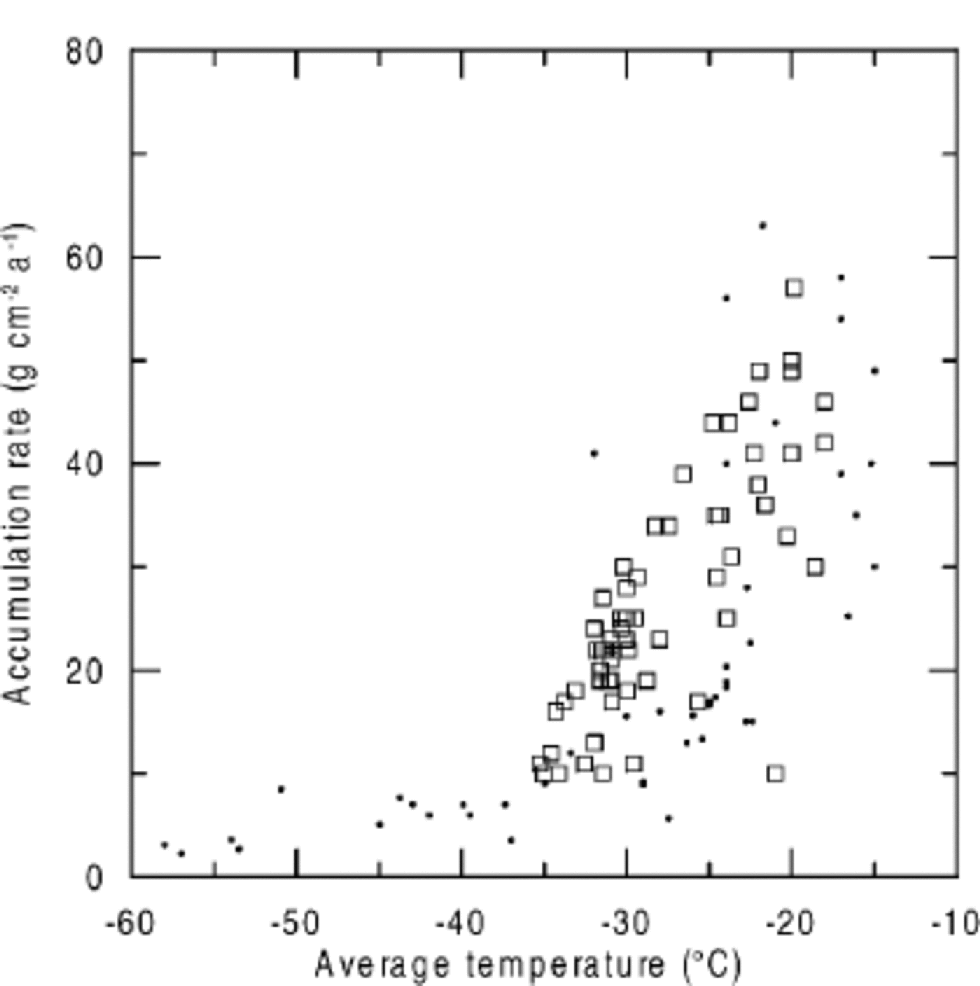
Fig. 4 Accumulation rate vs average temperatures in Greenland and Antarctica (squares: Greenland; dots: Antarctica).
In the following discussion, we analyze the temperature and accumulation-rate dependence of processes involved in NO3 – deposition and re-emission, aiming for a better understanding of:
the cause of the relationship between NO3 – concentrations and mean annual temperature and accumulation rate at a site
the generally higher NO3 – levels in summer snow than in winter snow
the net loss of NO3 – from snow after deposition.
NO3 – can either be predominantly incorporated in the bulk or be adsorbed to the surface of a snow crystal, depending on the deposition pathway. In a cloud with a liquid-water content of >0.01 gm–3 and pH >1, HNO3 would be completely dissolved in water droplets due to its high solubility, leaving virtually no HNO3 in the gas phase (Reference Seinfeld and Pandis.Seinfeld and Pandis, 1998). Thus, in the case of liquid or mixed clouds, essentially all HNO3 is removed from the gas phase independent of the cloud temperature. While there is no specific information about the conditions at cloud level, typical liquid-water contents of 0.1 gm–3 and initial HNO3 concentrations of 20 pptv in the air would lead to NO3 – concentrations of approximately 350 ppbw in fresh snow. on the other hand, the co-condensation of HNO3 and water (H2O) molecules on ice crystals (Reference Thibert and DominéThibert and Dominé, 1998) would lead to a bulk concentration of 20 ppbw only. In the absence of liquid water, i.e. in ice clouds, the high NO3 – concentrations found in surface snow could not be explained. However, Reference AbbattAbbatt (1997) observed a temperature dependence of adsorption of HNO3 on ice surfaces with higher uptake at lower temperatures. for typical summer temperatures at South Pole (246K; data obtained from http://www.cmdl.noaa.gov), the uptake capacity on fresh snow crystals exceeds the amount of HNO3 available in the cloud, implying that at very cold temperatures where ice clouds predominate, essentially all HNO3 in a cloud is bound to the surface of the snow crystal. While co-condensation, riming and adsorption of HNO3 determine the distribution of NO3 – within the ice crystal, its concentration is defined by the initial atmospheric concentration of HNO3 and the amount of condensed water in the cloud. An imprint of temperature is expected for surface uptake and co-condensation, but not for the HNO3 taken up in liquid cloud droplets. Based on the results of Reference AbbattAbbatt (1997), the snow crystals are expected to efficiently scavenge atmospheric HNO3 on their way to the surface, potentially further increasing the NO3 – concentration of the fresh snow.
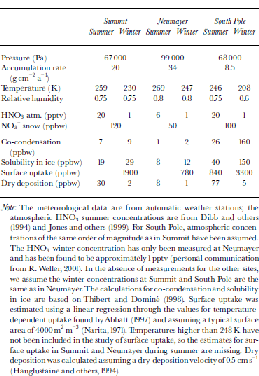
Note: the meteorological data are from automatic weather stations; the atmospheric HNO3 summer concentrations are from Reference Dibb, Talbot and Bergin.Dibb and others (1994) and Reference JonesJones and others (1999). for South Pole, atmospheric concentrations of the same order of magnitude as in Summit have been assumed. the HNO3 winter concentration has only been measured at Neumayer and has been found to be approximately 1 pptv (personal communication from R. Weller, 2001). In the absence of measurements for the other sites, we assume the winter concentrations at Summit and South Pole are the same as in Neumayer. the calculations for co-condensation and solubility in ice are based on Reference Thibert and DominéThibert and Dominé (1998). Surface uptake was estimated using a linear regression through the values for temperature-dependent uptake found byReference AbbattAbbatt (1997) and assuming a typical surface area of 4000 m2 m–3 (Reference NaritaNarita,1971). Temperatures higher than 248 K have not been included in the study of surface uptake, so the estimates for surface uptake in Summit and Neumayer during summer are missing. Dry deposition was calculated assuming a dry-deposition velocity of 0.5 cm s–1 (Reference Hauglustaine, Granier, Brasseur and MégieHauglustaine and others, 1994).
Once on the ground, the formation of surface hoar frost (co-condensation), rime (deposition of supercooled fog droplets) as well as dry deposition (adsorption of HNO3 onto the crystal’s surface) leads to additional NO3 – deposition to surface snow. for a given atmospheric HNO3 concentration, the hoar-frost NO3 – concentration is determined by the water-vapour concentration (Reference Thibert and DominéThibert and Dominé, 1998), which is mainly a function of temperature T. Assuming that the relative humidity at the site is similar throughout the year, the NO3 – concentration should depend linearly on 1/T in a first-order approach. However, assuming that the HNO3 concentrations in the atmosphere as in Table 2 are representative for the site, the estimated concentrations resulting from co-condensation are lower than observed surface snow concentrations, thus leading to dilution of the surface snow (Table 2). Rime deposition, on the other hand, which is likely to remove all HNO3 from the air, shows concentrations similar to those in fresh snow, provided that the atmospheric HNO3 concentration is similar to that at cloud level. A net dry deposition of HNO3 (adsorption of HNO3 onto snow crystals) has the potential to increase the NO3 – concentration in snow. However, it will only contribute where the surface is undersaturated, i.e. at very cold sites and during winter. the contribution in winter is small, due to low atmospheric HNO3 concentrations. During the summer, the contribution of dry deposition to the NO3 – concentrations in snow at South Pole might be considerable. However, according to Reference Hauglustaine, Granier, Brasseur and MégieHauglustaine and others, (1994), the dry-deposition velocity of 0.5 cm s– 1 for HNO3 on snow has to be considered as an upper limit. At sites with higher accumulation rates, a specific surface snow layer is buried more rapidly, leaving less time to adsorb additional HNO3 from the atmosphere, given that no saturation has been reached. Therefore, a tendency to higher concentrations at lower accumulation rates is expected.
Table 2. Estimates of NO3 – concentrations in snow due to different deposition mechanisms
Besides the diluting effect of co-deposition, processes capable of reducing the NO3 – concentration in snow are desorption of HNO3 from the snow crystal (Reference Dibb, Talbot, Munger, Jacob and Fan.Dibb and others, 1998; Reference Mulvaney and WolffMulvaney and others, 1998; Reference Röthlisberger, Hutterli, Sommer and MulvaneyRöthlisberger and others, 2000a) and photolysis (Reference Honrath, Guo, Peterson, Dziobak and Arsenault.Honrath and others, 2000; Reference JonesJones and others, 2000). In both cases, the NO3 – ion has to be at the surface of a snow crystal, since photolysis of NO3 – in the bulk is not effective (Reference Dubowski, Colussi and HoffmannDubowski and others, 2001). If a NO3 – ion recombines with a H+ ion to form HNO3 , it then may desorb into the firn air and eventually diffuse into the air above the snow. Diffusion of NO3 – in ice has been investigated by Reference Thibert and DominéThibert and Dominé (1998), who found that diffusion of NO3 – in ice is slower at colder temperatures, with the diffusion coefficient D given by D =1.37610–2610/ T cm2 s–1, with T being the temperature in K. During the summer, the typical time a NO3 – molecule needs to reach the ice surface (diffusion length of 40 mm, corresponding to an average crystal radius (Reference Harder, Warren and Covert.Harder and others, 1996)) is of the order of a couple of hours (e.g. Neumayer) to a few days (e.g. South Pole).
The solubility of NO3 – in ice has been determined for various temperatures (Reference Thibert and DominéThibert and Dominé, 1998). for summer conditions, not only the surface snow but also deeper layers are supersaturated with respect to the solubility of NO3 – in ice (Table 2). In the case of South Pole, the surface remains undersaturated, suggesting that NO3 – that is expelled from the bulk is simply transferred to the surface without affecting the NO3 – concentration. At warmer sites (e.g. Neumayer or Summit), the ice surface also might become supersaturated during the summer, leading to release of HNO3 from the snow into the interstitial air. from a thermodynamic point of view, warmer temperatures during the summer should facilitate the release of HNO3 from the ice surface. But according to the uptake experiment of Reference AbbattAbbatt (1997), only up to 25% of the HNO3 that has been taken up is released again afterwards. However, his study emphasized the uptake rather than the release of HNO3 , and a temperature dependence of the release has not been discussed. Once released from the snow crystal’s surface, the HNO3 molecule might make its way out of the snowpack, leading to a net loss of NO3 – in the snow. the molecular diffusion of HNO3 in the interstitial air is temperature-dependent as well, but probably this is not the limiting factor controlling the transfer out of the snowpack. It is conceivable that temperature-dependent, repeated adsorption and subsequent desorption of a HNO3 molecule on ice crystals will determine the removal from the snowpack.
Photolysis of NO3 – in the top snow layers results in the production of nitrogen dioxide (NO2) and hydroxyl radical (OH). NO2 is expected not to interact with the surrounding snow but to be mixed into the boundary layer rather quickly, leading to a NO3 – depletion in surface snow. the influence is presumably largest at low-accumulation sites, where surface snow is exposed to sunlight for a long time. Furthermore, photolysis should become more efficient at lower latitudes due to more incoming ultraviolet radiation. At Dome C, the top few centimetres of snow seem to reach saturated surface coverage (concentrations in the range of several hundred ppbw) (Reference RöthlisbergerRöthlisberger and others, 2000b). Deeper layers are then dramatically undersaturated considering surface coverage and solubility in the bulk. No quantitative estimate has yet been made of how much NO3 – can be lost by photolysis. It therefore remains unclear whether photolysis alone can account for the NO3 – profile seen in the snow at Dome C. the estimate of the maximum surface uptake relies very much on the surface area in snow and might change due to recrystallization, which has not yet been taken into account.
Although elevation may affect the atmospheric HNO3 concentration, there is no obvious mechanism by which it can have a direct physical influence on post-depositional processes. A minor influence is expected on the photolysis rate due to changes in the irradiance with altitude and on the gas-phase diffusion due to lower pressure, but both effects might only slightly modulate the changes in NO3 – concentrations.
Interactions of NO3 - With Dust
Recent studies have reported that NO3 – and Ca2+ concentrations are correlated in ice from the last glacial period fromVostok and Dome C, Antarctica (Reference Legrand, Wolff and WagenbachLegrand and others, 1999; Reference Röthlisberger, Hutterli, Sommer and MulvaneyRöthlisberger and others, 2000a). During the last glacial period, the Ca2+ deposited on the East Antarctic plateau is mainly of terrestrial origin and can thus be used as a proxy for dust. It has been suggested that the reaction of HNO3 and CaCO3 to form Ca(NO3)2 prevents NO3 – from being released from the snow into the gas phase.
In principle, the reaction could take place in the atmosphere or in the snow. for it to occur in the atmosphere, high dust concentrations would need to be in the same season as the maximum nitrate concentrations. A recent paper that studied the reaction of CaCO3 with HNO3 derived a formula for the lifetime for removal of HNO3 by dust (Reference Hanisch and CrowleyHanisch and Crowley, 2001). Based on this, and using very rough estimates for the surface area of dust (assuming spherical particles of 1 mmdiameter, a typical density of 2 g cm–3, and atmospheric dust concentrations of 10 ng m–3), we can estimate a HNO3 lifetime vs removal by dust in the present-day Antarctic atmosphere of around 50 days. This is unlikely to be important relative to other removal processes. However, this could be reduced to 2 days under the dustier conditions of the LGM, and in Greenland under LGM conditions one could estimate a lifetime for this removal of only a few hours. It seems possible therefore that under LGM conditions much of the atmospheric HNO3 could be converted to aerosol calcium nitrate in the atmosphere. In addition, the reaction to form Ca(NO3)2 might take place in the snow, in which case HNO3 has to make its way to the snow layer where the Ca2+ has been deposited and, if Ca2+ is inside the snow grain rather than on its surface, diffuse through it.
Influence of Volcanic H2SO4 on NO3–
As shown lately in an Antarctic high-resolution record from Dome C (Reference Röthlisberger, Hutterli, Sommer and MulvaneyRöthlisberger and others, 2000a), H2SO4 of volcanic origin can cause NO3 – to move in the ice. Several examples of very low NO3 – concentrations coinciding with H2SO4 peaks and increased NO3 – concentrations above and below this layer have been found in the Dome C as well as the NorthGRIP record (Fig. 5a). At Dome C, the effect is first seen at 12 m depth, where the deposits of the Tambora (Indonesia) eruption (AD 1815) are located. This indicates that the processes involved take place or at least start in the firn.
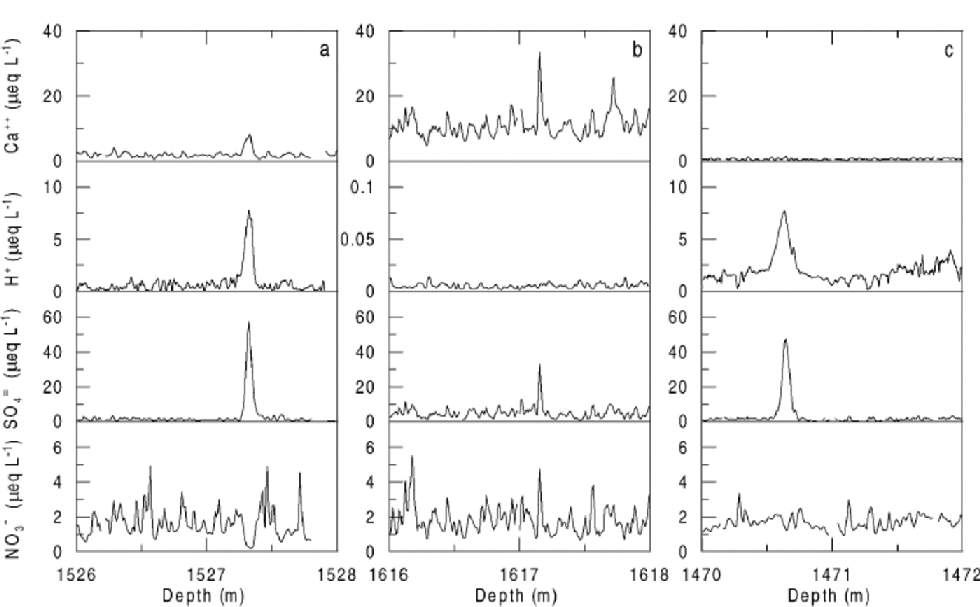
Fig. 5 Examples of the influence of volcanic H2SO4 on NO3 – in the NorthGRIP ice core. H+ concentrations have been inferred from electrical conductivity measurements on the solid ice. Due to very low H+ concentrations, the scale of the y axis had to be adjusted for the section shown in (b). of 28 events selected with SO4 2–concentrations exceeding 20 μeqL–14 showed a pattern similar to (a), 12 similar to (b), and 2 similar to (c). the data are shown against depth, as the absolute age is not critical to the illustration of the effect and an absolute time-scale is not yet available.
Our hypothesis of the mechanism for NO3
– displacement in the firn relies on processes similar to those described above, as it includes diffusion of HNO3 in the firn air.The high concentration of H2SO4 in a volcanic layer causes the equilibrium of ![]() to shift towards the righthand side, as a large amount of H+ from the H2SO4 is present. Therefore, a locally elevated concentration of HNO3 in the firn air is caused, which prompts gas-phase diffusion of the HNO3 away from the volcanic layer towards either side. In an adjacent layer with no excessive H2SO4, HNO3 favours dissociation into H+ and NO3
–, thus maintaining the gradient in the firn air by removing HNO3 from the gas phase. It is possible that the movement of NO3
– progresses via a different mechanism in the ice after pore close-off, possibly by diffusion of ions in the veins.
to shift towards the righthand side, as a large amount of H+ from the H2SO4 is present. Therefore, a locally elevated concentration of HNO3 in the firn air is caused, which prompts gas-phase diffusion of the HNO3 away from the volcanic layer towards either side. In an adjacent layer with no excessive H2SO4, HNO3 favours dissociation into H+ and NO3
–, thus maintaining the gradient in the firn air by removing HNO3 from the gas phase. It is possible that the movement of NO3
– progresses via a different mechanism in the ice after pore close-off, possibly by diffusion of ions in the veins.
Figure 5b shows an event where no NO3 – displacement occurred. In this section, large amounts of alkaline material are present in the ice, as seen by the high Ca2+ and negligible H+ concentrations. In the context of the above hypothesis, the high concentrations of alkaline material (presumably CaCO3) neutralize the H2SO4 and prevent the formation ofHNO3.The assumption that in this case H2SO4 undergoes some reactions is supported by the significantly narrower SO4 2– peak compared to the ones seen in acid ice (personal communication from P. Barnes, 2001).
Our hypothesis is challenged by the example shown in Figure 5c. Although much excess H2SO4 is present and far too little Ca2+ to compensate, no marked NO3 – displacement is seen. It is possible that the Ca2+ was unable to neutralize the H2SO4, but that it managed to bind NO3 –, thus preventing it from being transferred into the gas-phase. the occurrence of ice layers limiting HNO3 diffusion in the interstitial air is rather unlikely in NorthGRIP.
Conclusions
The spatial distribution of nitrate concentrations in Greenland is shown to be strongly related to site temperature, just as it is for Antarctica. Because temperature and snow-accumulation rate are so closely linked, we cannot determine which of these factors is the one exerting physical control on the concentrations seen. In either case, the relationship changes at the very lowest accumulation rates, where it is clear that post-depositional losses are the dominant control on the subsurface concentration.
By examining the individual processes that could contribute to the nitrate concentration in snow, we find that many of them are indeed temperature-dependent, with higher concentrations predicted at lower temperatures, as observed. Some processes could also depend on the accumulation rate, if a longer exposure time at the surface allows additional uptake. of the processes identified, either uptake by liquid droplets in cloud, if present, or uptake onto the ice surface in the cloud or after deposition can lead to concentrations in fresh snow that are as high as or higher than those observed. However, the role of surface uptake at higher temperatures, as encountered in coastal Antarctica and in Greenland in summer, needs to be quantified. Co-condensation of nitric acid and water, and dissolution of nitric acid within the ice lattice appear to give concentrations that are too low compared to those observed. This suggests tentatively that surface uptake and retention might be rather important in determining the concentrations we see. This process has a temperature dependence (approximately threefold greater uptake at –55˚C compared to –25˚C (Reference AbbattAbbatt,1997)) similar to that seen in Figure 2. However, according to Reference AbbattAbbatt (1997), the uptake is not dependent on the nitric acid concentration in air. the higher nitrate concentrations in post-1970 Greenland snow compared to pre-1940 snow suggest that the snow concentration is somehow related to atmospheric concentrations, and we suggest that this is simply a question of limited supply to the ice surface, because nitric acid is scavenged so efficiently. In that case, a temperature- and accumulation-rate-corrected Holocene nitrate ice-core record of a site with adequate snow-accumulation rate should reflect the flux of nitrate to the surface, which should in turn be related to atmospheric NO x input.
For sites with very low accumulation rate, losses, possibly due to photolysis, control the concentration seen in the Holocene in such a dominant way that it is unlikely that information about atmospheric nitrate or NO x can be extracted. Once the ice becomes less acidic (in the last glacial period), the concentration of nitrate seems to be strongly controlled by the calcium or dust content of the atmosphere, and the deposition processes might be significantly altered. the ratio of nitrate to dust might give clues to the past nitrate content of the atmosphere, although in this case it is probable that the nitrate uptake is determined by the content of the atmosphere over the whole transport route of dust from its source to the deposition site, and is not closely related to the local nitrate concentration at the ice-core site.
A number of laboratory and field experiments would help to test the above hypotheses. Laboratory uptake experiments, similar to those carried out at 248K and below (Reference AbbattAbbatt, 1997), are needed at higher temperatures, appropriate to summer temperatures at coastal Antarctic or Greenland sites. Laboratory experiments would also allow an assessment of whether photolysis can account for the magnitude of nitrate losses at low-accumulation sites. Field measurements of the nitric acid content of the atmosphere are lacking for most sites, and particularly for winter. Experiments that follow the evolution of concentration from fresh snow to depth in individual layers are also required.
In summary, the factors that control nitrate concentration in ice cores are complex, and interpretation is likely to involve different factors for different locations and time periods. However, if the factors controlling deposition and loss can be better understood, it may still be possible, in some cases, to reconstruct information about the important NO x cycle in the past.
Acknowledgements
This work was supported by a fellowship of the Swiss National Science Foundation. We thank H. B. Clausen and
L. B. Larsen for providing unpublished nitrate data. Thanks to NorthGRIP participants and supporters as well as its funding agencies.


