Background
Many of the most important properties of Antarctic sea id-are difficult to measure, particularly through the complete annual cycle and over the entire sea-ice zone. Some features, such as ice conceniration, can be observed to some extent in this comprehensive way via satellite, but many features, such as ice thickness, have only been observed by limited sampling from ships or short-term field programs on the park ice. The objective of the present modelling study is to provide a comprehensive, self-consistent set of derived features of the sea-ice region, through the annual cycle from a coupled atmosphere sea-ice model by matching the model results to the observations available as well as possible. This allows the observations of those features that are most readily observed to be used to reline the model parameters and narrow the uncertainties of the less-well-known features that may be more difficult to observe directly.
A large number of model runs have been carried out to obtain reasonable simulations of many of the present features of the sea-ice region in comparison with the still-limited observational data available. Such features include ice extent (the total sea-ice and water area with in the outer sea-ice boundary of < 15% ice conceniration). the sea-iee area and open-water fraction (cf. Fig. 1), the sea-ice thickness distribution (cf. Fig. 2), the depth of snow on the surface and the ice movement Some of the most important features that are not well known include the oceanic heat flux just below the sea ice, and the distribution of ice freezing within the open-water leads area relative to the freezing ai the base of the sea ice. Large numbers of sensitivity studies have been carried out to determine the "best fit" values of the more uncertain parameters. The model results obtained from using the best-tit parameters giving the closest matching to the observed features have then been used to derive a comprehensive range of other features from the model that are consistent in closures for mass, heat and salt, and that can be used for further comparisons with observations.
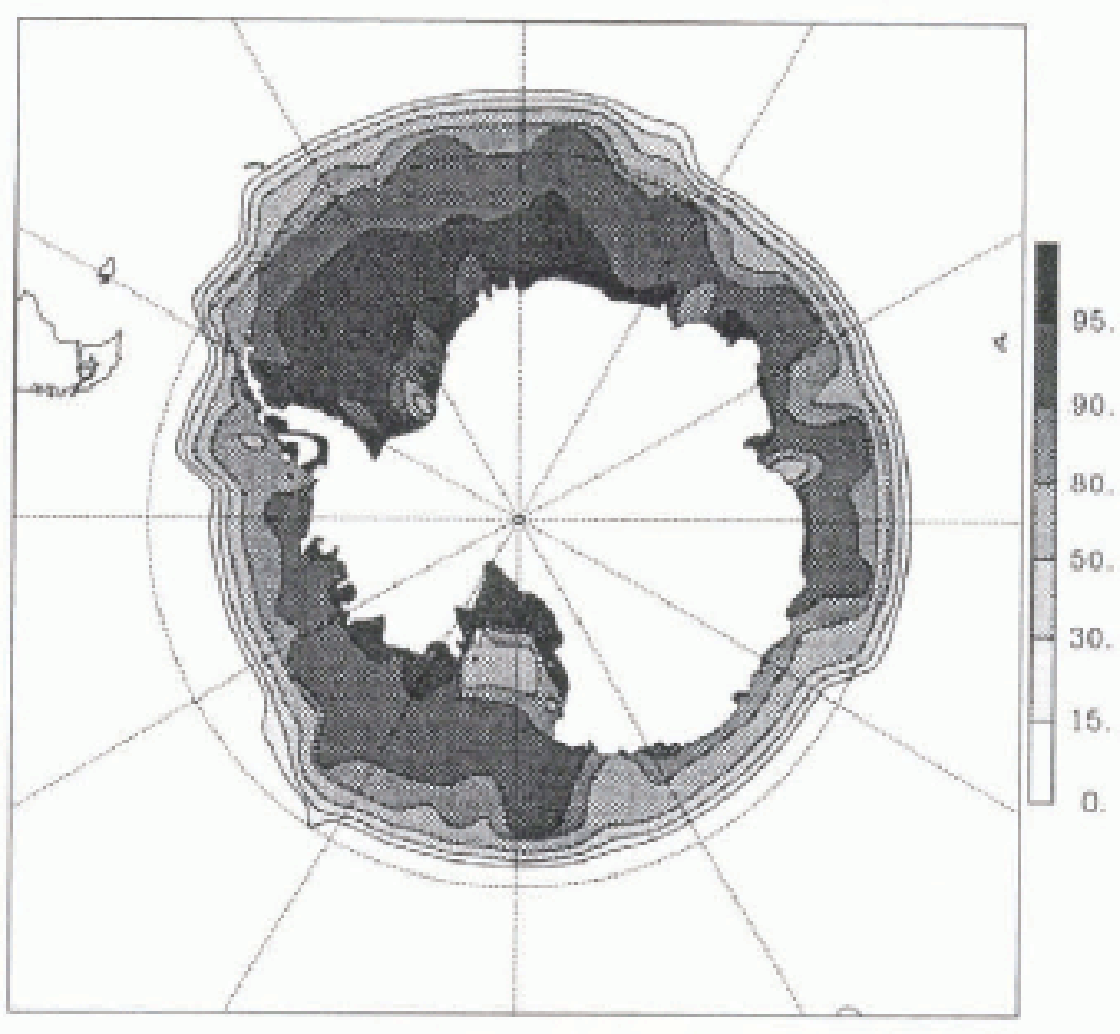
Fig. 1. The mean sea-ice concentration from the model for the period of maximum extent (near September). Contours are in 15, 30, 50, 80, 90 and 95%.
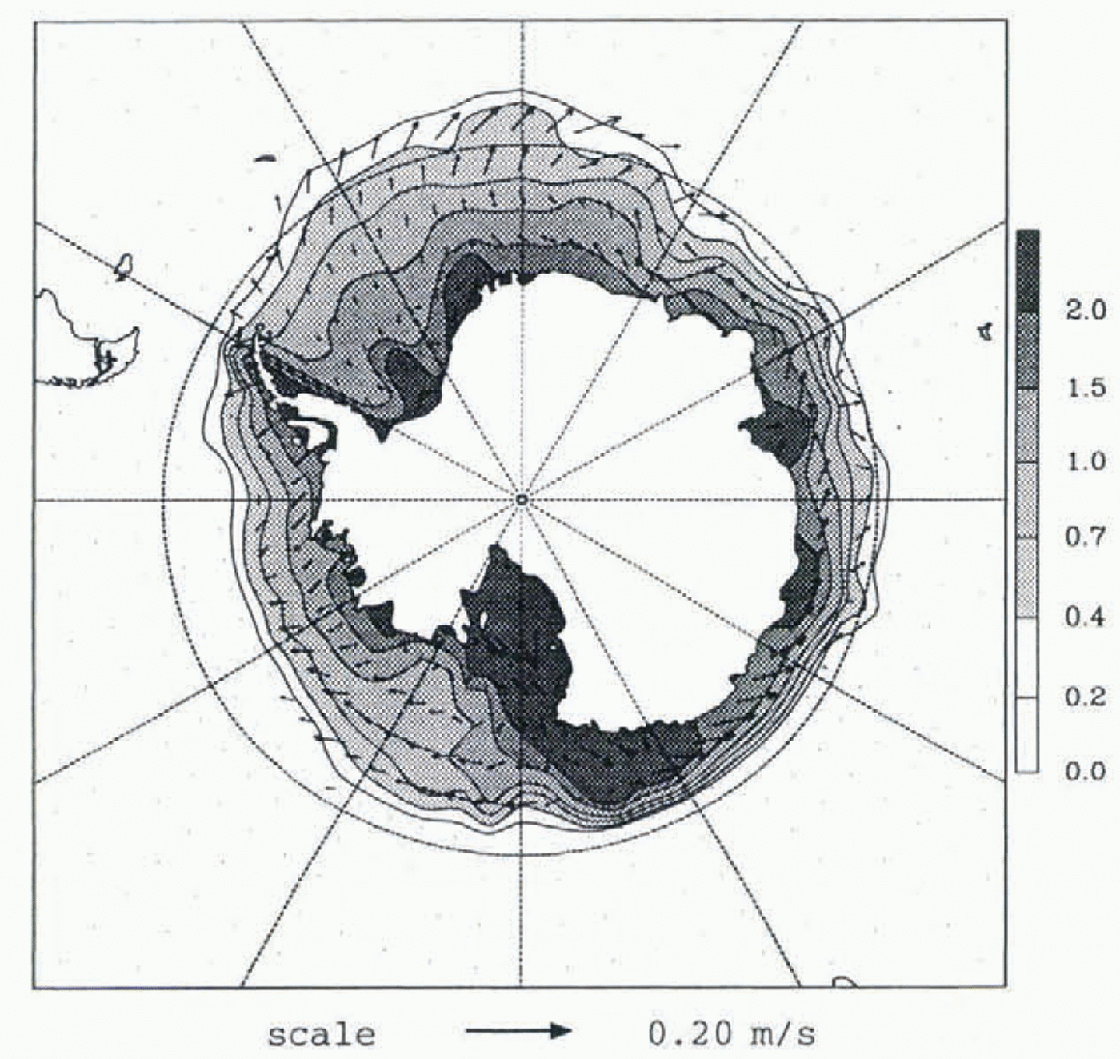
Fig. 2. The monthly mean sea-ice drift from the model is shown superimposed on the corresponding thickness field for the period of maximum ice extent. Ice-thickness contours are 0.2, 0.4, 0.7, 1.0, 1.5 and 2.0 m.
The advantages of using a prescribed surface ocean mixed layer for this study, rather than a fully dynamic ocean model, are that the ocean heal and water fluxes can be diagnosed from prescribed temperatures, salinities and ocean currents, based on observations combined with the computed surface fluxes from the model.
The aim of this paper is to summarise work in progress by Budd and associates, on derived physical characteristics of the Antarctic sea ice zone, that illustrates a wide range of the features and their variation through the annual cycle. Examples are given of the comprehensive output available, including plan maps, meridional sections, seasonal cycles, vertical profiles through ocean ice atmosphere, and net budget closure summaries. Highlights presented here include the numerical values and relative magnitudes of the various individual features of the sea ice and the heat and fresh-water fluxes through the year (as given in Table 1), the dependence of mean ice thickness on oceanic heat flux (in Table 2), the "self regulating" nature of the freezing and ice concentration through the feedback with sensible heat flux (in Table 3), and the variations of the dominant terms in the seasonal cycle of the heal and water fluxes (in Figs 6 and 7, to be discussed later). Complete results for the model variables are available in electronic form from the authors and a user-ready version is being made accessible via the World Wide Web site of the Antarctic CRC.
Table 1. Values from the model, averaged over the sea-ice extent, for a selection of parameters involved in the heat and water balances at different times of the rear and for the annual means, aver the areas of maximum and minimum ice extent. The * indicates values averaged over the ice-covered fraction only.
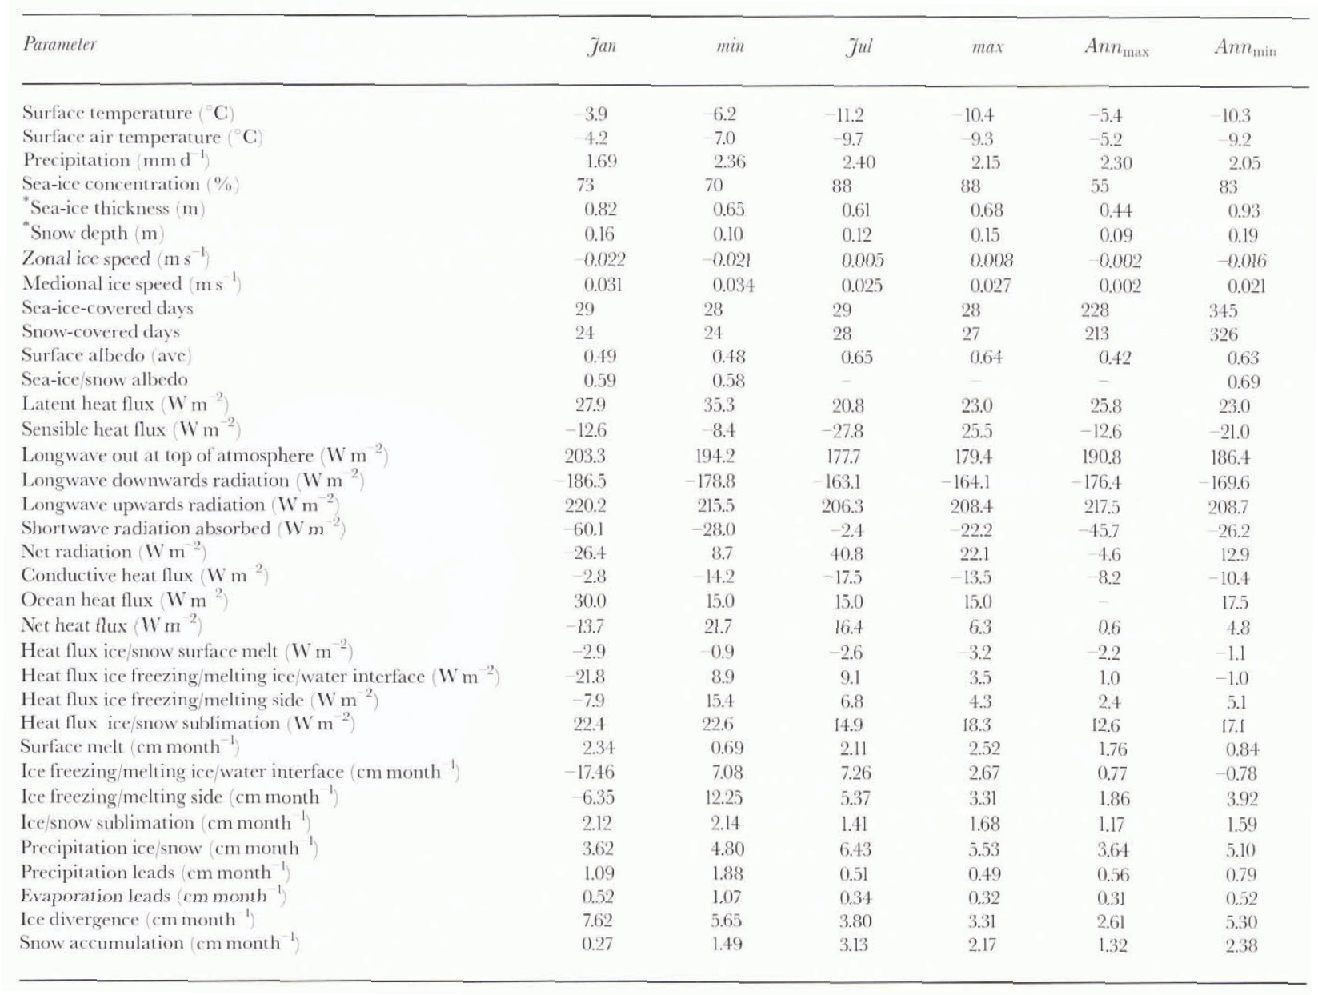
Table 2. Average Antarctic sea-ice thickness at maximum ice-extent dependent on mean oceanic heat flux

Table 3. Ice concentration, surface temperatures and turbulent heat fluxes

Atmosphere-Sea-Ice Model
The model used here is based on the scheme outlined by Reference BuddBudd and others (1991) whereby an atmospheric general circulation model (AGCM) is coupled to a dynamic-thermo-dynamic sea-ice model with a prescribed diagnostic ocean mixed-layer model. The atmospheric model is a spectral 21 (rhomboidal) wave number version with nine vertical sigma levels (pressure levels relative to the surface pressure . and has been described by Reference Simmondssimmonds (1985). Modifications of the model to treat subgrid-scalc sea ice and open water by separate and mixed heat-balance calculations have been described by (Reference Simmonds and BuddSimmonds and Budd 1990, Reference Simmonds and Budd1991). For this study, to preserve the climatology as closely as practicable to the present climate, the sea-surface temperatures (SSTs) outside the sea-ice region have been prescribed as their present seasonally varying climatological mean values, except for ocean points adjacent to the sea ice where heat-balance calculations, with a prescribed mixed-layer depth, determine whether or not ice forms or remains, as well as the ice fraction in the outermost gridcell. A prescribed seasonal climatological cloud distribution is also used to ensure a close match to observed radiation balances.
The coupled sea-ice model used, which is also run at R21 resolution, has been described in general terms by Reference BuddBudd and others (1991) and in detail by Reference WuWu (1993) and Reference Wu, Simmonds and BuddWu and others (1997). In general the model is similar to the cavitating fluid version of Reference Flato and HiblerFlato and Hibler (1990) with only the compressive stresses effective in the sea ice. In particular, in the present model, for low ice concentrations, the sea ice moves in free drill from wind forcing (at 2% of the wind speed and 25° to the left in the Southern Hemisphere) until the ice concentration fraction (fi) reaches a critical value (fi = fcri), at which stage the ice floes interact and further compaction is progressively resisted bv increasing thickness through rafting and ridging. At a maximum ice concentration (fi = fmax), increasing thickness retards the compression and conserves ice volume. For the results presented here the parameters have been set at fcri = 90% and fmax = 98%, for the southern Hemisphere.
Another novel feature of the model is the partitioning scheme for the two fractional parts of the total ice that freeze in the water column of the leads, and that then accumulate either on the base or on the sides of the ice floes. In brief this depends on the Open-water fraction (fw) and the ice thickness (h i). The physical principles involved in this scheme are based on the observations that the frazil ice formed from freezing in leads is distributed over some depth in the water column, but with concent rat ion decreasing with depth. The relative ocean currents move the frazil ice crystals horizontally as they settle upwards, giving a fraction of the total ice accumulating in the leads dependent on the open-water fraction and the ice thickness. It is also assumed that the ice accumulating in the leads accrues on the sides of the floes. The following relation has been found to represent this process in a reasonable way. The portion (Es) of the total heat (Qn) for freezing (or melting) that goes to the sides is given by:
where
![]() and hc
is a prescribed critical ice thickness.
and hc
is a prescribed critical ice thickness.
The corresponding portion for the base is:
Sensitivity studies have been carried out for hc, in the range of 0.05-1 m, and the results presented here are with hc = 1 m. Other features in the coupled atmosphere sea-ice model described by Reference Wu, Simmonds and BuddWu and others 1997 include prognostic precipitation, evaporation and snow depth. A scheme for "while ice" treats the formation of ice from snow when it is flooded by sea water. A prognostic scheine for sea-ice and snow albedo depends on ice thickness, snow depth and temperature.
Series of Simulations
The coupled atmosphere—sea-ice model was run globally over a series of annual cycle simulations to test the sensitivities of the model sea ice to the major uncertainties in the various parameterisations (e.g. oceanic heat flux, partitioning fractions for the leads and basal freezing, the sea-ice albedo, the ocean mixed-layer depth and the rafting and ridging scheme). Some runs of six annual cycles were obtained, but it was generally found that after spinning up for one year, two years of repeatablc annual cycles were sufficient to establish a new seasonal climatology, and produce clear differences from the 6 years of control results.
It was found that reasonable matches could he obtained of the limited atmosphere, ice and surface-ocean observations available for the major sea-ice-zone features. Some of these are illustrated in more detail in Reference Wu, Simmonds and BuddWu and others (1997). Here we note some of the compilations from obser-vations of major sea-ice features as follows: ice thickness from (Reference BuddBudd 1982, Reference Budd1986), Reference Allisonn, Brandt and WarrenAllison and others (1993) Reference Worby, Weeks, Jeffries, Morries and JanaWorby and others (1994), Reference Allisonn and WorbyAllison and Worin (1994); ice extent and concentration from Reference Zwally, Comiso, Parknson, Campbell, Carsey and BlosersonZwally and others 1983), Reference Gloersen, Campbell, Cavalieri, Comiso, Parkinson and ZwallyGloersen and others (1992), also Reference Allisonn, Brandt and WarrenAllison and others (1993) and Worin and others (1996); albedo from Reference Allisonn, Brandt and WarrenAllison and others (1993) and ice drift from Reference BuddBudd (1986), Reference AllisonAllison (1989), Reference Martinson and WamserMartinson and Wamser 1990) and Reference Kottmeier, Olf, Frieden and RothKottmcicr and others (1992).
The most important unknown feature was the prescribed oceanic heat flux, which was found to have a best-fit annual average over the sea-ice-covered extent of about 10-15 Wm-2, with slightly higher values in summer than in winter. The higher oceanic heat flux in summer is accompanied by higher radiation absorption in the ocean and net melting of the sea ice.
The variation of mean ice thickness (at the time of maximum ice extent) with the magnitude of the prescribed oceanic heat flux, from the series of annual cycle simulations, for sensitivity tests, is summarised in Table 2.
Further runs were carried out with the sea-ice concentration prescribed as the seasonally varying mean values taken from Reference Zwally, Comiso, Parknson, Campbell, Carsey and BlosersonZwally and others (1983). flic results from these runs in general differed only slightly from the best-fit interactive runs. However some features, such as the heat flux, freezing and ice dynamics, can differ significantly between interactive and prescribed conditions, as shown by Reference Wu, Simmonds and BuddWu and others (1996). The best-lit interactive runs were used to derive a comprehensive set of features for the sea-ice region as indicated below.
Summary of Key Characteristics
Table 1 summarises the major components of the heat, mass and fresh-water budgets. Values are given for the averages over the sea-ice zone i.e. the sea-ice and ocean area inside of the maximum sea-ice extent, for the annual mean, the near-solstice periods (January and July) and near the maximum and minimum sea-ice extent. These allow the primary features of the annual cycle to be discerned, This seasonal variation is further illustrated by Figure 3 . which shows the annual cycles of extent and area, and Figures 4 and 5, which show examples of some features in the zonal mean varying with latitude through the annual cycle. In particular the latent heat flux from the total freezing or melting is shown in Figure 4a, and the total surface freshwater flux which, besides freezing and melting, includes precipitation minus evaporation (P — E) and the effects of ice movement, is shown in Figure 5a . These figures also show the seasonal cycles of the area averages over the different ocean regions defined by Reference Zwally, Comiso, Parknson, Campbell, Carsey and BlosersonZwally and others (1983) as well as for the total Southern Ocean sea-ice zone. Net balance closures for heat, mass, fresh water and salt can be carried out over the upper and lower ice (or snow) surfaces, the ice and snow column total, the open-water surface and the average over a gridbox, with weighting for the ice concentration and open-water fractions.
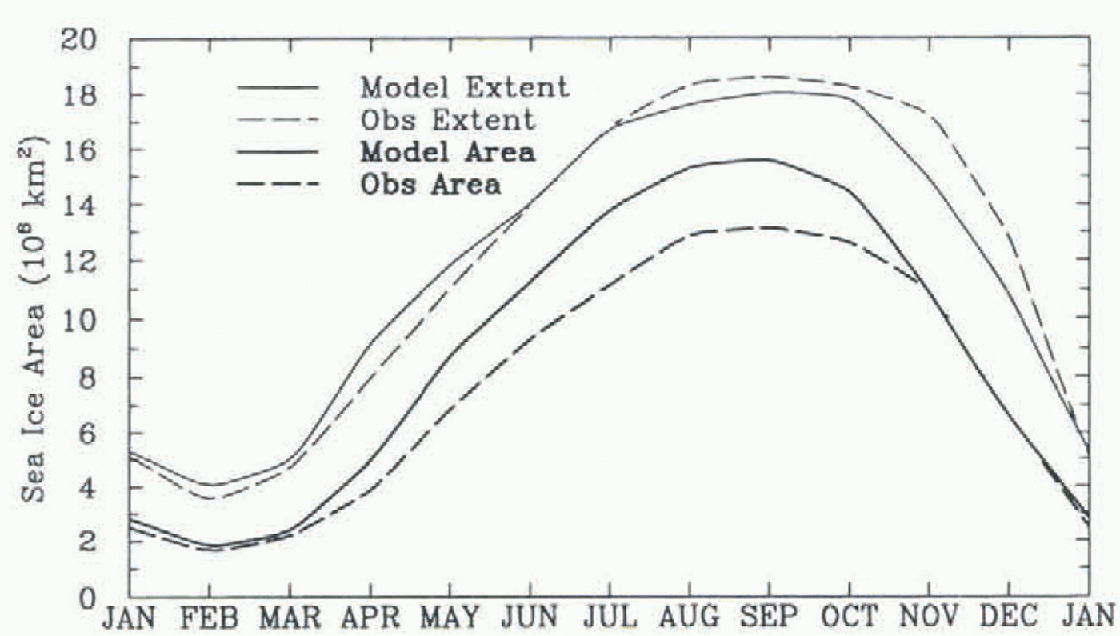
Fig. 3. Seasonal cycle of simulated (solid lines) and derived from satellite (SSM/I), (dashed lines) monthly averaged sea-ice extent (the ice and leads area to the ice edge -- thin lines) and ice area (ice fraction only hold lines) in units 106 km2. Surface observations in winter indecate the satellite-derived concentrations and ice area mar he too low.
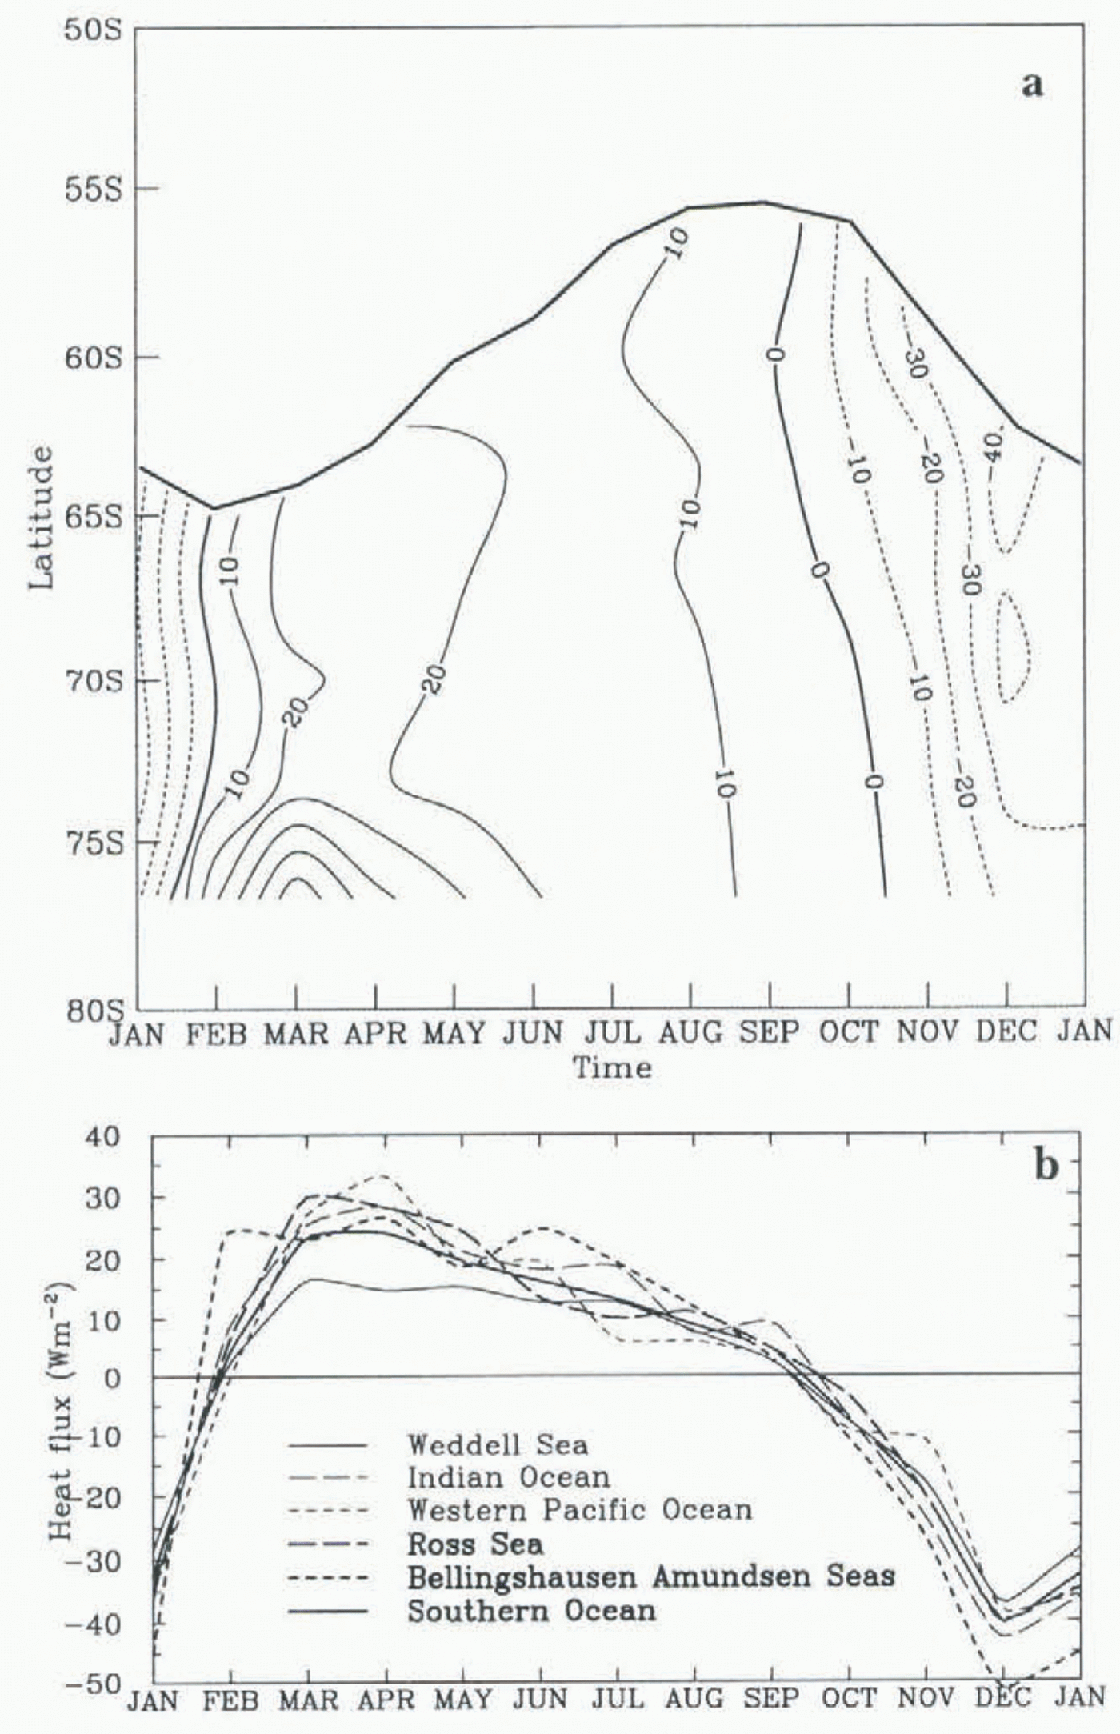
Fig. 4. Seasonal cycle of (a) zonally averaged and (b) area-weighted averaged
latent heat flux from total freezing melting
![]() in teh Southern Hemisphere sea-ice covered zone. The
contour intervals are 10 Wm -2. Positive values correspond
to sea-ice freezing.
in teh Southern Hemisphere sea-ice covered zone. The
contour intervals are 10 Wm -2. Positive values correspond
to sea-ice freezing.
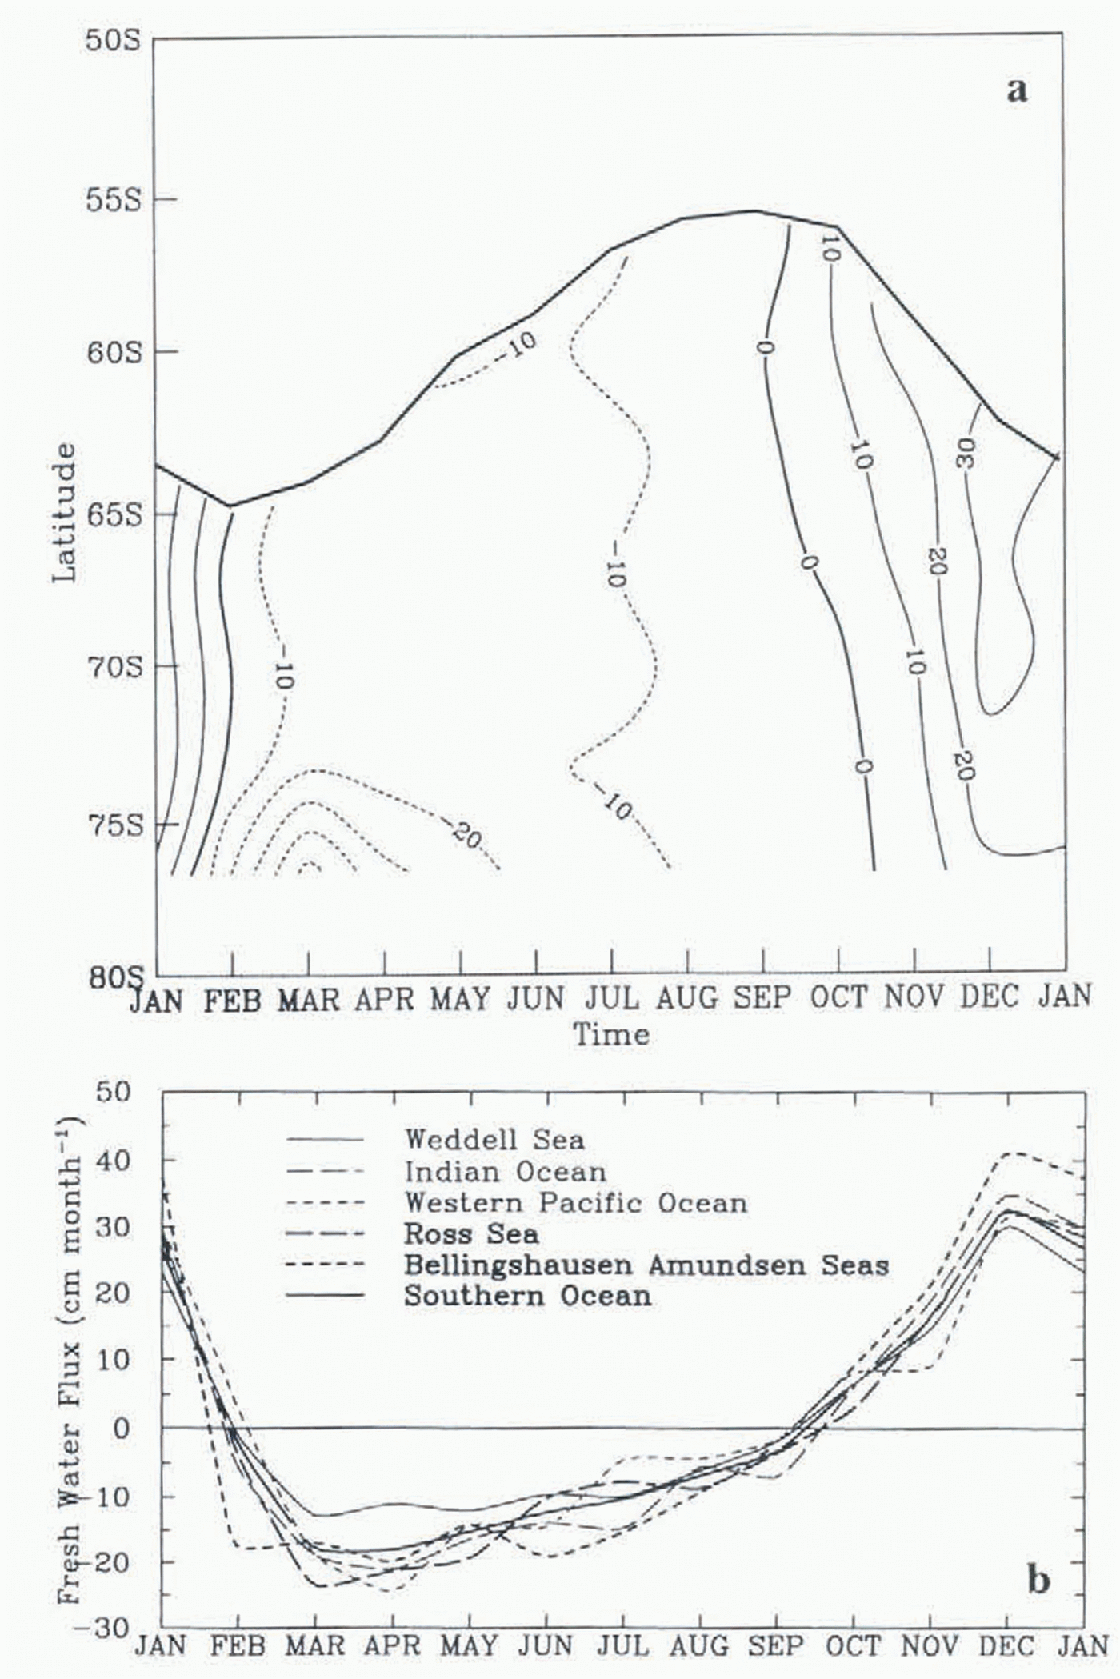
Fig. 5. Seasonal cycle of (a) zonally averaged and (b) area-weighted averaged net fresh-water column balance for the water column (δFW/δt) in the Southern Hemisphere sea-ice-coverrd zone. The countour intervals are 10 cm month-1 (water equivalent).
Examples of balance closures can be seen in Table 4.
Table 4. Examples of balance closures included (at the surface)

The variation through the year of the major components in the heat and fresh-water balances over the sett-ice zone are shown in Figures 6 and 7 respectively. The averages are computed in two ways: firstly over the fixed region of maximum sea-ice extent; and secondly live r the instantaneous sea-ice extent as it varies in area through the year.
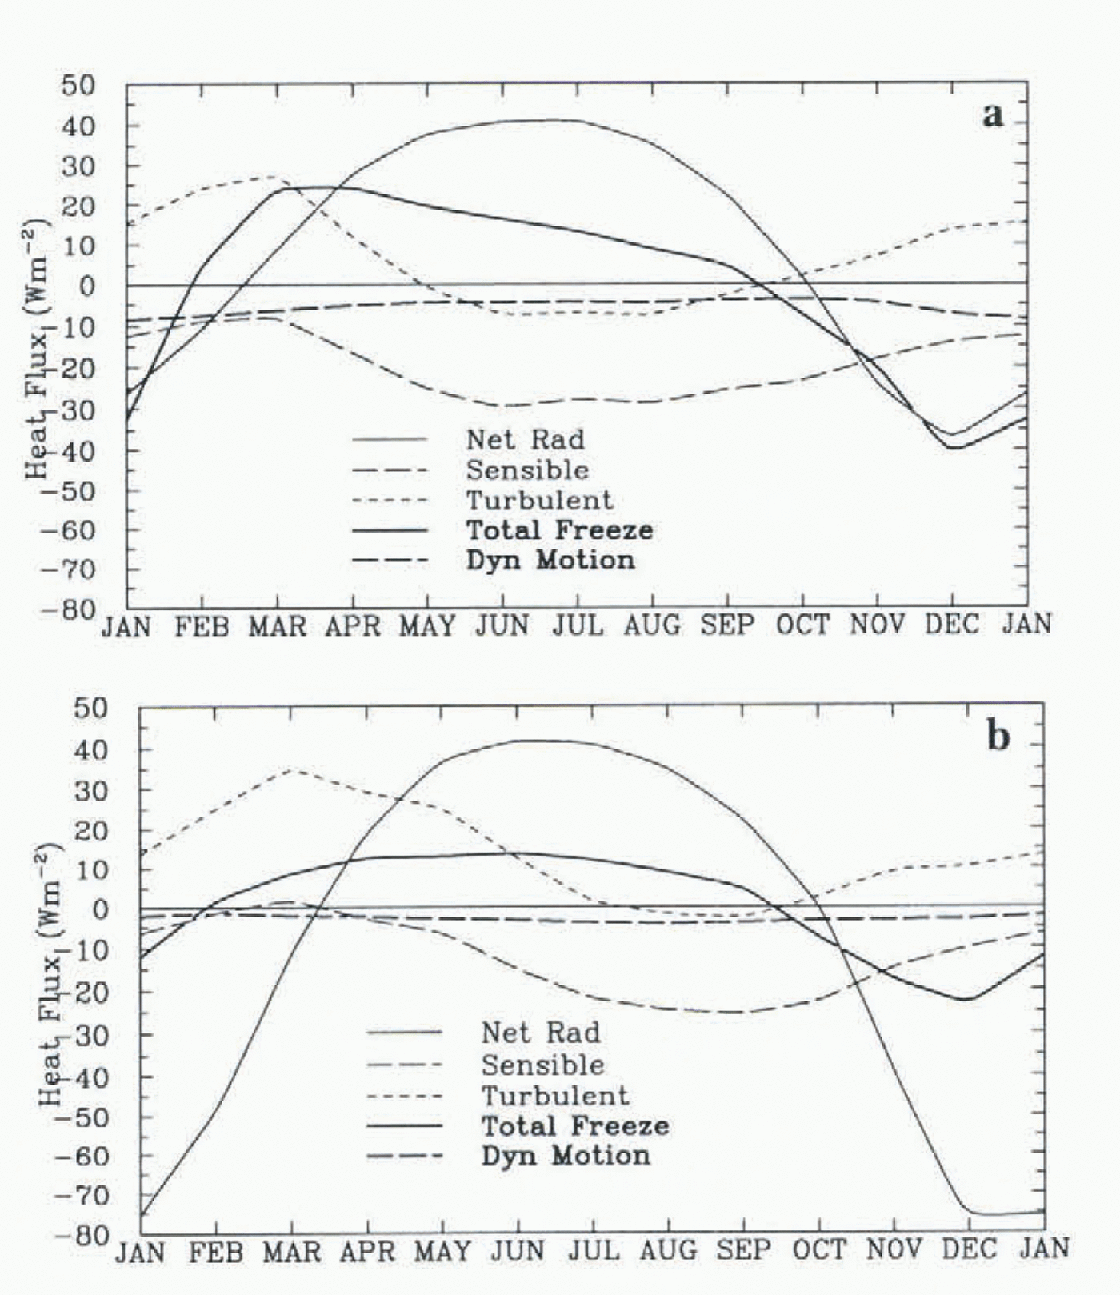
Fig. 6. A summary of the seasonal cycle of some of the major components in the heat batanee is shown (a) averaged over the actual sea-ice region as it varies through the year and (b) over the fixed region of maximum sea-ice extent. The net freezing/ melting responds strongly to the net radiative and turbulent forcing, but in turn most strongly influences the ice concentration and sensible heat.
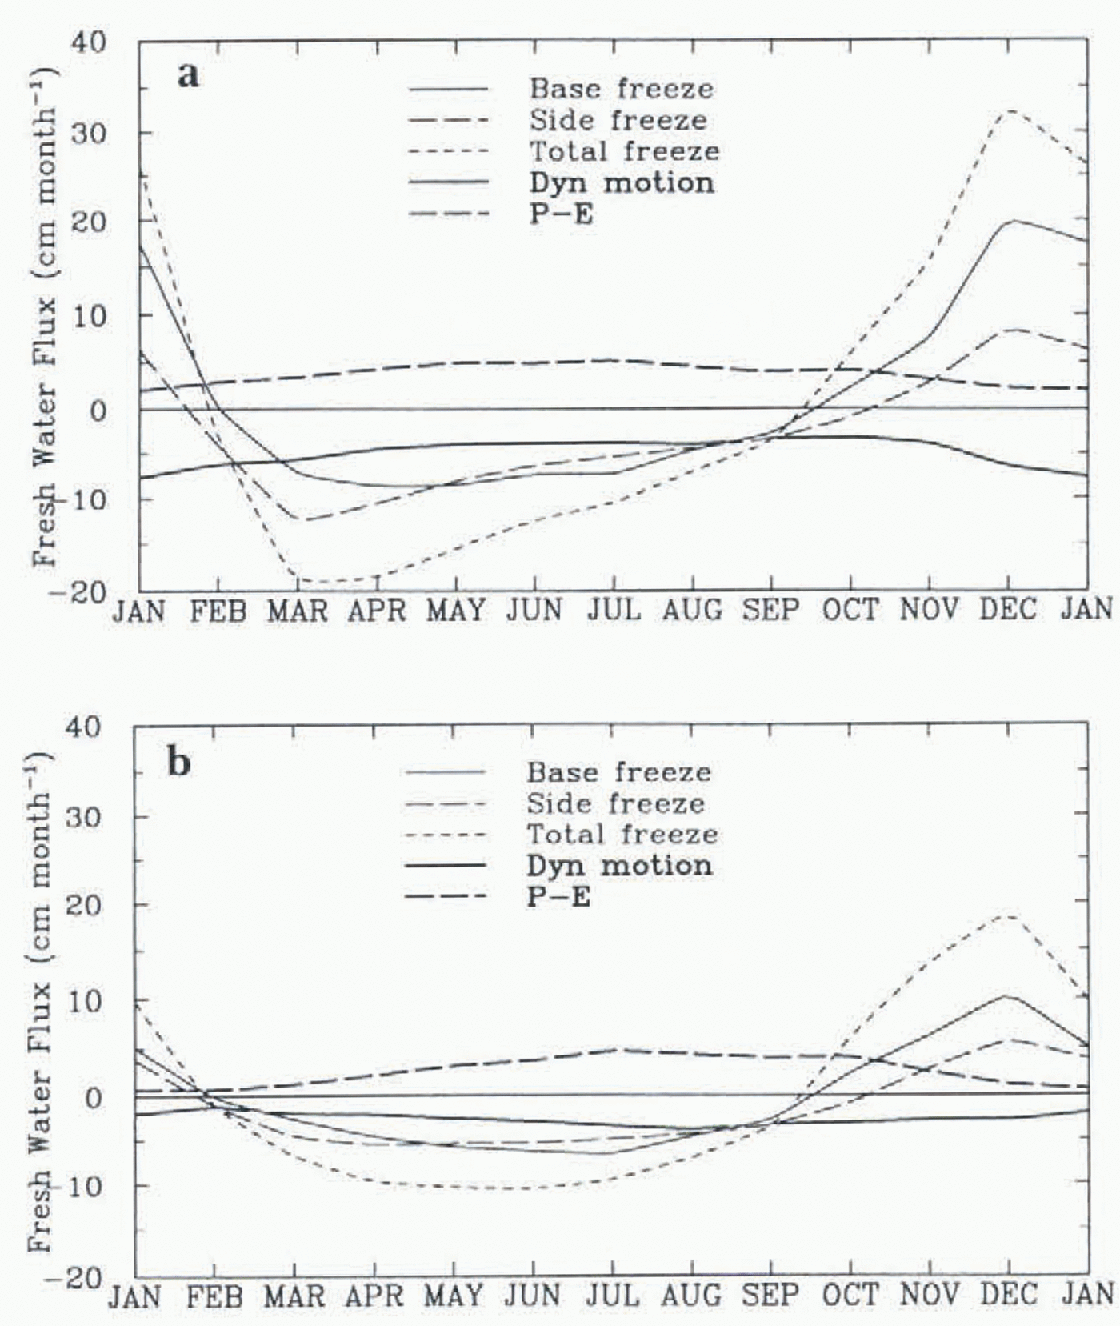
Fig. 7. A summary of the seasonal cycle of major components in the total fresh-water balance is shown (a) averaged over the actual sea-ice region as it varies through the year and (b) over the fixed region of maximum sea-ice extent. The ice drift tends to compensate the (P - E) with relatively small seasonal cycle amplitude compared with that of lite freezing, melting.
Discussion of Results
Ice concentration and thickness
The distribution of ice concentration at the time of maximum sea-ice extent is shown in Figure 1. This compares reasonably well with the observations from satellite as derived by Reference Gloersen, Campbell, Cavalieri, Comiso, Parkinson and ZwallyGloersen and others 1992: but the model results tend to be higher near the coast, file annual cycle of ice extent and area is shown together with that from the SSMI satellite data in Figure 3. The model ice areas and concentrations tend to be higher than the satellite-derived areas throughout the winter. However the direct surface observations carried out in the winter of 1995 by Reference Worby, Bindoff, Lytle, Allison and MassonWorby and others (1996) obtained even higher concentrations. These and other similar results raise questions concerning the algorithms that have been used to derive the ice concentrations from the satellite radiances, insofar as the extensive areas of thin, dark ice may be missed.
The ice-thickness distribution, near maximum extent, is shown along with the mean ice drift in Figure 2. and it also appears reasonable in comparison with the limited observational data available e.g. Reference BuddBudd (1991). Reference Allisonn and WorbyAllison and Worby (1994). Reference Worby, Weeks, Jeffries, Morries and JanaWorby and others (1994).
It is found that the ice thickness in the model is very sensitive to the prescribed oceanic heat flux. whereas the ice concentration is much less dependent. A similar result was also found for the Arctic. The dependence of the maximum average sea-ice thickness over the Antarctic sea-ice zone on the magnitude of the prescribed constant oceanic heat flux is show in Table 2. The observations support a mean thickness near maximum ice extent of about 0.6-0.8 m, which indicates dial an annual average oceanic heat flux over the atea in the range of 10-15 W m-2 is most appropriate. It is important to note that the model calculations are carried out over fixed geographical grid areas and include the cilcets of the continual motion of the ice. The mean movement of the ice at the time of maximum extent, as illustrated in Figure 2. agrees reasonably well with the mean drill rates derived from buoys (cf. (Reference BuddBudd 1986, Reference Budd1991), Reference AllisonAllison (1989), Reference Kottmeier, Olf, Frieden and RothKottmeier and others (1992).
Summary of major variables
Table 1 gives a selection of the values of main of the key variables averaged over the sea-ice zone for the annual mean, and at times of the year of particular interest to indicate the seasonal changes (January minimum extent (February to March), July, and maximum extent (September to October)). Annual averages arc also shown computed over the fixed areas of maximum ice extent (Annmax) and minimum ice extent (Annmin). These results clearly show the relative magnitudes of the various terms in the heat and water balances and how they vary through the year. Note that the legion of the Annmax extends further north, so that the average ice thickness is less, and the average temperature higher, than for the Annmax , region.
In general, the parameters are computed as equivalent weighted averages over the total sea-ice and leads area, except as marked by the * (such as ice thickness), where the values are monthly averages over the sea-ice and leads region for January, the minimum ice extent (min) about March, for July, and for the time of maximum ice extent (max), about September. The annual averages are calculated over the fixed legions of maximum ice extent (Annmax) and the region of minimum ice extent (Annmin).
The snow depths and precipitation correspond to a mean density of 0.33 Mgm -3. The signs of the heat fluxes are taken as positive upwards except for the ice conductive heal flux, which is negative upwards (towards the ice surface). Within the pack-ice zone it has been assumed that the sea water remains at freezing point while ice is present. This means that the sea-ice-surface temperature and the ice concentration determine the average surface temperature, through a weighted mean.
The largest terms in the heat balance are the inward-and outward-radiation terms, and the greatest variability and uncertainties are associated with cloud cover. These terms can be assessed by satellite data for outward shortwave and longwave radiation. The net surface radiation, shortwave absorbed and longwave emitted are strongly dependent on the sea ice. particularly the concentration, and open-water fraction.
Summary of heat-balance components
Figure 6 shows the annual cycle of the net radiation, along with the other major components of the heal balance. The turbulent heat Dux is the sum of the sensible flux and the latent flux from evaporation and condensation.
During the winter the Antarctic pack ice is relatively much more open than in the Arctic. The high average open-water fraction of 15-20% is maintained by the active, and largely divergent, ice dynamics and the feedback between the sensible heat, the freezing and the ice concentration. Table 3 shows that the sensible heat and the net turbulent heat fluxes change sign close to the observed range of ice concentrations. This feature of the sea ice resembles a "self-regulating system", with the sea-ice concentration tending towards the observed values under the balance between the net radiation heal loss, and the freezing and net ice divergence, through the feedback of the sensible heal flux. The sensible heal is particularly sensitive to the ice concentration, which in turn has a strong influence on the mean surface temperature and the air-surface temperature difference. This is more clearly illustrated in Table 3. which shows the surface- and air-temperature dependence on ice concen-tration in July (from the model), in conjunction with the key heat-flux components. These results are from an extension of the studies by Reference Simmonds and BuddSimmonds and Budd (1991) whereby the sea ice was prescribed at a fixed concentration over the entire sea-ice zone for perpetual July simulations with different values of the given ice concentration, Table 3 shows some results for ice concentrations of 100, 95, 80, 50, 20 and 0%, plus results from an interactive run for July with the coupled atmosphere-sca-ice model for which the mean sea-ice concentration averaged 83%. The table shows that the net radiation and latent heat fluxes change slowly with concentration, but the air-surface temperature difference, the sensible heat flux and the uet turbulent heat flux can change sign around the general region of the observed predominant sea-ice concentrations,This gives the basis for the tendency towards the self-regulating system whereby the ice conceniration strongly adjusts to give the balance through the feed-backs with sensible heat and ice freezing (primarily in the leads) compensating for the thermal heat losses primarily radiative and latent) and the effects of ice movement (predominantly divergent).
Summary of fresh-water balance components
Figure 7 summarises the variation through the year of some of the more important terms in the ice and fresh-water balance. The net basal freezing shown includes the contribution from the leads. The precipitation minus evaporation (P - E) only varies slightly through the year, with higher values in winter than summer, and is largely balanced by a net mean northward transport and divergence oi the ice from the dynamics. The freezing and melting have relatively large seasonal cycles and only contribute to the net annual mean flux through the net dynamical transpon. The tolal freezing is dominated by the freezing in the leads, and in particular, that part which adds to the sides or the ice area. The relatively substantial amount of freezing in the leads that also accumulates at the base (as is shown in Table 1), together with the effects of rafting, indicates that ice cores can be expected to show relatively large fractions (≈50%) of frazil ice. This has been born out in observations (e.g. see Reference Allisonn, Brandt and WarrenAllison and others (1993)). The large amount of freezing in the leads is also a factor in the huge fraction of young thin ice with relatively small snow depths in comparison with relatively high precipitation rates of around 600mma-1, Many features, such as ice-thickness distributions, snow -depth distributions, sea-ice-surface temperature, ice movement and divergence, can be observed and compared with model output. The results obtained from the 1995 winter cruise described by Reference Worby, Bindoff, Lytle, Allison and MassonWorby and others (1996) have been particularly valuable and provide encouraging confirmation of the model predictions provided before the voyage.
Summary and Conclusions
In spite of the variability of Antarctic sea ice and the associated meteorological variables over the region, the climatological mean net surface flux components are becoming reasonably well known and constrained to about ±a few W m-2. More extensive observations of the mean sea-ice-thickness distribution, and to a lesser extent the ice concentration, can provide the lightest control on net surface fluxes. A comprehensive daiasei for the annual cycle of sea-ice-thickness distribution around the Antarctic would provide the basis for a more accurate estimate of the distribution of the net oceanic heal fluxes.
Sensible heal flux is the most sensitive major heat-flux component to ice concentration and. along with freezing in leads and ice divergence, acts to regulate the concentration towards the observed mean values. Checks on the sensible heat flux can be obtained from comprehensive observations of mean air-minus-surface-temperature differences (Ta-Ts) along with the other usual meteorological variables such as wind speed. For the fresh-water balance, the excess of precipitation Over evaporation is largely balanced by a net northerly transport of snow and ice, and an excess of melting over freezing from the net northerly ice drift. This does not take account of iceberg melt, which is of similar magnitude over the area and needs to be included in coupled models.
The comprehensive range of output available from the model provides a wide range of atmosphere, ice and ocean features that can the compared to observations to constrain more tightly the less well-known features. In particular the surface fluxes derived here, to match the observed sea-ice distribution, provide a sound basis to constrain the oceanic surface heal fluxes in fully coupled atmosphere—ocean global climate models and thereby reduce the need for applying the large surface flux corrections that have been used in the coupled models to prevent model climatic drift.
The present model has also been used to derive surface fluxes over the sea-ice zone initialised by the daily analyses from the global forecasting centres. It should be noted however that so far the analysis centres arc not yet using real-time observed sea-ice distributions with interactive sea-ice models. The interactive model in these cases needs to be spun-up for a period long enough for adjustment to the computed fluxes. The results obtained here indicate that considerable improvements to the diagnosis of surface fluxes from the daily analyses can be expected when the analysis centres routinely use interactive sea ice in their analysis and forecast models.


