1. Introduction
1.1. Shear and longitudinal strain rates
Following the first large-scale numerical simulation of the Antarctic ice sheet by Reference Budd, Jenssen and RadokBudd and others (1971) (which was based on an assumption of steady state), vertically integrated and, more recently, three-dimensional time- and temperature-dependent numerical models have been employed to simulate the response of the ice sheet to changing climate and sea level. The first such model, applied to the Barnes Ice Cap in Canada, was published by MahalTy (1976). Subsequent applications of models of this kind to the Antarctic ice sheet have included the work of, for example, Reference Budd and SmithBudd and Smith (1932), Ocrlcmans (1982), Reference Budd, Jenssen and SmithBudd and others (1984), Reference Fastook and ChapmanFastook and Chapman (1989) and Reference HuybrechtsHuybrechts (1990, Reference Huybrechts1992). An approximation common to these models is that motion occurs by shear strain rates parallel to the geoid, with an additional contribution from basal motion in areas where the bed is at the pressure-melting temperature. The longitudinal strain rates and the corresponding stress deviatore are treated as negligible, along with the horizontal shear strain rates acting within vertical planes. The six independent components of the strain rate and stress tensors are thereby reduced to two, and the problem of evaluating the mass discharge on a map-plane grid is correspondingly simplified.
We investigate the extent to which longitudinal strain rates can be considered negligible relative to shear strain rates parallel to the geoid, with in the inland Antarctic ice sheet (i.e. away from ice streams), by using a three-dimensional ice-sheet model. The inland ice sheet is defined here as the area above 1500 m in East Antarctica, and above 950 m in West Antarctica. These areas are generally inland of the coastal regions where ice streams occur. The results constitute a test of the internal consistency of the shallow-ice approximation. Most of the surface velocity, and hence the mean column velocity, attributable to shear strain results from the relatively high shear strain rates close to the bed, so we represent this contribution by averaging the shear strain rates throughout the lowest 10% of the ice thickness. The contribution to the mean column velocity attributable to longitudinal strain rates, however, results from these strain rates acting throughout the entire depth of the ice, so we represent this contribution as its depth-averaged value. The ratio of the shear strain rate to the mean longitudinal strain rate is then computed at each point of the 20 km model grid, and presented in a map plane for the Antarctic ice sheet inland of the marginal areas. The ratio is mapped for iwo cases: (i) motion of the ice sheet by internal deformation without basal motion (i.e. no sliding), and (ii) motion of the ice sheet including a basal relationship appropriate for a thin viscous till layer, such that “moderate” basal motion occurs everywhere. The areas of the inland ice sheet over which the shear strain rates exceed the longitudinal strain rates by more than a factor of 10, 50 and 100 are delineated for each case, and expressed as percentages of the total area of the inland ice sheet.
1.2. Accumulation rates
Data from widely spaced ice cores on the East Antarctic ice sheet indicate that accumulation rates have increased during the decades since 1955-65. Reference Pourchet, Pinglot and LoriusPourchet and others (1983), Reference Morgan, Goodwin, Etheridge and WookeyMorgan and others (1991) and Reference Mosley-ThompsonMosley-Thompson and others (1995) found that accumulation rates at Dome C, in the Wilkes Land sector, and at South Pole Station, respectively, have increased by about 18-30% during that time. Here we calculate the response of the ice sheet to linearly increasing accumulation, which is doubled from the present accumulation during a time period of 100 years and then held constant, and examine the relative influence on the time ratc-of-change of the surface height of the terms in the surface kinematic equation representing accumulation, vertical velocity and horizontal advection. The model is run for 500 years, driven by the present mass balance, for both a reference run and the test run, before the accumulation rates are linearly doubled in the case of the test run. The effect of model non-equilibrium is then removed by subtracting the reference run from the test run. The relative roles of the terms in the surface kinematic equation are examined over time periods of 30 40 years, representing the time since the start of the most recent accumulation increase in East Antarctica, then to 1400 years after the end of the 100 year doubling of the accumulation rates.
2. Model Description
The ice-sheel model employed here is three-dimensional and time-dependent. It is based on the vertically integrated model of Reference MahaffyMahaffy (1976); that is, the equation of continuity is solved, combined with the two equations for volume flux in the orthogonal directions x and y. The model ice sheet has constant density. For the time-dependent equation of continuity and other model equations, including a deriva-tion from the force-balance equations, see Mahaffy 1,1976;. Here we present the depth-dependent equations transformed using a “stretched” vertical coordinate, and additional equations employed in our extension of this model.
The constitutive equation is Nye's generalization of Glen's flow law (Reference GlenGlen, 1955; Reference NyeNye, 1957). The three compo-nents of the velocity vector and the strain rates are computed as a function of depth. The depth-dependent velocities and strain rates are time-independent, i.e. are functions only of the geometry, and so can be evaluated at every time step or, alternatively, at longer intervals. in either case, the depth-dependent components are not included in the iterative solution of the time-dependent equation of continuity. The model is an initial-boundary value problem which requires the geometrical configuration of the ice sheet and the surface mass balance as input data, which were digitized from Reference DrewryDrewry (1983) by the Australian glaciology group and made available for distribution by Greeley (unpublished). in this preliminary version the bed is assumed to be rigid, and a constant value is used for the flow-law hardness parameter equivalent to a temperature of about —5°C. This relatively “soft” value is chosen because of the dominant role played by shear deformation close to the bed, where the ice temperatures are highest.
In order to compute all components of the velocity vector and the strain rates in a manner suitable for solution of the heat equation, a vertical “stretched” coordinate is introduced (Jensscn, 1977; Huybrechts, 1990), which transforms the ice column from the surface (z = h) to the bed (z = Z0) into a thickness ranging from ξ = 0 to ξ = 1 everywhere:
where h is the surface elevation, and H = h — Z0 is the ice thickness. The vertical discretization in ξ is chosen in a way that provides an optimal vertical resolution: the thickness of each layer is inversely proportional to its depth. This gives higher resolution close to the bed, where the shear strain rates are maximum.
Using an assumption that the ice sheet moves by shear strain parallel to the geoid, combined with an assumption that the vertical velocity changes much more slowly in the horizontal direction than the horizontal velocity changes in the vertical direction (Mahaffy, 1976), there are two non-negligible components of the shear strain rate which are, after transformation:
where
is the absolute value of the surface slope, ρ is the density of ice, g is the acceleration of gravity, n = 3, and x, y are orthogonal directions on the 20 km grid used to simulate the ice sheet in a polar stereographic projection. Β is the hardness parameter in the flow law of ice:
where ![]() are the components of the strcss-deviator tensor, and B= 8.87 x 10⁷ Ν m −2 s1/3.
are the components of the strcss-deviator tensor, and B= 8.87 x 10⁷ Ν m −2 s1/3.
Integration of the strain-rate components (2)-(3) with respect to ξ, using an assumption that the flow of the ice sheet can be represented, approximately, using a constant (dcpth-indcpcndcnt) value for B, gives expressions for the depth-dependent horizontal components of the velocity vector:
where Vbx
and Vby
are the x and y components of the basal motion, and ![]() . Basal motion is assumed to occur on a thin, water-saturated, deformablc layer of subglaciol till characterized by an effective Newtonian viscous rhcology, where the bed is at the pressure-melting point. Solution of the temperature equation is not yet incorporated in the model, so two limiting cases are assumed: (i) no basal motion, and (ii) “moderate” basal motion everywhere, governed by the relationship employed by Reference MacAyealMacAyeal (1989):
. Basal motion is assumed to occur on a thin, water-saturated, deformablc layer of subglaciol till characterized by an effective Newtonian viscous rhcology, where the bed is at the pressure-melting point. Solution of the temperature equation is not yet incorporated in the model, so two limiting cases are assumed: (i) no basal motion, and (ii) “moderate” basal motion everywhere, governed by the relationship employed by Reference MacAyealMacAyeal (1989):
where Ht
is the thickness of the till layer, vt
is the effective viscosity of the till layer, and ![]() ,
, ![]() are the x and y components of the basal shear stress:
are the x and y components of the basal shear stress:
The magnitude of the basal motion is assumed governed by the thickness of the till layer, not the detailed variation of the viscosity, which can then be inferred in a bulk sense from ice-stream measurements. From the results of measurements on Ice Stream Β (Reference Alley, Blankenship, Bentley and RooneyAlley and others, 1986; Blankenship and others, 1986), vt =8 x 10⁹ Pa s (Reference PatersonPaterson, 1994, p. 170). A subglaciol till-layer thickness of about 0.05 m then yields the hypothesized “moderate” basal velocity of 6.25 x 10 −1 ms −1 (about 20 m a−1) at t b = 105 Pa (1 bar). The vertical velocity is computed using the incompressibility condition
where ![]() is the depth-dependent vertical longitudinal strain rate, and
is the depth-dependent vertical longitudinal strain rate, and
are the depth-dependent horizontal longitudinal strain rates in the x and y directions. The vertical velocity is
where the vertical velocity at the upper surface is given by the kinematic boundary condition (e.g. Huttcr, 1983, p. 453):
Here ![]() is the local accumulation rate and Vx(h), Vy(h) are the horizontal components of the surface velocity. The ad-vection terms in Equation (12),
is the local accumulation rate and Vx(h), Vy(h) are the horizontal components of the surface velocity. The ad-vection terms in Equation (12), ![]() and
and ![]() represent the flow of higher-elevation ice from tip-glacier which tends to cause the surface elevation to increase at (x, y) This is counterbalanced by W(h), the rate at which ice is moving downward due to the vertical velocity. The time ratc-of-change of the surface height,
represent the flow of higher-elevation ice from tip-glacier which tends to cause the surface elevation to increase at (x, y) This is counterbalanced by W(h), the rate at which ice is moving downward due to the vertical velocity. The time ratc-of-change of the surface height, ![]() , represents the extent to which these competing processes do not sum to zero.
, represents the extent to which these competing processes do not sum to zero.
3. Shear To Longitudinal Strain-Rate Ratio
3.1. Calculation of the strain rates
For this experiment, the run time is 100 model years, which results in a geometry very similar to the present while allowing time for damping of start-up transients. The model covers a domain of 281 x 281 gridpoints with 20 km horizontal resolution over the inland Antarctic ice sheet. Twenty kilometers is about 8 times the mean thickness of the East Antarctic ice sheet and 11 times the mean thickness of the West Antarctic ice sheet (Drewry, 1983), so Equations (8) are expected to approximate the basal shear stress. The boundary of the grounded ice which represents the boundary of the numerical domain was delincd using a flotation criterion similar to that of Shablaie and Bentley (1987). The ice thickness was held constant at the gridpoints closest to the grounding line or margin around the perimeter of the ice sheet. The vertical dimension was subdivided into 21 layers as described above. The thickness of the smallest layer is Δξ — 0.018. An alternating-direction implicit (ADI) finite-difference method with a 1 year time step is employed to solve the equations of the model on a staggered grid in the map plane. The depth-dependent strain rates and velocities represented by Equations (2), (3) and (5)-(12) are evaluated every tenth time step.
Evaluation of the internal consistency of the shallow-ice approximation with in the inland Antarctic ice sheet was carried oui using two experiments, which included calculation of the strain rates for the no-basal-motion case and for the case of basal motion on a till layer of 0.05 m thickness, governed by the hypothesized relationship of Equations (7). The shear strain rates and the longitudinal strain rates were computed as a function of depth at levels of constant ξ over the inland ice sheet. The shear strain rates are maximum close to the bed (see Equations (2) and (3)), so they were averaged over the five lowermost vertical layers corresponding, approximately, to the lowest 10% of the ice thickness. The horizontal shear strain rate in the ith layer was defined as ![]() . The longitudinal strain rates were averaged over all 21 layers. The horizontal longitudinal strain rate in the ith layer was defined as
. The longitudinal strain rates were averaged over all 21 layers. The horizontal longitudinal strain rate in the ith layer was defined as ![]() . Then, the ratio R of the shear strain rale to the longitudinal strain rate was computed for every gridpoint (x, y) throughout the area of the inland ice sheet.
. Then, the ratio R of the shear strain rale to the longitudinal strain rate was computed for every gridpoint (x, y) throughout the area of the inland ice sheet.
The results of the first experiment are shown in Figure 1, which shows the pattern of the computed ratio R over the inland ice sheet for the no-basal-motion case. Areas shown in light gray are the regions where this ratio is greater than 100. Other gradations of gray show the areas where 50 R < 100,10 < R < 50 and R < 10 (see scale). For the whole inland ice sheet, the area where R > 10 makes up 97% of the total number of gridpoints. The area where
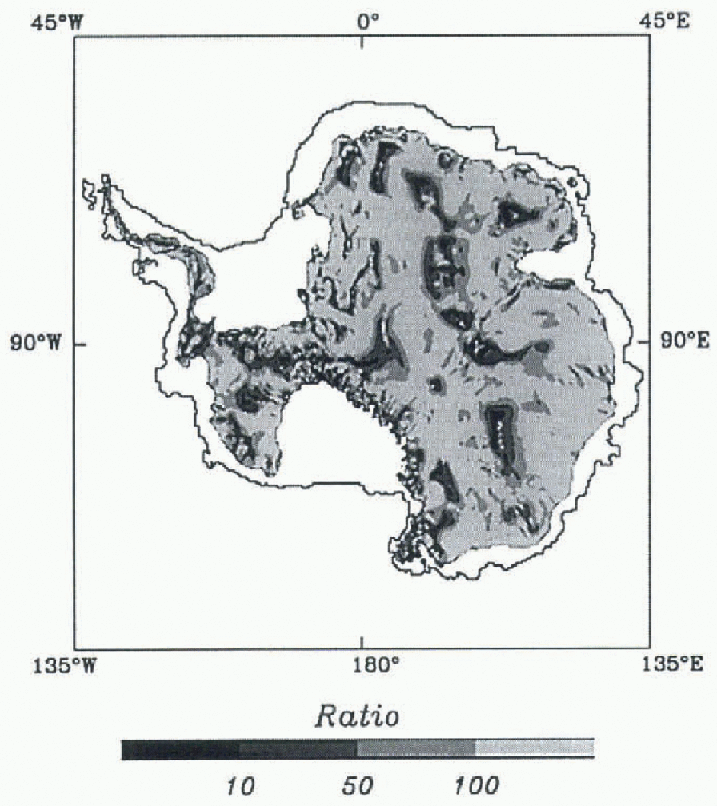
Fig. 1. The ratio of the shear strain rates (lowest 10% of the depth) to the longitudinal strain rates (averaged through the depth) for the case of no basal motion.
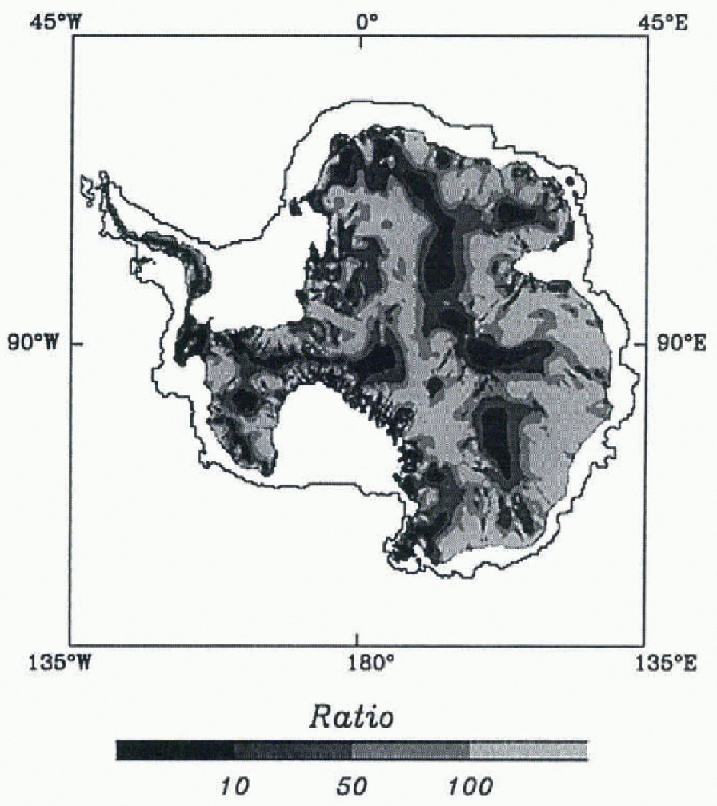
Fig. 2. The ratio of the shear strain rates (lowest 10% of the depth) to the longitudinal strain rates (averaged through the depth jfor the case of “moderate” basal motion on an assumed saturated till layer with effective viscosity ut = 8 x 10⁹ Pa s and of 0.05 m thickness.
R > 50 is 80%, and the area where R > 100 is 57% of the total area of the inland ire sheet. The areas where the assumption that the longitudinal strain rates are small relative to the shear strain rates breaks down, under domes and ice divides, for instance, are shown in a dark shade of gray and black. in these areas, R. < 10.
Figure 2 shows the ratio R for the case of basal motion on a 0.05 m thick viscous till layer, which is assumed to exist everywhere. The areas where longitudinal strain rates are not negligible (dark gray and black) have expanded, reflecting the increase in longitudinal stretching. The plot shows that even in the presence of moderate basal motion the shear strain rates are greater than the longitudinal strain rates by more than a factor of 10 over 87% of the inland ice sheet, by more than a factor of 50 over 57%, and by more than a factor of 100 over 33% of the total area of the inland ice sheet.
3.2. Discussion
Figure 1 shows that for the case of ice-sheet flow without basal motion, the shallow-ice approximation is well justified throughout most (about 80-97%) of the area of the inland Antarctic ice sheet. Figure 2 shows that for the case of “moderate” basal motion on a thin till layer, governed by the hypothesized relationship of Equation (7), the longitudinal strain rates can also be considered small to negligible relative to the shear strain rates over much (about 57-87%) of the area of the inland ice sheet. The results oflhis study thus support use of the shallow-ice approximation in numerical models of the inland Antarctic ice sheet, as indicated by, for example, the scale analysis of Greve (1997).
figures 1 and 2 also show that the assumption that longitudinal strain rates are negligible relative to shear strain rates breaks down more-or-less in the areas where that is expected; for instance, beneath domes and flow divides, which are well outlined by the shades of dark gray and black. The reason for this lies in equations (2) and (3), which show that ![]() as the surface slope —> 0, despite large ice thicknesses. Interestingly, vertically integrated and three-dimensional ice-sheet models evolve in a physically reasonable manner in the vicinity of domes and divides, despite breakdown of the shallow-ice approximation. An analysis of flow in the vicinity of divides, which are singular points under the shallow-ice approximation, is given by Reference HindmarshHindmarsh (1997).
as the surface slope —> 0, despite large ice thicknesses. Interestingly, vertically integrated and three-dimensional ice-sheet models evolve in a physically reasonable manner in the vicinity of domes and divides, despite breakdown of the shallow-ice approximation. An analysis of flow in the vicinity of divides, which are singular points under the shallow-ice approximation, is given by Reference HindmarshHindmarsh (1997).
Finally, figures 1 and 2 show that the shallow-ice approximation also breaks down near mountain ranges such as thcTransantarctie Mountains, which project up through the ice sheet. The reason for this also lies in Equations (2) and (3), which show that ![]() as the ice thickness
as the ice thickness ![]() , despite finite surface slopes. The interesting fact that such locally extreme variations in the bed topography do not cause vertically integrated and three-dimensional models of the ice sheet to destabilize also follows from this and Equations (5) and (6), which show that for n = 3 the depth-dependent velocity is a function of the fourth power of the ice depth. It follows that the total discharge volume flux is a function of the fifth power of the total ice thickness (Mahaffy, 1976). Ice flow thus rapidly approaches zero in the vicinity of nunataks and mountain ranges, accounting for the stability of flow models in the vicinity of such features.
, despite finite surface slopes. The interesting fact that such locally extreme variations in the bed topography do not cause vertically integrated and three-dimensional models of the ice sheet to destabilize also follows from this and Equations (5) and (6), which show that for n = 3 the depth-dependent velocity is a function of the fourth power of the ice depth. It follows that the total discharge volume flux is a function of the fifth power of the total ice thickness (Mahaffy, 1976). Ice flow thus rapidly approaches zero in the vicinity of nunataks and mountain ranges, accounting for the stability of flow models in the vicinity of such features.
4. Response To Increasing Accumulation
4.1. Numerical experiment
A numerical experiment was also carried out to simulate the response of the ice sheet to increasing accumulation during a limited (100 year) time period. This experiment is carried out because evidence from widely spaced Rast Antarctic ice cores indicates that accumulation rates have increased during the decades since 1955-65 (personal communication from E. Mosley-Thompson, 1997). Pourchet and others (1983) found that precipitation at Dome C increased by 30% after 1965 compared with 1955-65. Morgan and olliers (1991) found an increase in accumulation rates following a minimum around 1960, leading to recent rates about 20% above the long-term mean in the Wilkes Land sector of East Antarctica. Two of their cores, showing 23% and 26% accumulation increases, respectively, were with in the area north of 72° S where Linglc and Covey (1998) estimated mean changes of the surface height during 1978-93 using satellite radar altimctry. Mosley-Thompson and others (1995) found that the accumulation rates at South Pole Station have increased by about 30% since 1955. More recent data (personal communication from E. Mosley-Thompson, 1997) indicate that the increase was about 18 19%, on average, between 1955 64 and 1965 95. Unpublished data from a suite of shallow cores obtained at a remote site on the East Antarctic plateau (84° S, 43° E, elevation 3300 m) indicate that accumulation rates there increased by about 23% during the past 150 years (personal communication from E. Mosley-Thompson, 1997). As shown by the surface kinematic Equation (12), the time rate-of-change of the surface height is a function of the accumulation rate, the vertical velocity and terms representing advection of highcr-clcvation ice from up-glacier. Two model runs were conducted (Fig. 3): (1) a reference run, during which the accumulation rates were held constant at the present rates, and (2) a test run, during which the accumulation rates were linearly doubled during a time period of 100 model years. The reference run is needed because the model ice sheet is not in equilibrium with the present mass balance, given the assumed constant flow-law hardness parameter. The purpose of this experiment is to simulate flow increasing accumulation influences the time rate-of-change of the surface height as a function of this and the other terms in the surface kinematic equation, during and after the time period of the increase.
The dotted area shown in Figure 4 is the area of the East Antarctic ice sheet north of 72° S, between 40° and 160° E, and above 1500 m elevation. This is the area over which

Fig. 3. An experiment with increasing accumulation. For the test run, the present accumulation rate A0 is doubled over 100 years; for the reference run, the accumulation remains constant at the present distribution.

Fig. 4. The region of the East Antarctic ice sheet (dotted area) over which Lingle and Covey (1998) measured mean changes of the surface height with altimelry. Point A, near one of the ice cores of Morgan and others (1991), indicates the location where the terms of the surface kinematic equation were computed vs time (Figs 5a-b and 6).
mean changes of the surface height from 1978 to 1993 were estimated by Lingle and Covey (1998), using satellite radar altimelry. The mean accumulation rate for this area is 0.22 ma−1, calculated from 3758 gridpoints. For this experiment, point Awas chosen (Fig. 4) close to the location of ice core GD03 of Morgan and others (1991), who measured a 23% increase in the accumulation rate between 1955-65 and 1975-85. They concluded that the good correlation between the accumulation records in this and three other cores suggests that this increase is typical of the Wilkes Land sector of East Antarctica.
4.2. Discussion, 2
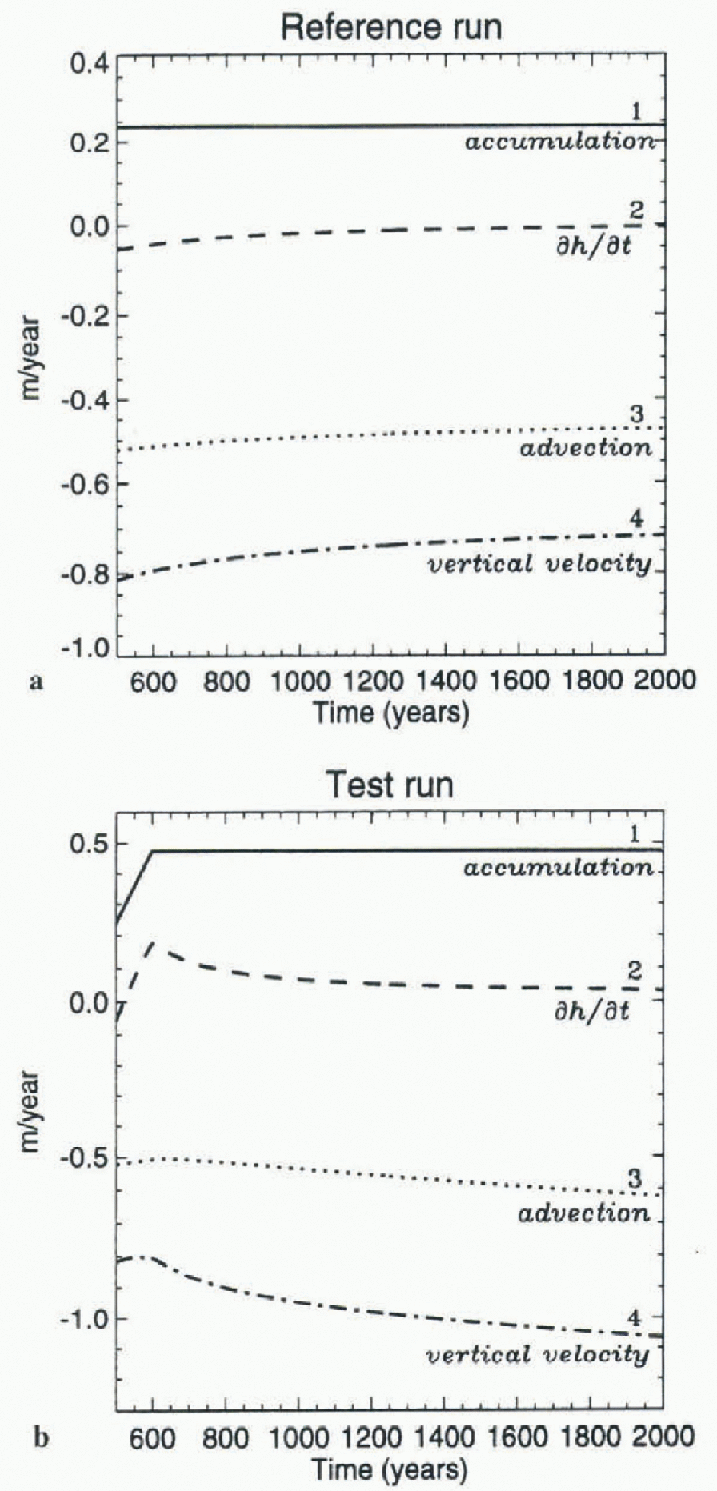
Plots of the terms in the surface kinematic Equation (12) as functions of time for point A are shown in figure 5a and b for the reference run and the test run, respectively. For the reference run, curve 1 shows the present accumulation rate at A (Fig. 4), in m a−1 of ice. The time rate-of-change of the surface height (fig. 5a, curve 2) asymptotically approaches
zero as the ice sheet approaches an equilibrium state. The sum of the two advection terms (fig. 5a, curve 3) is negative because positive velocity corresponds to negative surface slope, and the reverse, i.e. the ice flows down the surface slope. The vertical velocity (fig. 5a, curve 4) is negative because the z coordinate is positive up, for aspects of the model not referenced to the stretched coordinate system of Equation (1).
The test run is identical to the reference run for years 0-500, then the accumulation rate is linearly doubled over 100 years and subsequently held constant. The time rate-of-change of the surface height (fig. 5b, curve 2) increases at a rate almost identical to the increasing accumulation rate during most of that 100 year interval and then asymptotically approaches zero during the following 1400 model years. This is a reflection of the insensitivity of the equilibrium profile of an ice sheet to the accumulation rate (Nye, 1959).
The terms in the kinematic surface equation for the reference run were then subtracted from the corresponding terms for the test run. The differences are shown in Figure 6, which also shows that the positive change in the time rate-of-change of the surface height (curve 2) is essentially equal to the increase in the accumulation rate (curve 1) over a time period of about 60 years after the start of the increase. There are relatively small contributions from changes in the advection terms (curve 3) and in the vertical velocity (curve 4), which become gradually more significant about 60-100 years after the start of the increase. During the following 1400 years, during which the accumulation rates are held constant, the positive change in lite time rate-of-change of the surface height rapidly decreases as changes in the vertical velocity and advection terms become more dominant, reflecting the increased flow of the ice sheet at only slightly-increased thickness that is forced by the accumulation increase. The effect on the time rate-of-change of the surface height of the accumulation increase measured in ice cores can be estimated, then, by assuming the added snow has the density of near-surface snow at South Pole Station, 360 kg m −3 (Mosley-Thompson and others, 1995), and the accumulation increase is about 20%, after 20 years, of the 0.22 m a−1 mean accumulation (ice equivalent) throughout the area north of 72°S, which has been measured by satellite altimeters dating from 1978 (Lingle and Covey, 1998). The implied positive change in the time rate-of-change of the height of the snow surface is about 0.11 m a−1. This simple rough estimate should be a maximum, because the increased rate of loading from surface snow should also increase the rate of compaction of the underlying firn.
5. Conclusions
The evaluation of the internal consistency of the shallow-ice approximation presented here shows that the shear strain rates are greater than the longitudinal strain rates by more than a factor of 10 over 97% of the inland Antarctic ice sheet, by more than a factor of 50 over 80% of the area, and by more than a factor of 100 over 57% of the area, for the case of no basal motion, where the inland ice sheet is defined as the area above 1500 m in East Antarctica and above 950 m in West Antarctica. For the case of “moderate” basal motion on a hypothesized thin delbrmable bed, the shear strain rates are greater than the longitudinal strain rates by more than a factor of 10 over 87% of the inland ice
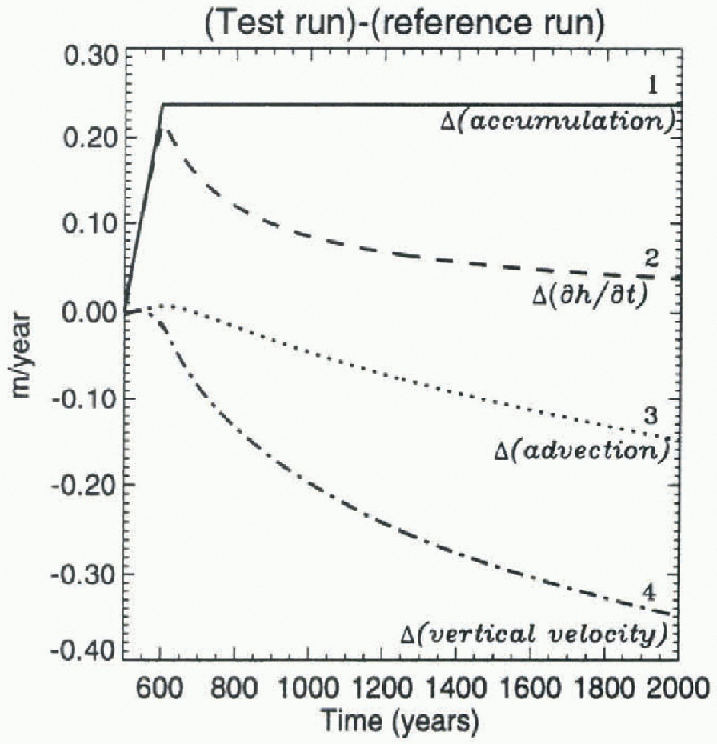
Fig. 6. The changes in the terms of the surface kinematic equation between the test run and the reference run plotted as a function of time at point A (Fig. 4).
sheet, by more than a (actor of 50 over 57% of the area and by more than a factor of 100 over 33% of the area. These results indicate that the shallow-ice approximation is reasonably well justified within vertically integrated and three-dimensional ice-sheet models for most regions of the inland Antarctic ice sheet, i.e. away from the coastal regions that tend to be characterized by ice-stream flow.
The results of the experiment with increasing accumulation suggest that the relatively short-term (30-40 year) increase in accumulation rates on the East Antarctic ice sheet observed in a number of widely spaced ice cores (Pourchet and others, 1983; Morgan and others, 1991; Mosley-Thompson and others, 1995) is capable of accounting for a comparable positive change in the time ratc-of-change of the surface height during this relatively short time period. Over longer times, as the model ice sheet approached a new equilibrium due to sustained constant accumulation at a higher rate, the positive change in the time rate-of-change of the surface height decreased as increases in the vertical velocity and in the advection terms of the surface kinematic equation became more significant.
Acknowledgements
We thank the Cray Research Inc., University Research and Development Grant Program for supporting this work; the Arctic Region Supercomputing Center at the University of Alaska Fairbanks for providing computational support; the NASA Polar Research Program for providing additional support (grant NAG5-4981) to C. Lingle; E. Mosley-Thompson for providing data on snow-accumulation rates from her remote coring site on the East Antarctic plateau; the Australian glaciology group and N. Greeley for providing the digitized Antarctic data used as input for this model; and R. Greve, an anonymous reviewer and R. Hindmarsh for comments that improved the manuscript.


