Introduction
Surface melt on glaciers is directly determined by the surface energy balance. This can be used to calculate glacier mass balance as well as the sensitivity of glacier mass balance to temperature changes. The energy budget consists of long- and shortwave radiation fluxes and turbulent heat fluxes. The importance of turbulent heat fluxes in the energy budget has been measured to vary from 20% to 40% (Reference KuhnKuhn, 1979; Reference Van den BroekeVan den Broeke, 1996; Reference OerlemansOerlemans and others, 1999), which are relatively small values. However, turbulent heat fluxes need to be studied in connection with climatic changes since they are sensitive to changes in temperature.
Turbulent heat fluxes are often determined using bulk formulas, which requires knowledge of the turbulent exchange coefficient. The exchange coefficient is dependent on the topographic roughness length that controls the drag coefficient, and on the wind speed and atmospheric stability.
Using the residual method, an averaged turbulent exchange coefficient valid for the melt season at a specific location can be determined empirically from meteorological data when data are available for the entire melt season (Reference OerlemansOerlemans, 2000). The ablation curve calculated from the energy balance is fitted to the observed melt curve. The fit is achieved by adjusting the exchange coefficient in the bulk formulas for turbulent heat fluxes. This methodology allows the average exchange coefficient over several seasons to be determined using only simple robust instrumentation that can be placed and left unattended on melting glacier surfaces.
In this study, the residual method is applied to automatic weather station (AWS) data collected in the ablation area of three sites in Iceland, Switzerland and West Greenland respectively. The uncertainty of the residual method is then assessed with regard to the energy- and mass-balance measurements.
The Energy Balance and the Residual Method
The calculation of the energy balance follows Reference OerlemansOerlemans (2000). The rate of change of mass is calculated from

where B is the surface energy flux, L m = 3.34× 10⁵ J kg–1 is the latent heat of melting, Hla is the latent heat flux, and Lv = 2.5×10⁶J kg-1 is the latent heat of vaporization. During the melt season a layer of ice near the surface in a temperate glacier is close to isothermal at a temperature around 0°C, so the subsurface flux can be neglected. Melting occurs when B>0. The last term in the equation describes the mass exchange between the surface and the atmosphere, determined by the latent-heat flux, and is generally a much smaller term.
The surface energy flux is found from
where S n and Ln are net short- and longwave radiative fluxes respectively, and Hse and Hla are sensible- and latent-heat fluxes.
Both incoming and outgoing shortwave radiation are measured on all sites, but the longwave radiation for Vatnajökull, Iceland, is calculated from measurements of air temperature, humidity and cloudiness as follows. The surface emits longwave radiation according to the Stefan-Bolzmann law, so the net longwave radiation is
where Lin is the ingoing flux of longwave radiation, ε s = 0.95 is the longwave surface emissivity, σ= (5.67×10⁻⁸) W m–2K–4 is the Stefan-Bolzmann constant, and Ts is the surface temperature.
The cloudiness is determined from the measured global radiation in order to calculate the incoming longwave radiation. Following Reference OerlemansOerlemans (2000), a sine function is adjusted to the measured global radiation, and this curve approximates a clear-sky envelope, SE, of the mean global radiation when cloudiness is zero. The incoming longwave radiation depends on the transmissivity of the cloud, assumed to be determined by the ratio
Reference Greuell, Knap and SmeetsGreuell and others (1997) determined a relationship between the transmissivity and the cloudiness n, from meteorological observations on Pasterzenkees, Austria, as
where the constants are a = 0.415 and b = 0.233. When Tn> 1 the cloudiness is set to zero.
The incoming radiation is calculated using a parameterization determined for Vatnajökull. The longwave incoming radiation is found from
where ε cs and ε ov are atmospheric emissivities for clear sky and overcast sky respectively, p is a constant and T2m is air temperature at 2 m. Reference BrutsaertBrutsaert (1975) derived an equation analytically for the dependency of the clear-sky emittance on the amount of water vapor and the air temperature. This equation is valid for simple atmospheric profiles of temperature and vapor pressure, and it neglects the presence of greenhouse gases other than water vapor. Reference Konzelmann, van de Wal, Greuell, Bintanja, Henneken and Abe-OuchiKonzelmann and others (1994) modified the equation to account for greenhouse gases other than H2O, yielding

where b’ is a constant, T a is the air temperature, e a is the atmospheric vapor pressure and m is an integer > 7. Reference Greuell, Knap and SmeetsGreuell and others (1997) determined the number 0.23 in Equation (7) using a numerical radiative band model. Reference De Ruyter de WildtDe Ruyter de Wildt (2002) determined p = 3 and εov = 0.976 in Equation (6) and b’ = 0.485 and m=8 in Equation (7) for AWS A4. The saturated vapor pressure, esat, 2 m over a water surface, or over melting ice, depends on the temperature as given by the Clausius-Clapeyron equation (Reference StullStull, 2000). The atmospheric vapor pressure at 2 m is then found from the measured relative humidity, RH, as
The relative humidity does not vary significantly over the elevation range 2-3.5 m (Reference DenbyDenby, 2001), so the measured relative humidity at 3.5 m is used without further corrections.
Logarithmic profile relations valid for a statically neutral surface layer (Reference StullStull, 2000) are used to derive the 2 m temperatures for the radiation calculations and the 2 m wind speed for the calculations of the turbulent fluxes from values measured at 3.5 m elevation. For measured temperatures above zero a roughness length of zt 0 = 1.0×10⁻⁴ m is used. For measured temperatures below or equal to zero, the 2 m temperature is set equal to the measured temperature. The wind speed is zero at a height equal to the aerodynamic roughness length, here assumed to be z v0 = 2.0×10⁻³ m.
Bulk formulas for the turbulent heat fluxes can be used when only single measurements of temperature, wind speed and humidity are available, by applying empirical relations to these data to determine surface and 2 m values. The bulk formulas include two unknown coefficients determining the turbulent exchange of latent- and sensible-heat fluxes. The coefficients for latent- and sensible-heat fluxes are almost equal (Reference OerlemansOerlemans, 2001), and here we consider only the so-called turbulent exchange coefficient valid for both cases. The sensible-heat flux is found as
where ρ a is air density, c p is specific heat of dry air and C h is a turbulent exchange coefficient. The latent-heat flux is calculated from
where e 2m and e s are water-vapor pressure at 2 m and the surface respectively, and P is air pressure.
The uncertainty of the turbulent exchange coefficient
Uncertainties in the measured or parameterized terms contribute to the total uncertainty in the determined turbulent exchange coefficient. The various terms containing uncertainties are melt rate, net short- and longwave radiation, screen level and 2m temperature, screen level and 2 m saturated vapor pressure, 2 m wind speed, and air pressure. The uncertainty in the turbulent exchange coefficient is estimated using error propagation of measurement uncertainties based on theory for statistical uncertainties (Reference Bevington and RobinsonBevington and Robinson, 1992). It is assumed that there are no covariances between any uncertainties. The uncertainty is then found as

where

and where
![]() is given by
is given by

Applications
The method is applied in the ablation area of three glaciers. The meteorological data are collected using AWS by the Institute for Marine and Atmospheric Research, Utrecht University (IMAU). At all three sites, AWSs are placed on the ice surface and allowed to melt down with the surface so that the instrumentation is at a constant height of 3.5 m above the surface. Sonic rangers, for measuring changes in surface height, are attached to poles drilled into the ice surface.
Study areas and measurements
A glacio-meteorological experiment (VATEX-96) was carried out in summer 1996 at Vatnajökull ice cap to determine the relationship between mass and energy balance (Reference OerlemansOerlemans and others, 1999). It was found that during the 1996 melt season, radiation provided two-thirds of the melt energy, and turbulent fluxes one-third. The importance of turbulent fluxes decreases with increased elevation.
In this paper, the applied data from Iceland cover the 1998 and 1999 melt seasons (period: 25 February 1998 to 16 September 1999). In the VATEX-96 experiment the data are recorded by AWS A4, located in the ablation area at 279ma.s.l. (approximately 64˚ N, 16˚W) on Breidamerkurjökull, an outlet glacier of Vatnajökull, which extends down to sea level. AWS A4 is 1.2 km from the ice edge, at a surface slope of 4˚. During the VATEX experiment the surface melted from a relatively smooth to a rough surface with 2 m hummocks in this area (Reference OerlemansOerlemans and others, 1999).
The meteorological AWS measurements started with the Greenland Ice Margin Experiment (GIMEX-91) in summer 1991 (e.g. Reference Van den Broeke, Duynkerke and OerlemansVan den Broeke and others, 1994; Reference Zuo and OerlemansZuo and Oerlemans, 1996). Data from an AWS site at 514ma.s.l. (approximately 67˚ N, 54˚ W; called S5 in GIMEX-91) for the 1998, 1999 and 2000 melt seasons (period: 21 August 1997 to 8 July 2000) are used here.
Data from Morteratschgletscher, Switzerland, are from a site at 2104ma.s.l. (46˚24’N, 8˚02’E), 500m from the glacier snout, on a 5˚ northward slope. The data cover half of the 1999 and 2000 melt seasons (period: 27 July 1999 to 17 September 2000).
Parameterizations
The three AWSs are differently equipped: for Iceland, longwave radiation must be parameterized following Reference OerlemansOerlemans (2000) and Reference De Ruyter de Wildtde Ruyter de Wildt (2002) as described in ‘The energy balance and the residual method’ (p. 367); for Greenland the average relative humidity is taken from numerical modeling results (Reference DenbyDenby, 2001); while for Switzerland all terms in the applied equations for the energy budget are measured, except of course the turbulent exchange coefficient.
Results and Discussion
Energy balance
The parameterization of the longwave radiation at Iceland yields values in the range –65 to 45Wm–2 (see Fig. 1). The average components of surface energy fluxes during the melt seasons are shown in Figure 2. Only the surface energy components measured during melt periods are included in this figure. The terms in the energy balance for the different locations are quite similar, with the major contribution to surface melt coming from shortwave radiation fluxes, ranging from 110 to 155 W m–2, or 65% to 90% of the total surface energy flux. The turbulent heat-flux contribution ranges from 30 to 55 Wm–2 , or 16% to 33% of the total surface energy flux.
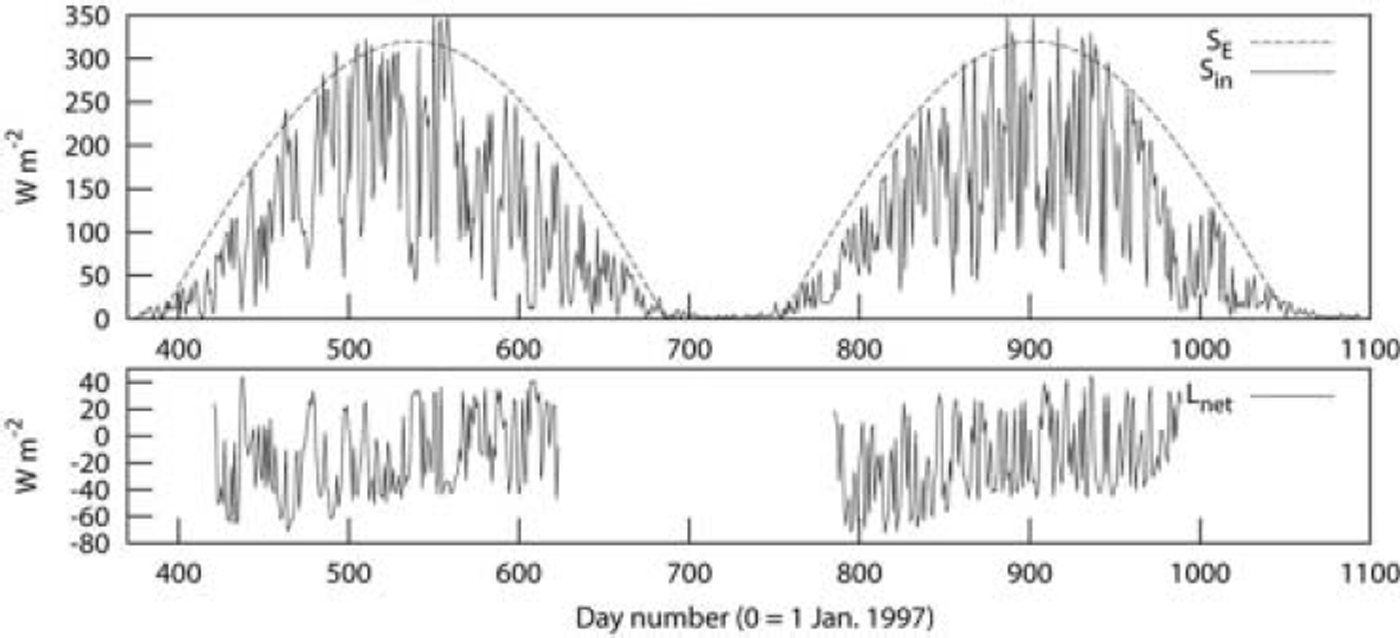
Fig. 1. Longwave parameterization for Vatnajökull. Upper panel: SE is the fitted clear-sky envelope and Sin is shortwave global radiation. Lower panel: resulting incoming longwave radiation.
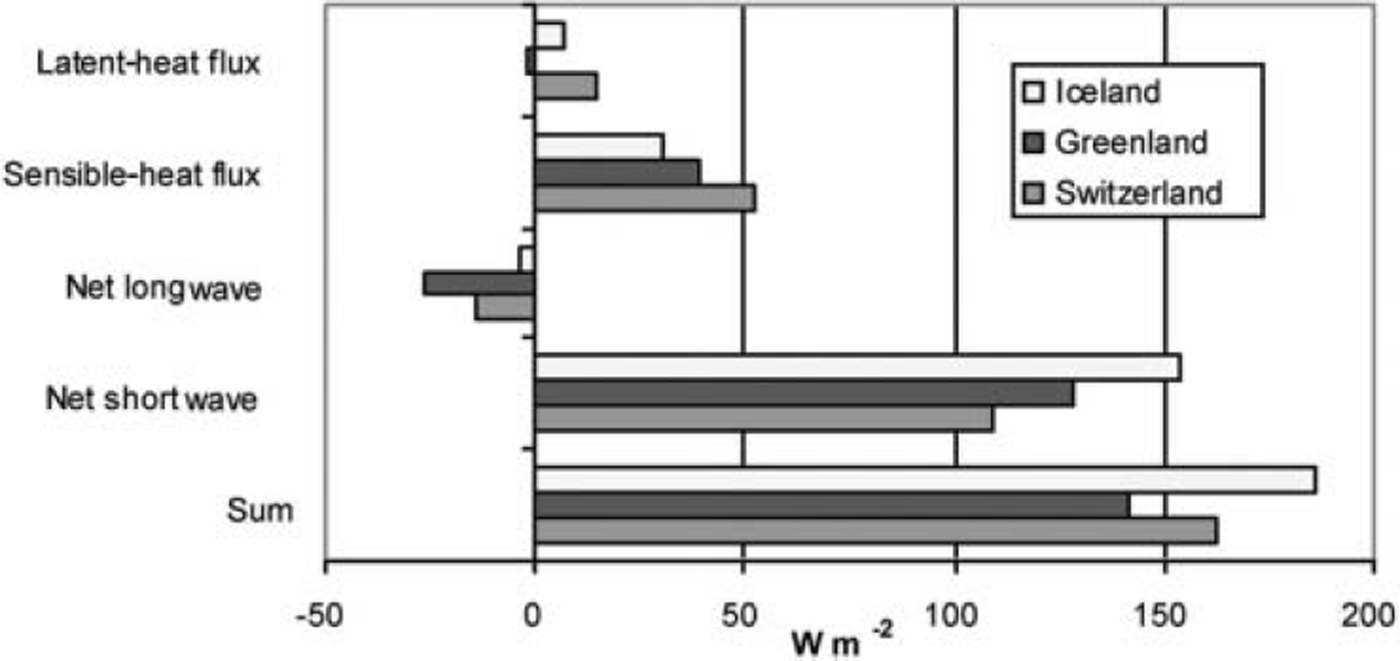
Fig. 2. Average components of surface energy flux during the melt season.
Exchange coefficients and melt curves
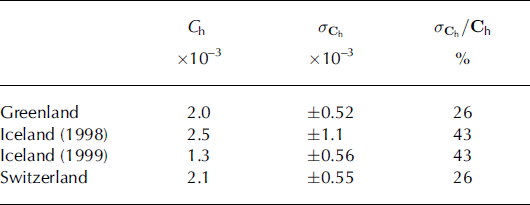
The melt curves, according to the determined average exchange coefficients for all seasons, are shown in Figure 3. The estimated coefficients are: for Vatnajökull, Ch = 2.5×10⁻³ and Ch = 1.3×10⁻³ for the 1998 and 1999 seasons respectively; for Morteratschgletscher, Ch = 2.1×10⁻³; and for West Greenland, Ch = 2.0×10⁻³ for all seasons (Table 1). To avoid uncertainties connected to density differences for snow and ice in the equations, all melt curves are fitted during periods without snowfall, i.e. during melting of pure ice.
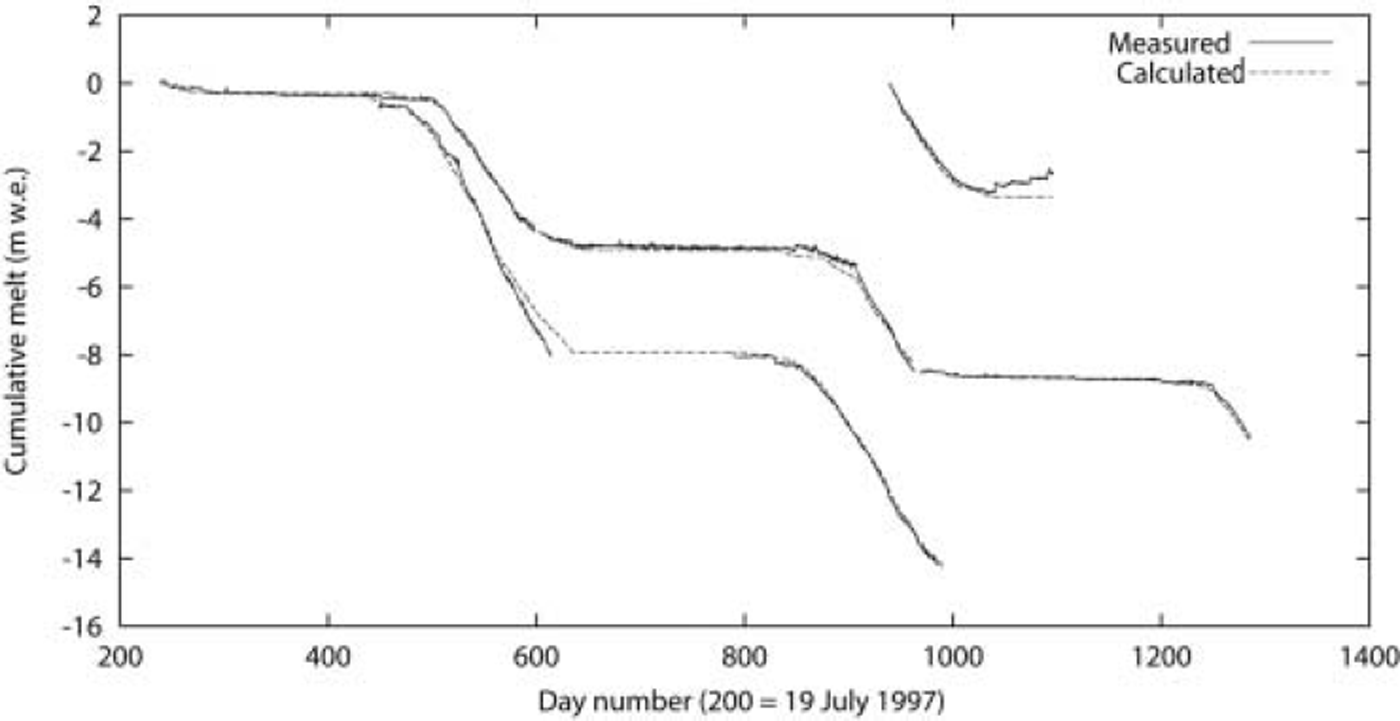
Fig. 3. Measured and calculated melt curves for the three sites. The curve covering one season is for Morteratschgletscher, the curve covering two seasons is for Vatnajökull, and the curve covering three seasons is for Greenland. For Vatnajökull the coefficient Ch = (1.3 ± 0.55)×10–3 for 1998 is used for both seasons, and the curve displays the deviation between measured and calculated melt by the end of the 1998 melt season, near day 600.
Table 1. Determined turbulent exchange coefficients using the residual method, and estimated uncertainties
The derived exchange coefficient for Greenland is consistent for the three melt seasons, but the exchange coefficient for Iceland is derived separately for the two melt seasons as they are found to differ significantly. In addition, the melt curves for Iceland show better fits when a lower exchange coefficient at the start of the melt season is used.
Possible explanations for larger interannual and inter-seasonal variability of the exchange coefficient at Vatnajökull A4 station compared to the Greenland dataset may be found in spatial differential melt due to volcanic ash layers on the glacier surface. As already mentioned, ice hummocks up to 2 m high develop in the A4 area during the melt seasons (Reference OerlemansOerlemans and others, 1999), so the measured melt curve may not be in agreement with the AWS data.
Uncertainties
To evaluate the uncertainty of the parameterization of the longwave radiation carried out for Iceland, the Morteratschgletscher dataset from 1999 was tested with a similar parameterization, taken from Reference OerlemansOerlemans (2000). The parameterized net longwave radiation was then compared to the 1999 measurements, and a mean difference of 16Wm–2, with a standard deviation of 16Wm–2 , was determined. However, the persisting overcast conditions at Vatnajökull are likely to reduce the accuracy, and the uncertainty for the parameterized net longwave radiation is set to 20 W m–2. An intercomparison of parameterized and measured values by Reference Konzelmann, van de Wal, Greuell, Bintanja, Henneken and Abe-OuchiKonzelmann and others (1994) for Greenland gave slightly smaller values, 1 0 ± 4 Wm–2 for clear-sky conditions and -8 ± 5 W m–2 for overcast conditions.
The total uncertainty in the calculated exchange coefficient is dependent on energy-balance measurement and calculation uncertainty, as well as mass-balance measurement uncertainty. Uncertainties in the energy-balance values are determined and the results range from 26% to 43% of Ch (Table 1). The estimate of the total uncertainty is based on typical values for the measurement uncertainties listed in Table 2. These are in the same range as estimates given by Reference Konzelmann, van de Wal, Greuell, Bintanja, Henneken and Abe-OuchiKonzelmann and others (1994), where shortwave radiation has an uncertainty of 2-2.5% of its value, while the uncertainty in measured longwave radiation is set at ±10Wm–2.
Table 2. Assumed measurement uncertainties and their contribution to the total estimated uncertainty σ C h. Contribution in % of σ C h is calculated using σ 2
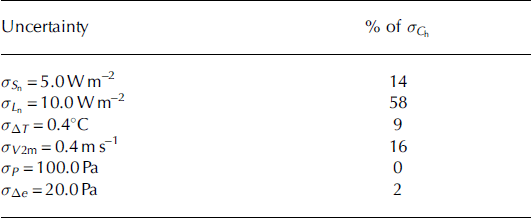
The largest uncertainty comes from the determination of the longwave radiation. When measurements are used, as in Switzerland and Greenland, σ L =10.0 Wm–2 is responsible for 58% of the error in Ch which is found to be 26%. When a parameterized form is used, as in Iceland with σL n = 20.0 Wm–2 the longwave radiation error increases the total error in C h to 43%. The errors introduced by measurements of shortwave radiation, wind speed and temperature are of some importance, while uncertainties from saturated vapor pressure and air pressure are negligible.
Determination of necessary length of measurement period
It is of interest to determine the length of measurement period required to yield negligible contribution from the uncertainty in measured melt to the total uncertainty in C h. For a typical melt rate of 0.04 m d–1 we find that an absolute uncertainty of σ M = 0.01 m in the measured melt will contribute another 47% to the total uncertainty, yielding σ C h as 73% of Ch, for 1 day of measurement (Table 3). The measurement uncertainty decreases significantly over time, so that the measurement error from the sonic ranger hardly contributes to the total uncertainty for the datasets applied here when the measurement period is >1 week.
Table 3. Resulting % increase in σCh for different measurement periods based on a melt rate of 0.01 m d–1 and a height measurement error of 0.01 m
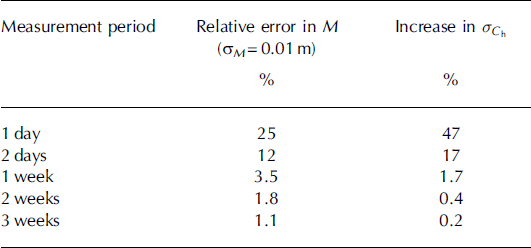
The assumed absolute measurement error of 0.01 m for surface height in the above analysis is based on the assumption of homogeneous melt in the region surrounding the AWS and the sonic ranger. If differential melt occurs on a spatial scale similar to the distance between the two instruments, this error will increase. Previous studies by Reference Braithwaite, Konzelmann, Marty and OlesenBraithwaite and others (1998) indicate differential melt rates of ±10%. In Iceland, differential melt of 25% on a spatial scale of 10-20m was observed during the VATEX experiment (Reference OerlemansOerlemans and others, 1999). If this error were included in the uncertainty calculation it would lead to an error in C h of 73%, similar to the observational error introduced when only 1 day of melt is used to determine the coefficient.
Comparison to previous applications of the residual method at Morteratschgletscher
A turbulent exchange coefficient of C h = (1.27 ± 0.3)×10–3 has previously been determined for Morteratschgletscher using the residual method (Reference OerlemansOerlemans, 2000). The longwave radiation in that study was parameterized using the same method as here for Iceland, but in this study the Morteratschgletscher measurements of longwave radiation are available. The discrepancy between the two results is in the range of uncertainty determined in this study.
Comparison to eddy correlation and profile methods at Iceland
Exchange coefficients were determined for two stations at Vatnajökull using alternative methods by Reference Denby and SmeetsDenby and Smeets (2000) and Reference SmeetsSmeets (2000) using data from the 1996 VATEX campaign. For AWS A4 the eddy correlation method gives average values of Ch = 3.6×10⁻³ and the profile method gives average values of C h = 3.5×10⁻³. However, values varied significantly during the melt season, starting low and increasing as the season progressed, reflecting the change in surface roughness introduced by differential melt.
The authors estimate the uncertainty of these results to be within 10% for the eddy correlation method, and within 20% for the profile method. Considering the uncertainties, these results are in agreement with our results for the 1998 melt season, but not with the results for the 1999 season. For reference, Reference Denby and SmeetsDenby and Smeets (2000) found C h = 2.1×10⁻³ using the eddy correlation method and C h = 1.9×10⁻³ using the profile method for station U3 positioned at 165 ma.s.l., just 1.5 km downslope from A4.
Conclusions
The residual method has been used to calculate the turbulent exchange coefficient, C h, on three different glacier surfaces, and the uncertainty in determining its value has been analyzed and is presented in Table 1. Using assumed uncertainties in measurement values, it is shown that the uncertainty in the calculated exchange coefficient is around 26% when longwave radiation data are available and 43% when a parameterized form is used. The most significant error contribution to the energy-balance calculation comes from the measurement of the longwave radiation, or in the case of Vatnajökull its parameterization. This is responsible for >50% of the total error in C h.
Uncertainty in C h introduced by the measurement of melt rates, i.e. change in the height of the glacier surface, can be reduced by increasing the measurement period. Melt measurements over a period of 1 week reduce the contribution of the error to <2% assuming homogeneous melt in the region surrounding the instrumentation. When differential melt occurs, this can significantly increase the uncertainty in the exchange coefficient and will not be reduced by longer integration periods. This is reflected in the interannual variability of C h for the Iceland site.
The exchange coefficients are compared to other measurements using eddy correlation and profile techniques for the Iceland site. These measurements indicate a higher C h value than has been calculated here, but are within the assumed error for the 1999 melt seasons.
The usefulness of the residual method is determined by the characteristics of the site being studied as well as the instrumentation and length of integration. The site should be snow-free during the observational period and should show homogeneous melt for the methodology to be successful. The use of parameterizations for any of the radiation components is not recommended. Measurements should be conducted for a minimum period of 2 weeks.


