Introduction
Meteorological conditions are key drivers for processes affecting snow-air exchange, and varying meteorological factors change the physical and chemical nature of the snow itself. While year-round unattended meteorological measurements of air temperature, relative humidity, wind speed and snow depth have been in place for some time (e.g. Reference Stearns, Weidner, Weller, Wilson and SeverinStearns and Weidner, 1991), the 1997–98 Summit (Greenland) winter-over experiment provided the first opportunity for manned operations at Summit throughout the winter. Because of the extremely harsh conditions ― darkness combined with very cold temperatures and high winds― unattended instruments in polar regions usually suffer from periods of inoperability due to frosting or freezing of the instrumentation. The winter-over experiment provided a unique opportunity for on-site remediation when needed; the data discussed herein were recorded hourly for the duration of the experiment from June 1997 to April 1998.
This paper discusses the data and energy-balance calculations using the measurements of air temperature, relative humidity wind speed, incoming and reflected solar radiation, incoming longwave radiation and infrared snow-surface temperatures at Summit from June 1997 to April 1998. Surface energy-balance calculations for the duration of the project are presented and seasonal differences in the energy exchange are discussed. Snow-depth measurements from an ultrasonic depth gauge are used to infer the timing of the main accumulation events.
The Data
The data discussed in this paper were obtained at Summit, the site of the drilling of the Greenland Ice Sheet Project II (GISP2) ice core. This is a cold, high-altitude Arctic site that almost never experiences significant snowmelt. Wind-speed, air-temperature and relative humidity instruments were mounted on a tower at heights 2 and 7 m above the snow surface in June 1997. Incoming and reflected solar radiation (0.3–3.0 μm), incoming longwave radiation (3–100 μm) and infrared snow-surface temperature were measured using hemispheric devices (Epply) mounted on a support over undisturbed snow approximately 6 m from the tower. The acoustic snow-depth sensor was suspended from an arm on a pole installed over undisturbed snow approximately 8 m from the tower. A data logger sampled the instruments at high frequency and recorded the data at 30 min intervals throughout the experiment. Once daily, the radiometers were cleared of frost or snow, and the data from the instruments were downloaded daily and the quality checked. On several occasions frost on the wind vanes rendered them inoperable; at these times the frost was manually cleared and the vanes freed.
Figure 1 depicts 24 hour running averages of the measurements for surface energy exchange. The net solar radiation is the difference between the measured incoming solar radiation and the measured reflected solar radiation. The winter period of darkness between October and February is evident. Although solar radiation is a primary driver in the surface energy budget in other seasons, the winter effectively reduces this energy input to zero. The incoming longwave radiation is a measure of the radiative energy coming down to the snow from the sky (clouds, etc.). While there is less variation in the winter, the mean incoming longwave at Summit shows no other distinct seasonal change. Measurements of the 2 m air temperature show that the winter (October-February) has both the coldest average temperatures of the year and the largest temperature variations. Relative humidity is generally higher in summer than in winter, and it should be recognized that the exponential decrease in saturation vapor pressure with temperature causes extremely low absolute humidity in the air in very cold temperatures. Winds also show a seasonal effect: the winter has both the largest peak wind speeds and the longest periods of sustained high winds.

Fig. 1. 24 hour running averages of meteorological datafrom the 1997–98 Summit winter-over measurements: (a) net solar radiation, ( b) incoming longwave radiation, (c) air temperature, ( d) wind speed, (e) relative humidity.
From the aggregate of data in Figure 1 it is evident that the summer at Summit is relatively warm (but not warm enough to cause significant snowmelt) and sunny with low wind speeds, while the winter is cold and dark with higher peak and sustained winds. The higher winter wind speeds serve to change the nature of the snow roughness, and surface relief (sastrugi) was observed to be significantly larger in winter than in summer (Reference Albert and HawleyAlbert and Hawley, 1998).
Energy-Budget Calculations
Using the data presented above, the model of Reference AlbertAlbert (1996) was used to simulate the snow-air energy transfer. While the complete model solves for heat, mass and chemical species transport via both advection (air flow) and diffusion within the snow, for the discussion in this paper, only diffusion of heat and water vapor are modeled; interstitial air flow in the snow was not considered. For brevity, the details of the model are not reiterated here; the details of the full model have been described previously (Reference AlbertAlbert, 1996). The surface energy balance, which follows that of Reference JordanJordan (1991), has been updated to include the stable atmospheric conditions commonly found over expanses of snow, as described by Reference Jordan and AndreasJordan and Andreas (1999). For diffusion processes, results of the modelling compared well with those using SNTHERM (Reference JordanJordan, 1991). The surface energy balance considers the radiation balance, turbulent surface exchange of heat and snow temperature.
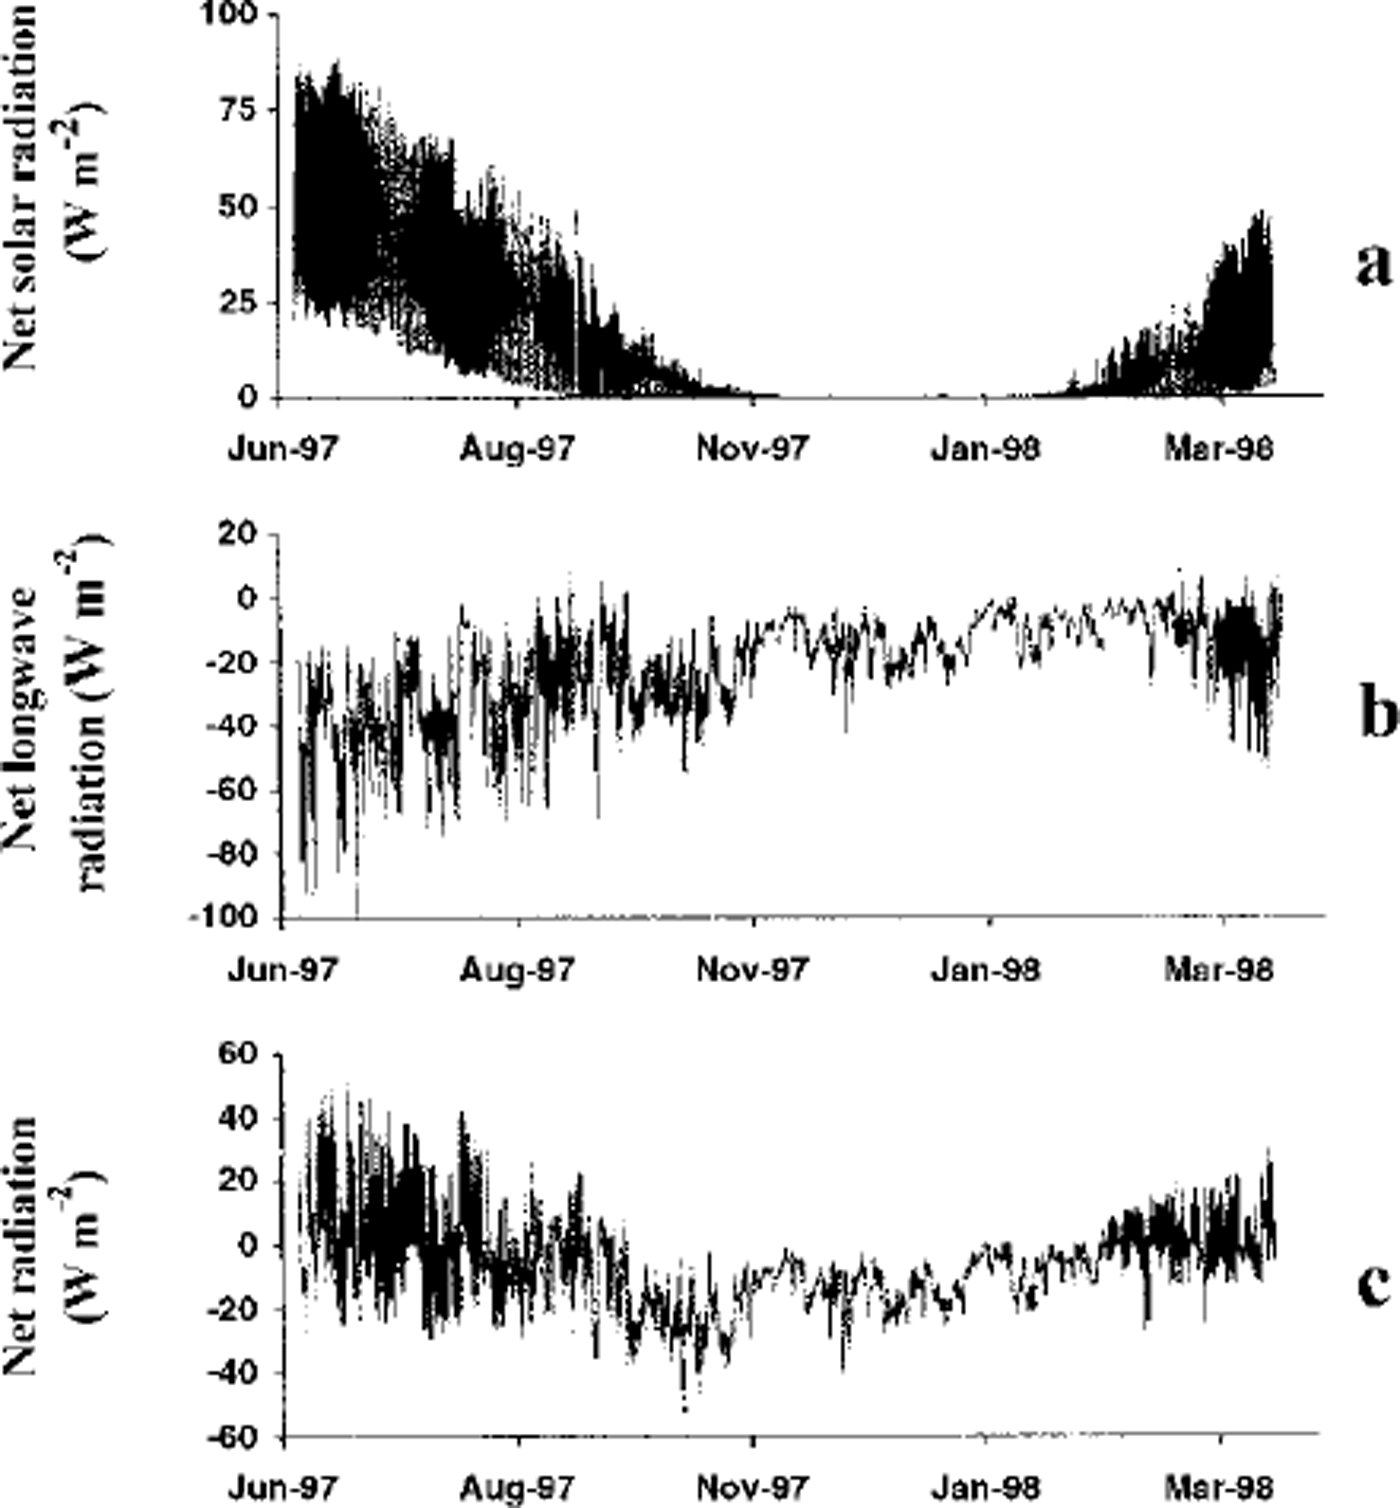
The radiation balance considers incoming and reflected solar radiation and incoming and emitted longwave radiation. In this study, both incoming and reflected components of the solar radiation were measured, along with the incoming longwave radiation. The emitted longwave was calculated using the model. In Figure 2a the 24 hour running average of the net solar radiation (difference between the incoming and reflected radiation) is depicted. Figure 2b depicts the 24 hour running average of the net longwave radiation, which is the difference between the measured incoming longwave and calculated emitted longwave radiation. The negative net longwave radiation represents energy loss by the snow. The net radiation balance, the sum of the net longwave and the net solar radiation, is depicted in Figure 2c. While the solar radiation clearly dominates in the summer, the effects of the low sun angle in summer nights does allow the net night-time radiation to be controlled by longwave radiation then, while that in the daytime is dominated by solar radiation. The winter net radiation loss by the snow is due to longwave radiation.

Fig. 2. Components of the radiation energy balance: (a) net solar radiation (difference between measured incoming and measured reflected solar radiation), (b) net longwave radiation (difference between measured incoming and modeled emitted radiation), ( c) net radiation (sum of the net solar and net longwave radiation).
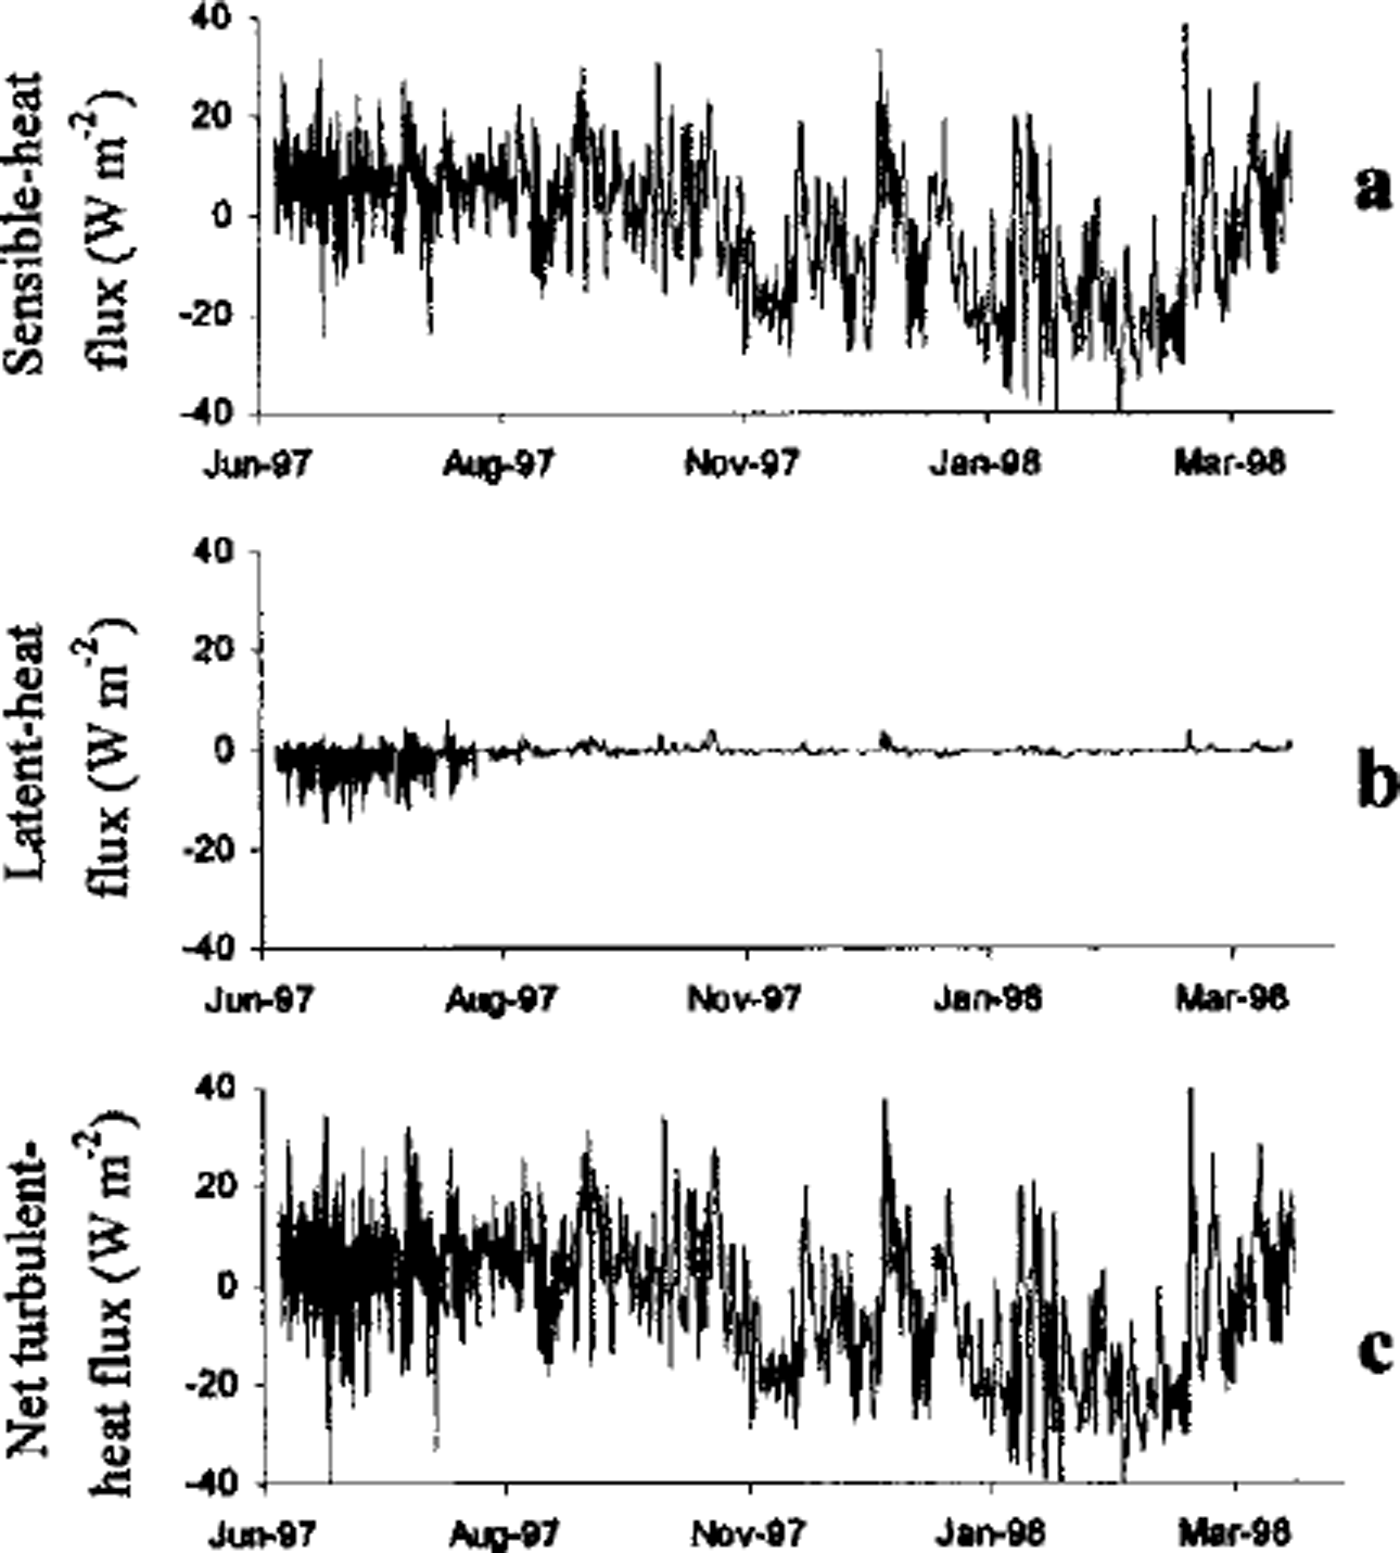
The turbulent surface exchange of heat includes surface sensible- and latent-heat fluxes. These represent energy transfer across the snow/air interface due to differences in snow and air temperature, with advective cooling and sublimation/condensation at the surface. The 24 hour running average of the net sensible-heat exchange is depicted in Figure 3a. Positive sensible-heat exchange represents energy gained by the snow, driven by temperature differences between the air and the snow surface. While the sensible-heat flux can be positive or negative throughout the year on an hourly or daily basis, in general it warms the surface in the summer and cools the surface in the winter. The net latent-heat exchange, due to water-vapor transport and sublimation or condensation, is depicted in Figure 3b. From September to April there is little exchange of latent heat across the snow-air interface. Due to the very cold air and snow temperatures in winter, air cannot hold much water vapor then. The latent-heat flux is very small throughout the winter, except for occasional condensation events of vapor onto the snow, resulting in surface hoar growth. The summer conditions for latentheat are markedly different; it is evident that summer is when most of the water-vapor transport occurs across the snow-air interface in the form of sublimation. The positive fluxes that occur in the summer occur at night-time, and have been observed during fog events to be accompanied by riming of the snow surface. The net turbulent-heat exchange, which is the sum of the sensible- and latent-heat exchanges, is depicted in Figure 3c. Positive turbulent exchange indicates energy gained by the snow, driven by temperature and humidity differences between the air and the snow surface. Sensible heat dominates the net turbulent-heat flux on a seasonal scale. For the total snow-air energy transfer, in general solar radiation dominates during the summer, and sensible-heat turbulent transfer has greatest impact in the winter, but both net radiation and net turbulent heat fluxes are important throughout the year.

Fig 3. (a) Calculated sensible-heat flux at the snow surface; (b) calculated latent-heatflux at the snow surface; (c) calculated net turbulent heat exchange at the snow surface.
When Did it Snow?
The GISP2 ice core retrieved from Summit is termed a high-resolution core because the relatively high accumulation rate there allows the identification of seasonal signals in some chemical species. However, if the snowfall is not uniform throughout the year, the timing of precipitation may induce seasonal biases in the chemical profiles. On-site manual observations are helpful in determining the timing of the snowfall, but during windy periods it is difficult to determine whether the accumulated snow was due to new snowfall or transport of snow by the wind.
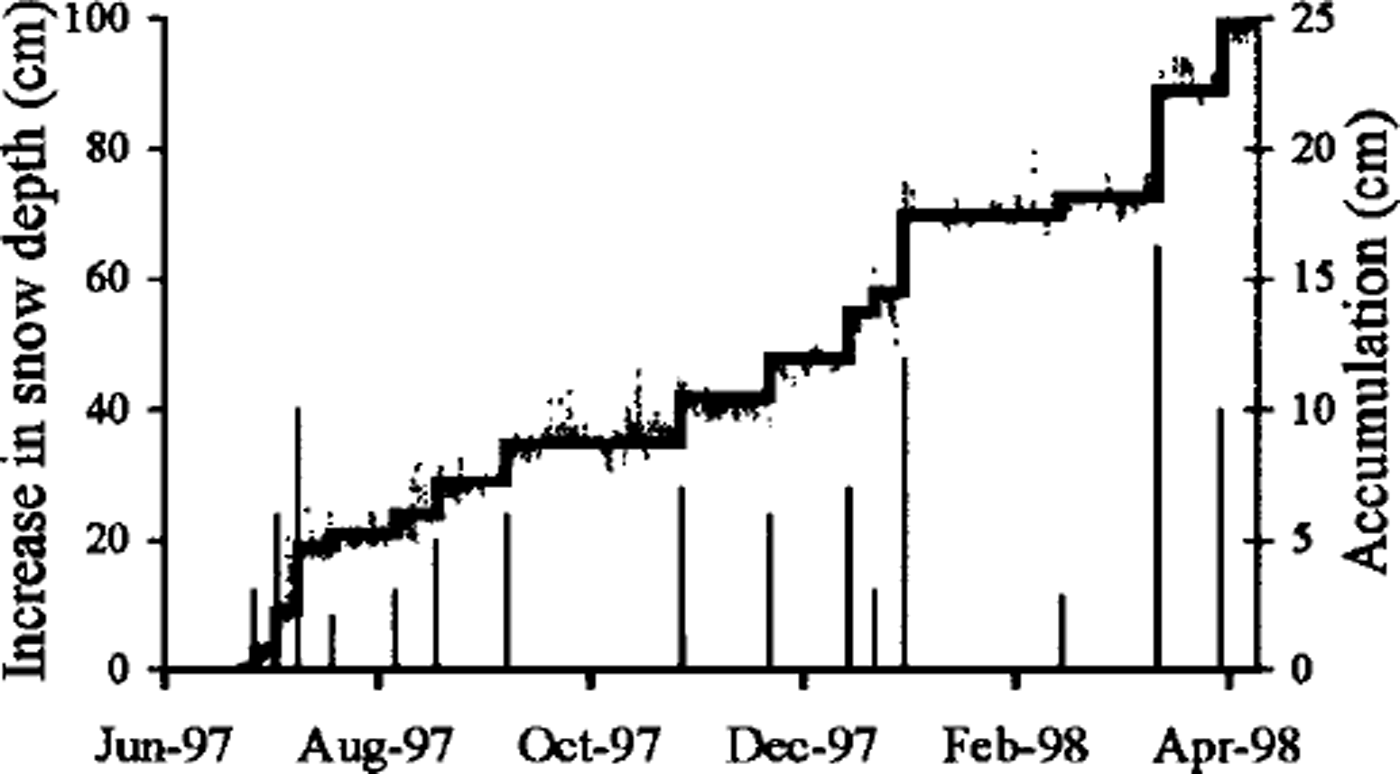
As an estimate of the timing of new snowfall, we discuss the data from the ultrasonic snow-depth sensor. This sensor detects the distance between the sensor (suspended at a fixed location above the snow) and the snow surface. This distance can be affected by the passage of sastrugi, small surface ˚waves" that are moved in time by the wind, by blowing-snow events and by snow accumulation due to precipitation. Usually the blowing-snow events are readily detectable and the data corrected, because in those circumstances the data experience very large, high-frequency oscillations over small time periods. The increase of snow depth over the course of the winter-over experiment is depicted in Figure 4; these data have been cleared of the obvious blowing-snow events. In this figure the dotted line is the measured data using the acoustic snow-depth sensor, the heavy solid line is our visual interpretation of the mean snow depth from the graph of the acoustic measurements, and the thin solid spikes represent the accumulation inferred from the interpreted mean snow-depth increase. From the acoustic sounder measurements, we interpret the relatively small-amplitude oscillations about the mean depth on a time-scale of days to weeks to be the movement of small surface features such as sastrugi across the snow surface under the sensor. Our inferred accumulations indicate that new snow does fall throughout the year at Summit, although (at least in this year) the summer snowfall events appear to be more frequent but with lower peak storm totals than in winter. Some of the surface chemistry samples have confirmed the snowfall events (personal communication from A. Stanzick, 1999). Future work will compare these measurements and snowfall estimates with snow chemistry and visual snow-stake data obtained by other investigators.

Fig. 4. Snow-depth measurements and the timing of accumulation at Summit. The dotted line is the measured data from the acoustic snow-depth sensor, the heavy solid line is our visual interpretation of the mean snow depth, and the thin solid spikes are the accumulation inferred from the interpreted mean snow-depth increase.
Conclusions
The Summit winter-over experiment succeeded in obtaining useful meteorological data for the study of snow-air transfer processes. The surface energy balance has distinct seasonal signatures that show different dynamics between summer and winter energy-exchange processes. Measurements of the 2 m air temperature show that the winter (November-February) has both the coldest average temperatures of the year and the largest temperature variations. In addition, the winter has both the largest peak wind speeds and the longest periods of sustained high winds. Most of the vapor transport across the snow-air interface occurs in the summer, which may be the primary season for near-surface snow metamorphism and chemical transport linked to water-vapor movement. Results from the acoustic snow-depth gauge indicate that snowfall occurred throughout the year at Summit. If accumulation patterns have not changed, this implies that there may not be large seasonal gaps in the precipitation record that would affect ice-core interpretation. The seasonal changes in air temperature, wind speed and radiation cause seasonal changes in the surface energy balance and snow-surface characteristics; differences in snow-air exchange processes and snow chemistry are also to be expected. Thus seasonal differences in snow-air exchange processes may potentially have an impact on the ice-core record.
Acknowledgements
The authors gratefully acknowledge the assistance of S. Sturges and the support of the other staff from the Summit 1997–98 winter-over program. We also thank U. S. National Science Foundation (NSF) Research Experience for Undergraduates program student E. Shultz for assistance with data reduction, and two anonymous reviewers for constructive comments. This work was funded by NSF grant NSF-OPP 9530738.


