Introduction
When sea water freezes, the resulting sea ice generally contains pure ice crystals, as well as brine and gas pockets. Granular ice, formed from the consolidation of a layer of tiny ice crystals at the air/ocean interface (Reference Maus and RosaMaus and De la Rosa, 2012; Reference Naumann, Notz, vik and SirevaagNaumann and others, 2012, and references therein), grows downwards, with faster growth on the crystal basal plane than in the c-axis direction (Reference HilligHillig, 1959). The aspect ratio of this anisotropic growth, i.e. the growth rate in the basal plane divided by that in the c-axis direction, lies in the range 20–100 (Reference Smedsrud and JenkinsSmedsrud and Jenkins, 2004; Reference Kawano and OhashiKawano and Ohashi, 2009). Consequently, as the ice grows, geometric selection filters out the granular crystals with c-axes close to the vertical (Reference Kolmogorov and KvoprosuKolmogorov, 1949), and columnar ice is formed with c-axes lying close to the horizontal plane. We refer to the sea ice that forms by conduction of heat through the sea ice to the atmosphere as congelation ice.
Around the coast of Antarctica, sea ice often grows in water that has been supercooled by ocean–ice-shelf interactions (e.g. Reference Lewis and PerkinLewis and Perkin, 1986). Tiny crystals exist within this supercooled water column. These crystals rise to the surface and deposit under the sea-ice cover to form a porous layer in an evolving state of consolidation. The least consolidated portion is called the sub-ice platelet layer (e.g. Fig. 1). Eventually heat loss to the atmosphere, as well as to the near-surface supercooled ocean, causes these crystals to become frozen into the sea-ice cover as incorporated platelet ice (Reference Smith, Langhorne, Haskell and TrodahlSmith and others, 2001; Reference Dempsey, Langhorne, Robinson, Williams, Haskell and FrewDempsey and others, 2010; Reference Gough, Mahoney and LanghorneGough and others, 2012a). Platelet ice is therefore important because it is a surface expression of processes that take place deep in an ice-shelf cavity. These processes may influence sea-ice thickness (e.g. Reference Hahn-WoernleHellmer, 2004) and extent (Reference Bintanja, Van Oldenborgh, Drijfhout and WoutersBintanja and others, 2013). Further, because the sub-ice platelet layer is highly porous and provides a stable surface for algal attachment, it harbours some of the highest accumulations of sea-ice algae found anywhere on Earth (Reference Arrigo and ThomasArrigo and Thomas, 2004).

Fig. 1. The sub-ice platelet layer captured with an underwater camera (courtesy A.J. Gough and A.R. Mahoney). Note that the scale between the red lines is 0.05 m.
In addition, platelet ice influences the measurement of sea-ice thickness. There are three major techniques for obtaining sea-ice thickness: drilling, electromagnetic induction sounding, and airborne and satellite altimeter measurements (Reference Haas, Druckenmiller, Eicken, Gradinger, Salganek, Shirasawa, Perovich and LeppärantaHaas and Druckenmiller, 2009). Within limitations posed by the snow-cover thickness, these methods are fairly well developed for congelation ice, particularly in the Arctic (Reference Haas, Druckenmiller, Eicken, Gradinger, Salganek, Shirasawa, Perovich and LeppärantaHaas and Druckenmiller, 2009). Around regions of coastal Antarctica, on the other hand, the situation is further complicated due to the highly porous, sub-ice platelet layer. For electromagnetic induction thickness estimates, a value of the solid fraction of the sub-ice platelet layer is needed to constrain the electrical conductivity for the inversion algorithm. The solid fraction of this layer is also needed to derive sea-ice thickness from freeboard, using the assumption of hydrostatic equilibrium and altimeter measurements. Reference Price, Rack, Langhorne, Haas, Leonard and BarnsdalePrice and others (2014) have recently demonstrated that sea-ice thickness, derived from freeboard estimates, may be in error by up to 20% because of the presence of a sub-ice platelet layer.
It remains a challenge to directly measure the solid fraction by sampling. A variety of methods has been applied to obtain the solid fraction of the sub-ice platelet layer (f s), and Reference Gough, Mahoney and LanghorneGough and others (2012a) have summarized typical estimates from several authors to be between 0.2 and 0.5. The most accurate value to date is fs = 0.25 ± 0.06, based on the heat flux measurements of Reference Gough, Mahoney and LanghorneGough and others (2012a).
One possible way to obtain this sub-ice platelet layer solid fraction is to simulate a number of ice platelets floating up from depth, being deposited and continuing to grow locally under the sea-ice cover. In short, it is a solidification problem. There are many methods available to solve this type of problem (e.g. the level set method (Reference Tan and ZabarasTan and Zabaras, 2006), the phase field model (Reference KobayashiKobayashi, 1993), cellular automata (Reference Spittle and BrownSpittle and Brown, 1994) and smoothed particle hydrodynamics (Reference MonaghanMonaghan and others, 2005)). The accuracy of those models is superb, but the complexity of the mathematics and the demand on computational resources are also at a high level, especially for simulations in three dimensions (3-D). Taking these factors into account, Voronoi dynamics (Reference Ohashi, Sasaki and YoshimuraOhashi and others, 2004) is a flexible and simple but efficient method to simulate the physical processes of interest here. This technique divides space into a set of points (or seeds) and for each seed there is a corresponding region consisting of all points closer to that seed than to any other. The construction of a set of rules allows crystal growth kinetics to be simulated.
Reference Kawano and OhashiKawano and Ohashi (2006) performed such simulations in two dimensions (2-D) and report that their simulated value of brine area fraction from Voronoi dynamics, combined with salinity concentration in a 2-D domain, is higher than that of laboratory-grown sea ice. They point out that the missing dimension may cause loss of generality in their simulation. Their more recent paper (Reference Kawano and OhashiKawano and Ohashi, 2009), in which heat conduction and salinity diffusion are included, is also limited to a 2-D approximation.
In an independent study, Reference DempseyDempsey (2008) and Reference Dempsey, Langhorne, Robinson, Williams, Haskell and FrewDempsey and others (2010) used a purely mechanical model of Voronoi dynamics to simulate the accumulation and growth of platelet ice. Their results have some limitations, especially with regard to the lack of thermodynamic and fluid dynamic processes. Most importantly, the temporal evolution of solid fraction and the resulting salinity profile require thermodynamic implementation.
Recently, Reference Hahn-WoernleHahn-Woernle (2011) introduced two simulations with the inclusion of heat and salt transport. The first is a one-dimensional Voronoi model which simulates the vertical growth of a sea-ice slab due to heat conduction through an air-ice-sea stack with varying thermal constants. The heat flux and salt diffusion can be monitored numerically. The second is a 2-D model of the growth of an individual platelet crystal through a vertical cut. Voronoi dynamics, including heat and salt constraints, was again used.
In this paper, we build a direct numerical simulation using Voronoi dynamics with diffusive heat and mass transfer. A 3-D model is necessary to understand the spectrum of growth processes in sea ice, and platelet ice in particular, starting from individual crystals in the water column and leading to the formation of a sub-ice platelet layer. Furthermore, we take into account the advancing interface, driven by heat loss to the atmosphere, and the deposition of ice crystals from the ocean to create different scenarios that imitate the natural process of incorporated platelet ice formation. In a similar process to taking a sea-ice core, we extract the solid fraction, temperature, salinity and crystal orientations from virtual sea-ice cores through the 3-D model domain, and compare the results to physical sea-ice cores retrieved from Antarctica.
Voronoi Dynamics with Diffusive Heat and Mass Transfer
The model is built in a 3-D domain Ω(r, t). This is discretized into cells and each cell has four 3-D matrices associated with it: solid fraction φ(r, t), characteristic number K(r, t), temperature T(r, t) and salinity S(r, t), where r = (x,y,z) and t are the position vector and time respectively. K(r, t) identifies whether a cell is brine, ice-brine mixture or is labelled as an ice crystal to preserve its crystal orientation.
Voronoi dynamics
Consider a crystal i with seed position c i , c-axis c ? and characteristic number Ki. The magnitude of the relative position |r– c i | of a point with position r in the domain Ω(r, t) from position ci (Fig. 2) is stored in the displacement matrix as

Fig. 2. An ice crystal is seeded at c i with orientation or c-axis direction ĉ. r is a position vector relative to xyz coordinates. r – c i (grey vector) represents a relative displacement from a certain position in space to the seeding position. Gc and G b are growth functions in the c-axis direction and the basal plane, respectively.
The Voronoi dynamics condition, which contains information about ice crystal growth kinetics,
is well posed and ready to iterate (Fig. 3). V is the time step for the Voronoi dynamics condition. In Eqn (2), Gi(r) is the growth matrix of an ice crystal, which is defined as (Dempsey and
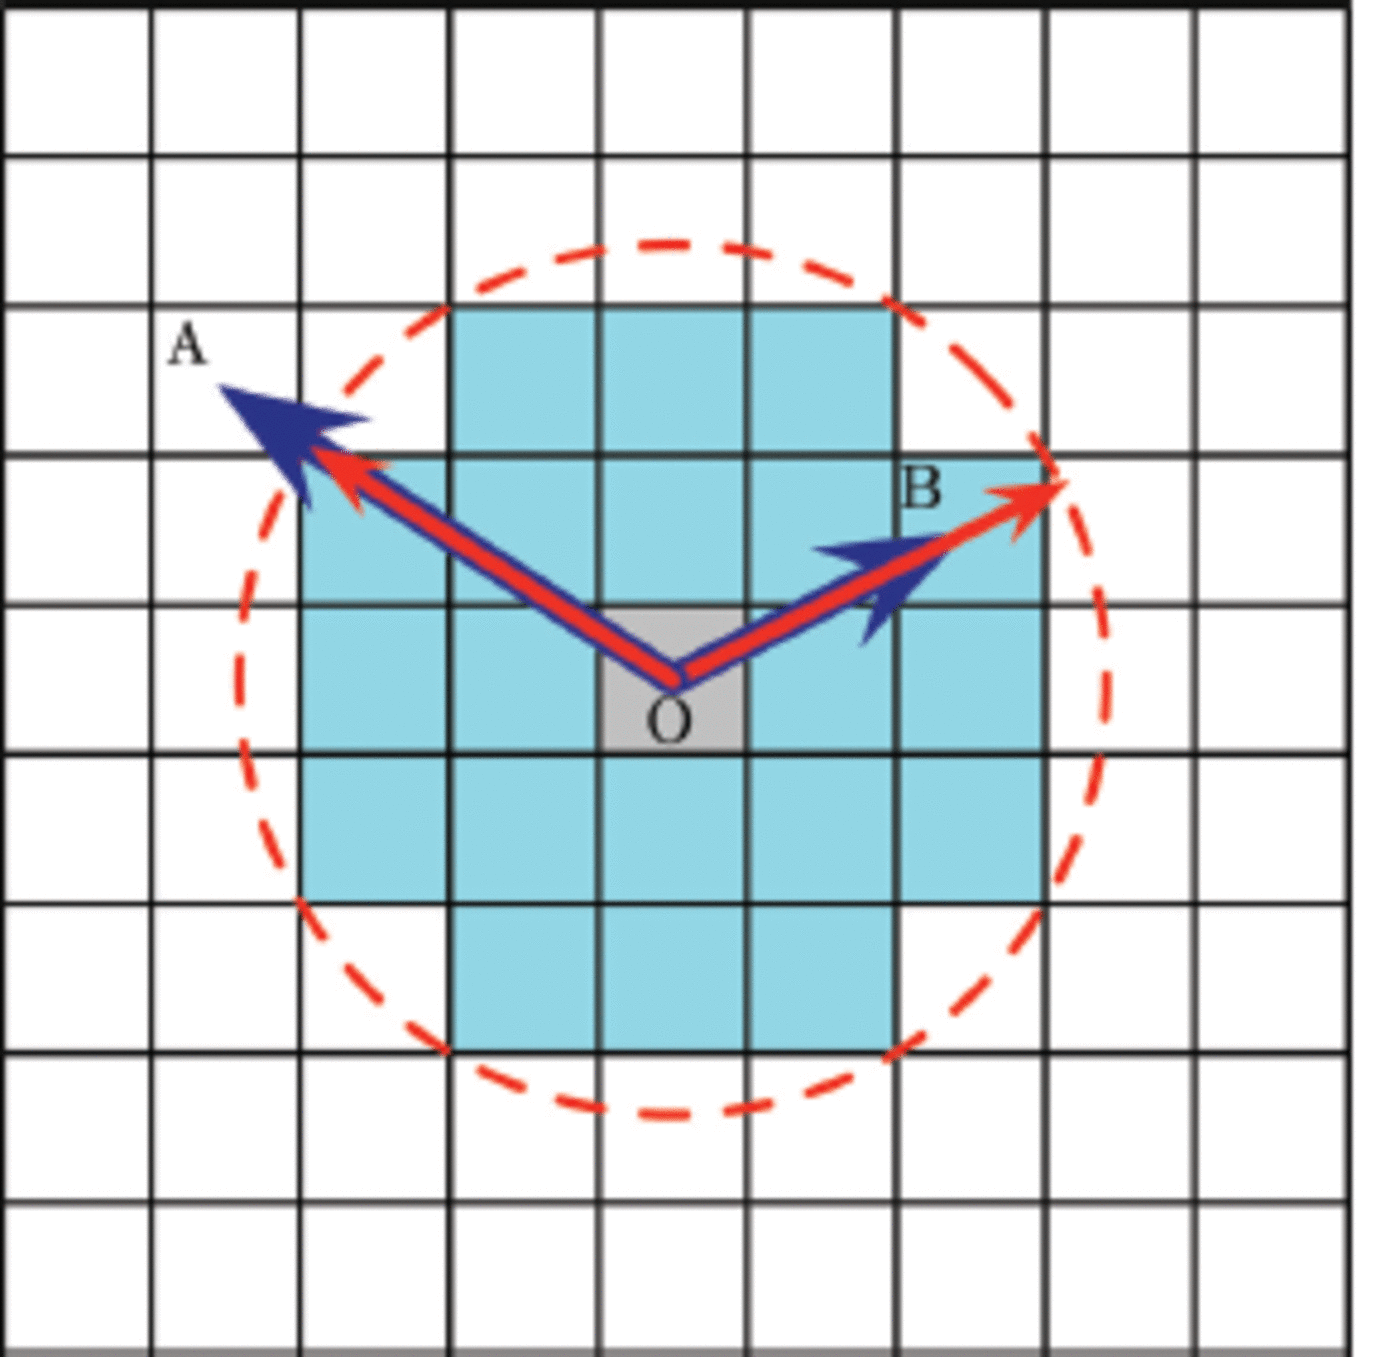
Fig. 3. To illustrate how Voronoi dynamics works, consider the liquid domain (white) in two dimensions. An ice cell (grey) is seeded at position O and it grows iteratively to form the connected ice cells (light blue) which we call the crystal. The displacement of other cells from cell O and the growth functions are calculated in advance and kept in the R and G matrices. At a certain time t, consider cells A and B. Their displacement vectors ![]() and
and ![]() are drawn with blue vectors. Note that these two vectors are time-independent. Their growth functions, describing the crystal growth kinetics, multiplied by time (Gt) are represented by a red dashed contour which we call here the ‘Voronoi front’. For cells of interest, we can construct red vectors from point O to this front and in the same direction as their displacement vector. These two vectors are compared for each cell. If the Voronoi dynamics condition (R Gt ˂ 0) is satisfied and if the cell is adjacent to at least one ice cell, it can grow or flip to an ice cell at this time. Thus at the time illustrated, A remains liquid while B becomes solid.
are drawn with blue vectors. Note that these two vectors are time-independent. Their growth functions, describing the crystal growth kinetics, multiplied by time (Gt) are represented by a red dashed contour which we call here the ‘Voronoi front’. For cells of interest, we can construct red vectors from point O to this front and in the same direction as their displacement vector. These two vectors are compared for each cell. If the Voronoi dynamics condition (R Gt ˂ 0) is satisfied and if the cell is adjacent to at least one ice cell, it can grow or flip to an ice cell at this time. Thus at the time illustrated, A remains liquid while B becomes solid.
where Rb and Rc are the magnitudes of the basal-plane and c-axis components of |r ci|, respectively. Similarly G b and Gc are growth functions on the basal plane and along the c-axis. Except where crystals are deposited from the ocean, Gb and Gc are constant in this paper, i.e. G b = g b and Gc = gc , where gb and gc are growth rates on the basal plane and along the c-axis. The aspect ratio is defined as a = gb/gc which is chosen such that geometrically an oblate spheroid crystal is grown with minor axis aligned with the c-axis as applied in Reference Dempsey, Langhorne, Robinson, Williams, Haskell and FrewDempsey and others (2010). In addition, if we consider an advancing planar interface, the displacement and growth matrix are z and g in t = constant, respectively. The corresponding Voronoi dynamics condition is
Heat conduction in an anisotropic medium with phase change
We assume that the transport of heat is purely by thermal conduction which depends strongly on the various phases of the medium within the system. From Worster (1986), the governing equation of heat transfer is
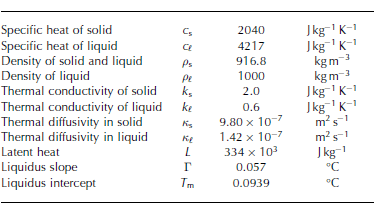
where T is temperature, ip is solid fraction, p is the averaged density, c is the averaged specific heat, L is the latent heat and ps is the density of the solid. We also assume the solid-fraction-weighted averages of these thermophysical properties, i.e. X = X(ip) = ipXs + (1 ip)X{ and XY = ipXsYs+ (1 ip)XfYe, where subscripts s and £ are solid and liquid phases, respectively. The values of all constants are given in Table 1.
Table 1. Parameters collected from Reference Kawano and OhashiKawano and Ohashi (2009) and Reference Hahn-WoernleHahn-Woernle (2011)
Salt diffusion
We use Fick’s second law (e.g. Reference CrankCrank, 1979) for salt diffusion and assume that diffusion occurs only among liquid cells, i.e.
where D is the molecular mass diffusivity. In the present model, fluid dynamics has not been considered, i.e. turbulent ocean mixing is thus not simulated. As diffusion is the only method to transfer salt in the system, we compensate for the effect of fluid transport by increasing the value of D to be greater than that for molecular diffusion alone (Reference Hahn-WoernleHahn-Woernle, 2011) and we call this the effective mass diffusivity D eff.
Liquidus relation
The freezing temperature of sea water (Reference Dinniman, Klinck, Smith, Foldvik and KvingeDinniman and others, 2007), which is the linearized version of Foldvik and Kvinge (1974), is
where Tm is the surface freezing point. The liquidus slope = 0.057°C. Note that the depth dependence has been omitted from this relation because the system of interest is at a shallow depth.
Numerical Implementation of the Model
A full explanation of the method is given by Reference WongpanWongpan (2013), with an outline presented here.
In Ohashi and others (2004), Reference DempseyDempsey (2008) and Reference Dempsey, Langhorne, Robinson, Williams, Haskell and FrewDempsey and others (2010), the only criterion for phase change from liquid to solid is the Voronoi dynamics condition (Eqn (2)) which is given in discretized form in Eqn (8). The Voronoi dynamics condition for cell j with respect to the seed ice crystal i at time nΔtV is
where cell j is liquid at time nΔtV
![]() In addition, cell j is adjacent to at least one ice cell with characteristic number 0 ˂ Ki ˂ 1. Note that different characteristic numbers distinguish between different crystals.
In addition, cell j is adjacent to at least one ice cell with characteristic number 0 ˂ Ki ˂ 1. Note that different characteristic numbers distinguish between different crystals.
Reference Kawano and OhashiKawano and Ohashi (2009) add a thermodynamic condition to their 2-D model, where
where ![]() are respectively temperature and salinity at position j and time nΔtV, and T
L is given by Eqn (7). Heat and mass transfer are implemented without latent heat during a phase change (Reference Kawano and OhashiKawano and Ohashi, 2009), which is unrealistic. Later, Reference Hahn-WoernleHahn-Woernle (2011) included latent heat in a 2-D model with supercooled water, but a temperature gradient was not taken into account.
are respectively temperature and salinity at position j and time nΔtV, and T
L is given by Eqn (7). Heat and mass transfer are implemented without latent heat during a phase change (Reference Kawano and OhashiKawano and Ohashi, 2009), which is unrealistic. Later, Reference Hahn-WoernleHahn-Woernle (2011) included latent heat in a 2-D model with supercooled water, but a temperature gradient was not taken into account.
In our model, we include all features from previous models, and extend them to 3-D with lateral periodic boundary conditions. We also add an interim phase to the model, called mixture cells, to make it easier to include latent heat.
The program runs in two loops (Fig. 4), the outside Voronoi loop and the inside heat and mass transfer loop. The corresponding time steps for each loop are ΔtV and ∆tS respectively. Assuming that we run the simulation for a period of r = NΔtV, the outside loop runs from n = 1 to N steps. For each time step ΔtV, the inside loop runs from m = 1 to M steps. In short, r = MNΔtS.
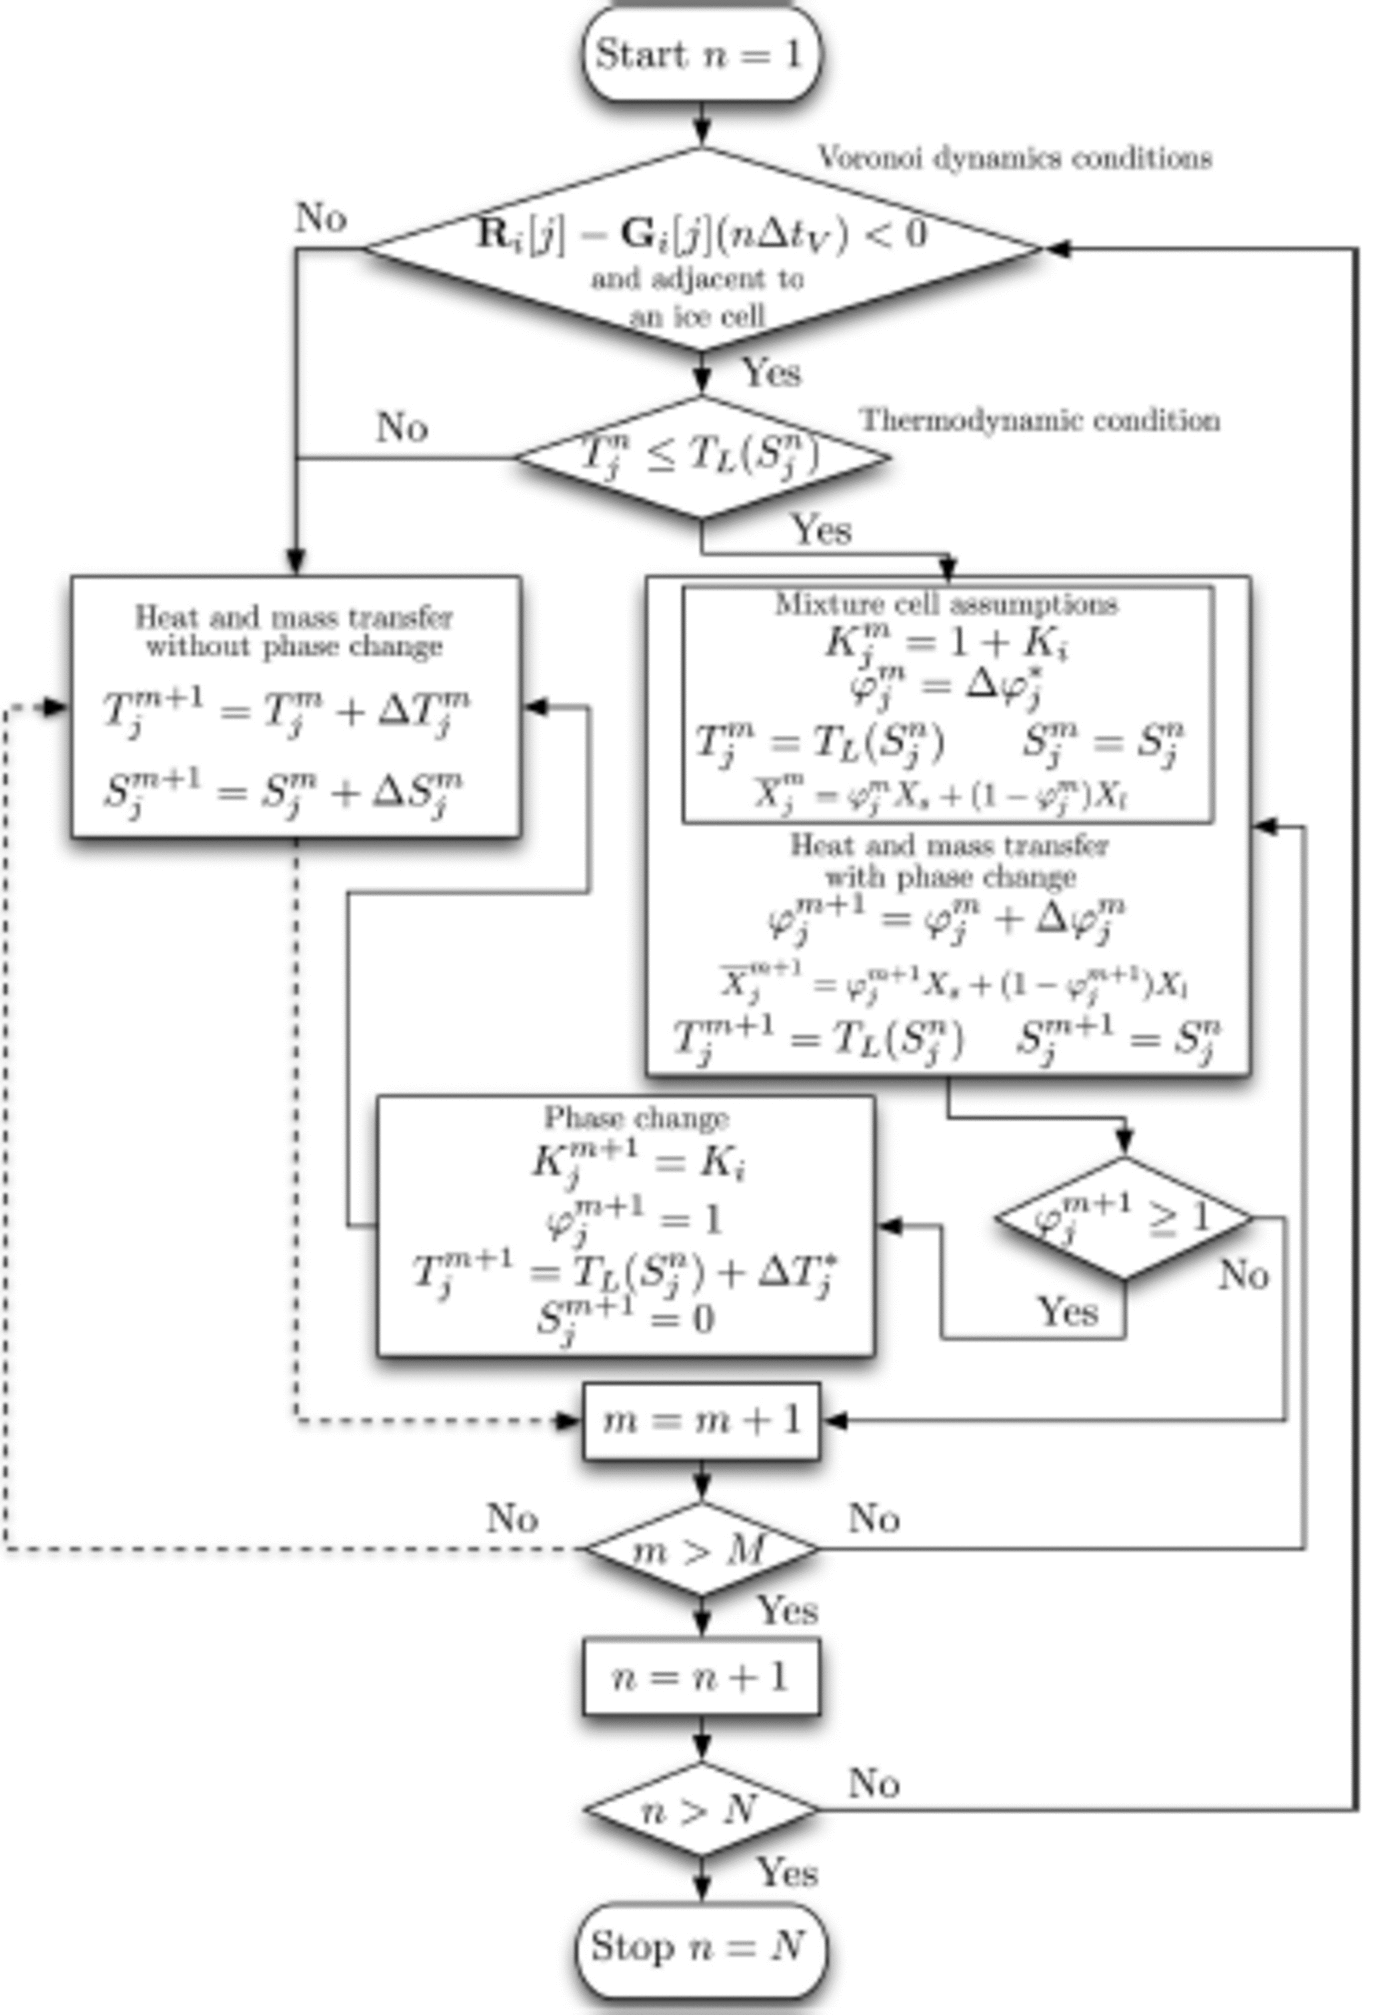
Fig. 4. Flow chart showing the numerical steps. Note that if a process enters the m = m + 1 box on a dashed line, and if the exit logic from m ˃ M is no, then the logic follows the dashed line when it exits m ˃ M.
Kawano and Ohashi (2009) used a single time step for Voronoi dynamics and heat and mass transfer. However, in our simulation, we decided to use two time steps to avoid checking the Voronoi dynamics condition at every iteration and to enable us to choose a larger ΔtV, to span simulation times from seconds to a daily scale.
In this simulation, we use an explicit method to solve the partial differential equation because it is easier to implement. However, the downside of this method is the stability. The size of this ΔtS has to be set to be smaller than the limit determined from Reference Courant, Friedrichs and LewyCourant and others’ (1967) conditions.
When the simulation starts, the crystal is seeded at position i in the domain Ω with its characteristic value Ki. The displacement of other cells with respect to this seed i and the growth function are kept in matrices R i and G i , and referred to as R i [j] and G i [j] respectively. The Voronoi dynamics inequality of any cell j with respect to crystal seed i at time nΔtV is given by Eqn (8). By definition, since R i [i] is always zero, i.e. it is the displacement to itself, then this inequality is also valid for the seed cell at any time.
From nΔtV to (n + 1)∆t V, ΔtV is further discretized and runs from m = 1 to M iterations. Any temperature T and salinity S of cell j at time mΔtS can be denoted as Tj m and Sj m respectively, and updated for each iteration by the heat and mass transfer without phase change equations
where ∆Tm j and ∆Sj m are given in Reference WongpanWongpan (2013).
When m = M, the Voronoi dynamics condition is checked for each cell. If cell j passes this condition its temperature will be compared with its corresponding liquidus temperature (Eqn (9)), which we call the thermodynamic condition.
If this condition holds, the solidification process starts. The characteristic number of this cell j at step n (Kn j) changes from 1 (liquid) to 1 + Ki (mixture). The solid fraction residual Δφj is calculated from
In the heat and mass transfer loop, the temperature for this cell is set equal to the liquidus temperature during solidification ![]() . In order to maintain a constant liquidus temperature, the salinity is required to be constant, i.e.
. In order to maintain a constant liquidus temperature, the salinity is required to be constant, i.e. ![]() . However, salt is rejected continuously from the mixture cell due to the increase in solid (ice) fraction. If there are no liquid cells to absorb salt from this cell, the solidification process stops and the characteristic number of this cell will be set to 2, which is representative of a brine cell. At step m + 1, the solid fraction accumulates,
. However, salt is rejected continuously from the mixture cell due to the increase in solid (ice) fraction. If there are no liquid cells to absorb salt from this cell, the solidification process stops and the characteristic number of this cell will be set to 2, which is representative of a brine cell. At step m + 1, the solid fraction accumulates,
Physical constants are updated; that is![]()
![]()
If Eqn (14) is true, the phase of the cell changes. First, the temperature residual is calculated from the difference of ![]() from 1,
from 1,
and this is added to the liquidus temperature of that cell:
Then ![]() is reset to 1. The salinity of this cell is set to zero, and the characteristic number is changed from 1 + Ki (mixture) to Ki (solid). On the next step, this cell will be redirected to the heat and mass transfer without the phase change scheme. All the processes above are sketched as a flow chart (Fig. 4). The way we take residuals in temperature and solid fraction into account is similar to an algorithm, called the heat integration method (Dusinberre, 1945).
is reset to 1. The salinity of this cell is set to zero, and the characteristic number is changed from 1 + Ki (mixture) to Ki (solid). On the next step, this cell will be redirected to the heat and mass transfer without the phase change scheme. All the processes above are sketched as a flow chart (Fig. 4). The way we take residuals in temperature and solid fraction into account is similar to an algorithm, called the heat integration method (Dusinberre, 1945).
Model Results and Discussions
Validation: Stefan problem
Here we perform simulations to evaluate the accuracy of our code, and to carry out sensitivity experiments by varying the effective mass diffusivity Deff for each run. To do this, we set up the domain fl to match the situation of a one-dimensional (1-D) solution (the Stefan problem) as described in Worster (1986).
To match the Stefan problem, which describes 1-D heat transfer with phase change, the domain has the property that x = y → ∞ and z is finite. We apply periodic boundaries on the x-y plane to achieve the former property. The lengths of the periodic simulation box in the x, y, and z directions are lx, ly and lz. We set lz to a finite length to satisfy the latter property. We perform the simulation in a domain with dimensions lx = ly = 0.01 m, and lz = 1.0 m, using a uniform grid with cell length ∆ h = ∆x = ∆y = ∆z = 0.001 m.
In the Stefan problem, a slab of sea ice grows downwards by heat loss to the atmosphere. To do this, we place an ice slab with temperature Ttop = -5°C at z = 0.001m. The rest of the domain is sea water with uniform salinity Sbot = 35.16.
Before the simulation starts, an advancing interface is introduced to the domain at position z = 0.002 m, causing the sudden rejection of salt to all cells in the plane z = 0.003 m with salinity 70.32. Then the simulation begins.
The Voronoi front (Fig. 3) of the advancing interface has a growth speed gint = 1.0 x 1 0 5 m s 1 in Eqn (4). By setting ΔtV = 10s, gintΔtV ˂ ∆h which is another requirement of Voronoi dynamics (Reference Kawano and OhashiKawano and Ohashi, 2009; Reference Dempsey, Langhorne, Robinson, Williams, Haskell and FrewDempsey and others, 2010). All simulations in this section run for 1.6x10⁴∆tV, which is equivalent to 1.6 x 10⁵ s or ∼2 days.
The thermodynamic set-up has Sbot = 35.16 and a freezing point o1Crd0. eW7r sm of e 2os Tfsi Lm (1Sm ublawaogtitt)en h =i tf-uov1du =.er9,c 1{a°1rsCa,e n1sg0 (b,iE nyq1g n0 v a0frr(,o7y1)im0n).0 g 0W6D}..ee8 f f x=s1e tv 0DT1 b0o ovt et=or
Comparison of our results with theoretical solutions from Worster (1986) confirms the accuracy of our code for each value of D eff (Fig. 5). We select Deff = 100D = 6.8x 1 0 8 m 2 s 1 for all further simulations. This is of the same order of magnitude as applied by Reference Vancoppenolle, Goosse, de Montety, Fichefet and TremblayVancoppenolle and others (2010) and Reference JefferyJeffery and others (2011) in modeling the transport of tracers in sea ice.
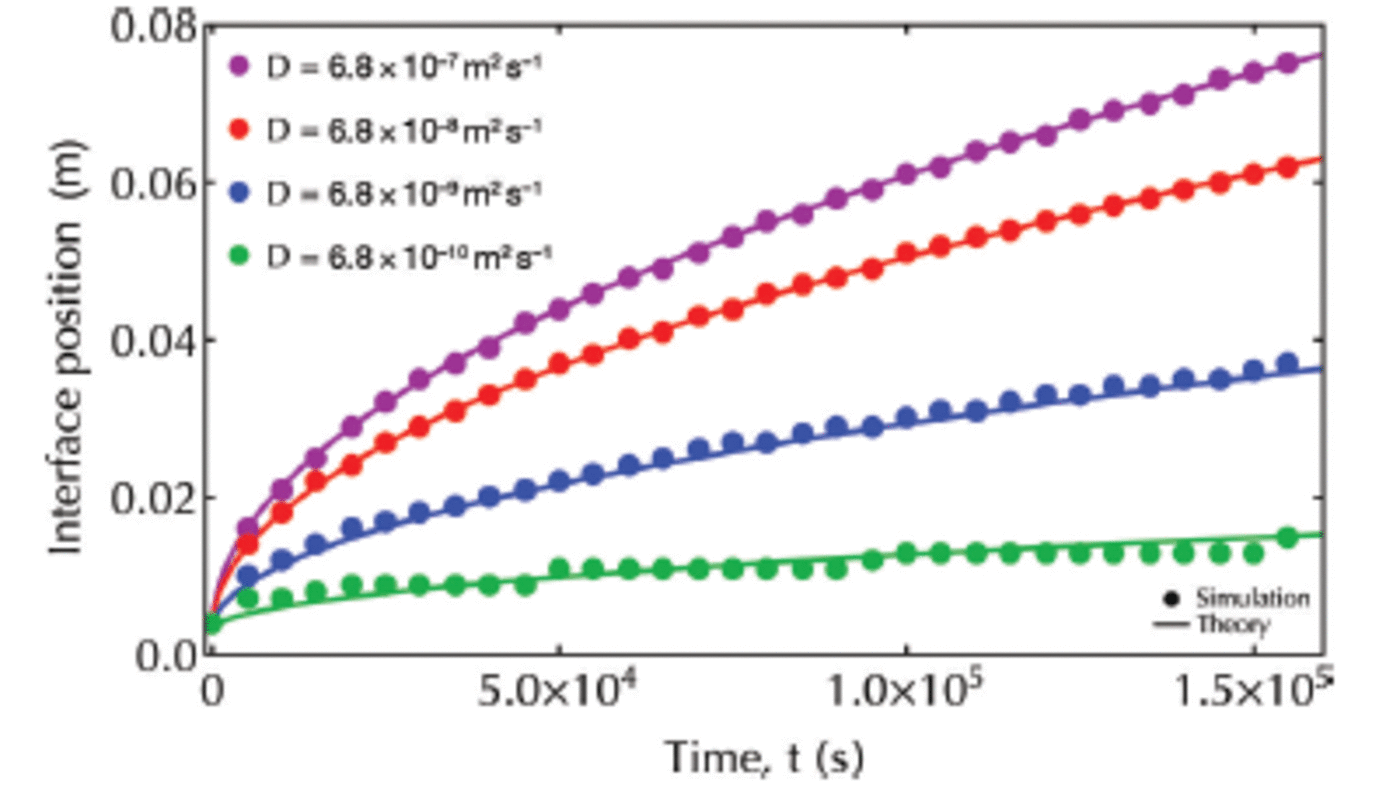
Fig. 5. Interface position versus time. Analytical solutions (Worster, 1986) are plotted with solid lines, while simulation results are plotted with filled circles.
A single ice flux event from the ocean
Having evaluated the simulation code in the previous subsection, we now explore two scenarios that are likely to occur in ice-shelf-affected waters. In scenario 1, a flux of tiny seed crystals arrives at the base of the sea-ice cover in a single event. They then grow due to heat loss upwards through the sea ice, as well as to the supercooled ocean. Scenario 2 begins with the formation of a rough ice/water interface, by seeding and growing ice crystals as in scenario
1. After a short time, a continuous flux of crystals is introduced. The advancing interface (driven by heat loss to the atmosphere) grows from the upper domain to freeze the crystals in place to become incorporated platelet ice.
In this section, we assume that a flux of seed ice crystals arrives from the ocean as a single event, under a top-chilled, flat sea-ice cover. These crystals are assumed to be small (1 mm diameter) and to have random positions and orientations. Then they grow locally and we expect a sub-ice platelet layer to form and increase in solid fraction. Observations show that without a continuous supply of loose ice crystals, geometric selection plays a major role, and eventually resumed columnar fabric forms (Reference Dempsey, Langhorne, Robinson, Williams, Haskell and FrewDempsey and others, 2010; Reference Dempsey and LanghorneDempsey and Langhorne, 2012).
We set a domain Ω with a total number of cells (Nx xNy x Nz) = 100 x 100 x 100 cells, i.e. the model resolution is 0.001 m. In order to simulate the growth of a thin layer at the base of a 1 m thick sea-ice cover, initial and boundary conditions are set with T top=-2.5°C, Tbot= -1.96°C,
S top = 0, S bot = 35.16 and D = 6.8 x 1 0 8 m2 s 1 to match observations within the sub-ice platelet layer from Reference Robinson, Stevens, Langhorne and HaskellRobinson and others (2014). The initial temperature of each crystal is set to TL(Sbot) =-1.91°C.
In this simulation, we introduce 120 ice crystals, each of 1 mm diameter and with random c-axes and seed positions, to the top 10% of the domain, or equivalently in a region 0.01 m thick. Note that to compensate the effect of fluid dynamics and oceanic turbulence in the entirely liquid region beneath the growing sub-ice platelet layer, in this simulation we reset the salinity and temperature to Sbot and T bot. The growth function of these platelet crystals is oblate spheroidal

First, we consider the structure of the modeled platelet ice. A total of 120 platelet crystals start from the size of one cell and become disc-like shapes at 3 x 10⁴s (Fig. 6). The mixture cells are on the rim of each crystal. At 6 x 10⁴ s, the platelet crystals interact with each other and mixture cells begin to form a plane, and to grow as a layer. At 9 x 10⁴s, the crystals are thicker, causing a wider layer of mixture cells.
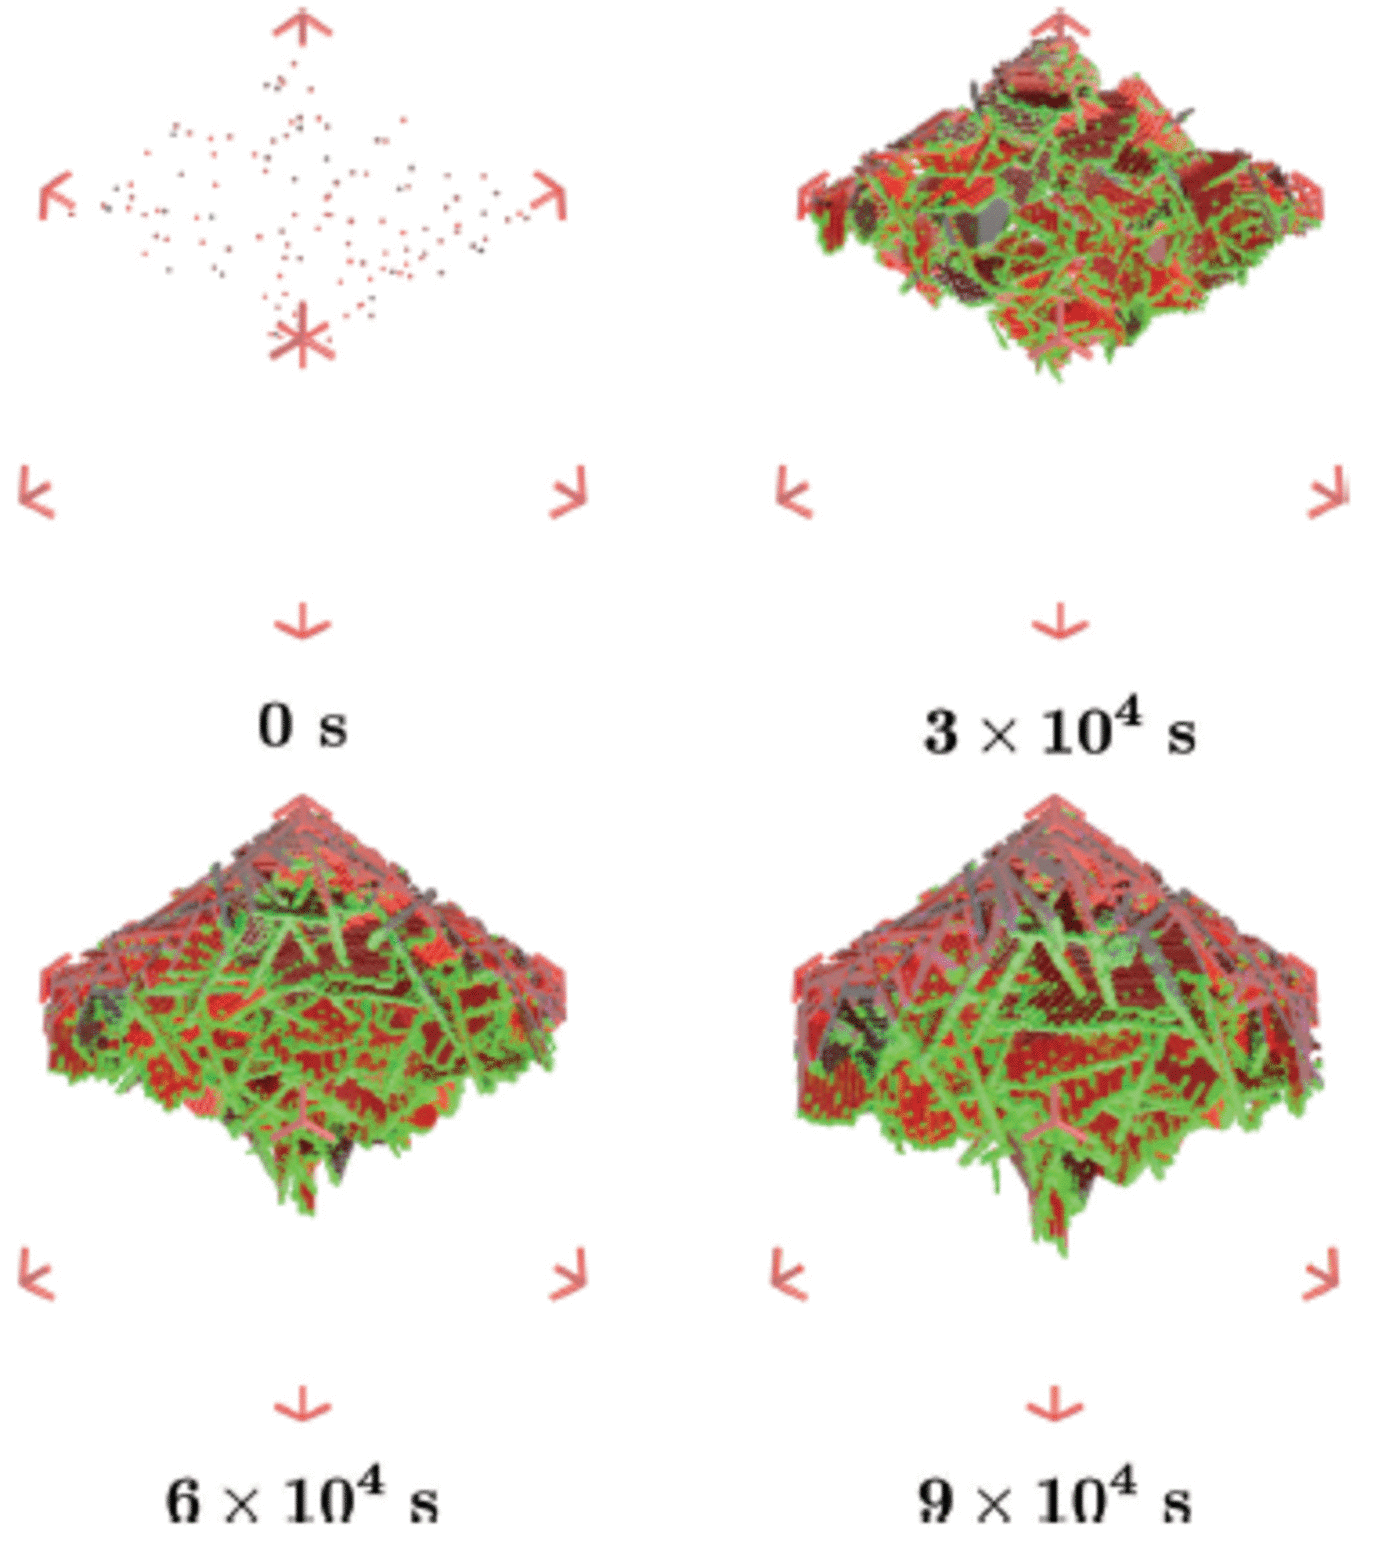
Fig. 6. The ice structure at 0s, 3 x 10⁴s, 6 x 10⁴s and 9 x 10⁴s following a single ice flux event from the ocean. Ice viewed from below and growing downwards. Different shades of red mean different platelet crystals. Bright green and magenta represent mixture and brine cells respectively.
To gain a better understanding of the 3-D results, we consider the profiles found by averaging parameters at each depth. We display solid-fraction, salinity and temperature profiles at intervals of 3 x 10⁴s (Fig. 7). In this porous, sub-ice platelet layer, the salinity exhibits a C-shaped profile which is a well-known characteristic of landfast, congelation sea ice. Salt diffuses from the growing sub-ice platelet layer towards the underlying liquid, so that the overall ice salinity decreases with time as expected.

Fig. 7. Solid-fraction (a), salinity (b) and temperature (c) profiles for a single ice flux event from the ocean. Red, blue and green are profiles at 3 x 1046 x 104 and 9 x 10⁴ s, respectively.
An advancing interface and a continuous ice flux from the ocean
In describing the second scenario, we introduce a continuous deposition of platelet crystals from the ocean to the sub-ice platelet layer. In addition, we include the incorporation of platelet crystals by an advancing interface to form incorporated platelet ice (Reference Smith, Langhorne, Haskell and TrodahlSmith and others, 2001; Reference Gough, Mahoney and LanghorneGough and others, 2012a; Fig. 8). A continuous flux of ice crystals is expected to play an important role in the resulting crystal orientations (Reference Dempsey, Langhorne, Robinson, Williams, Haskell and FrewDempsey and others, 2010), noting that the previous work did not include heat and mass transfer.
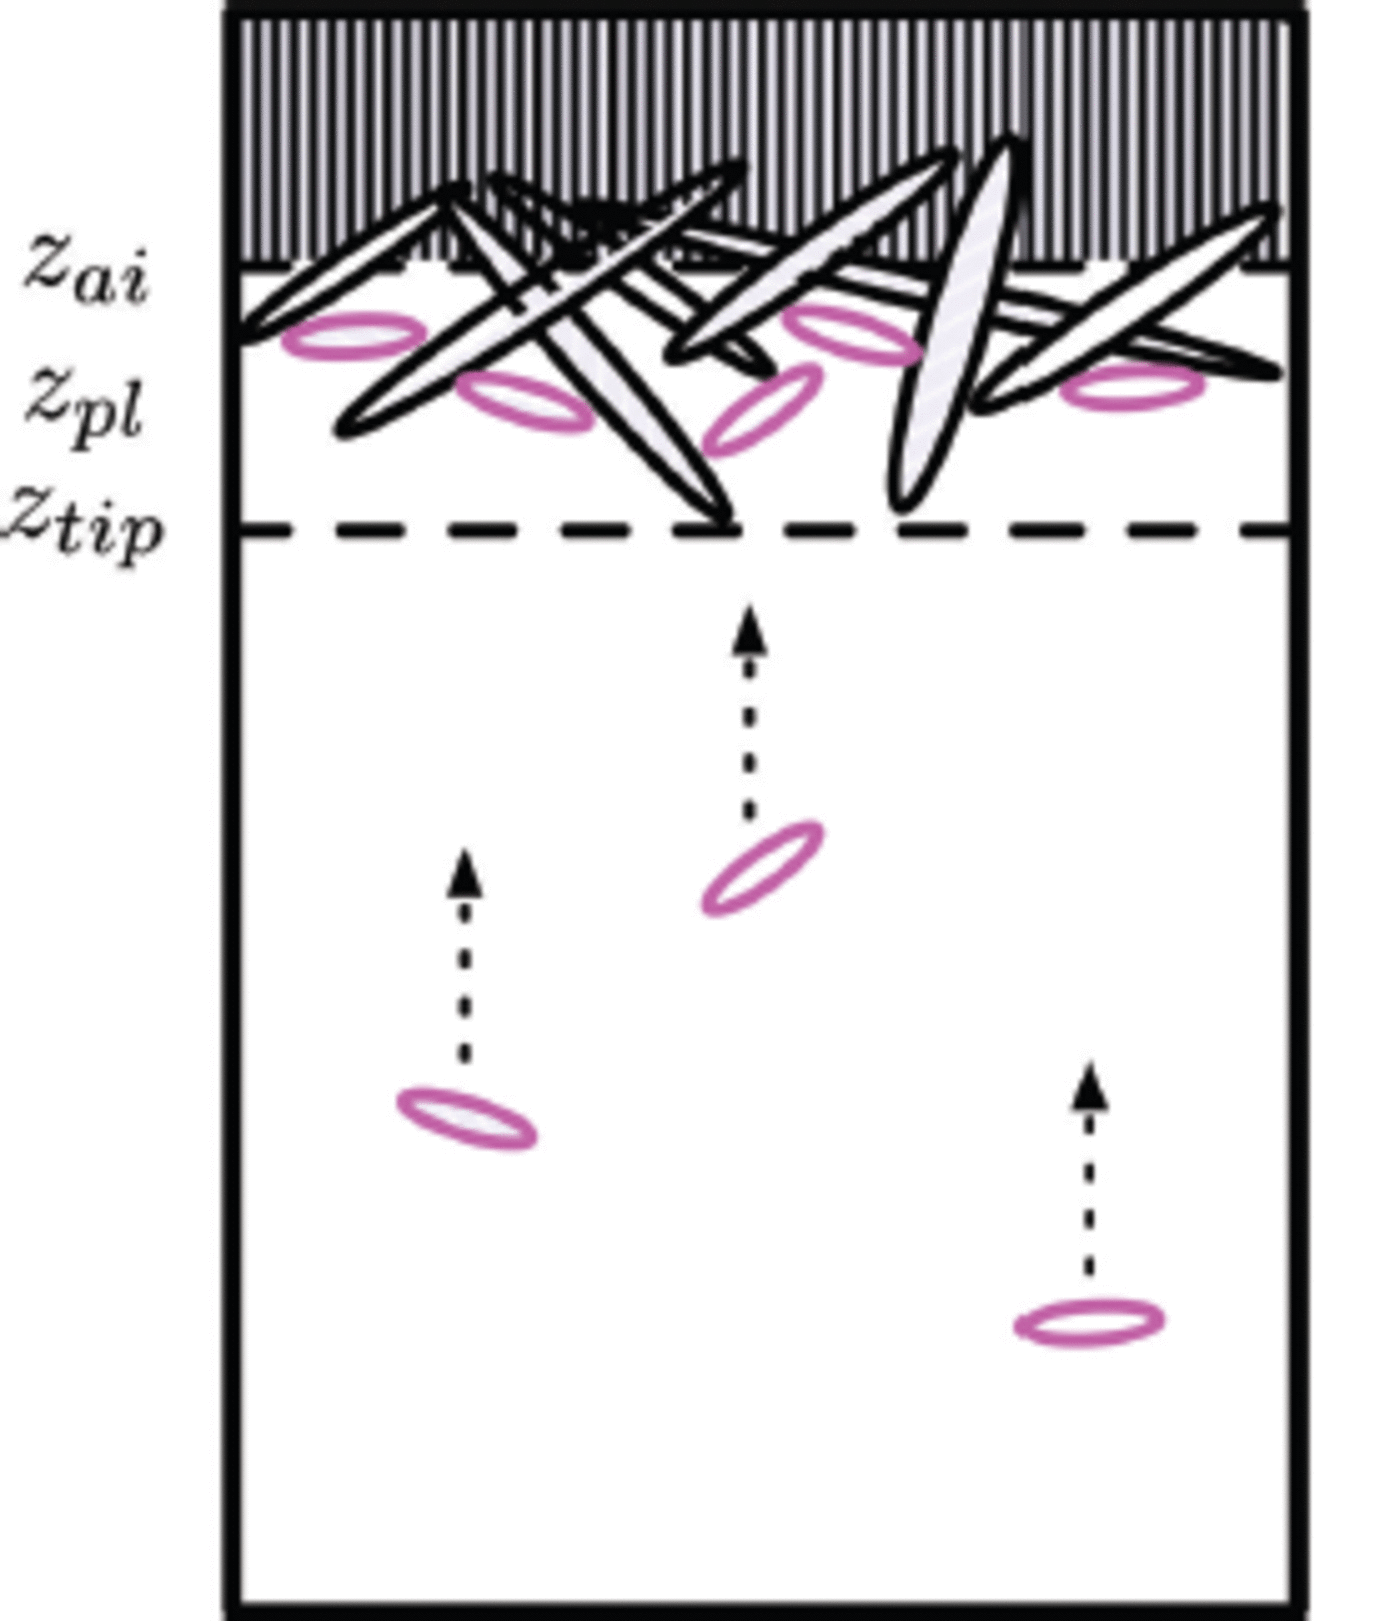
Fig. 8. Ice crystals float up to deposit onto the layer of platelet crystals which have grown beneath the ice bottom, and together they form the sub-ice platelet layer. The ice bottom, initially at z ai, is also moving downwards due to heat loss to the atmosphere. This is referred to as the advancing interface z ai . The tip of the sub-ice platelet layer is at position z tip and the distance between z ai and z tip is referred to as z pl.
This simulation is designed to model the western side of McMurdo Sound where a continuous flux of ice crystals seems to be deposited from the underlying water column during the growth of a sea-ice cover (Reference Gow and AckleyGow and others, 1998). This scenario represents a flux of ice crystals from the ocean while sea ice grows rapidly. We select a growth rate of 2.2 x 10⁻² m d–1 which is appropriate for thin ice of ∼0.25 m thickness (Reference Leonard, Purdie, Langhorne and HaskellLeonard and others, 2006), so the simulation has an advancing interface of g int =2.5x 10 –7 m s–1. The simulation begins by establishing a rough interface from seed crystals as in scenario 1. We set g b = 5.0 x 10⁻⁷ m s–1causing the diameter of the seed crystals at 3 x 10⁴ s to have grown to ∼30 mm. This is about three times larger than the diameter of the crystals to be deposited. Thus the deposited crystals can enter gaps between the enlarged seed crystals, and together they form the sub-ice platelet layer (Fig. 8). We start the deposition at 3 x 10⁴ s by launching one ice crystal with average diameter (l) 10 mm every ten steps or 100 s. For deposition, we use the algorithm of Reference Dempsey, Langhorne, Robinson, Williams, Haskell and FrewDempsey and others (2010). Therefore the growth function in the basal plane (G b) of each deposited crystal is modified to include the morphology of the crystals as observed under sea ice. The last platelet crystal arrives at 6 x 10⁴s. In total, there are 300 platelet crystals deposited under the existing sub-ice platelet layer formed by the growth of the 120 seed crystals. The simulations run for 9 x 10⁴s as in the previous subsection.
For this set-up, the ice flux from the ocean is Φ= (1/A) (dN/dt ) where A is the area beneath the sea ice and dN/dt is the number of ice crystals rising to the ice base per second. With A = 0.1 x 0.1 m2 and dN/dt= 1/100 crystal s 1, Φ= 9 x 10⁴ crystals m 2 d 1 are accumulated. If we assume that a sub-ice platelet layer has a uniform solid fraction fs = 0.25 (Reference Smedsrud and SkogsethSmedsrud and Skogseth, 2006; Reference Gough, Mahoney and LanghorneGough and others, 2012a), we can calculate the critical ice flux which will allow a sub-ice platelet layer to form, Φcrit = (fs/vpl)g int (Reference Dempsey, Langhorne, Robinson, Williams, Haskell and FrewDempsey and others, 2010). Here v pl is the average volume of each ice platelet, which equals (4/3)7r(l/2) α. We find Φcrit is 31 x 104 crystals m 2 d 1 . Thus, the simulated ice crystal flux is slightly less than the critical ice flux. This means that if the simulation (Fig. 9) had run for a longer time the sub-ice platelet layer would have been consumed by the advancing interface (Reference Dempsey, Langhorne, Robinson, Williams, Haskell and FrewDempsey and others, 2010).
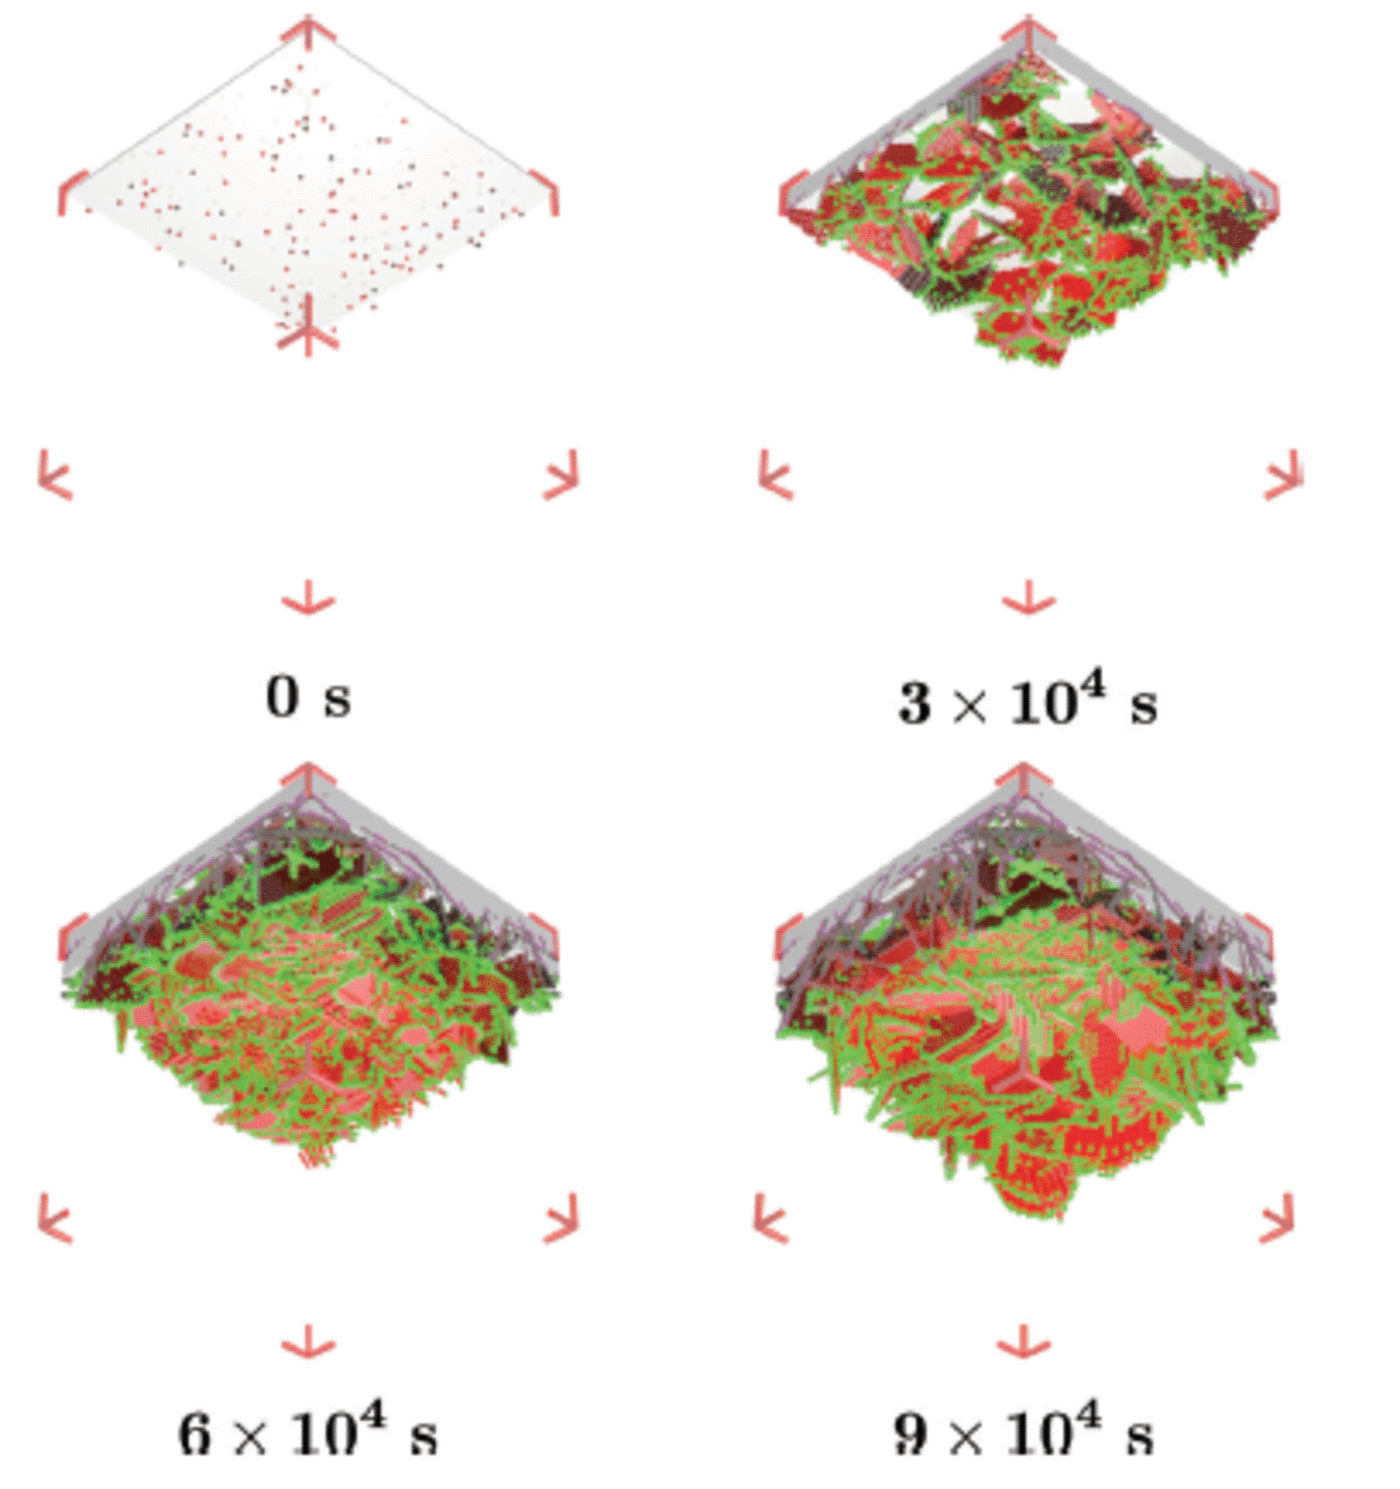
Fig. 9. The ice structure at 0 s, 3 x 10⁴ s, 6 x 10⁴ s and 9 x 10⁴ s of an advancing interface and a continuous ice flux (crystal diameter 10 ± 1 mm) from the ocean. Ice viewed from below and growing downwards. Different shades of red mean different platelet crystals. Bright green and magenta represent mixture and brine cells respectively.
Note that, as expected, the inclusion of an advancing interface causes the solid fraction to be in the range 0.8-1 at the top of the simulation domain (Fig. 10a). In this region, the salinity (Fig. 10b) is ∼10 as observed in such systems (Reference Gough, Mahoney and LanghorneGough and others, 2012b). The final scene of the simulated sub-ice platelet layer (Fig. 11) is qualitatively similar to the photographed sub-ice platelet layer (courtesy A. R. Mahoney and A.J. Gough) from McMurdo Sound, Antarctica, in 2009.
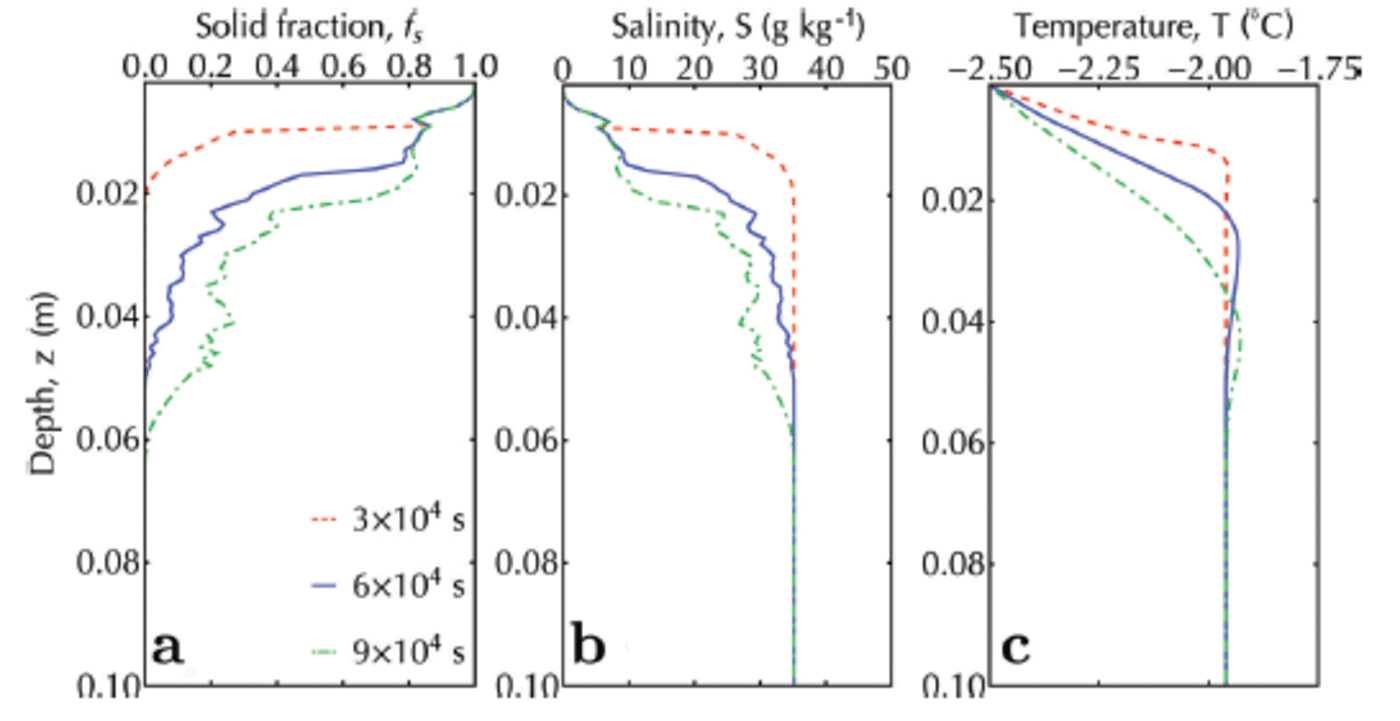
Fig. 10. Solid fraction (a), salinity (b) and temperature (c) profiles for an advancing interface and a continuous ice flux (crystal diameter 10 ± 1 mm) from the ocean. Red, blue and green are profiles at 3 x 10⁴, 6 x 10⁴ and 9 x 10⁴ s, respectively.

Fig. 11. An example of an underwater scene, at 9 x 10⁴ s, is shown from a simulation with an advancing interface and a continuous ice flux (crystal diameter 10 ± 1 mm) from the ocean. The scale from blue to blue of the ruler is 0.05 m. In the bottom-right corner, a schematic shows three simulation domains that are connected together to provide a view similar to that from an underwater camera.
Fabric of platelet ice: simulation versus observation
In examining the crystal orientation and diameter distributions predicted by the simulation for the two scenarios described above, the development of crystal fabrics following a single ice flux event from the ocean (Fig. 12a) is analysed. In this scenario we start from isotropy because the crystals are seeded randomly under the sea-ice cover. These grow without any additional platelet flux until the crystals begin to impinge on each other at 3 x 10⁴s. Geometric selection therefore forces the c-axis orientation towards a girdle regime, in which c-axes lie predominantly in the horizontal plane, without a preferred direction in that plane. The transition from an isotropic fabric at small depths, to a girdle regime at greater depths, is characteristic of the development of platelet ice towards resumed columnar ice (Fig. 12a). This is in agreement with in situ observations (Reference Gough, Mahoney and LanghorneGough and others, 2012a) and earlier simulations without heat and mass transfer (Reference Dempsey, Langhorne, Robinson, Williams, Haskell and FrewDempsey and others, 2010; Reference Dempsey and LanghorneDempsey and Langhorne, 2012).
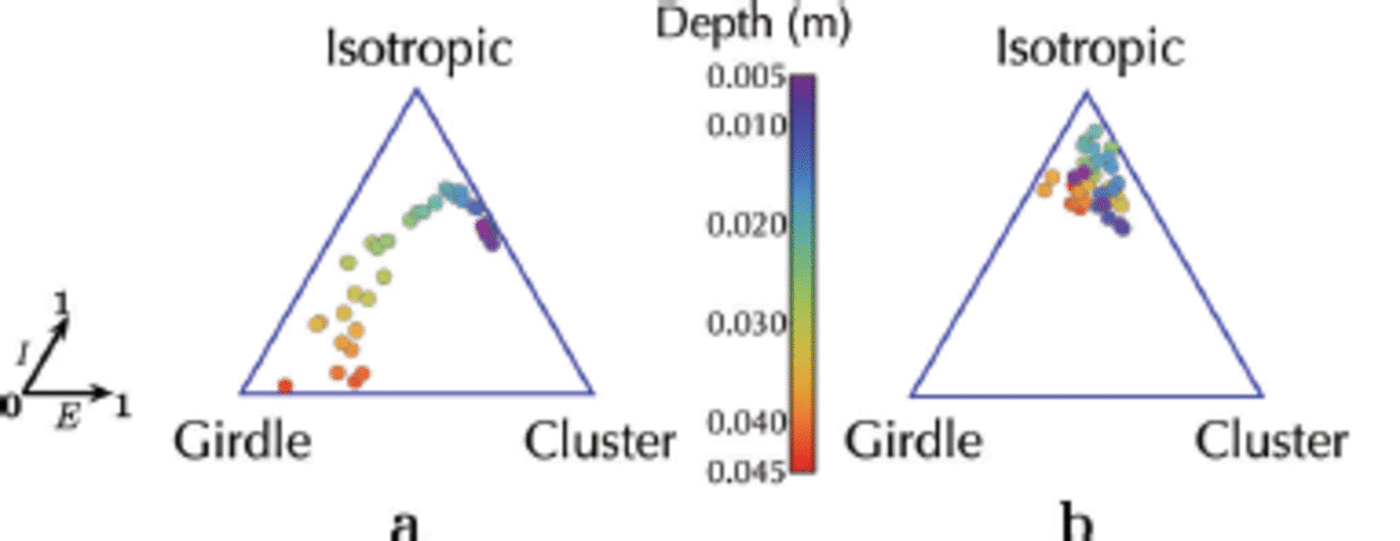
Fig. 12. The crystal orientations of (a) a single ice flux event from the ocean and (b) an advancing interface and a continuous ice flux from the ocean are summarized in the ternary plots (Reference BennBenn, 1994; Reference Gough, Mahoney and LanghorneGough and others, 2012a). Each point represents (E, I), where E and I are the elongation (which is close to 1 for aligned fabrics) and the isotropy (which is close to 1 for isotropic fabrics) axes, respectively. Depth of each thin section of the simulated sea-ice core is indicated by its colour from the top of the core at z = 0.005 m (violet) to its bottom at z = 0.045 m (red). Note that in (b), the crystal orientations of the crystals in the advancing interface are omitted from the plot.
The crystal diameter is defined as the major axis of the oblate spheroid, and all crystals introduced to the simulation as seed crystals are included in this distribution (Fig. 13a). Thus the figure may be regarded as representing the distribution of crystal diameters in a sub-ice platelet layer. The increase in diameter with time is evident, leading to crystals with diameters in excess of 50 mm. Such crystals are not unusual beneath sea ice abutting an ice shelf (Reference Gow and AckleyGow and others, 1998).

Fig. 13. Distributions of crystal diameter at 3 x 1046 x 104 and 9 x 10⁴ s (a) for a single ice flux event of 120 crystals with uniform diameter of 1 mm at 0s and (b) where an advancing interface and an ice flux from the ocean of 1 crystal every 100 s is added from 3 x 10⁴s until 6 x 10⁴s. A total of 300 crystals, with a diameter selected randomly in the range 10 ± 1 mm, are added during the continuous ice flux.
To examine the effect of crystal diameter we performed a simulation with a continuous flux of ice crystals of diameter 5 ± 1 mm. This yields fs ≈ 0.29 (Fig. 14). There are a number of reasons why a smaller crystal diameter might produce a higher solid fraction. First we note that the depth of the sub-ice platelet layer is smaller than it is for 10mm crystals, leading to a higher solid fraction. In addition, smaller crystals will have a greater packing efficiency than larger crystals. Nonetheless solid fraction appears to be relatively insensitive to the diameter of crystals that impinge on the interface, with a 30% change in solid fraction resulting from a halving of the crystal diameter.
For the second scenario (Fig. 8), when ice crystal deposition from the ocean occurs continuously, the trajectories of the crystal fabric are confined to the isotropic regime (Fig. 12b). In this case the simulation is designed to model ice growth over 0.045 m at the base of a thin sea-ice cover under conditions in which a sub-ice platelet layer may only exist temporarily. The crystallographic result is in good agreement with measurements near the top of the sea ice in western McMurdo Sound (Reference Dempsey, Langhorne, Robinson, Williams, Haskell and FrewDempsey and others, 2010; K.G. Hughes and others, unpublished information), as well as at the bottom of a thicker sea-ice cover (Reference Gough, Mahoney and LanghorneGough and others, 2012a).
The crystal diameters are also smaller in the second scenario (Fig. 13b). At 6 x 10⁴s, the population of crystal diameters between 10 and 20 mm dominates due to the continuous deposition of ice crystals from the ocean with diameter 10 ± 1 mm. This deposition began at 3 x 10⁴ s and continued until 6 x 10⁴ s. After this, crystal deposition to the sub-ice platelet layer ceases. Consequently, the crystals have become larger at time 9 x 10⁴s.
Solid fraction of sub-ice platelet layer
In general, three processes contribute to the solid fraction in incorporated platelet ice: (1) the deposition of ice crystals from the ocean to the base of the sea ice, (2) the growth of these crystals in the supercooled water close to the sea-ice base, and (3) their eventual incorporation into the sea ice by the advancing interface (Reference Dempsey, Langhorne, Robinson, Williams, Haskell and FrewDempsey and others, 2010). Processes (1) and (2) determine the solid fraction in the sub-ice platelet layer.
The upper bound of the sub-ice platelet layer is set at the advancing interface z ai (Fig. 8). The position of the tip of a platelet crystal is referred to as z tip. We define the mean solid fraction in a sub-ice platelet layer as
where fs*(z) is the horizontally averaged value of the solid fraction at depths from z ai to ztip. In words, fs is the area under the solid fraction profile curve divided by the range of the specified curve.
Scenario 2, with a flux of crystals of 10 ± 1 mm diameter, has been shown to display a transitory sub-ice platelet layer. For this case (Fig. 14), we obtain fs ≈ 0.22 which is in good agreement with 0.25 ± 0.06 reported by Reference Gough, Mahoney and LanghorneGough and others (2012a), who deduced solid fraction from measurements of heat flux from ice temperature profiles. It is also in agreement with fs ≈ 0.25 for frazil/grease ice samples taken in an active polynya (Reference Smedsrud and SkogsethSmedsrud and Skogseth, 2006).
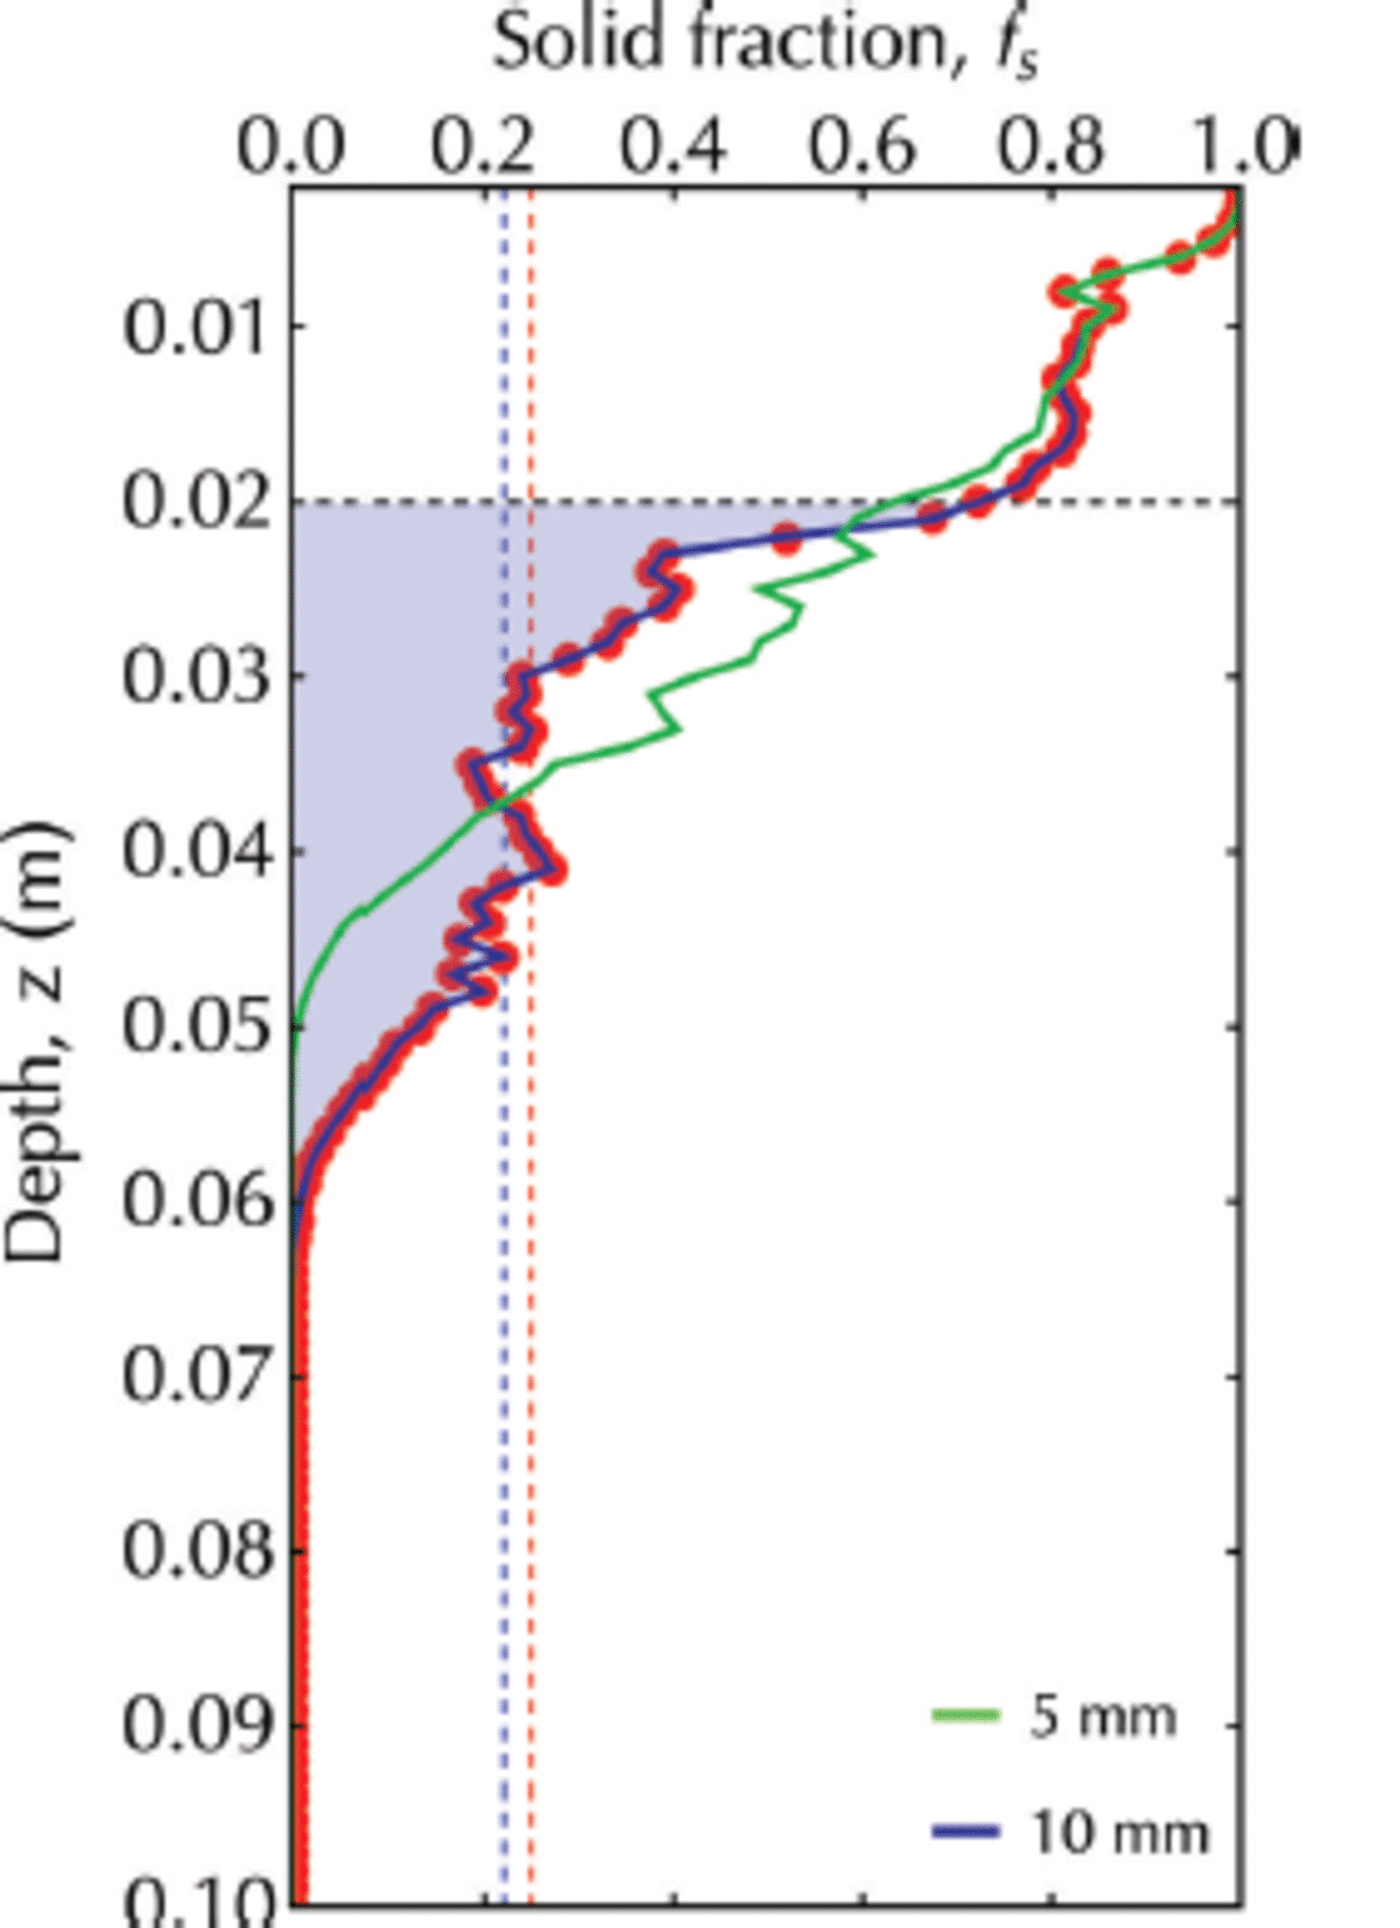
Fig. 14. The solid fraction profile at 9 x 10⁴ s for a simulation with a continuous flux of crystals of diameter 10 ± 1 mm (red dots). The area under this curve from z ai = 0.020 m (horizontal dashed line) to z tip = 0.061 m is shaded in blue. Vertical red dashed line marks the solid fraction equal to 0.25 reported by Reference Gough, Mahoney and LanghorneGough and others (2012a). Vertical blue dashed line identifies the mean solid fraction calculated by Eqn (17). The green line is the solid fraction profile for a simulation with a continuous flux of crystals of diameter 5 ± 1 mm.
Conclusion
A simulation based on Voronoi dynamics, and incorporating heat and mass transfer by diffusive processes, has been constructed to predict the solid fraction and crystal orientations in the sub-ice platelet layer. The major limitation is the neglect of fluid dynamics. Our code is evaluated with 1-D solidification, the so-called Stefan problem. We extend the results of Reference Dempsey, Langhorne, Robinson, Williams, Haskell and FrewDempsey and others (2010) in order to give a more accurate assessment of the solid fraction in the porous sub-ice platelet layer. Including the two main contributing processes, a flux of ice platelets from the ocean and local growth in the sub-ice platelet layer, we obtain a solid fraction of ∼0.22. This result is in good agreement with the value of 0.25 ± 0.06 obtained experimentally by Reference Gough, Mahoney and LanghorneGough and others (2012a). The final contribution from the advancing interface, driven by heat flux to the atmosphere, fills the interstices and increases the solid fraction of the upper part of the sub-ice platelet layer to become close to 1, forming incorporated platelet ice.
Instead of solving for sea-ice solid fraction by considering solidification of a permeable material, as in mushy layer theory (e.g. Worster, 1986), in this work the growth of individual crystals was simulated. Good agreement between the simulated crystal orientation distributions and the observations of Reference Leonard, Purdie, Langhorne and HaskellLeonard and others (2006), Reference Dempsey, Langhorne, Robinson, Williams, Haskell and FrewDempsey and others (2010) and Reference Gough, Mahoney and LanghorneGough and others (2012a) has allowed us to verify the simulations. Consequently, we are confident that our model, including the three contributing processes and with enhanced, diffusion-controlled local growth, is a reasonable model of platelet ice formation. This is an important step in understanding the dynamics of the formation of a sub-ice platelet layer because the layer is inaccessible, loose and difficult to sample.
Acknowledgements
P.W. has been supported by a University of Otago publishing bursary. We acknowledge Craig Stevens, Michael Williams and Sarah Wakes for helpful suggestions. The numerical results were simulated on the University of Otago Vulcan cluster. We acknowledge Lars Smedsrud, an anonymous reviewer and the editors, whose suggestions and comments helped improve and clarify earlier versions of the manuscript.


