Introduction
Because horizontal surface velocity values are close to zero at the summit of the dome (values of the same order as continental movements), high-accuracy measurements are required in order to measure the velocity field of the dome. Moreover, considering that reference geodetic markers on stable rock outcrops are located very far away (>1000 km), both the global positioning system (GPS) and the Doppler Orbitography and Radiopositioning Integrated by Satellite (DORIS) were used to study absolute and relative movements of the Dome C area. In particular, a GPS strain network was designed to measure relative velocities at Dome C, whereas absolute movements of the network were obtained through DORIS and GPS connections to Antarctic permanent GPS stations. Reference Legrésy, Rignot and TabaccoLegrésy and others (2000) provided the first description of ice flow around Dome C using synthetic aperture radar (SAR) interferometry. They point out the importance of having in situ measurements to improve and provide fiducial control for remote-sensing analysis.
Ice discharge from the Antarctic ice sheet is largely related to the dynamics of fast-flowing outlet glaciers and ice streams, but evidence from remotely sensed data suggests that each major drainage basin is fed by a complex system of tributaries that penetrates up to 1000km from the grounding line into the interior of the ice sheet (e.g. Reference JoughinJoughin and others, 1999; Reference Bamber, Vaughan and JoughinBamber and others, 2000). There are very few, sparse in situ measurements in the interior of the East Antarctic ice sheet. Collections of GPS control velocity data are required for flow mapping derived from remote-sensing survey (ISMASS Committee, 2004).
As part of the EPICA (European Project for Ice Coring in Antarctica), Station Concordia and ITASE (International Trans-Antarctic Scientific Expedition) projects, a strain network was established and surveyed (using static GPS measurements) in the Dome C area, East Antarctica, during the 1995/96 Antarctic campaign. DORIS measurements were carried out in 1993 and 1999. GPS measurements were carried out during the 1998/99 Terra Nova Bay–Dome C traverse; they were repeated in 2000/01 using an aircraft (Twin Otter) for deployment and recovery of instruments (Fig. 1).
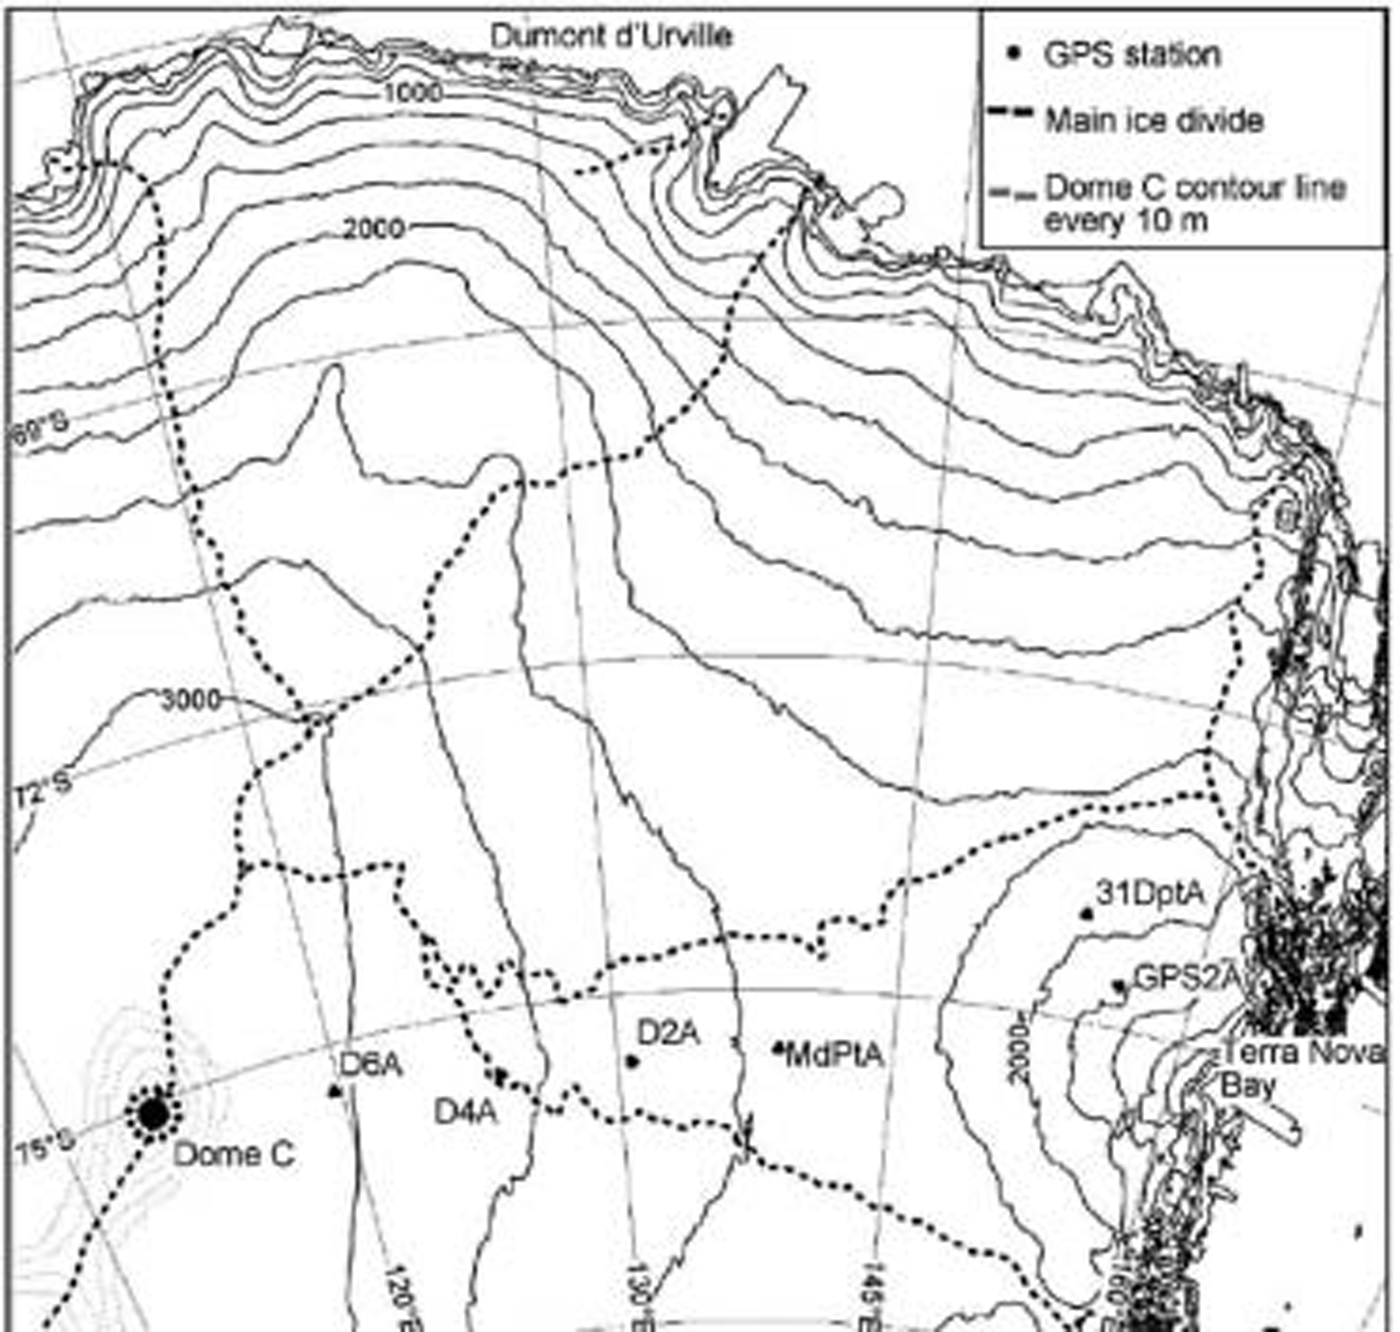
Fig. 1. Schematic map showing Dome C and ITASE traverse.
This paper describes the results of GPS and DORIS surveys, which provide information on in situ ice velocities along a transect from the coast to Dome C and at Dome C.
Materials and Methods
DORIS measurements at Dome C
The first DORIS measurements at Dome C were made in 1993/94 in the framework of the first traverse between Dumont d’Urville and Dome C; measurements were repeated in 1999/2000 (Reference Vincent and PourchetVincent and Pourchet, 2000). The first goal was to measure the absolute position of one reference point with respect to the strain network; in order to improve the accuracy of the absolute position of the whole network, a second point was measured in 1999. The location of the DORIS points is shown in Figure 2. The second DORIS point (Doris2), which coincides with station A15 of the GPS network, was measured for the first time in 1999. The Doris1 vertex consists of two parts. The first is a
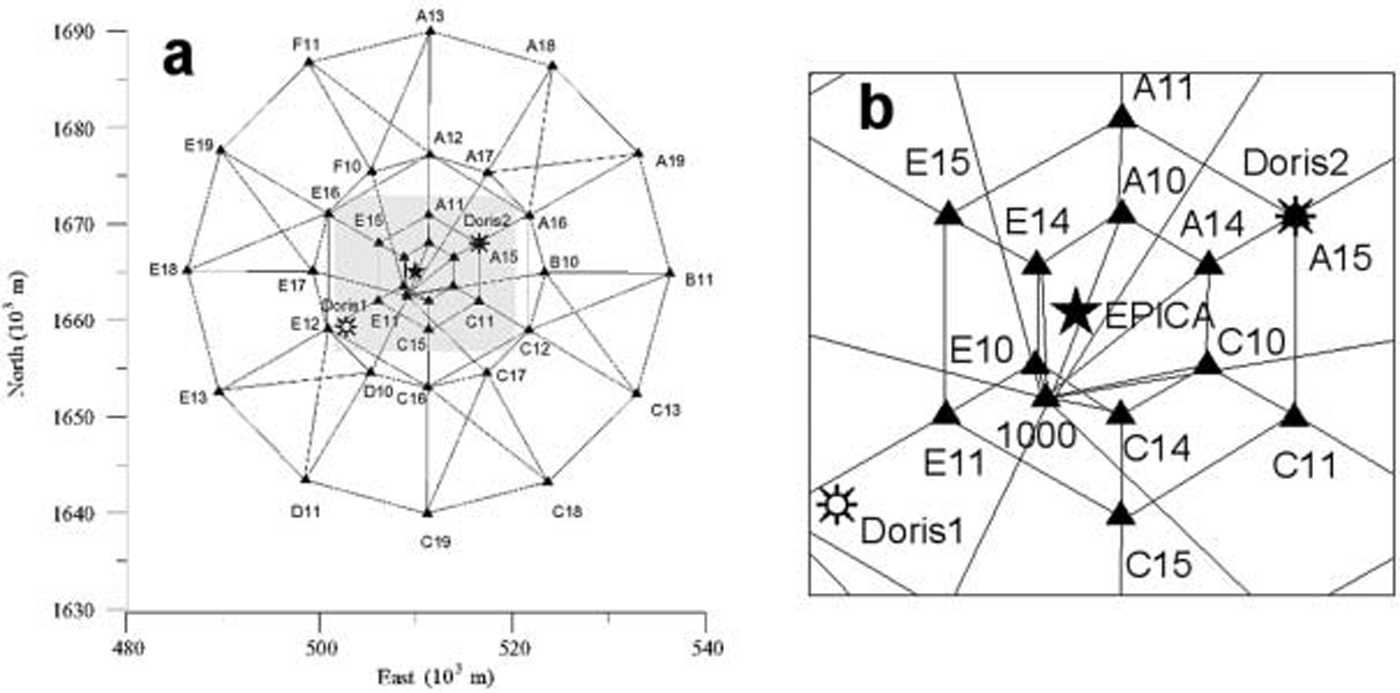
Fig. 2. (a) Layout of the DORIS–GPS geodetic network at Dome C; (b) detail of the central part of the network.
2 m long aluminium stake (10mm diameter) buried in the snow, with small wooden stakes angled to prevent local movements. The second part was specifically designed for different purposes, to be used with traditional instruments (e.g. theodolite, electronic distance measurement), for GPS antenna force-centring, or with the Doris antenna.
GPS network at Dome C
The GPS geodetic network consists of 37 stations positioned in four concentric rings at increasing distances (3, 6, 12.5 and 25 km) from the summit of the topographic Dome (Fig. 2). The centre of the network was established on the basis of the first detailed surface topography data from satellite radar altimetry (Reference Brisset and RémyBrisset and Rémy, 1996), coupled with a GPS survey performed during the 1994/95 expedition (Reference Cefalo, Tabacco, Manzoni and UnguendoliCefalo and others, 1996). The summit position obtained through previous surveys (75˚06'06.35" S, 123˚23'42.76" E) was confirmed by subsequent detailed GPS surveys performed in 1995/96 (Reference Capra, Cefalo, Gandolfi, Manzoni, Tabacco and VittuariCapra and others, 2000). The Concordia Station base summer camp (75˚06'04" S, 123˚20'52" E), where the EPICA drilling site is located, is about 1400 m west of the topographic Dome. The network configuration is considered appropriate for detecting the expected radial pattern of horizontal displacement. The GPS network was surveyed twice, during the 1995 (9–15 December) and 1999 (9–14 January) expeditions, with the aim of detecting movements relative to the drilling site. The absolute position of the network was obtained both through DORIS measurements and through a GPS connection to the closest permanent GPS stations. DORIS and GPS measurements were linked together through GPS static surveys. Ice velocities around the Dome C area were assumed to be of a few cm a–1 in the central portion of the network (corresponding to the dome summit) and were then expected to increase toward the outer part of the network. In order to achieve maximum accuracy around the dome summit, the number of GPS baselines was increased in the central portion of the network. At the same time, the network geometry had to consider the requirements for detecting surface movements over a wide area and the corresponding logistical constraints. The network was established and surveyed for the first time in December 1995 using five dual-frequency Trimble 4000 series GPS receivers. Point 1000, located close to the first camp of the 1995/96 traverse, was established as a reference GPS station for the 1995 survey. Dual-frequency GPS signals were acquired at this station for all measured sessions. During the first campaign, occupation was 1 hour for short distances (<5 km) and up to 2.5 hours for external points, thereby guaranteeing the same level of precision for the whole network. During the 1999 campaign, the presence of ITASE vehicles at Dome C allowed overnight occupations at the boundary of the network, so that it was possible to schedule longer GPS sessions. Aluminium poles 12 cm in diameter and 3 m long, sunk in the snow for at least 2 m and topped with a device for forced centring of the GPS antennae, were adopted as three-dimensional benchmarks. One submerged velocity station (Reference Hulbe and WhillansHulbe and Whillans, 1994; Reference Hamilton, Whillans and MorganHamilton and others, 1998) was installed close to point 1000 in 1999. GeoGenius 2000 GPS software (produced by TerraSat, GmbH) was used to process the GPS strain network, while Bernese GPS software v.4.2 (University of Berne) was used for processing the long static connections. These software packages allowed the use of precise IGS (International GPS Service) orbits and of models for GPS antennae phase centre variations with satellite elevation (IGS model). GeoGenius uses a single baseline approach, followed by a least-squares network adjustment. Considering a 95% confidence level, the estimated uncertainty in relative velocity measurements at Dome C is ±7mma–1 for the horizontal component of ice flow at the surface, and ±9mma–1 for the vertical component. Double-difference L1 and L2 fixed solutions were chosen for very short baselines (<5 km), whereas, due to high ionospheric effects on GPS acquisitions, double-difference Lc (iono-free) solutions were adopted for longer baselines.
GPS along the Terra Nova Bay–Dome C transect
Seven snow–firn cores, up to 53 m deep, were drilled during the Terra Nova Bay–Dome C traverse at 90 –150 km intervals. In order to accurately determine ice velocity (horizontal and vertical), in 1998 a pole 12 cm in diameter and 4 m long was fixed in the snow and measured using GPS. The vertical component of velocity is obtained from GPS surveys of markers anchored some tens of metres deep in firn. The markers had been frozen to the borehole base using water and connected to the surface by non-stretchable steel cable (Reference Hulbe and WhillansHulbe and Whillans, 1994; Reference Hamilton and WhillansHamilton and Whillans, 2002). GPS markers were embedded at different depths (43–53 m) with different firn densities (644–722 kg m–3). Geodetic dual-frequency receivers were used during the 1998/99 and 2000/01 surveys. During the 2000/01 survey, only six of the seven sites were measured due to logistical constraints, and GPS occupations were constrained by the presence of the team at the site; during the first campaign in 1998/99 the overnight presence of ITASE vehicles allowed for sessions longer than 12 hours, while during the 2000/01 campaign Twin Otter aircraft allowed repeat 6 hour long sessions. Considering the particular configuration and the distance from reference stations (Terra Nova and Dome C), Precise Point Positioning (PPP) was performed using the GIPSY-OASIS II software. PPP algorithms use undifferenced carrier phase observations and eliminate the need to acquire simultaneous tracking data at reference (base) stations. In our study, horizontal positional accuracy is about ±7 cm, and vertical accuracy is around ±11cm (uncertainties at 95% confidence level).
Results and Discussion
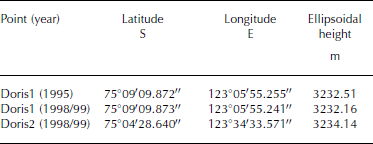
DORIS data were analyzed to determine the absolute position of points Doris1 and Doris2 within the International Terrestrial Reference Frame (ITRF94). The solution supplied by the Groupe de Recherches de Géodesie Spatiale/Collecte, Localisation, Satellites (GRGS/CLS) DORIS data analysis centre of Toulouse, France, was determined using the GINS/DYNAMO software package (Reference Vincent and PourchetVincent and Pourchet, 2000). Results were supplied at the same reference epoch with estimated standard errors (one standard deviation level) for each geocentric component, respectively of ±3 cm in 1993 and ±2 cm in 1999 (Table 1). In order to check the feasibility of long GPS connections between Dome C and the permanent Antarctic GPS stations, acquired data at reference points were processed together with McMurdo, Davis, Casey and Terra Nova Bay acquisitions using the Bernese v. 4.2 software; results within ITRF94 are reported in Table 2 (computed post-adjustment uncertainties of ±5 cm for each geocentric component, at 95% confidence level).
Table 1 DORIS-derived coordinates (ITRF94 epoch 01–01–2001) of points Doris1 and Doris2 in successive campaigns
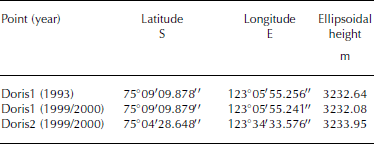
Table 2 GPS-derived ITRF94 coordinates (epoch 01–01–2001) of points occupied by DORIS
Considering only relative positions, the least-squares adjustments of the GPS network at Dome C show standard error ellipses of a few millimetres for each position component, in both solutions. For a confidence level at 95%, the relative positions of points contain a horizontal uncertainty of ±10–15mm and a vertical uncertainty of ±15–20mm.
In order to evaluate absolute displacements through repeat surveys, the effects of Antarctic plate tectonic motion must be modelled and corrected. The geodetic community has recently paid increasing attention to the use of long time series produced by GPS permanent stations, and to co-located geodetic techniques (Very Long Baseline Interferometry, Satellite Laser Ranging, GPS, DORIS, etc.) for evaluating present-day geodynamics. With the establishment of a growing number of geodetic observatories in Antarctica, it is now finally possible to gain geodetic information over long periods. Using the ITRF2000, 10mm accuracy was achieved in the tectonic motion detection of permanent GPS sites in Antarctica (Reference DietrichDietrich and others, 2001). We therefore expect improvements in future measurements based on long time-series analysis. Considering that the expected movements at the summit of the dome are close to zero, and that any minor mismodelling of Antarctic plate tectonic motion could be interpreted as an absolute movement of the dome, a six-parameter similarity transformation was applied to GPS solutions before comparison. The residuals of transformation were then verified with absolute movements obtained by DORIS measurements. The horizontal velocity obtained through the comparison of successive DORIS-derived coordinates (one standard deviation level) at point Doris1 is 19±7mma–1. The vertical shift is 93 mma–1. These values are corrected for Antarctic plate tectonic motion at Dome C, considering a velocity of –9.4mma–1 in latitude and 0.4 mm a–1 in longitude (Cretaux and others, 1998).
At point Doris1, GPS data show a relative horizontal velocity of 32±7mma–1, while Doris1 absolute motion reveals a horizontal velocity of 19±7mma–1; considering errors, results are consistent, and no absolute horizontal movement of Dome C was detected on the basis of measurements made 3 years apart.
Displacements during the 3 year interval are reported in Table 3, while horizontal velocities are reported in Figure 3. Results indicate that, in the 3 year interval, poles closest to the topographic summit (2.5 km from the network centre) moved up to a few mma–1 (A14: 8±7 mm a–1; E10: 11 ±7mma–1; point 1000: 6±7mma–1); the northeast and southwest poles equidistant from the summit moved a few cm a–1 (E14: 30±7mma–1; C10: 33±7mma–1). The EPICA drilling site, positioned close to E10 and E14 (about 1400m west of the dome summit), has an interpolated velocity of about 15±10mma–1 in a north-northwesterly direction. Due to the very slow velocity at the EPICA drilling site (same level of uncertainty values after 3 years only), the strain rate was not calculated. The other poles move up to 211 mma–1, with equal values forming concentric ellipses similar to the contour lines that describe the topography of the area.
Table 3 GPS network at Dome C: location of the poles, and their annual movements derived by two measurements of the network, spaced in time by 1127 days (velocity uncertainties at 95% confidence level)
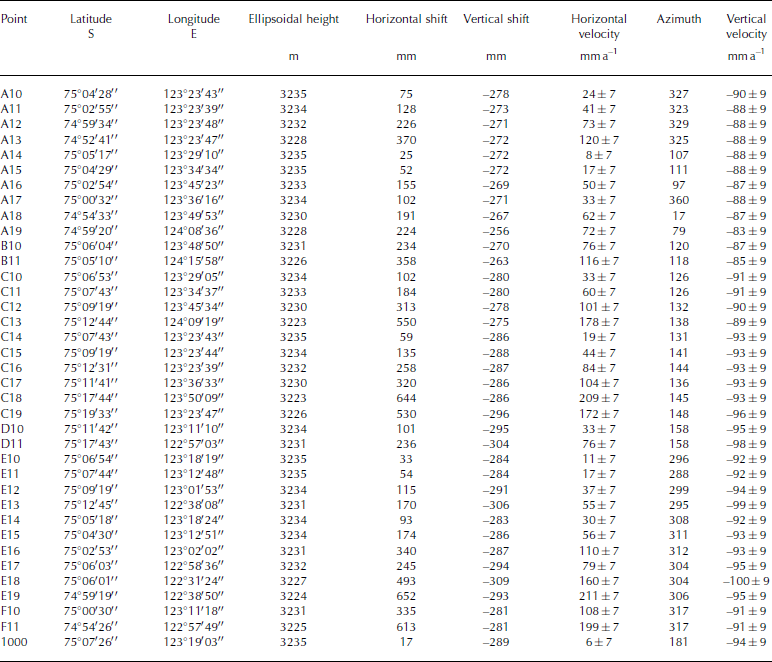
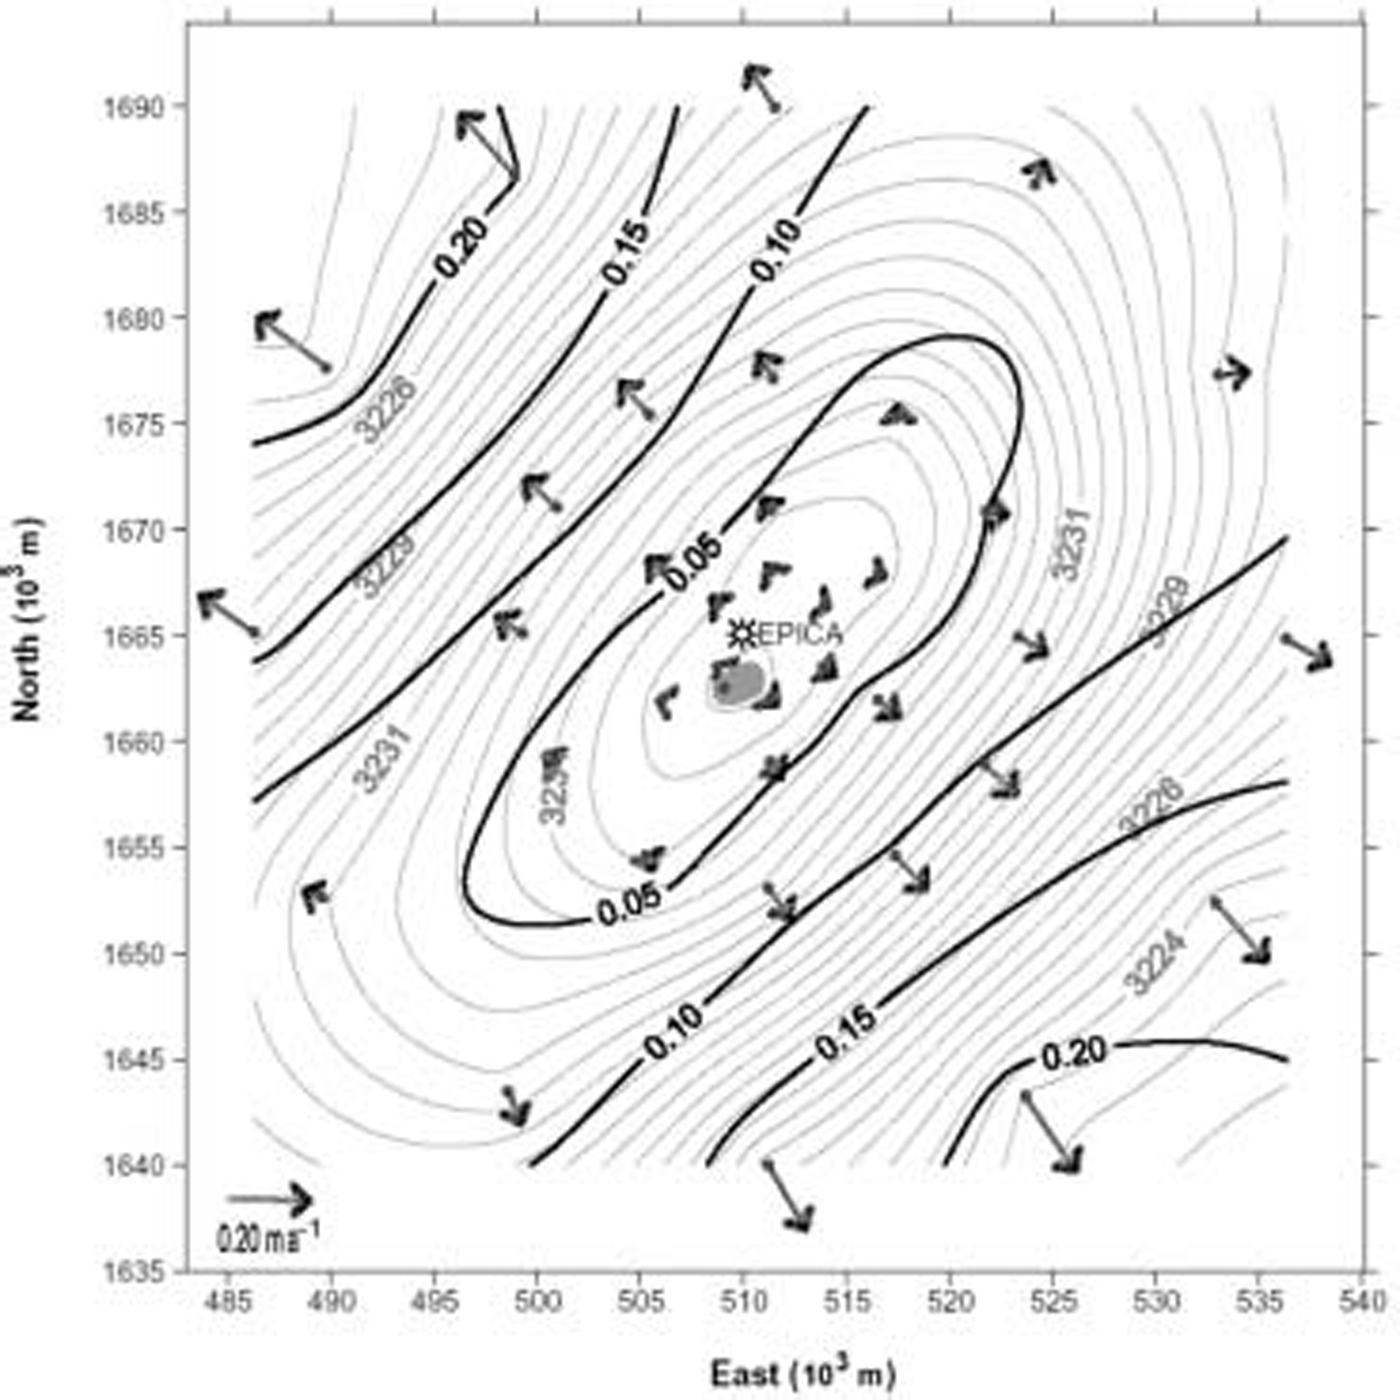
Fig. 3. Surface ice velocity and topographic map, Universal Transverse Mercator–World Geodetic System 1984 (UTM-WGS84) map projection (0.05ma–1 velocity contour, 0.5 m topographic contour). Filled grey area represents the dome summit area. EPICA represents the position of Concordia Station and the deep core.
The higher velocities were recorded at the poles in the steeper south-southeast (C18: 209±7mma–1) and east-northeast (E19: 211±7mma–1) portions of the dome. At the same distance (25 km) but along the major axis of the dome, velocities are much lower to the north-northwest (A18: 62 ±7 mma–1; A19: 72 ±7 mma–1) and south-southwest (E13: 55±7mma–1; D11: 76±7mma–1).
In situ measurements of horizontal motion agree with SAR interferometric results, obtained for one component of the relative velocity field by Reference Legrésy, Rignot and TabaccoLegrésy and others (2000); these authors calculated the horizontal balance velocity in the Dome C area, with values ranging from zero near the summit area to 250–300mma–1 about 25 km away from the summit.
The direction of the ice movement correlates well with the direction of maximum surface gradient (R 2 = 0.99; Fig. 4), indicating that the direction of movement at the surface is strictly controlled by surface topography within a 25 km radius of the dome. Reference Rémy and TabaccoRémy and Tabacco (2000) pointed out that the most prominent characteristic of the Dome C surface is the elliptical shape of the contour lines, and that the shape is explained by the Reference NyeNye (1991) theory on the topology of ice-sheet centres. They suggested that the strain rate in the southeast–northwest direction is three times lower than that in the perpendicular direction. Analysis of velocity data along the minor (northwest–southeast) and major (southwest–northeast) axes of the dome confirms the Reference Rémy and TabaccoRémy and Tabacco (2000) hypothesis: the average velocities along each axis are directly proportional to the distance from the centre (R 2 > 0.9), and the velocity in the southwest– northeast direction is three times lower than that in the northwest–southeast direction. The comparison between elevation and ice-velocity contour lines (Fig. 3) reveals symmetrically higher velocities along the minor axis of the dome (steeper portion). Non-symmetric ‘higher velocities’ are present in the north-northwest area, along the major axis of the dome. Reference Legrésy, Rignot and TabaccoLegrésy and others (2000) correlated the higher velocity in the north-northwest area with the presence of a subglacial lake and basal sliding. Dome C is positioned along an ice divide that runs from Vostok lake to the Adélie Coast. An ice saddle (3200 m) 115km south-southeast of the dome summit separates the dome from the ice ridge coming from Vostok lake; the difference in elevation between the summit and saddle is only 30m. The slope in the north-northwest sector increases up to the Terre Adélie ice-sheet margin. The difference in ice velocity may be linked to the asymmetric topography of the dome along the north-northwest–south-southeast axis.
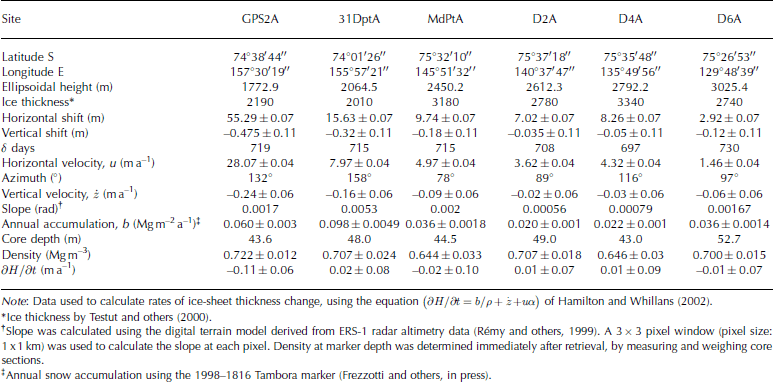
Ice velocities along the Terra Nova Bay–Dome C transect clearly increase from the summit of the ice sheet to the coast, reaching about 28 ma–1 at site GPS2A. The ice-flow direction agrees with the maximum surface slope based on a digital elevation model (DEM) derived from European Remote-Sensing Satellite (ERS-1) radar altimetry data (Reference Rémy, Testut and LegrésyRémy and others, 1999). Higher velocities with respect to this general trend were found at site D4A; these are likely explained by the ice thickness at this site being greater than at other sites. Although site D4A shows the lowest slope, rheological parameters (Reference Testut, Tabacco, Bianchi and RémyTestut and others, 2000) and radio-echo sounding data (Reference Siegert and RidleySiegert and Ridley, 1998) suggest that basal sliding does occur. The site is a few km east of the Scott Coast ice divide. Reference Frezzotti and FloraFrezzotti and Flora (2002) pointed out that this ice divide has been moving, perhaps since the mid-Holocene, due to encroachment by the Ross Ice Shelf system. This encroachment may be driven by an increase in the slope profile of the Ross Ice Shelf outlet glaciers, the north-northwest–south-southeast direction of the subglacial topography, and the presence of water-saturated sediments.
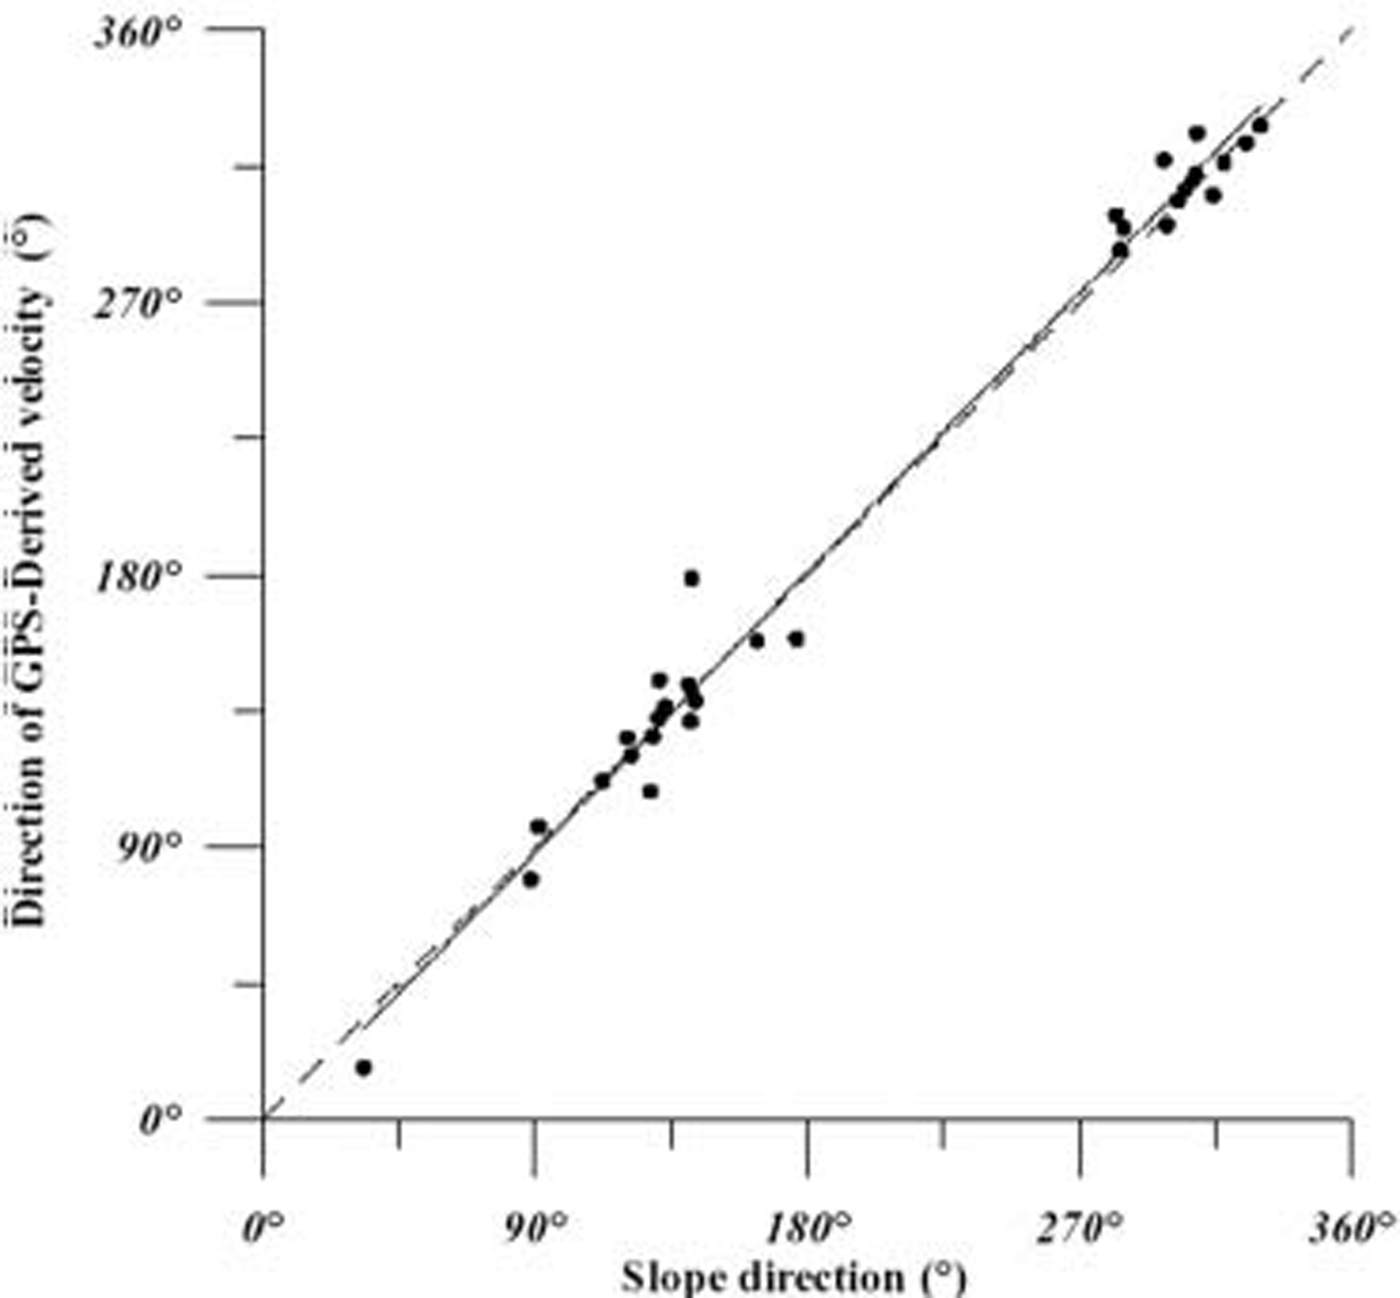
Fig. 4. Correlation of the direction with respect to the steepness direction. Correlation of R 2 = 0.99.
Submergence ice-velocity measurements along the Terra Nova Bay–Dome C transect were measured at six sites. The calculated rates of thickness change are all quite small, and the formal uncertainties are close to the estimated thickness changes (Table 4; Fig. 5). In this first analysis, we use the longest record surveyed available at the Tambora marker from nssSO4 core stratigraphy (Reference FrezzottiFrezzotti and others, in press). Different authors (Reference Hulbe and WhillansHulbe and Whillans, 1994; Hamilton and others, 1998; Reference Hamilton and WhillansHamilton and Whillans, 2002) have pointed out that errors in submergence ice-velocity measurements are dominated by determination of the temporal variability in snow accumulation rates. Along the transect, snow accumulation rates derived with different time periods (4 years: stake farm; 40 years: tritium marker level; 180 years: Tambora (Indonesia) volcanic eruption marker) differ significantly at the submerged pole sites due to the high spatial variability of snow accumulation correlated with wind-driven sublimation (Reference FrezzottiFrezzotti and others, 2004). The spatial variability of snow accumulation at the km scale, derived from snow-radar and cores, is one order of magnitude higher than its temporal variability (20– 30%) at the century scale. Reference Rémy and TabaccoRémy and others (2002) pointed out that snow accumulation rate variability must be carefully characterized in time and space so as to better interpret changes in ice-sheet elevation. The high spatial variability of snow accumulation can influence the submergence ice velocity and will be taken into account in future analyses.
Table 4 Position of the poles along the Terra Nova Bay–Dome C transect (1998), shift and annual movement
Conclusions
The integration of DORIS and GPS has enabled absolute and relative measurements of the surface velocity field at Dome C. Due to the difficulty in measuring velocities close to zero at the dome summit, and the need for very long geodetic connections to reach stable reference points, it was necessary to combine different high-accuracy space geodetic techniques.
At point Doris1, GPS data show a relative velocity of 32±7mma–1, while DORIS data reveal an absolute velocity of 19 ±7mma–1; considering errors, these results are consistent, and no absolute horizontal movement of the dome was detected on the basis of measurements made 3 years apart. The EPICA drilling site yields an interpolated velocity of about 15 ±10 mma–1 in the north-northwesterly direction. Analyses of the velocity field and surface topography in the region show that the surface flow centre is nearly co-located with the dome summit, and that both appear to be in a steady-state condition. Data indicate that the poles closest to the topographic summit move up to a few mma–1, while poles located 25 km away from the summit move up to 211 mma–1.
The comparison between elevation and ice-velocity contour lines confirms the previous remote-sensing analysis and reveals symmetrically higher velocities along the minor axis of the dome (steeper portion). Unsymmetrical ‘higher velocities’ are present in the north-northwest area, along the major axis of the dome.
Remote-sensing and surface GPS–DORIS surveys could be combined to bring together results with absolute significance and those with wide geographic coverage.
Future repeat GPS and DORIS measurements will be used to validate the present steady-state condition and may record changes determined by variations in accumulation conditions or changes since the Last Glacial Maximum. Integration of the surface velocity field with high-resolution ice-thickness data and studies along the EPICA borehole will be used to determine ice deformation along all ice-thickness columns from the summit to the bedrock. This process must be thoroughly investigated in order to derive the history of accumulation rates from deep ice cores, and to better understand the physical and glaciological processes involved.
The first results of submergence velocity measurements along the Dome C–Terra Nova Bay transect appear to indicate steady-state conditions in this part of East Antarctica, in agreement with evidence from radar altimetry (Reference Rémy and LegrésyRémy and Legrésy, 1998) and mass-balance studies of glaciers that flow into Terra Nova Bay (Reference Frezzotti, Tabacco and ZirizzottiFrezzotti and others, 2000; Reference RignotRignot, 2002). Future repeat GPS submergence velocity measurements will improve the accuracy of measurements and reduce uncertainties.
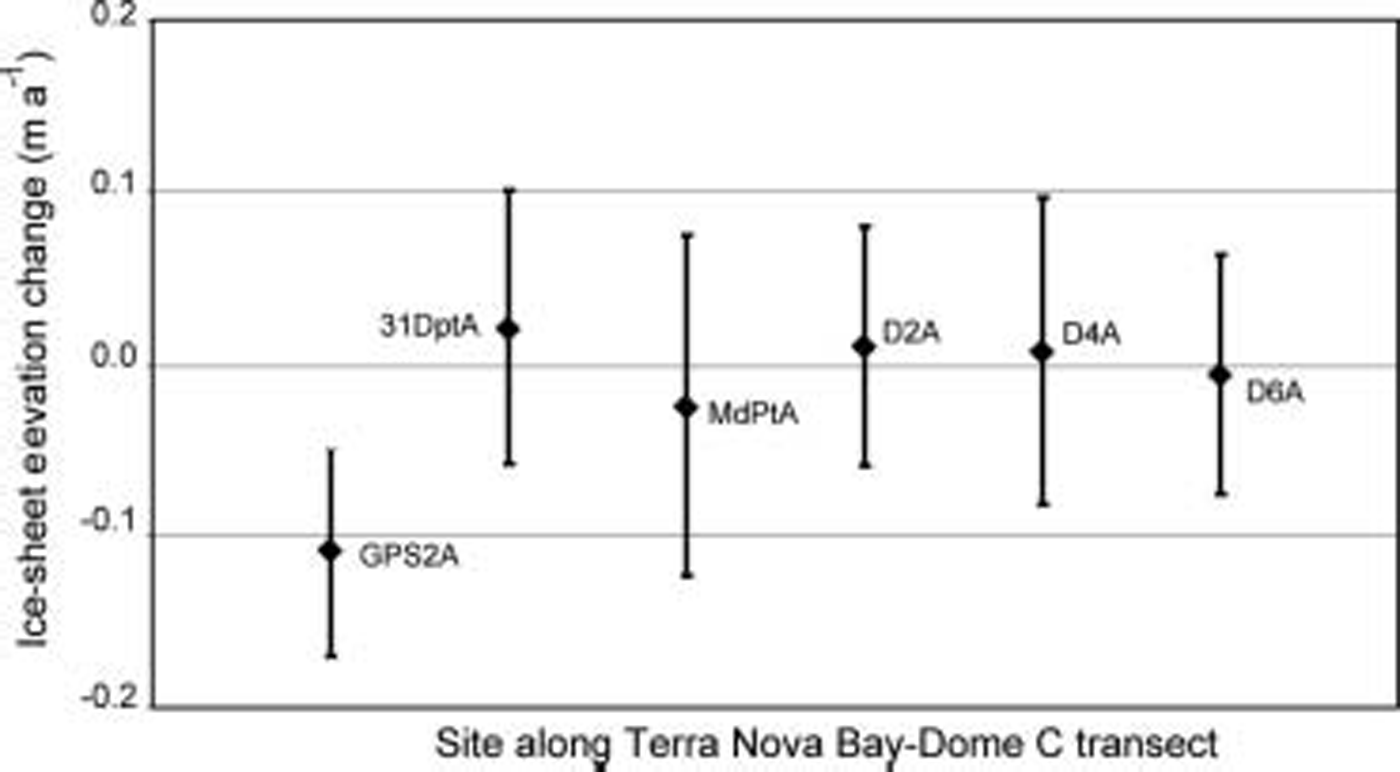
Fig. 5. Ice-sheet elevation change along the Dome C–Terra Nova Bay transect. Estimated measurement uncertainties are shown as error bars (95% confidence level).
Acknowledgements
Research was carried out in the framework of the Project on Glaciology of the PNRA-MIUR and financially supported by PNRA Consortium through collaboration with ENEA Roma, and by the Institut Polaire Français–Emile Victor (IPEV). This work is a French–Italian contribution to the ITASE project and a contribution to the ‘European Project for Ice Coring in Antarctica’ (EPICA), a joint European Science Foundation (ESF)/European Commission (EC) scientific programme, funded by the EC and by national contributions from Belgium, Denmark, France, Germany, Italy, the Netherlands, Norway, Sweden, Switzerland and the United Kingdom. This is EPICA publication No. 88.


