Introduction
Over the last three decades, ice cores have been drilled at numerous locations in Antarctica. They have ranged from cores of 10m or less to the deepest core at Vostok, which is now 2546 m long and spans 220000 years. Soluble ionic chemistry has been measured in many of these cores, and temporal variations have been interpreted in terms of changing atmospheric sources and transport. However, both sources and transport are poorly understood even under current conditions, as is the air snow transfer function, and this hinders temporal interpretations.
One approach to understanding these factors better is to investigate how chemical concentrations vary spatially and seasonally within Antarctic snowfall. Ideally, this would be done with year-round surveys of atmospheric chemistry at many sites. However, aerosol sampling has been conducted at only a very few sites, often for only part of the year, and sometimes too close to manned stations, so that the results are not representative of the regional background. Exceptions to this arc the excellent acrosol records from Neumayer (Reference WagenbachWagenbach and others, 1988) and Mawson (Reference Suttie and WolffSavoie and others, 1992).
The spatial distribution of chemistry in the snowpack can be used as a surrogate for the atmosphere. The ITASE (International Trans-Antarctic Scientific Expedition) sample collections planned for the next few years will provide an excellent data network for doing this. However, much data already exist. It is likely that closer study of them may highlight more clearly some of the questions that ITASE activities need to pursue. Compilations have been made previously for some parameters such as accumulation rate (Reference Giovinetto and BullGiovinetto and Bull, 1987; Reference Giovinetto, Waters and BentleyGiovinetto and others, 1990) and oxygen-isotopic ratios (Reference Moser, Wagenbach and MünnichMorgan, 1982). In this paper, we compile for the first time all the existing and reliable data for soluble chemistry and provide an interpretation of their spatial variability
2 Chemical Species
The major soluble impurities in Antarctic ice are:
-
(1) Sea-salt ions (part of Na+, Mg2+, K+, Ca2+, Cl-, SO4 2-)
-
(2) H2SO4, derived from oxidation of marine biogenic emissions of DMS and from volcanism (both background and sporadic events).
-
(3) HNO3, probably derived from the stratosphere and from tropical lightning (Reference Legrand and SaigneLegrand and Kirchner, 1990). At this time, significant anthropogenic contributions are not discernible in Antarctic snow (away from stations) for either sulphate or nitrate.
-
(4) H2O2, a product of photochemical processes in the atmosphere.
-
(5) Terrestrial input, represented by elements such as Al and Ca, as well as by insoluble dust.
More minor components that have been measured include methanesulphonic acid (MSA) (Reference Lorius, Baudin, Cittanova and PlatzerLegrand and others, 1992), NH4 +, organic acids (Reference Legrand, Feniet-Saigne, Saltman and GermainLegrand and Saigne, 1988) and other trace metals (Reference Graf, Miller and OerterGörlach and Boutron, 1992; Reference Wagenbach, Görlach, Moser and MünnichSuttie and Wolf 1992).
The minor components have been measured only at a few sites and a spatial survey is not yet appropriate. One of the more interesting species may be MSA, because it has only one known source (oxidation of biogenically produced DMS). Current knowledge of MSA has been summarized byReference Lorius, Baudin, Cittanova and Platzer Legrand and others (1992). H2O2 has also been measured at only a few sites and interest in it continues to grow. The terrestrial elements have been reported in a number of ways (particle numbers, dust concentrations, Al and Ca) and it is difficult to produce a widespread or coherent spatial survey, although this would be valuable. In this paper, we therefore concentrate on the first three categories of soluble species.
Large amounts of data exist for Cl-, NO3 - and SO4 2- concentrations across Antarctica. We can supplement the Cl data at other sites where Na+has been measured by converting to Cl-using a sea-salt ratio. This procedure ignores the documented cases where Na+ and Cl are not in sea-salt ratio but, generally, the discrepancy for these two elements is at most a few per cent. Since we do not attempt to look at the fractionation of other sea-salt elements, which requires detailed study of data from single sites or single snowfalls, we have not used Mg2+, K+ or Ca2+ data.
In summary, this paper will compile data for the first three components of the soluble ionic components, using Cl-(and Na-), NO3 and SO4 2data. For SO4 2-, we calculate xsSO4 2 from normal sea-salt SO4 2 /Cl or SO4 2 /Na+ ratios, i.e.:

This means that xsSO4 2- here is in effect the sum of two factors: (i) acidic sulphate and (ii) the deficit (or excess) of sulphate in sea-salt aerosol. The latter factor may be significant at near-coastal sites. Reference MorganMinikin and others (1994) have pointed out that negative xsSO4 2 values are often found at coastal sites, implying that a different ratio is appropriate for marine aerosol, at least for some periods of the year. Therefore, they calculated xsSO4 2 using lower ratios. Because we cannot say what ratio might be appropriate for each site, we use the normal sea-salt ratio to quote xsSO4 2- for all sites, except for those of Minnikin and others where we have used their xsSO4 2- values. In Table 1, we have also shown the effect of the conventional calculation using normal sea-salt ratios on their values
3 Criteria For Including Data
For data to be included in this compilation, they must be of good quality and representative of the chemistry at the site.
Good-quality data require careful, accurate analysis and non-contaminating sample collection. In recent years, scientists have become more aware of the need to collect samples in clean bottles without adding contamination. The introduction of ion chromatography has made analysis of ions (particularly anions) much easier and analysis should, in careful hands, be accurate to 5% or so. We have accepted data where ion chromatography (or, for Na+, atomic-absorption or equivalent methods) has been used, and where suitable sample-collection techniques are believed to have been used. Where there are no other data for a site, we have accepted (mainly older) data not explicitly meeting these criteria but caution that the accuracy of some of these data is uncertain.
It is very important to use data that represent the site in question. For that reason, we have attempted to exclude data from any sporadic events (such as volcanic eruptions) where they significantly affect the mean concentration. Since no significant pollution trend has so far been observed in Antarctic snow for the species we have compiled, we do not need a totally common time scale between sites to achieve comparability, but have generally used data from short cores covering only recent decades. Since there can be large seasonal variations, data should only be accepted where they cover complete years or average many years. However, we have not excluded the French D-sites, where many of the samples cover only 3 years (Reference Legrand and DelmasLegrand and Delmas, 1985). Additionally, at least for nitrate, there is mounting evidence that post-depositional changes occur in concentrations in the surface layers (Reference Osada and HiguchiNeubauer and Heumann, 1988;Reference Minikin, Wagenbach, Graf and Kipfstuhl Mayewski and Legrand, 1990; Reference Yun-gang, hui, qun and LunWolff, in press). For both these last two reasons, data from collections of only near-surface snow cannot be used to infer a background annual mean and cannot be compared to data from other sites. This is unfortunate, as such data are available from large areas of the continent where no other data exist (Reference Langway, Herron and CraginKamiyama and others, 1989; Reference Dahe, Zeller and DreschhoffDahe and others, 1992) but we have had to exclude them. Because of the near-surface loss of nitrate evident particularly at low-accumulation sites such as Vostok, data from below 1 m depth are used where possible but this is discussed later.
4 Data And Discussion
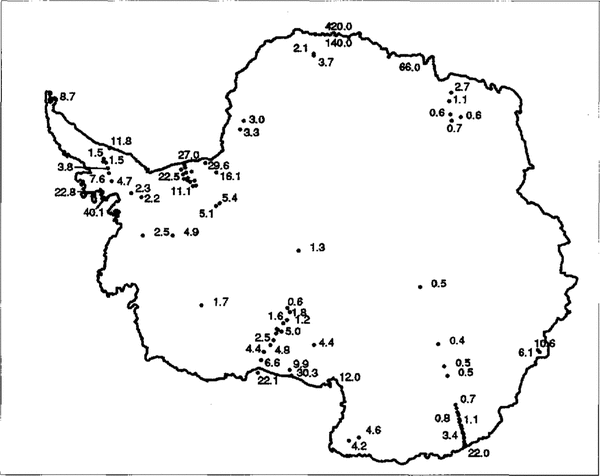
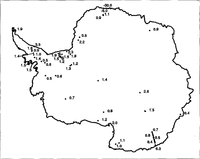
The data accepted by the above criteria are listed in Table 1 and illustrated in Figures 1-Figures 3. The major factors likely to influence concentrations are the distance from the coast, altitude and snow-accumulation rate (listed in Table 1). Secondary factors such as temperature, sunlight received, typical wind speeds and seasonality of deposition may also strongly affect the average concentrations. A problem with analysing the data according to these variables is that many of them vary together. For example, across most of Antarctica, as distance from the coast increases, altitude also increases while temperature and accumulation rate decrease. We discuss each of Cl-, NO3 - and SO4 2- in the light of these factors.
4.1 Cl-
CI- (here sometimes measured directly but at some sites calculated from Na+) is derived mainly from sea spray. Even where HCl is apparently present, it is mainly derived from the reaction of NaCl and H2SO4 (Reference Legrand and DelmasLegrand and Delmas, 1988a). We therefore expect that distance from the sea and, to some extent, altitude, will be crucial factors. We calculate distance ignoring sea ice, because this is highly variable and seasonal, and there are normally shore leads providing at least some open water at the coast. In Figure 4 we present Cl- data from three data sets: the French chain of D sites, the Ross Ice Shelf and the Filchner-Ronne Ice Shelf (FRIS), including Berkner Island and the nearby Coats Land region. Reference Herron and LangwayHerron (1982) has previously calculated an exponential relationship for Cl- against altitude for the Ross Ice Shelf, while Reference MorganMinikin and others (1994) have calculated an exponential relationship against distance for the FRIS. As explained earlier, altitude generally increases with distance from the coast in Antarctica, so either approach may be valid, depending on the topography. For ice shelves, distance from the coast varies independently of altitude, so that this [actor alone can be investigated.
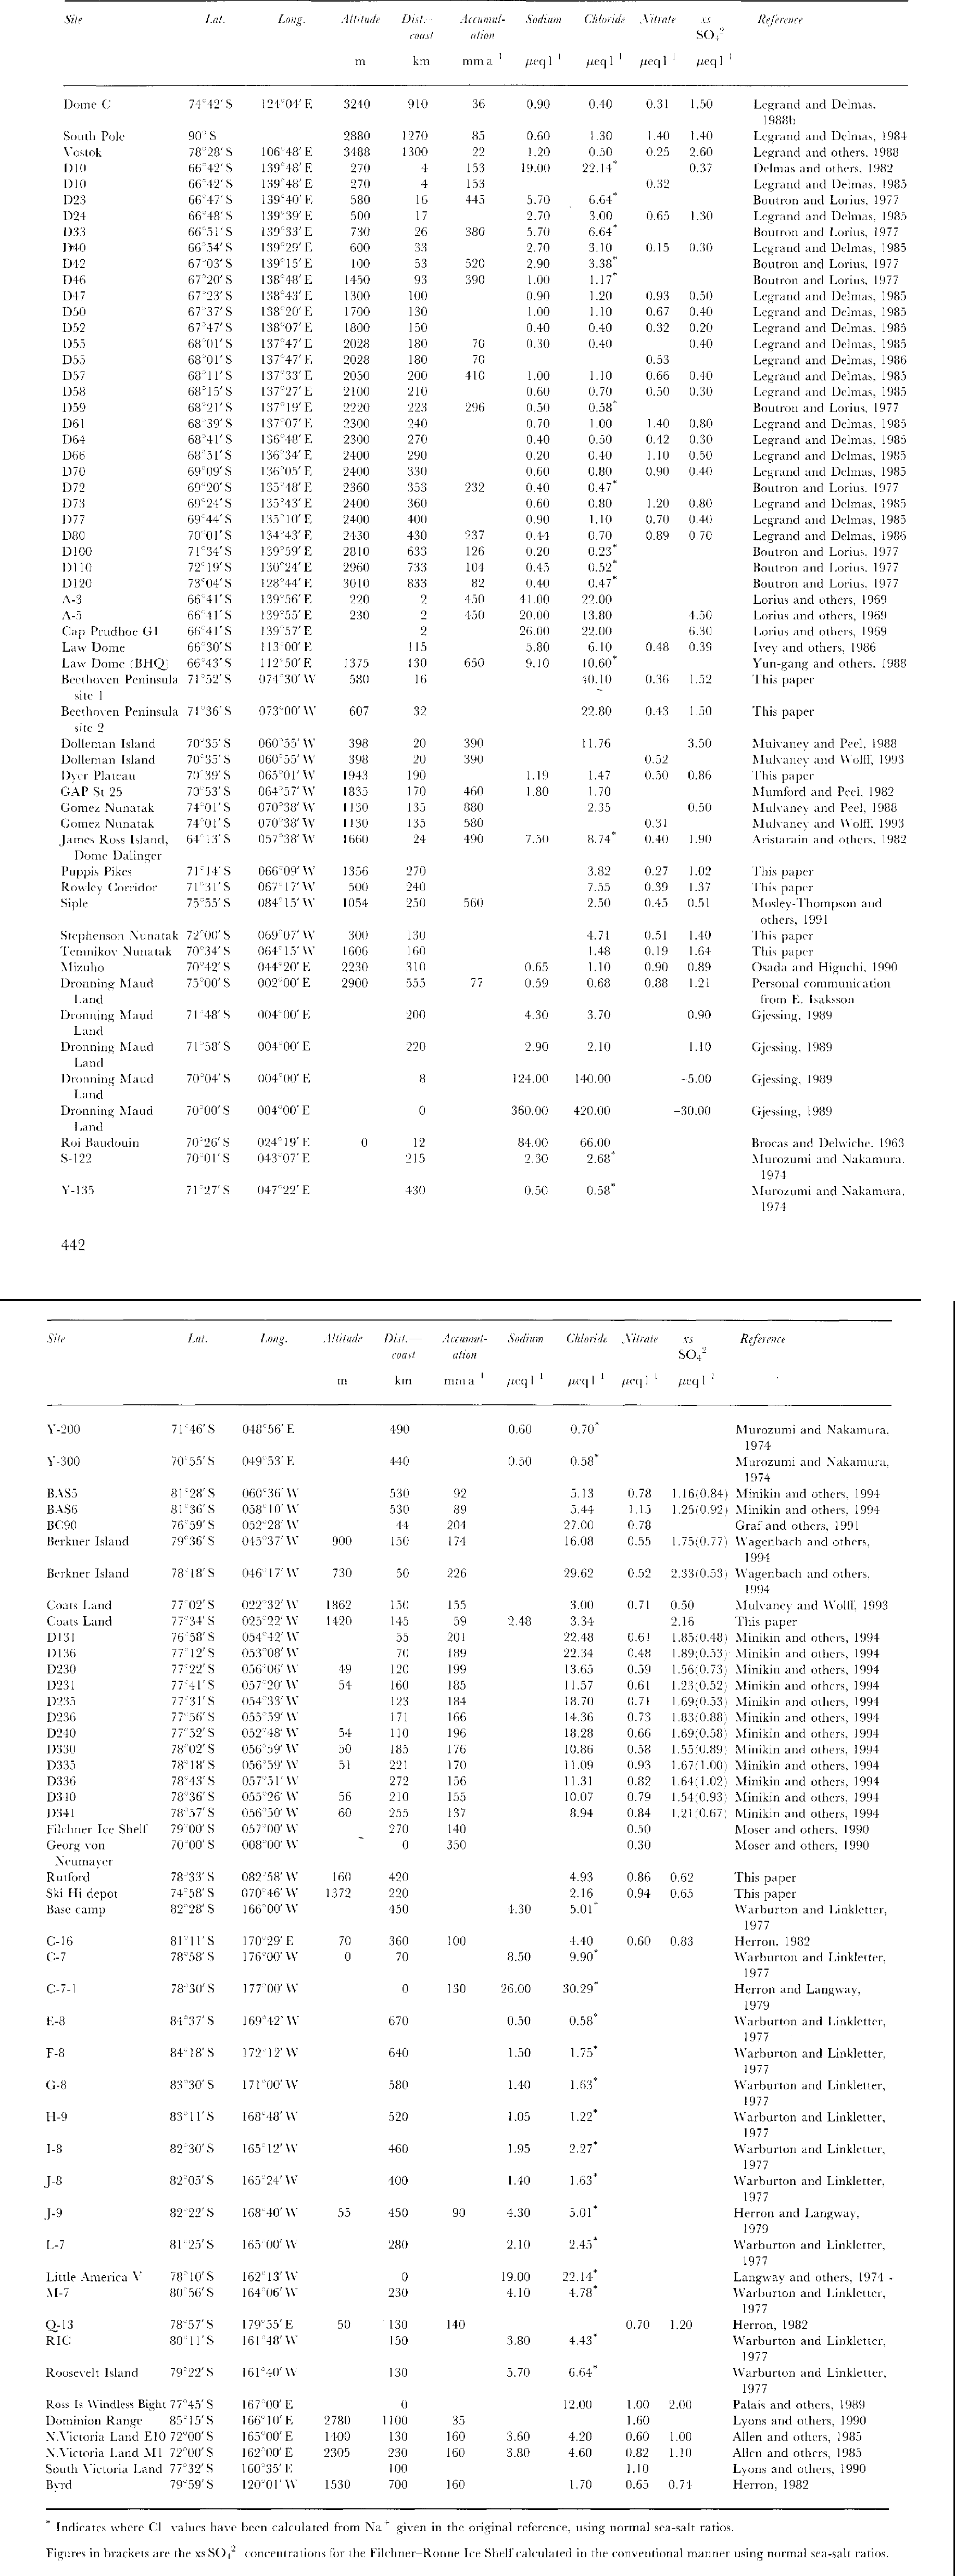

Fig.1
The spatial distribution of Cl- data across Antarctica is shown along with Cl concentrations in ![]() . In areas where there are a great number of data points, selected concentrations only have been given for clarify.
. In areas where there are a great number of data points, selected concentrations only have been given for clarify.
In Figure 4, we have plotted the data against distance. The much higher Cl- values near the coast on the Filchner-Ronne Ice Shelf compared to the Ross Ice Shelf are perhaps due to differences in width of fringing sea ice (so that the true distance to a large body of open water is implied to be greater at the Ross Ice Shelf). There would also be an effect if there were greater wind speeds carrying sea spray to the FRIS. The rate of decline in concentration with distance will be controlled by scavenging losses during transport, which are governed by factors such as wind speed and accumulation rate.
The data from Berkner Island lie within the trend of the FRIS data. The implication is that, at least across open topography as on FRIS, altitude (at least up to 1000 m) has little additional effect on concentrations. However, it is also apparent that at other sites with steep coastal topography (e.g. the line of D sites and Coats Land) there is a much more rapid decrease than on open ice shelves. There is no indication of higher concentrations at low-accumulation sites (Dome C, Vostok) and high-altitude central eastern sites show uniformly low concentrations below 1![]() Finally, the ratio Cl-/Na+is dose to the sea-water ratio at most sites, with notable exceptions at very low-accumulation rate sites- Dome C and Vostok. This may imply post-depositional evaporation of HCl, analogous to the effects suggested for HNO3(Reference Minikin, Wagenbach, Graf and KipfstuhlMayewski and Legrand, 1990; Reference Yun-gang, hui, qun and LunWolff, in press).
Finally, the ratio Cl-/Na+is dose to the sea-water ratio at most sites, with notable exceptions at very low-accumulation rate sites- Dome C and Vostok. This may imply post-depositional evaporation of HCl, analogous to the effects suggested for HNO3(Reference Minikin, Wagenbach, Graf and KipfstuhlMayewski and Legrand, 1990; Reference Yun-gang, hui, qun and LunWolff, in press).
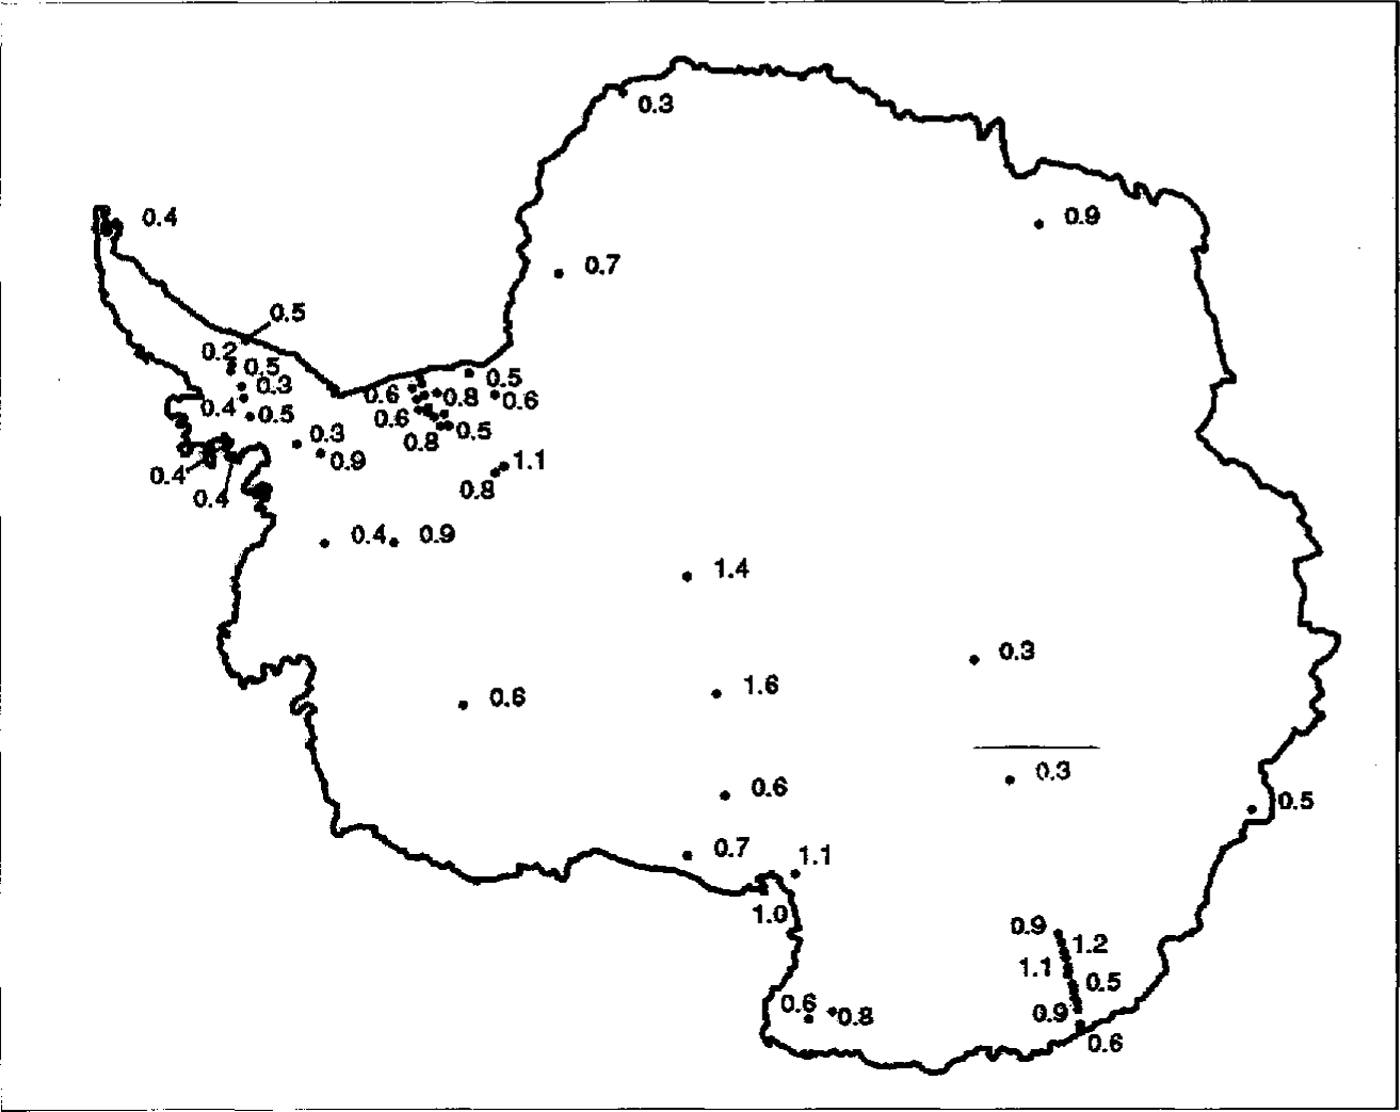
Fig.2
The spatial distribution of NO3
-data across Antarctica is shown along with NO3
- concentrations in ![]() 1n areas where there are a great number of data points, selected concentrations only have been given for clarify.
1n areas where there are a great number of data points, selected concentrations only have been given for clarify.
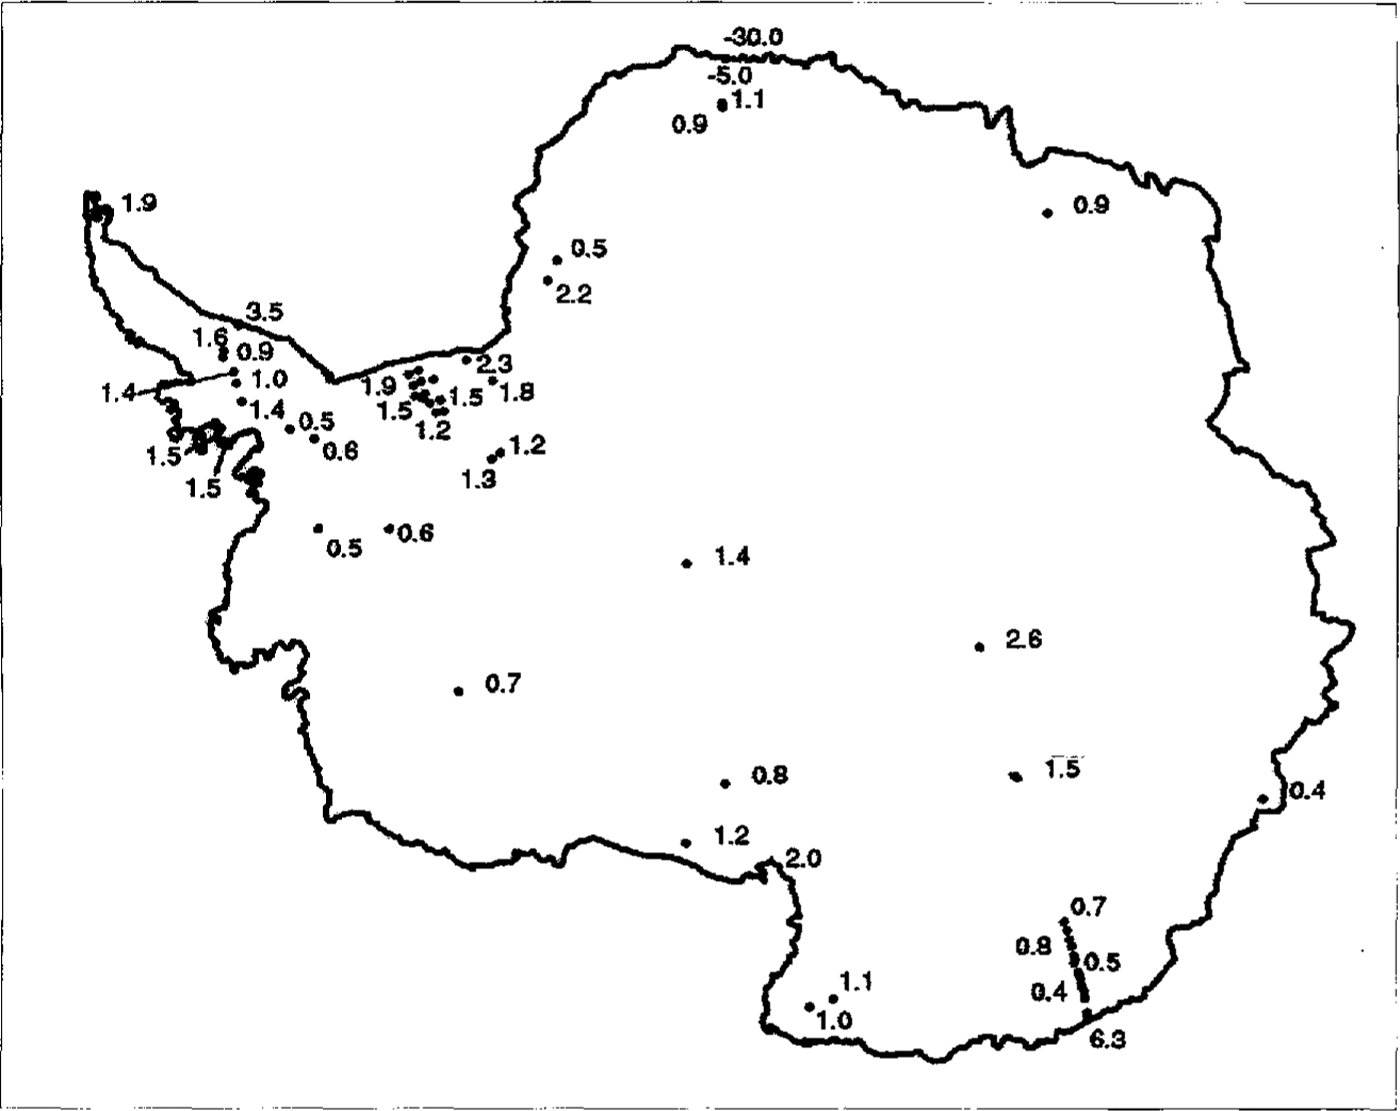
Fig.3
The spatial distribution of xsSO4
2 data across Antarctica is shown along with xsSO4
2concentrations in ![]() calculated as described in the text. In areas where there are a great number of data points, selected concentrations only have been given for clarify.
calculated as described in the text. In areas where there are a great number of data points, selected concentrations only have been given for clarify.
4.2 NO3 -
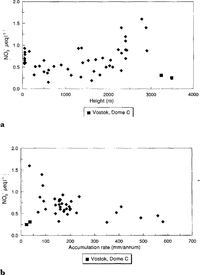
The main feature of NO3(present mainly as HNO3) concentrations across Antarctica is their extraordinary uniformity. The Filchner Ronne Ice Shelf data indicate that there is no effect of distance from the sea (Reference MorganMinikin and others, 1994). Plots of NO3(Fig. 5a andFig. 5b ) against altitude and accumulation rate show that there is a tendency for NO3 - to increase with altitude but decrease with accumulation rate. There are two outliers- Vostok and Dome C. Profiles of NO3 -against depth from these sites show a steady decrease in concentration from the surface to approximately 1m (Reference Minikin, Wagenbach, Graf and KipfstuhlMayewski and Legrand, 1990). This has been explained as resulting from a post depositional loss of HNO3 from the snow, either by evaporation or perhaps photolysis, at these sites where it takes a decade or more for 1 m of snow to accumulate (Reference Osada and HiguchiNeubauer and Heumann, 1988; Reference Yun-gang, hui, qun and LunWolff, in press). For the remaining sites, NO3- appears to increase with altitude, though very low-altitude sites do not fit well with this trend. An altitude dependence might imply a NO3 - source high in the atmosphere, perhaps from the stratosphere. The two major expected sources for NO3 (Reference Legrand and SaigneLegrand and Kirchner, 1990) are the stratosphere and tropical lightning, from which NO3may be transported through the stratosphere. Reference Langway, Herron and CraginKamiyama and others (1989) andReference Dahe, Zeller and Dreschhoff Dahe and others (1992)both noted very high NO3 -concentrations in surface snow at high-altitude sites. An accumulation rate dependence would imply a high proportion of dry deposition at central Antarctic sites, or it may be explained by a relatively constant flux of NO3 to the surface, with dilution at higher-accumulation sites. It is clear that we do not yet understand fully the deposition mechanism of NO3 and further investigation is urgently required.

Fig.4 The concentration of Cl- from the French chain of D sites, the Ross Sea, the Filchner Ronne Ice Shelf, including Berkner Island, and Coats Land plotted against distance from the coast.
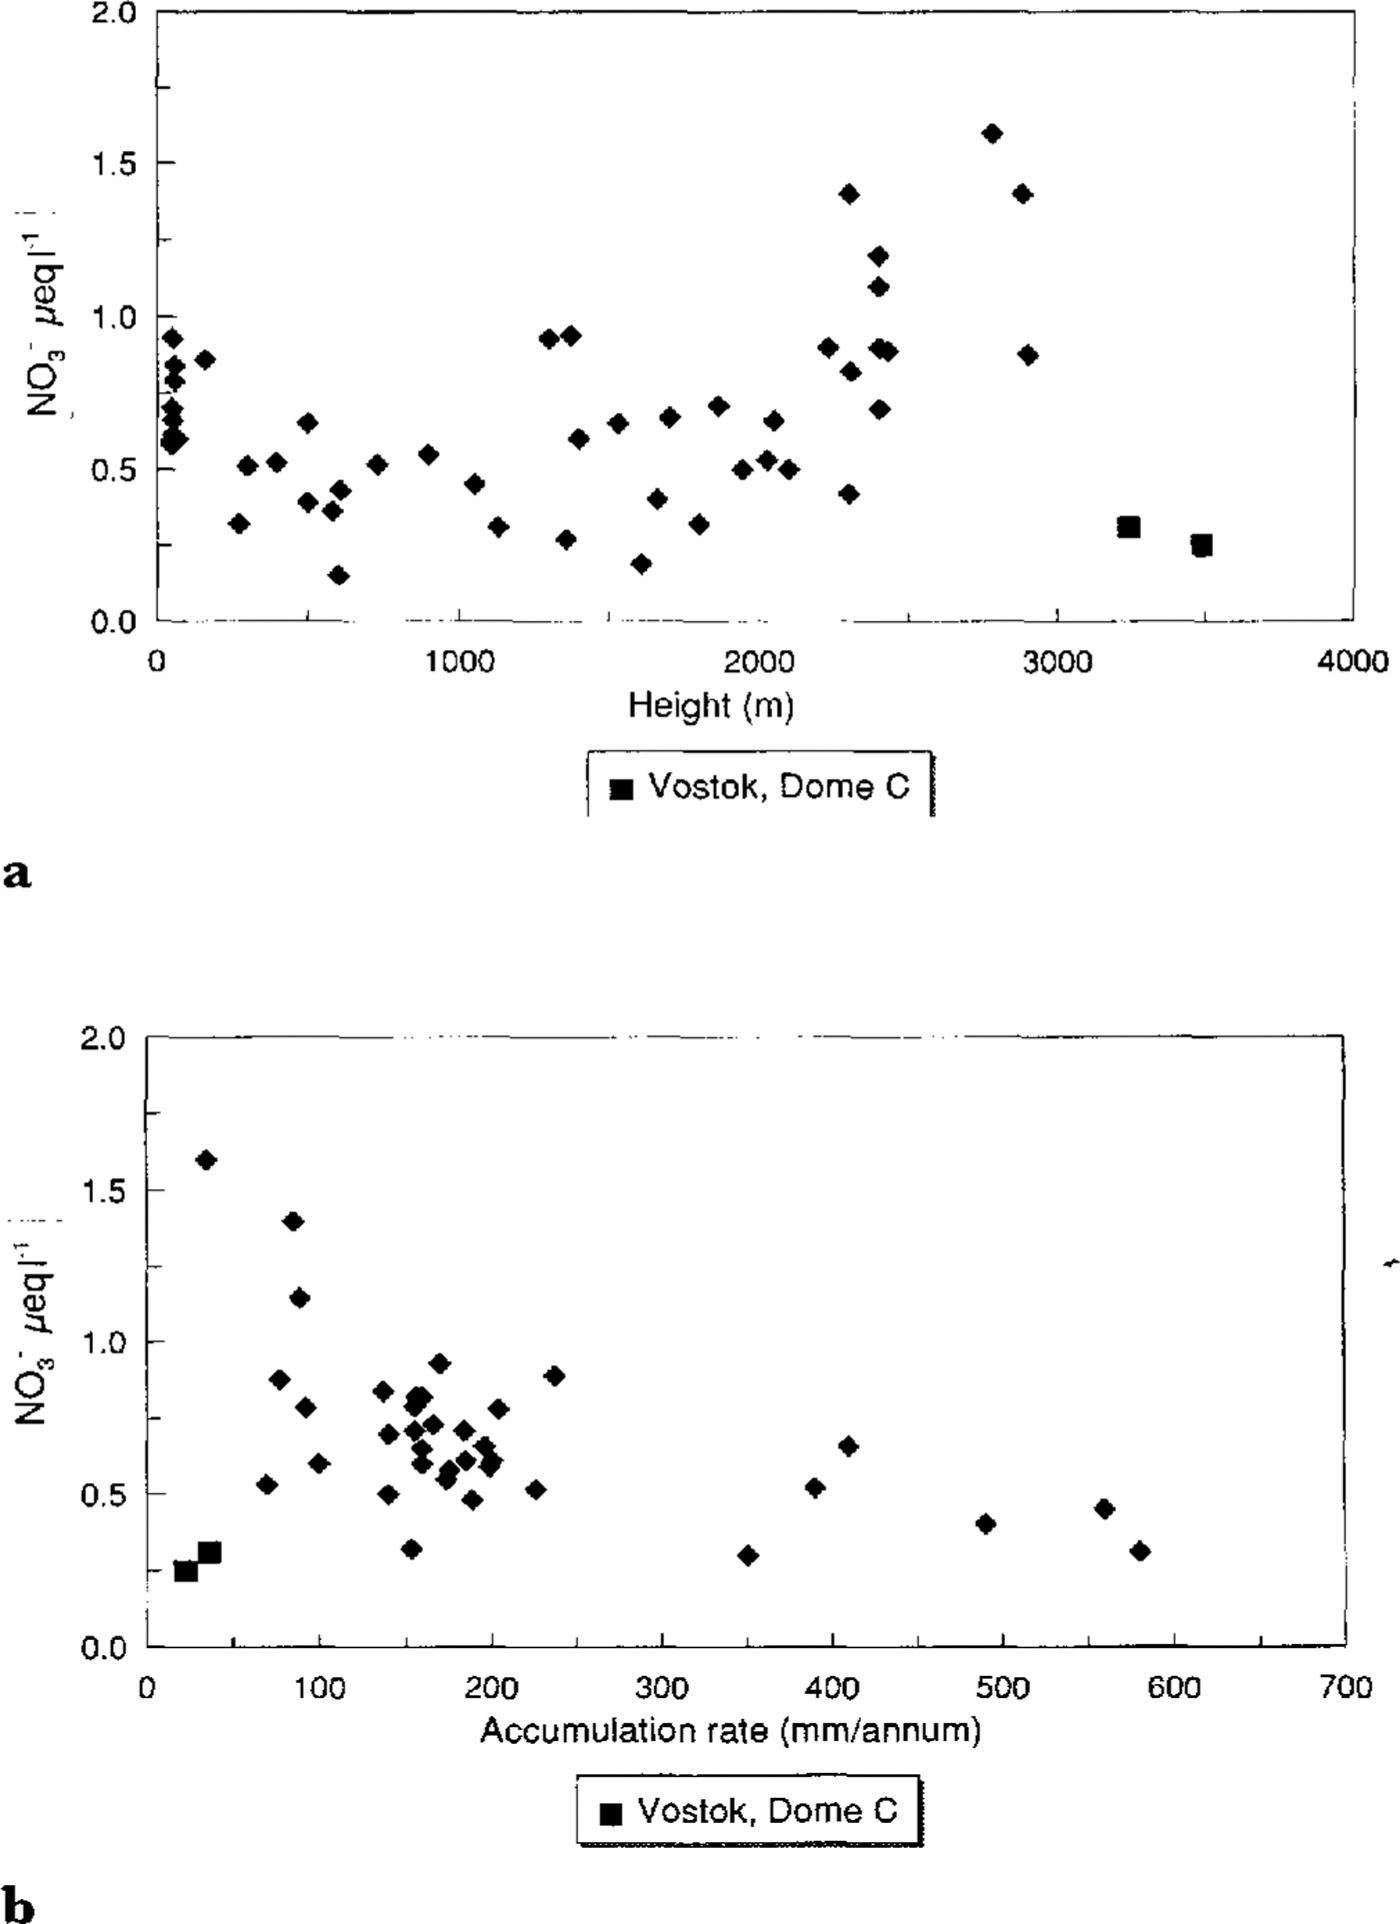
Fig.5 a. NO3 - versus altitude; b. .NO3 - versus accumulation range
4.3 xsSO4 2-
Data from both FRIS and the Ross Ice Shelf show xsSO4 2decreasing with distance from the coast (fig. 6), while the French line of D sites shows no similar effect. However, it should he pointed out that, when the FRIS data arc recalculated using conventional sea-salt ratios, the trend in the data is more similar to that of the D sites.Reference Mumford and Peel Mulvaney and others (1993) found that the concentration of Cl falls off more quickly with distance from the coast than does xsSO4 2-. The data presented here confirm this and the explanation is likely to be a more successful scavenging mechanism for Cl- than for SO4 2-. xsSO4 2- appears largely independent of both accumulation rate and altitude, though the high concentrations at the central East Antarctic sites is slightly anomalous and may indicate the effect of dry deposition. The high concentration, dominated by large summer peaks, found at Dolleman Island is believed to be due to the close proximity of the biologically produced DMS (Reference Mulvaney, Coulson and CorrMulvaney and others, 1992). Similar high values forxsSO4 2- are also found at the coastal sites of Cap Prudhoe and A-5, and we can assume that this is also due to the productivity of the nearby ocean.
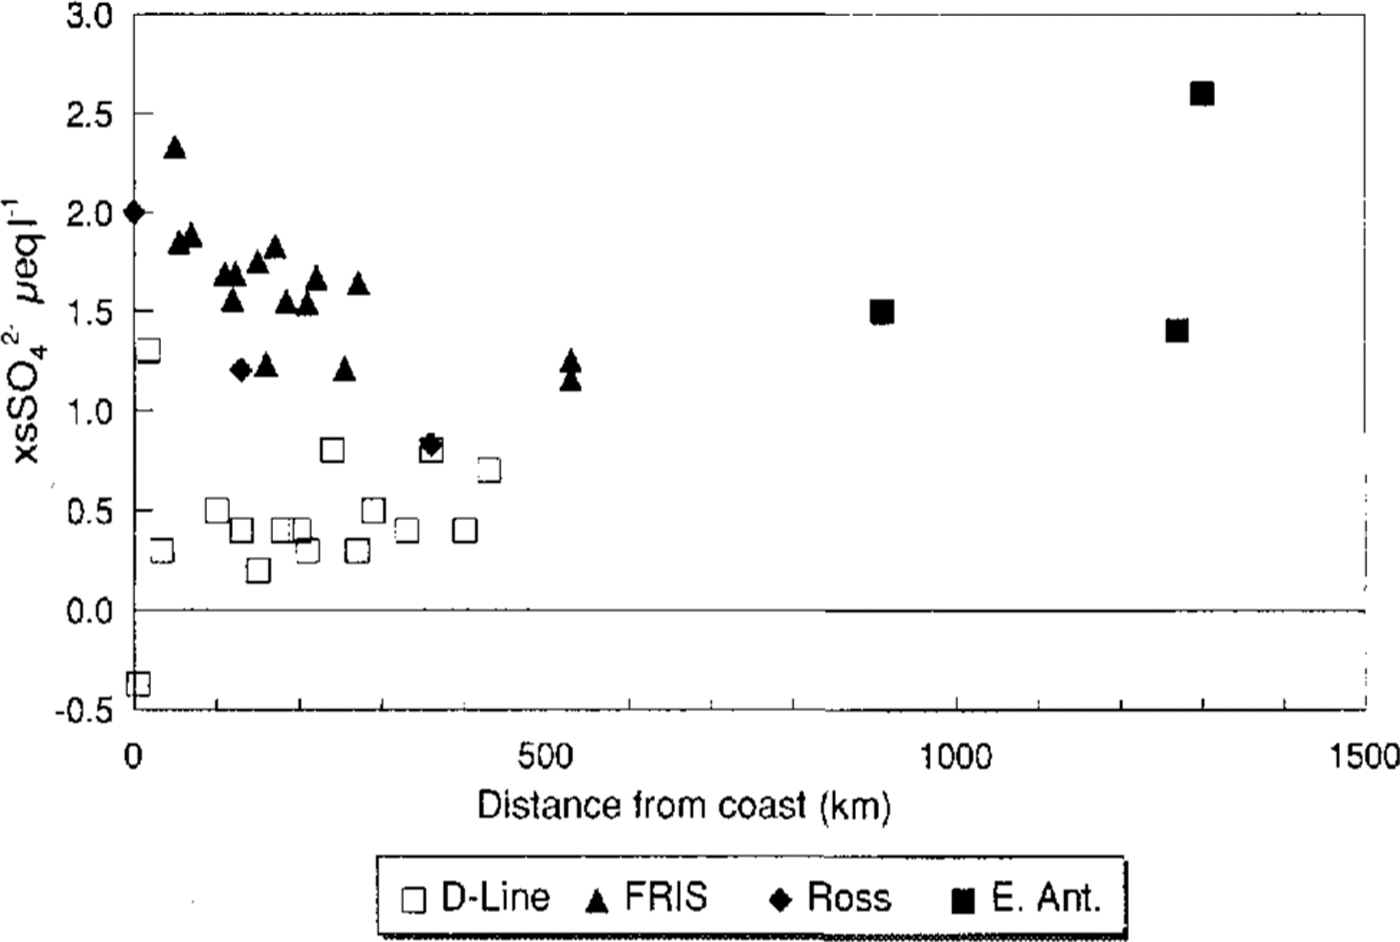
Fig.6 The concentration of xsSO4 2- from the French chain of D sites, the Filchner-Ronne Ice Shelf the Ross Sea and the central East Antarctic sites against distance from the coast
5 Conclusions
Cl decreases with distance from the sea but the coastal topography is also important, with open ice shelves allowing more sea salt to be carried inland than in areas with coastal mountains. No single formula involving distance from the coast and altitude describes all the data, and more data are needed to define regimes where the two factors (as well as possible post-depositional losses inland) are dominant. This may lead to insights into source areas and transport strengths across the continent. More sophisticated studies will need to look at the variation between sites in different seasons, as the seasonal variability can be huge at some sites.
There is a remarkable uniformity in the spatial distribution of NO3 throughout Antarctica but we have noted the importance of post-depositional loss of HNO3 particularly in low-accumulation areas. There is evidence that NO3 concentration is dependent on accumulation rate and/or altitude. A variety of process studies is essential to understand the factors controlling NO3 deposition.
The close proximity of biologically productive areas leads to high concentrations of xsSO4 2 during the summer. Further inland, xsSO4 2decreases, though nor as rapidly as Cl-. It will not be possible to explore further the significance of xsSO4 2 spatial variability until the factors controlling sea-salt fractionation are understood, so that an appropriate method of calculating xsSO4 2-at all sites can be established.
These limited conclusions show the need for collection of additional samples along with carefully designed experiments to investigate post-depositional modification. There are large areas of Antarctica where the data are sparse and it is anticipated that initiatives such as ITASE will rectify this. The maps (Figs 1-Figs 3) point out the severe lack of data on the high polar plateau, and even around sites where multi-national deep ice-core drilling has been proposed. Records covering at least years to decades, and several metres of snow, are needed; large numbers of very shallow cores or surface-snow samples are less useful in this respect. Understanding NO3 deposition and sea-salt fractionation at the process level is also required. With this in place, the spatial distribution of these species can offer significant insights to sources and transport that will greatly enhance our ability to interpret the temporal records in ice cores.


