Introduction
The greater part of the Antarctic coastline is fringed by floating ice shelves, which comprise 11 % of the total area of Antarctica (Reference DrewryDrewry, 1983). About one-third of the inland ice drains into the two largest ice shelves, the Filchner-Ronne Ice Shclf (FRIS) and the Ross Ice Shelf. From two points of view. ice sheIves play a crucial role in the global climatic system:
On the one hand, the inland ice discharges its ice masses into the ice shelves. Assuming steady-state conditions over large time-scales, ice shelves represent sensitive indicators for climatic-induced instabilities of the ice sheet (e.g. Reference MercerMercer, 1978: Reference Van, Veen, Veen and OerlemannsVan der Veen, 1985).
On the other hand. basal melting and freezing of ice shelves is a significant parameter in the formation of Antarctic Bottom Water, which spreads far into the Northern Hemisphere and ventilates the deep part of the World Oceans (Reference Fahrbach, Knoche and RohardtFahrbach and others, 1991).
For all this, field investigations of glaciologically relevant parameters like ice thickness. flow velocity, accumulation rate. temperature. etc., as well as modeling of ice flow. mass and energy balance are necessary tools for a better understanding of the mass balance and dynamics of the Antarctic ice shelves.
For more than 10 years, special interest was focused on the investigation of the central part of the FRIS with extensive glaciological field work (Reference Robin, de, Doake, Kohnen, Crabtree, Jordan and llerRobin and others. 1983, Reference Crabtree and DoakeCrabtree and Doake, 1986; Reference Thyssen and KohnenThyssen, 1986; Reference Engelhardt and DetermannEngelhardt and Determann, 1987: Reference Pozdeyev and KurininPozdeyev and Kurinin, 1987; Reference ThyssenThyssen. 1988). One main result of these investigations was an up to 400 m thick marine ice layer underlying the meteoric ice, which drains from the west Antarctic ice sheet. This marine layer is a significant mass-balance factor and was specially investigated during the German Antarctic Expedition 1989 90 with radio-echo soundings (Reference Thyssen, Bombosch and gerThyssen and others, 1992; Reference BlindowBlindow, 1994) and ice-core drillings (Reference OerterOerter and others, 1992a). In addition, several hot-water drillings were made to investigate the temperature-depth function and the bottom-melting rate by means of temperature sensors and time-domain reflectometry (TDR) devices. Re-measurements of the installed chains in 1991-92 gave reliable results for the bottom-melting rate over 2 years (Reference GrosfeldGrosfeld, 1992; Grosfeld and others. in press).
For a flowline through the central part of the FRIS, we will try to demonstrate in this paper that especially the temperature-depth function is strongly affected by the basal-accretion processes. A comparison with measured temperature-depth data is given. Since temperature is a significant parameter for the flow properties or ice. it influences its dynamic behaviour. In previous studies concerning the flow of FRIS (Reference Lange and MacAyealLange and MacAyeal, 1988; Reference DetermannDetermann, 1991), a mean value for the temperature- dependent flow parameter was used, which is synonymous to an averaging of the rheological properties over the whole ice thickness. This is in contrast to the amount of freezing of marine ice in the central part or the FRIS, since basal freezing produces a heat input and an increase in the depth-averaged temperature, while basal melting erodes the warmest part of the ice column next to the ice/ocean interface and reduces the mean temperature.
Temperature investigation
In 1990, five chains with 64 100Ω platinum RTD temperature sensors were frozen into the 239 ±2 m thick ice shelf in the vicinity of point 61 Fig. 1 on FRIS. Due to logistical reasons, the hot-water drillings were performed in the ice-edge region of the ice shelf; 50 km northwest of Filchner Station, while the main region that is affected by the accumulation of almost 100 m marine ice is located further to the south. The distribution of marine ice and its thickness was derived by Reference ThyssenThyssen (1988) and Reference Thyssen, Bombosch and gerThyssen and others (1992) from radio-echo soundings and surface-elevation measurements. In the investigated area, the meteoric and marine ice was 86 and ~153m thick, respectively.
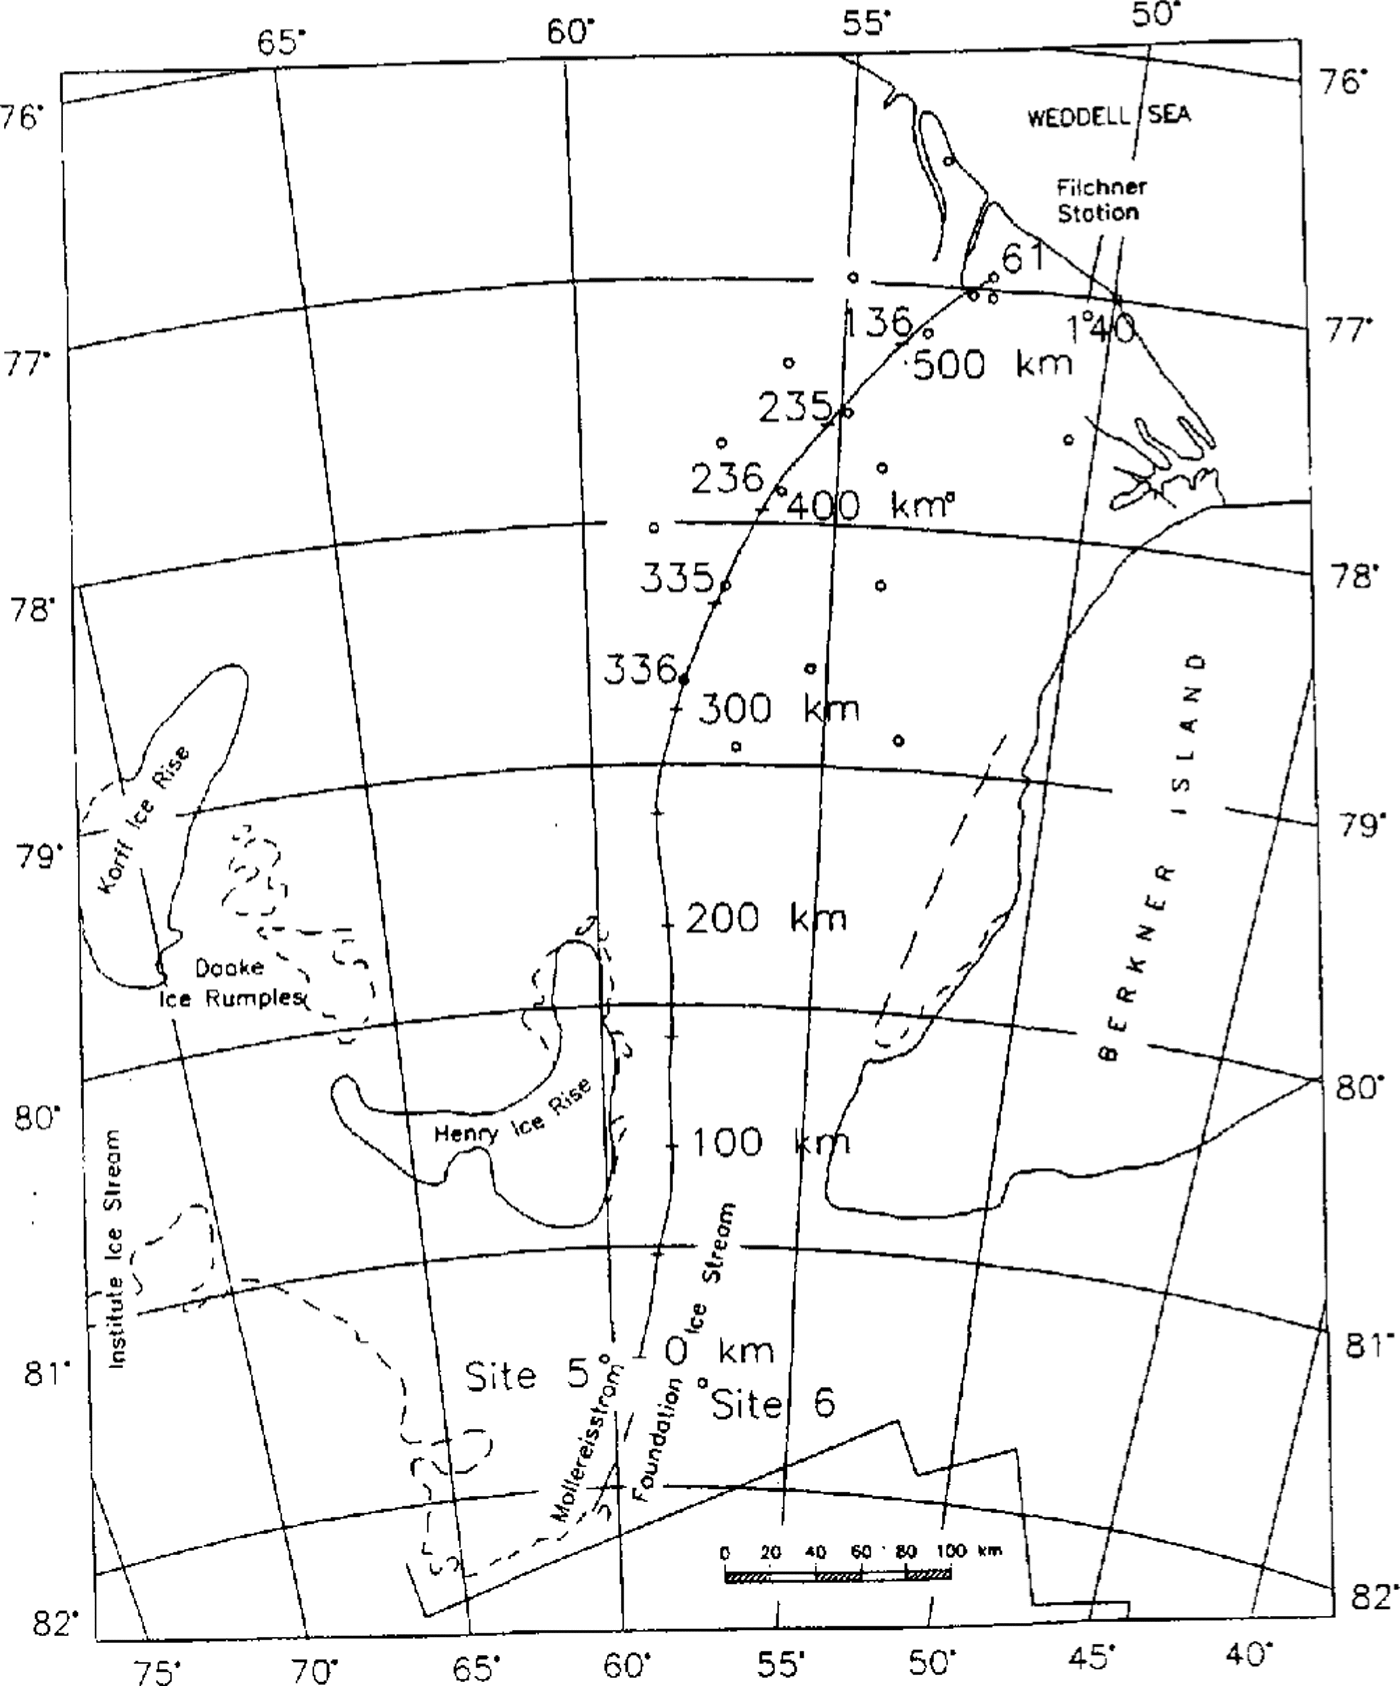
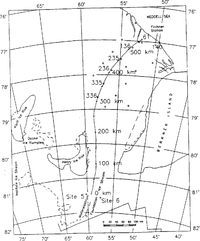
Fig. 1. map of the central part of FRIS (FromReference Swithinbank, Brunk and SieversSwithinbank and others, 1988 ) with calculated .flowline for thermal modeling and geodetic observation points.
A temperature-depth profile from the remeasurement in 1992 is shown in Figure 2 (solid line) The upper 8 m of the temperature profile are influenced by the warm summer period and show a steep negative gradient. Further down, the temperature profile shows a uniform gradient. There is no change in the temperature gradient at the boundary from meteoric to marine ice, indicating; similar heat conductivities and therefore the same thermal properties for both media. Only the lowest 25 m above the ice-shelf bottom arc inf1uenced by bottom-melting processes and show a steeper temperature gradient. The basal ice is eroded by melting processes so fast that heat conduction cannot follow and the temperature-depth function shows a large difference over a small depth range. The influence of the heat input from bottom accretion in the central part of the FRIS, which causes an inversion in the temperature gradient and an almost isothermal basal layer of warm ice with freezing-point temperatures. vanishes at the drill site, 30 km from the ice edge. The temperature profile is a typical cubic one, indicating basal-melting processes.
About 150 km upstream of the hot-water drillings, a temperature-depth profile was measured by Reference Oerter, cker, Kipfstuhl, Nixdorf, Graf and OerterOerter and others (1992b) in a core drilling at point 236. The drillhole reached down to a depth of 320.7 m, whereas the total ice thickness was calculated to be 422 m from surface elevation and isostatic-equilibrium conditions (Reference ThyssenThyssen, 1988). The transition from meteoric to marine ice was detected at a depth of 153 m, which had already been determined by electromagnetic soundings during the 1989 90 field season (personal communication from N.Blindow) and is the same as the depth at point 61. The temperature-depth profile (Fig. 2broken line) shows an S-shaped form, due to bottom freezing of warm marine ice. For the same reason as in the case of basal melting, heat-conduction processes are too slow for temperature compensation between the warm basal ice and the colder glacier ice, so that advection processes dominate. The typical S-shaped temperature depth profile has already been described by Reference MorganMorgan (1972) for the Amery Ice Shelf, where a basal layer of 158m of marine ice was found. Point 236 islocated at the northern boundary of a heavily crevassed area north of Henry Ice Rise. This area probably conforms with the region of main basal freezing as it has been outlined by Reference Thyssen, Bombosch and gerThyssen and others (1992) from intensive EMR soundings. For the modeling of the energy balance on a flowline starting on Möllereisstrom through the central part of FRIS, passing point 236 and point 61, we expect that the S-shape of the temperature depth profile will strongly increase in the region of the main basal accumulation. Further north, the S-shape will vanish due to heat-conduction processes and further downstream due to bottom-melting processes
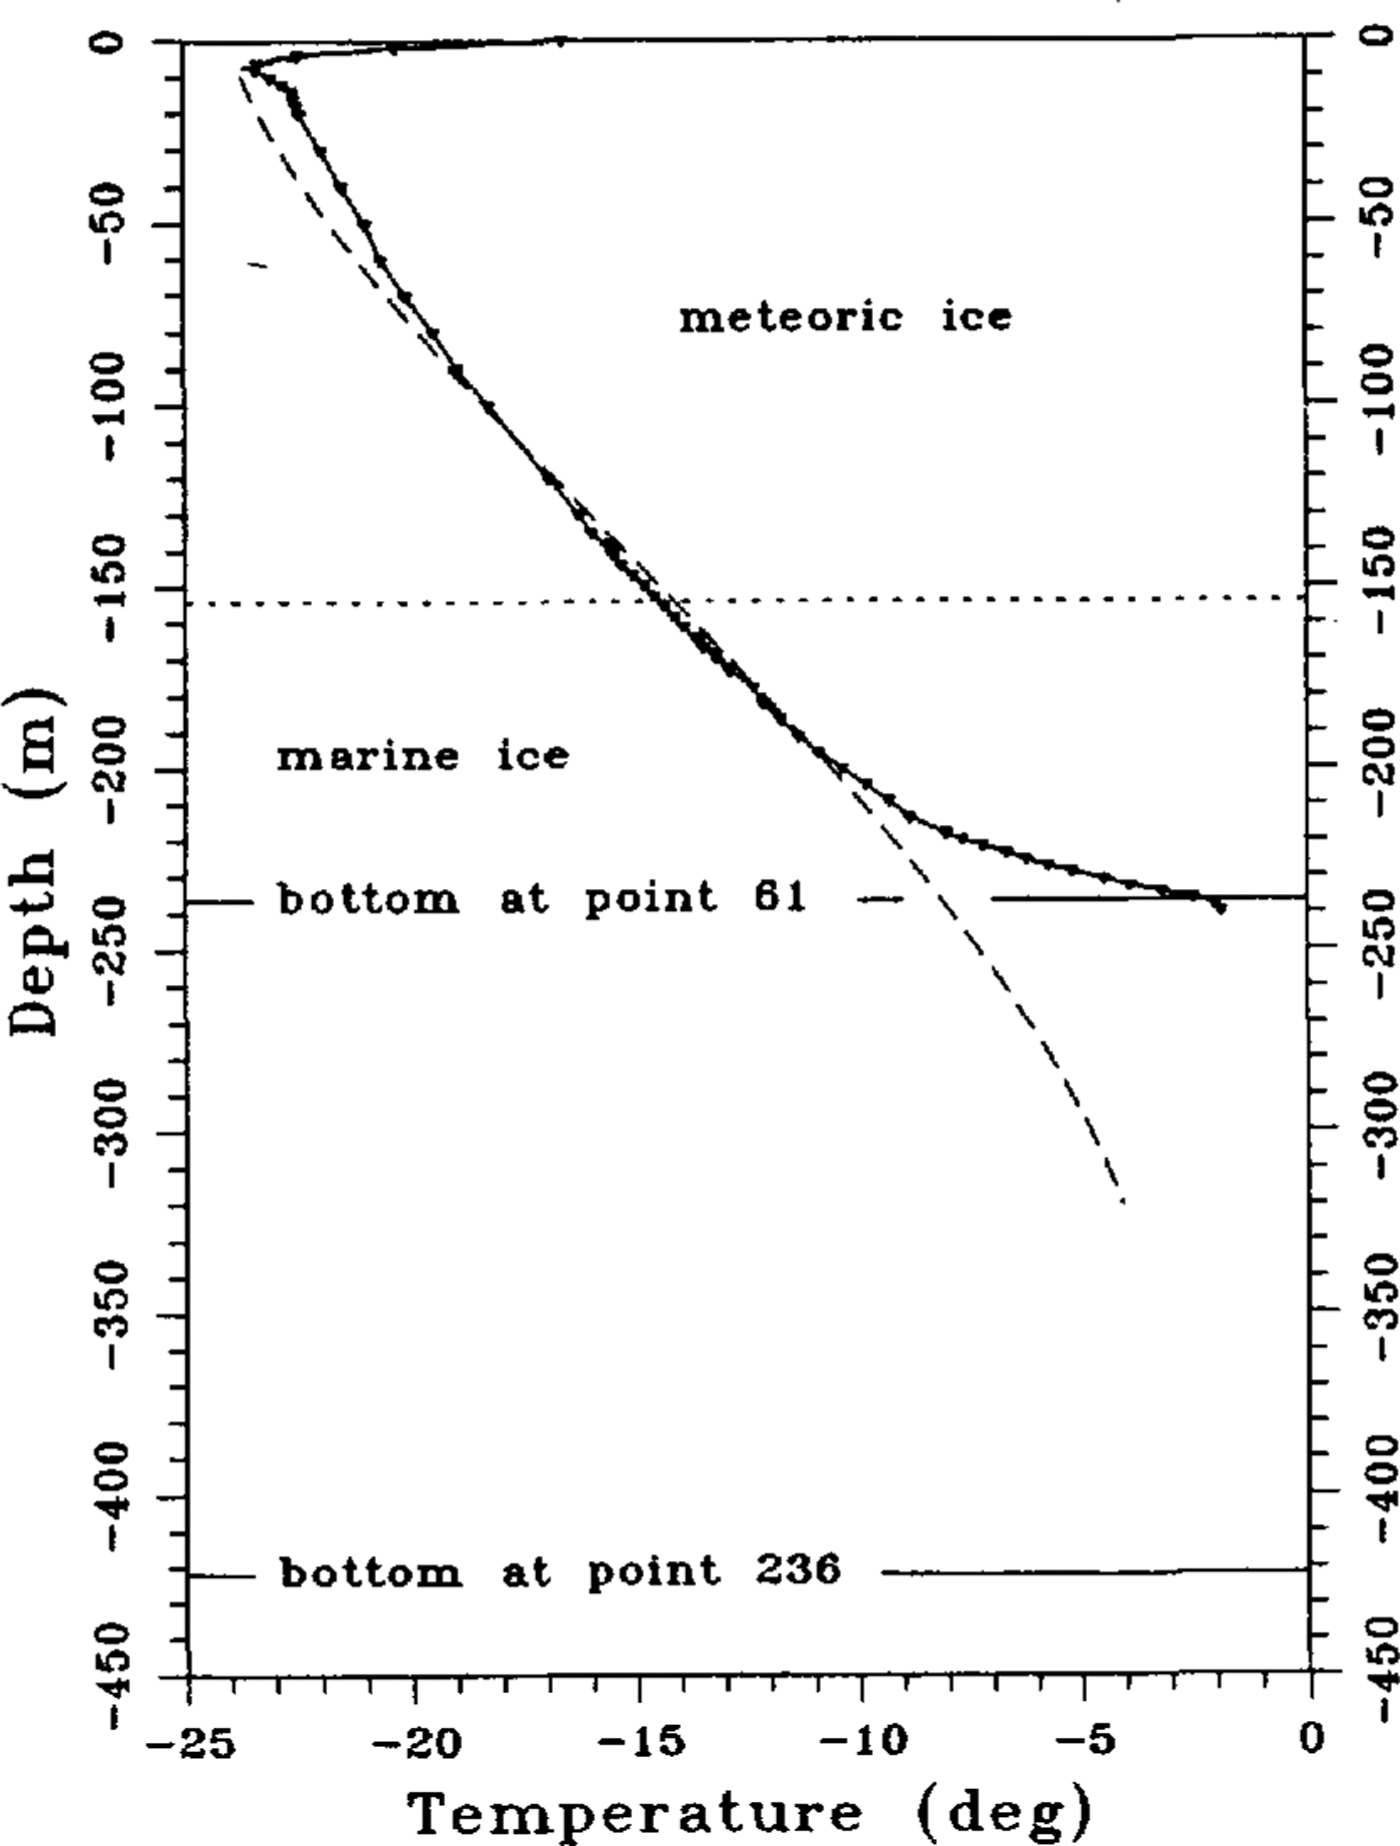
Fig. 2. Measured temperature-depth profiles at point 61(solid line) (Grosfeld and others, in press) and point 236 (broken line) (Reference Oerter, cker, Kipfstuhl, Nixdorf, Graf and Oerteroerter and others, 1992b). the horizontal solid line indicates the ice-shelf bottom al the two locations, while the dolled hOrizontal line indicales the boundary between meteoric to marine ice.
In the next section, a two-dimensional model [or the calculation of the energy balance under consideration for mass conservation is described.
Model theory
The general equation of energy conservation in a homogeneous medium can be described as (Reference Carslaw and JaegerCarslaw and Jaeger,1959):

where T is temperature; t is time; ρ,cp and k are the density, specific-heat capacity and thermal conductivity of the medium, whereas ρ, k are functions of space (x,y,z); u is the three-dimensional velocity vector with its Cartesian components u,v,w,and Q is the rate of internal-heat production. Using this description of energy conservation, conductive terms, as well as advective terms, are considered.
For the determination of the temperature field for the special problem of FRIS, a separation in a meteoric and in a marine layer was chosen for consideration of their different thermal properties.
In the meteoric ice, the process of firn densification influences the temperature-depth function in the upper 100 m of the ice column. This effect has been regarded using functions of depth for density given by Herron and Reference Herron and LangwayLangway (1980) and for thermal conductivity given by Reference Van Dusen and WashburnVan Dusen (1929) or Reference SchwerdtfegerSchwerdtfeger (1963a), respectively. The variation of the thermal properties with temperature has not been taken into consideration, since this effect is small compared with the firn densification in the upper layers and the influence of basal freezing in the lower part of the ice column.
In addition, further simplifications, resulting from the special geometry of ice shelves, are applied. Reference Sanderson and DoakeSanderson and Doake (1979) have pointed out that in nearly all cases vertical shear in ice shelves is negligible. A vertical column of ice remains vertical, far away from grounded regions, so that horizontal components of velocity and strain rate can be treated as depth-independent variables. In this case, the horizontal temperature gradients are negligible compared to the vertical gradient. Horizontal diffusion terms vanish, while the vertical diffusion term dominates. Since the only significant source of internal-hcat production is strain hcating, the Q term is also negligible for ice shelves. From the condition of a depth-independent velocity, another simplification can be determined. The derivative ∂T/∂t can be regarded as a local derivative, moving with the column, so that the horizontal advective term is implicitly incorporated Reference PatersonPaterson, 1981). With the definition of the thermal diffusivity:

equation(1) changes to

The vertical-velocity component Ω controlling the advective-heat transport is a function of depth and can be derived by integrating the vertical strain rate ![]() over the ice thickness, which is given by the condition of incompressibility. Ω is a composed parameter and given at the ice surface by the accumulation rate
over the ice thickness, which is given by the condition of incompressibility. Ω is a composed parameter and given at the ice surface by the accumulation rate![]() at the ice bottom by the melting or freezing rate m (m<0 melting; m>0 freezing), and by strain thinning within the ice column. The origin of the coordinate system was set to the ice surface, where x points into the direction of flow, y and z were chosen to make the system righthanded, with z positive downwards.
at the ice bottom by the melting or freezing rate m (m<0 melting; m>0 freezing), and by strain thinning within the ice column. The origin of the coordinate system was set to the ice surface, where x points into the direction of flow, y and z were chosen to make the system righthanded, with z positive downwards.
The vertical velocity in depth z is (Reference Robin and deRobin, 1955; :Reference Macayeal and ThomasMacAyeal and Thomas, 1986):

where H is the ice thickness.
In contrast to the meteoric ice, the marine ice layer is formed in the water column underneath the ice shelf by crystallization of ice platelets accumulating at the bottom of the ice shelf. This process is caused by a large circulation system in the water column (Reference Hellmer and OlbersHellmer and Olbers, 1989, Reference Hellmer and OlbersHellmer and Olbers,1991; .Reference jenkinsJenkins, 1991) and can be explained by an ice-pump model, which was first introduced by Reference Robin and deRobin (1979) and Reference Lewis and PerkinLewis and Perkin (1986). The ice platelets first form a slushy layer at the ice-shelf bottom (Reference Thyssen and KohnenThyssen, 1986; Reference Engelhardt and DetermannEngelhardt and Determann, 1987), which then condense during its accretion to a compact layer. The enclosed liquid-brine pockets drain during the compaction process into the sea and thus a marine-ice layer with very low salinities in the upper parts is built (Reference OerterOerter and others, 1992a).
To consider these processes in our temperature model, we subdivided the marine ice into two layers. In the lowest part of the ice shelf: a slushy layer with thermal properties depending on salinity and temperature was chosen. Here, we used a thermodynamic model for sea-ice formation comparable to that described by Reference UntersteinerUntersteiner (1964) and Reference Maykut and UntersteinerMaykut and Untersteiner (1971), who gave the following equations for the conductivity ks:
and the product of density and specific heat(ρcp)s:

The subscripts i and S refer to pure ice and marine ice, respectively, where ki = 2.10 W m-1 K-1;β= 0.117 Wm2kg-1; S(z) is the salinity in kg m-3; T is the temperature in K; (ρcp)i= 1.842 X 10⁶J m3 K I; and γ= 17.169 × 10⁶JKkg-1. The second layer above the slushy layer consists of old desalinated ice with a constant salinity, so that only the temperature-dependence of the thermal properties has to be regarded.
Another two equations were introduced into our model. From basal freezing, the slushy layer may be influenced by crystallization heat. Since there is no definite temperature for the phase change from the fluid to the solid state, the latent heat of fusion Ls has to be described as a function of temperature and salinity. According to Reference YenYen (1981), Ls is:

In addition, the density of marine ice is a function of salinity, temperature and air-bubble content (Reference SchwerdtfegerSchwerdtfeger, 1963b). From core samples of the marine ice of FRIS, we know that this ice is clear and already free of bubbles (Reference OerterOerter and others, 1992a), so that ρs is:

with the air-bubble content α = 0 and the density of pure ice ρi = 917 kg m-3
Summarizing these equations, the amount of internal energy due to the formation of ice crystals or melting of ice at the ice-shelf bottom is:
This description of the influence of crystallization processes at the bottom of the ice shelf can be regarded as an internal-heat source in the heat-conduction equation. Since the release of latent heat within the slushy layer is already regarded in the definition of conductivity and volume heat in dependence of salinity and temperature, it is better to be considered in the thermal-boundary condition at the ice/sea-water interface. Heat conduction and advection are the major processes in the slushy layer. Thus, the energy equation for the upper layers of old, desalinated marine ice is:
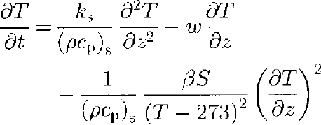
and fur the slushy layer:

Equation(10)and(11)come from Equations(),(5)and(6)
The salinity profile in the slushy layer can be taken as an exponential function according to Reference KipfstuhlKipfstuhl (1991), whereas the thickness of the slushy layer(Hsl) scale the values:

So denotes the salinity of the old desalinated ice with 0.1‰, according to the analysis of the core samples (Oerter and others, 1992a), and  is the coefficient of the exponential function. The parameters Zmet/mar and Zmar/sl describe the depth of the meteoric to marine-ice interface and from the old marine ice to the slushy layer. The maximum salinity at the ice-shelf bottom was set at 10‰.
Numerical solution and boundary conditions
The differential equations describing the temperature regime of a flowline through the central part of FRIS were solved by means of the finite-difference method using normalized, dimensionless coordinates for depth and time derivatives. We used the actual ice thickness H of the ice column as the length scale, so that z* =z/(H(t*), with a dimensionless time-scale t* = Bt, where B = |1| [S-1]. With this definition, the vertical-scale transforms to z* = 0 at the ice surface and z* = 1 at the ice-shelf bottom. In addition, a pseudo-advective term ![]() is introduced into the scaled energy equation, regarding the dynamic change in the vertical grid spacing that is caused by the thickness variation along the flowline while the number of grid points remains constant. We used an explicit scheme for the approximation of the differential equation with centered finite-differences for the depth derivatives and a forward difference form for the time derivative. The explicit scheme is characterized by a strong stability condition and given as k∆t/∆z2≤ 0.5, where ∆t and ∆z are the grid steps in time and depth.
is introduced into the scaled energy equation, regarding the dynamic change in the vertical grid spacing that is caused by the thickness variation along the flowline while the number of grid points remains constant. We used an explicit scheme for the approximation of the differential equation with centered finite-differences for the depth derivatives and a forward difference form for the time derivative. The explicit scheme is characterized by a strong stability condition and given as k∆t/∆z2≤ 0.5, where ∆t and ∆z are the grid steps in time and depth.
The thermal-boundary conditions of the problem are given in Dirichlet's form at the ice surface by the mean annual temperature Tm, which is influenced by a seasonal variation. T(z = 0,t) is:
The influence of a special seasonal phase, which can be described by the additional term Tssin(ωt') in the boundary condition, can be regarded for a composition of measured data with the calculated model. Here Ts and ω/2π: describe the amplitude and frequency of the seasonal variation and t' the special seasonal phase, at which the measurement was performed. At the bottom, the boundary condition is described by the freezing point Tf of sea water at the ice/sea-water interface (Reference Foldvik and KvingeFoldvik and Kvinge, 1974):):
Here, a= -0.057°C, b = 0.0939°C and c = 7.64 × 10⁻⁴ °C dbar-1, Sb is the salinity of the sea water and P is the pressure at the interface in dbar. The interaction between ice shelf and ocean is important for the melting or freezing of the ice shelf as well as the formation of Ice Shelf water, which influences the freezing point. Hence, for its calculation. the heat and salt fluxes at this interface are important parameters and have been described by Reference Hellmer and OlbersHellmer and Olbers (1989) and Reference Scheduikat and OlbersScheduikat and Olbers (1990). The heat balance is given by:
where qw T is the total heat flux crossing the interface. According to Welander (1977), qw Tis proportional to the temperature difference between the sea water and the ice-shelf base Tw-Tb:
ρw=1028kgm3is the sea-water density, which is determined by oceanographic measurements at the ice edge of FRIS (Reference Foldvik, Gammelsrod, Slotsvik and TorresenFoldvik and others, 1985); cpw = 4000 J kg-1 K-1 is the specific-heat capacity of sea water; and γT = 1 x 10⁴ms1 is the turbulent-heat exchange coefficient. qw T is divided into the heat flux at the ice/sea-water interface due to melting or freezing (cf. Equation (9)):
and into heat conduction through the ice:

The interaction of ice and sea water also depends on the salt flux, where the total salt fluxqwS is cqual to the flux qbs, caused by melting or freezing:
Here Sb and Sw are the salinities at the ice-shelf base and the ocean, and γs = 5,05 107 ms1 is the turbulent salt-exchange coefficient.
Using this set of equations, the basal temperature Tb and the melting/freezing rate m can be derived with known values for TiTw,Sw. The values for Tw and Sw can be taken from an ocean model conducted by Reference Hellmer and OlbersHellmer and Olbers 1989, Reference Hellmer and OlbersHellmer and Olbers 1991
Since, in the freezing domain, the build-up of the marine ice body comes mainly from the formation of frazil ice in the water column underneath the ice column, we need to have a more complex oceanographic model to calculate the real basal-accretion rate. For this reason, we derived the melting/freezing rate for the central part of FRIS in areas with marine ice from the continuity equation for mass conservation (e.g. Reference Crary, Robinson, Bennett and jrCrary and others, 1962):

By assuming the model is exactly on a flowline, the velocity components perpendicular to the direction of flow are zero. As internal shear is negligible, the continuity equation can be seperated into two equations, one for the meteoric part and one for the marine part:
Deriving accumulation rate ![]() meteoric ice thickness Hmet and marine-ice thickness Hmar along a flowline by geophysical and glaciological measurements, the vertical strain rate
meteoric ice thickness Hmet and marine-ice thickness Hmar along a flowline by geophysical and glaciological measurements, the vertical strain rate![]() can be calculated from Equation (21).Together with Equation (22), it is possible to obtain the basal melting/freezing rate.
can be calculated from Equation (21).Together with Equation (22), it is possible to obtain the basal melting/freezing rate.
Results of the thermal model on a flowline through the central part of fris
For the determination of the temperature regime in the central part of FRIS, the thermal model was applied to a flowline through the central part, starting on Möller-eisstrom south of Henry Ice Rise and Berkner Island in the vicinity of site 5, passing the geodetic points 336-335-236-235-136, and ending at point 61 (Fig. 1). The flowline was calculated from a two-dimensional ice-flow model described by Reference DetermannDetermann (1991). The boundary values at the ice surface and bottom, as well as the thickness distribution of meteoric and marine ice, were taken from geophysical data (Reference Thyssen, Bombosch and gerThyssen and others, 1992), geodetic data (Reference DetermannDetermann, 1991; Reference Ritter, Karsten, Miller and OerterRitter and Karsten, 1991; Reference Möller, Riedel, Ritter and OerterMöller and others, 1992), glaciological data (Reference Graf, Miller and OerterGraf and others, 1991; Reference Kipfstuhl, Oerter, Miller and OerterKipfstuhl and Oerter, 1991; Reference Morris, Vaughan, Miller and OerterMorris and Vaughan, 1991), and oceanographic modeling (Reference Hellmer and OlbersHellmer and Olbers, 1991). The initial temperature profile was assumed to be that of a steady state, according to Reference CraryCrary (1961), with melting conditions at the ice-shelf base. This assumption can be confirmed by radio-echo soundings in this area. The detected bottom reflections show large amplitudes with mirror-like conditions, indicating basal-melting conditions and an absence of marine ice (Reference Crabtree and DoakeCrabtree and Doake, 1986; Reference ThyssenThyssen, 1988).
For the numerical simulation. the ice thickness at site 5 was measured as 1016 m. It was divided into 255 steps with an increment of 4m. The duration of the simulation along the flowline was calculated from the velocity field as 1362 a. The time increment was set at 0,01 a, which fulfilled the stability condition with its decreasing depth increment during the whole simulation. At the end of the simulation, an ice thickness of 235 m was reached.
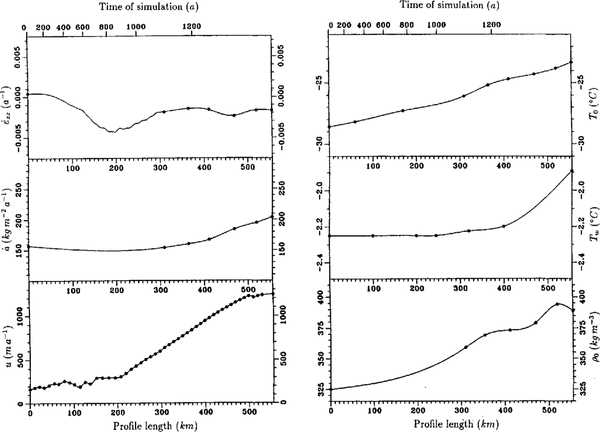
In Fig. 3, an overview of the input data along the f10wline is shown. The circles correspond to measured data at fixed geodetic points, while flow-velocity data were taken at a distance of about 2 km from the flowline calculated by Reference Engelhardt and DetermannDetermann (1991). For equidistant grid points, the data were additionally interpolated by a spline algorithm. The vertical strain rate was calculated from data in the area of the basal marine layer with a separated continuity equation (cf.Equation(21)). The data show a negative gradient in the area between Henry Ice Rise and Berkner Island, where the ice flows through a narrow confined channel with strong lateral shear. The vertical strain rate decreases from -1,0 × 10³a1 to -4,3 × 10⁻³ a-1, which is caused by the large decrease in meteoric ice thickness from 830 to 330 m over a distance of about 90 km. After 200 km of profile, the influence of Henry Ice Rise and Berkner Island is passed and the ice spreads due to horizontal divergence. This effect can also be recognized in the velocity profile that rapidly incff:ases north of Henry Ice Rise.
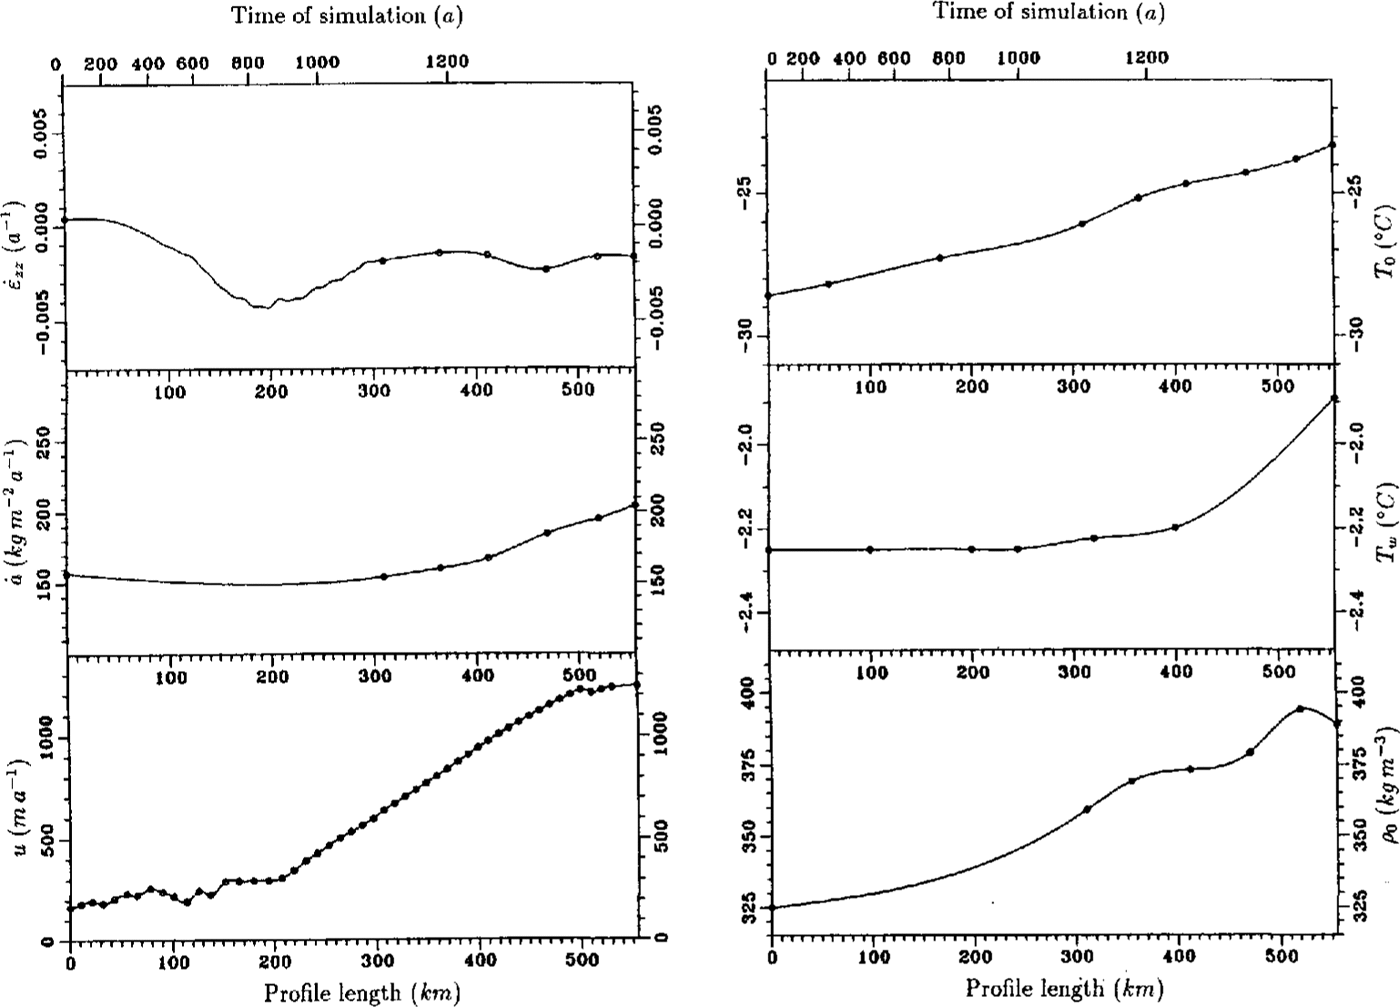
Fig. 3. input data for the thermal model (references in the text). Circles indicate results from measurements at distinct geodetic points along the calculated flowline. The solid line is the result of a spline interpolation at equidistant grid points. In the case of vertical strain rate, the values between 0 and 100 km were calculated from Equation(20),from 100 to 300 km from Equation (21)
The strong decrease in meteoric ice thickness is partly compensated by the accumulation of marine ice. The amount of freezing and melting, which already occurs in the northern part of the ice shelf, was calculated in the area of marine ice from Equation (22) and in areas of no marine ice from Equation(15). The ice thickness and the calculated freezing/melting rate is shown in Fig. 4. The ice-thickness profile is typical for ice shelves. Starting with a large ice thickness of more than 1000 m near the grounding line, the ice thins along its flow out to sea. After about 100 km, the process of basal freezing influences the mass balance. The maximum amount of freezing occurs at approximately 150-180 km of profile, the northern edge of Henry Ice Rise. Here, freezing rates of 2 ma-1 are calculated. The area extends to about 260 km length, where an intermediate regime is reached and neither significant freezing nor melting dominate. The increase in meteoric ice thickness, which is caused by snow accumulation, is compensated due to thinning by strain. After 450 km, a melting-profile regime dominates. The melting rate increases continuously to a value of -3 ma1until it decreases again to a value of 2 ma-1 near point 61. Considering the error estimate of about+ 0,5 ma-1, this value confirms with the investigation of basal melting from three independent experiments in the same region (Grosfeld and others, in press). Here, a mean melting rate of-1,4 ± 0,5 ma-1 could be determined.
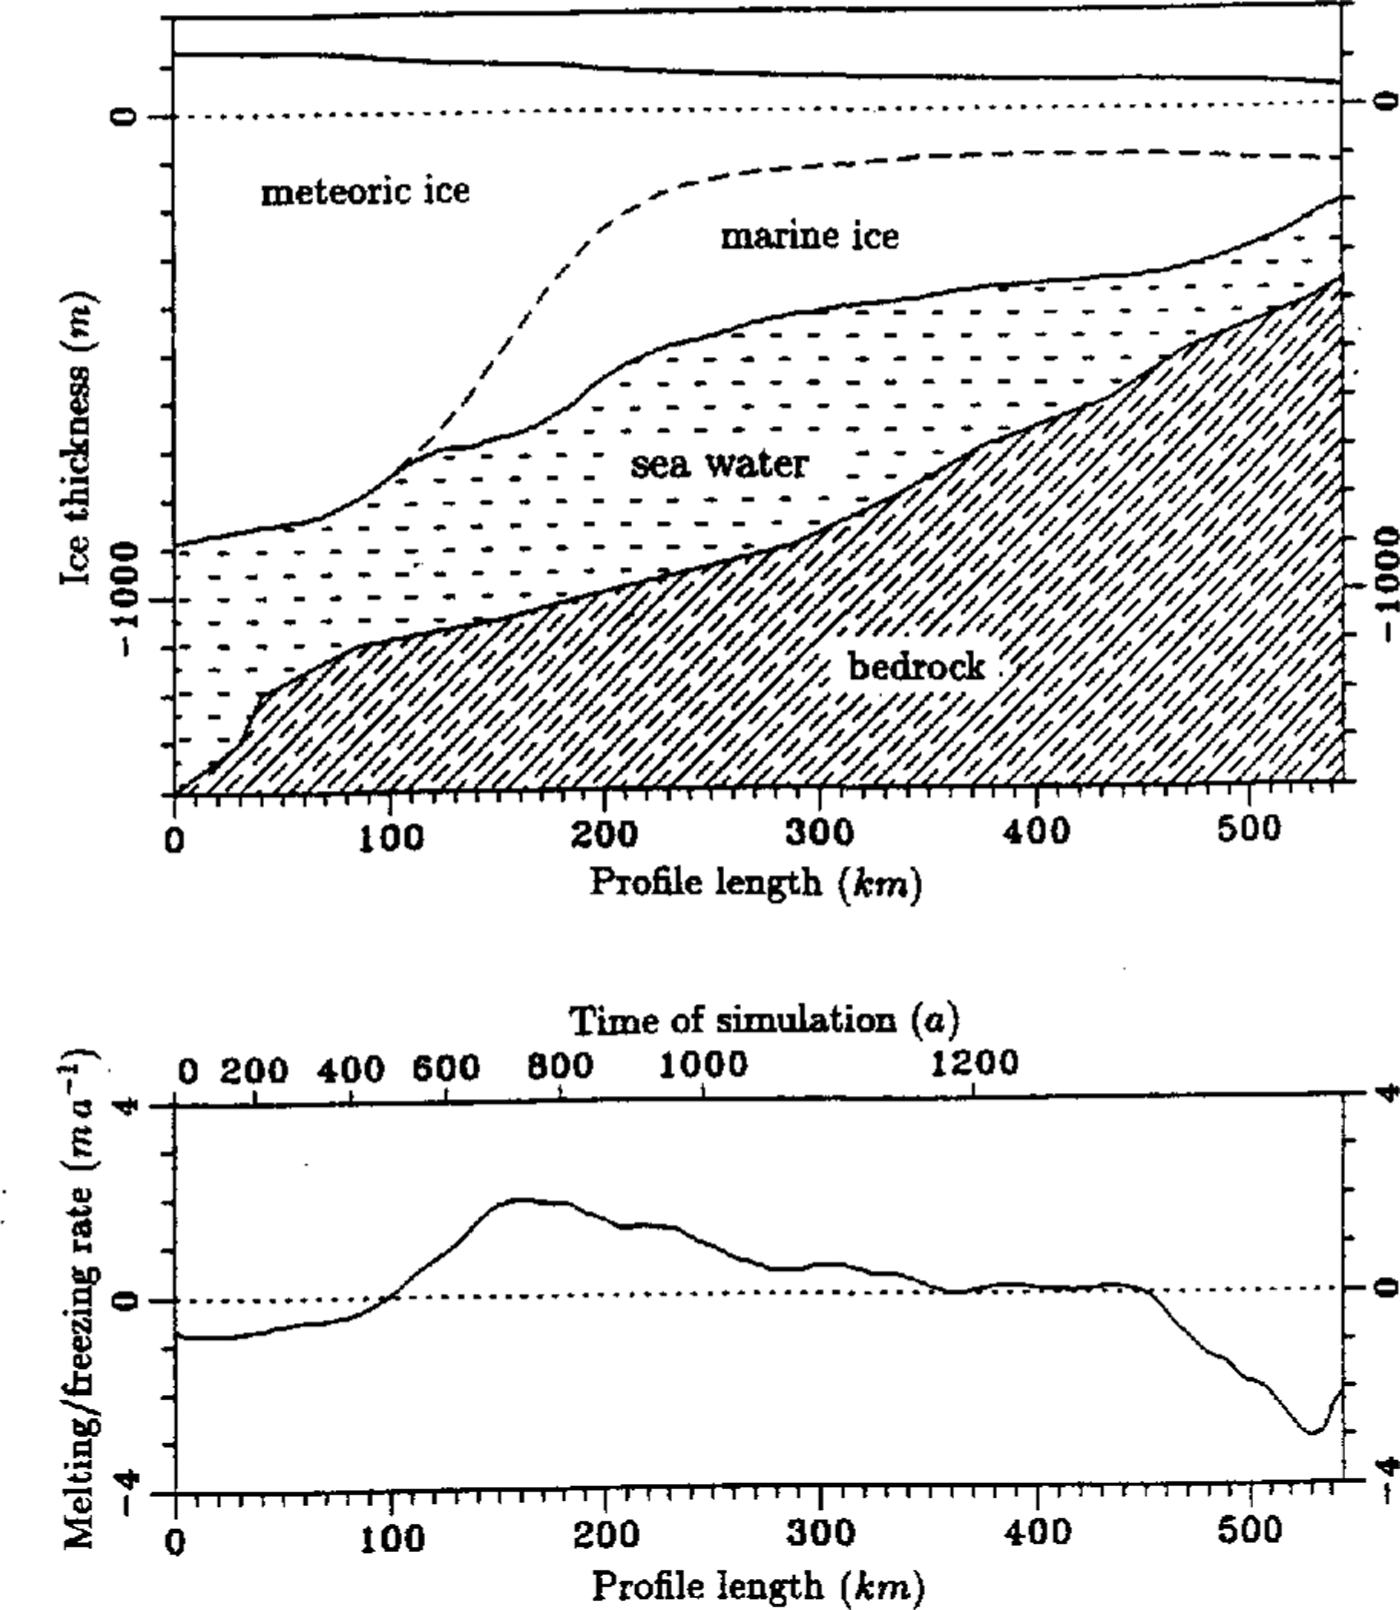
Fig. 4. Ice thickness and melting] freezing rate (positive values: freezing) along the flowline through the central part of FRIS. Sea-bottom tophography in the upper plot is taken from Reference Pozdeyev and KurininPozdeyev and Kurinin (1987)
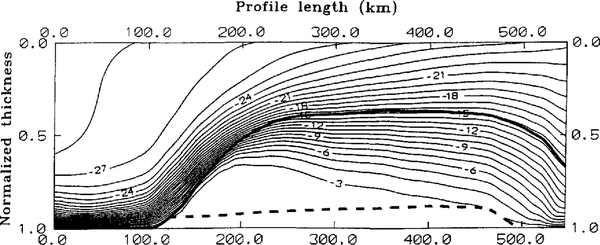
The thermal model for this flowline was used with the described boundary values and conditions. The marine layer was divided into a slushy layer and an old desalinated part. The maximum thickness, the slushy layer could achieve, was set 50 m. For marine ice at thicknesses greater than 50 m, the ice nearest the boundary with the meteoric ice becomes consolidated. This is in agreement with an increasing sensible softening in the lower 35 rn of the ice shelf found by Engelhardt and Reference Engelhardt and DetermannDetermann (1987) from hot-water drilling at point 335. They explained this by a non-consolidated layer of slush. For the model, this layer was enlarged to 50 m to include the full consolidation and desalination of the slushy layer to the so-called old marine ice. The result of the thermal model with scaled dimensions in depth is shown in Figure 5.
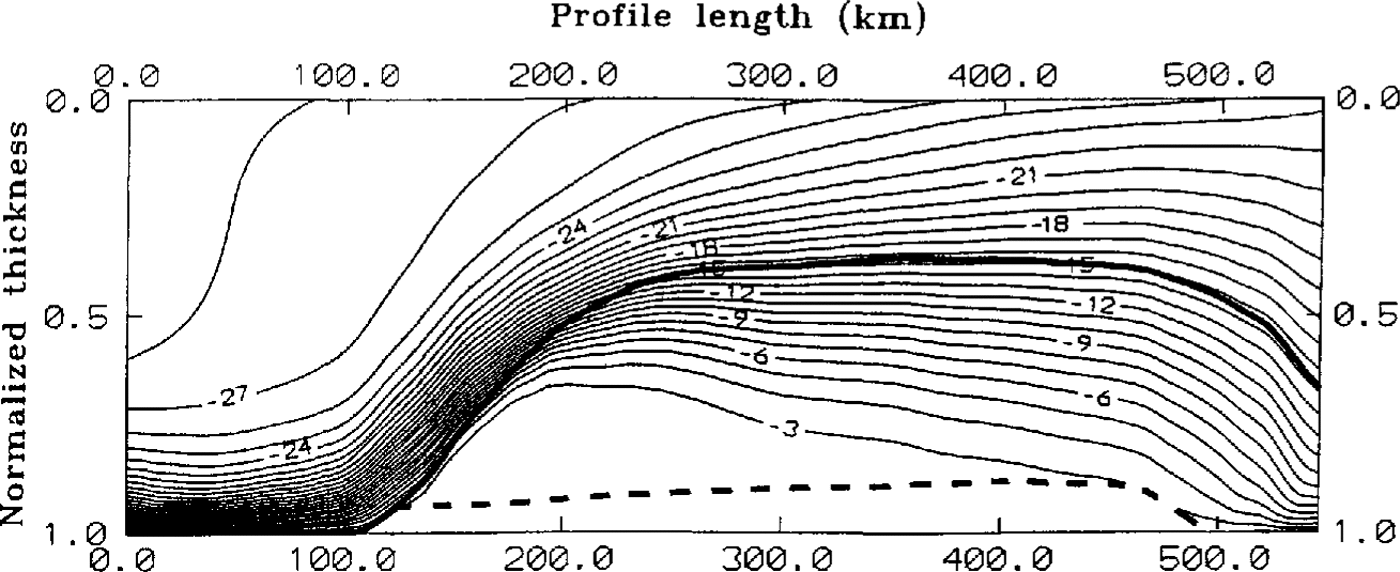
Fig. 5. Steady result of the two-dimensional thermal model through the central part of FRIS as a function of normalized ice thickness and profile length. Contour lines with a spacing of —1°c The boundaries between meteoric to marine ice and the normalized thickness of the slushy layer are indicated by heavy and broken lines, respectivelv.
The change in temperature-depth profile with simulation time and hence with distance along the flowline shows an extreme influence by basal freezing. Lp to 100 km, a typical cubic profile indicating melting conditions was calculated. In the area of basal accretion, this profile changes into an S-shape with about 40% of the ice column showing temperatures between -2,25° and -6,0°C. The thermal conductivity of the slushy layer is about one-third lower than that of pure ice. A comparison with a thermal model neglecting the salinity and temperature-dependent thermal ice properties has been made. The change of temperature gradient in the lowest 50 m is during its building process steeper than in the case of a slushy layer. which demonstrates the absence of the isolating slush.
The relatively warm temperatures influence the thermal properties in large parts of the marine ice during the main basal freezing. In the intermediate part from 360 km onward, conductive heat transports are the major processes. The steep temperature gradient at the interface from meteoric to marine ice weakens and the marine ice gets colder. From 450 km of the profile, the temperature-depth function is significantly influenced by basal melting. Over a distance of about 30 km, the slushy layer melts and the almost isothermal profile with temperatures between -2,0° and -4,0°C vanishes. The temperature-depth profile changes into a cubic profile, where the basal melting erodes the warmest part of the ice column and reduces its mean temperature.
In Fig. 6, single calculated temperature profiles at distances of 25 krn along the flowline and a comparison with measured profiles are shown. In this plot, the influence of basal accretion can easily be recognized. In the area of main basal freezing (profile at 175 km distance) the temperature—depth gradient changes to an almost isothermal profile with temperatures between -2,315° and -2,415°C over a depth range of 180 m. with decreasing basal freezing, the temperature gradient increases and changes into a cubic one in the area of basal melting near point 136. The calculated profiles can be compared with measured data at two different sites. At point 236, the model shows colder temperatures than the measured data in the depth range of 20-270 m. The maximum temperature difference of-1,31°C occurs at 140m depth. Below 270m, both data sets fit dose together. There are several reasons for the difference between the calculated and measured data. On the one hand, the boundary values and the ice thickness depend very much on the estimated flowline and can only give an approximation of the real history of ice flow. On the other hand, the two-dimensional calculation docs not include the influence of the large crevassed zone in the central part, which probably is directly correlated with the thermal regime. Lastly, the measured temperature data themselves contain different possibilities for a non-steady state at the end of the field season 1991-92. Since ice-core drilling transports warm temperatures from the lower part of the ice shelf into the upper ice layers, the drillhole warms up, causing a disturbance in the steady-state temperature-depth profile. A comparison of the tempera¬ture data at point 236 with that at point 61 shows that the temperatures at 110 200 m depth are 0.3°C warmer at point 236 than those at point 61. From heat-conduction processes between the cold meteoric and the warm marine ice, an additional warming can he expected on the track from points 236 to 61. Therefore, the actual temperatures at point 236 are probably lower than measured, and closer to the modeled profile than suggested by the measurements. Because of these reasons, the calculated temperature profile can be taken to be in agreement with the measured data.
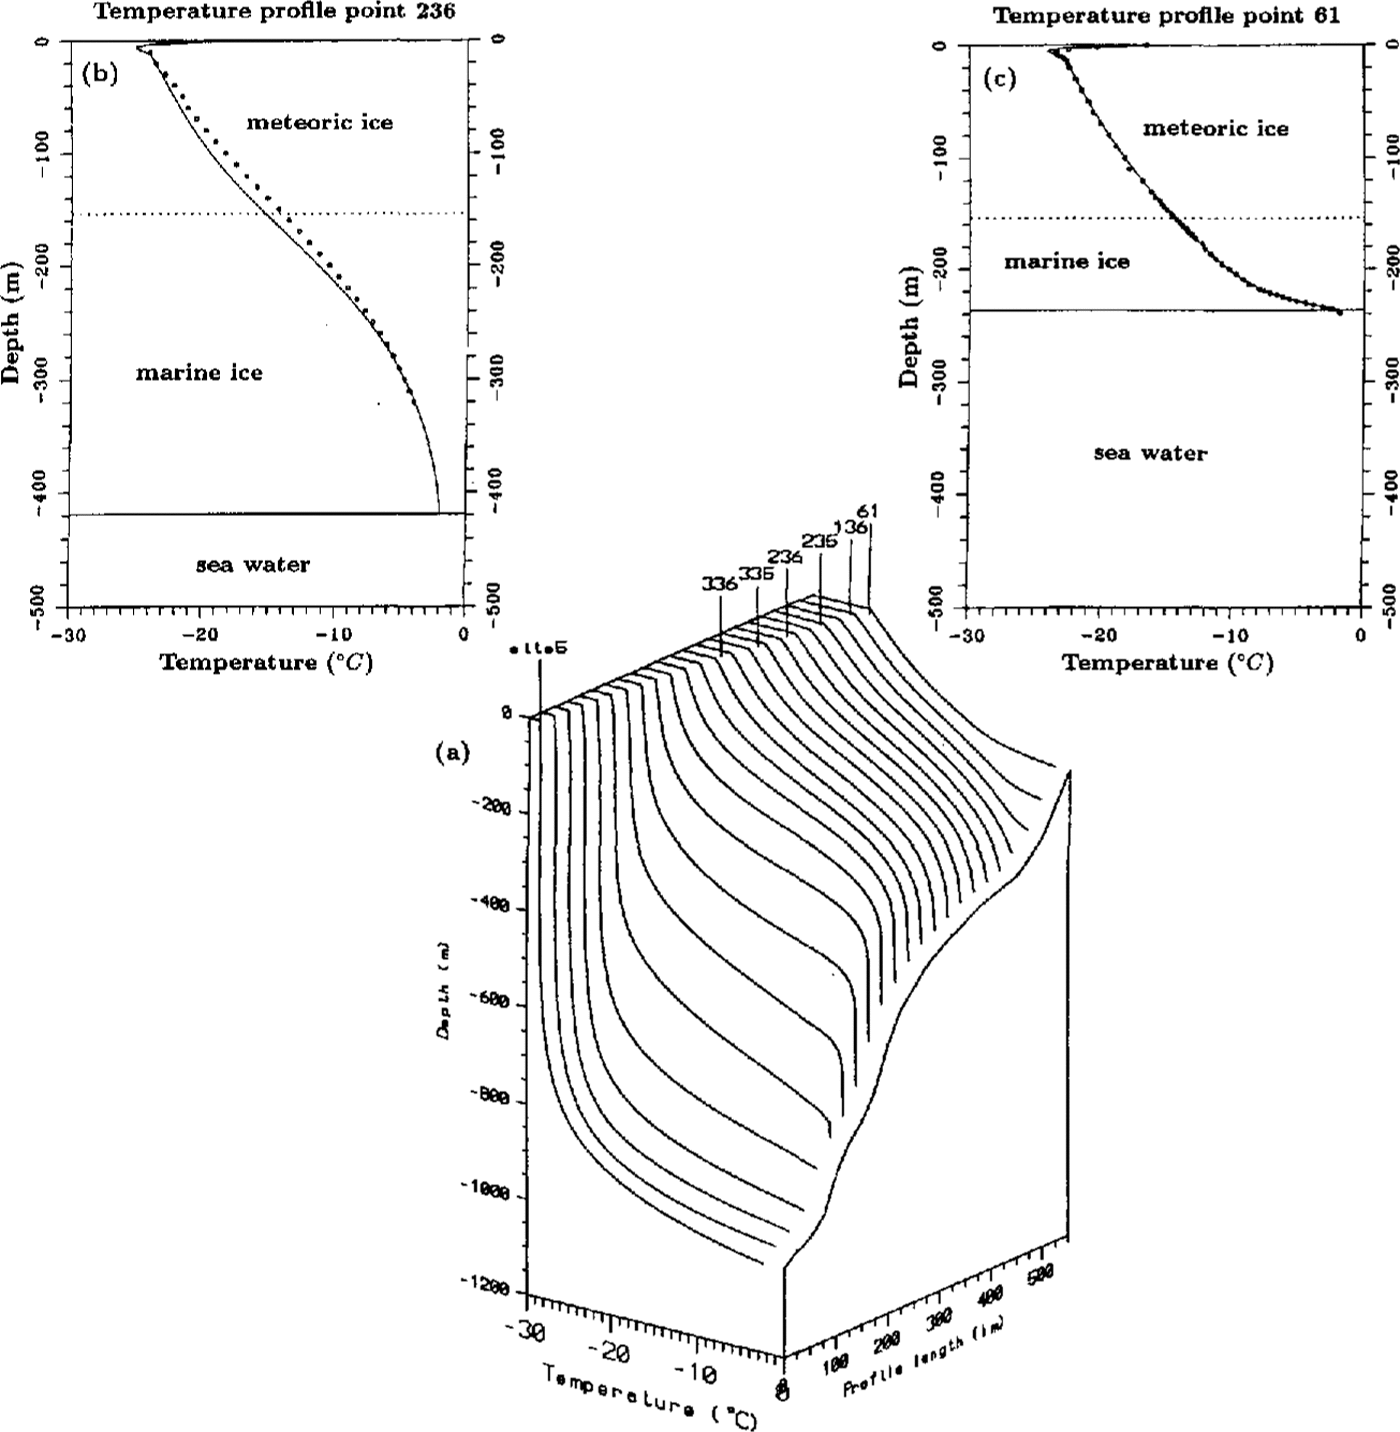
Fig. 6. Calculated temperature-depth profiles in a distance of 25 km along the flowline. The positions of geodetic points are marked. b, c. A comparison with measured temperature-depth profiles at point 61 and point 236 (Reference Oerter, cker, Kipfstuhl, Nixdorf, Graf and OerterOerter and others, 1992b) is shown.
The temperature profile at point 61 fits closer the results of the simulation. Over the whole depth range, the measured data can be reconstructed to the calculated values. The influence of bottom accretion has faded away and the effect of basal melting forms a cubic temperature profile with the same basal temperature gradient
Conclusion
Within the international Filchner-Ronne Ice Shelf Programme, we investigated the temperature depth profile by means of hot-water drillings and developed a two-dimensional thermal model to calculate the influence of the large bottom accretion and building of a basal layer of up to 400 m marine ice in the central part. The temperature-depth profile was measured at the ice-edge region of FRIS and shows a typical cubic profile consistent with the melting base. The influence of basal freezing in the central part has vanished at this location, and differences in the thermal properties of meteoric and marine ice could not be recognized. A comparison with a temperature depth profile measured 150 km upstream in a drillhole by Reference Oerter, cker, Kipfstuhl, Nixdorf, Graf and OerterOerter and others, 1992b shows a significant influence due to bottom freezing. The profile changed into an S-shape form, caused by the heat input from the accretion process. For simulating the temperature regime on a flowline through the central part and for the reconstruction of the measured data, a two-dimensional thermal model was developed. The subdivision of the ice column into meteoric and marine parts, which consisted of an older desalinated layer and a slushy bottom layer, was achieved by considering thermal properties depending on salinity and temperature in marine ice, especially in the slushy bottom layer. The time-dependent calculation was computed by means of FD methods with normalized depth and time derivatives. Boundary values were taken from geophysical, geodetic, glaciological and oceanographic data, and models of the FRIS region.
The model results show a strong influence of basal accretion on the temperature field in the central part. Basal freezing rates of up to 2ma1 were found northeast of Henry Ice Rise as a result of mass-balance calculations. In the area of maximum freezing rate, the temperature-depth profile changes from a cubic one into an S-shaped profile with almost isothermal conditions over a depth range of more than 180 m. About 40% of the ice column was dominated by temperatures between -2,25° and —6,0°C. About 100 km from the ice edge, melting occurs and erodes the relatively warm basal ice. A comparison of measured and calculated data shows convincing results.
Obviously, the thermal regime of the Filchner-Ronne lee Shelf is significantly influenced by the amount of basal freezing, which finally affects the flow properties of the whole ice shelf and hence its dynamics
Acknowledgements
The authors are very grateful to Miss M. jonas, who presented this paper during the VISAG symposium because both authors were unable to attend the meet¬ing. Funding by the Deutsche Forschungsgemeinschaft (DFG-THI68/20-2, DFG-BL307;I-J; and the Land Nordrhein-Westfalen is gratefully acknowledged


