Introduction
A central problem in avalanche dynamics is to model avalanche speed and runout distance, primarily for avalanche hazard applications (Reference Gruber and BarteltGruber and Bartelt, 2007). Decades of research has concentrated on modelling the behaviour of dry snow avalanches because these avalanches have higher flow velocity (and therefore higher impact pressures). Numerical run-out models are available in Switzerland (Christen and others, in press), Austria (Sampl and Granig, in press) and France (Reference Naaim, Naaim-Bouvet, Faug and BouchetNaaim and others, 2004). The empirical Voellmy model (Reference SalmSalm, 1993) is still in widespread use in many countries, since well-calibrated parameters for extreme, dry flowing avalanches have been found by back-calculation of documented avalanche events. Other models for flowing avalanches have been proposed by Reference Dent and LangDent and Lang (1983), Reference Norem, Irgens and SchieldropNorem and others (1987, Reference Norem, Irgens and Schieldrop1989), Reference Bartelt, Buser and PlatzerBartelt and others (2006) and Reference Bartelt and McArdellBartelt and McArdell (2009). However, few researchers have attempted to model the dynamics of wet snow avalanches.
Chute experiments have identified differences between dry and wet snow flows (Reference Kern, Tiefenbacher and McElwaineKern and others, 2004), as well as dry and slush flows (Reference Jaedicke, Kern, Gauer, Baillifard and PlatzerJaedicke and others 2008). Measured internal velocity profiles at the Vallée de la Sionne experimental site in Switzerland reveal clear differences between dry and wet snow avalanches (Reference Kern, Bartelt, Sovilla and BuserKern and others 2009). Furthermore, granulometric investigations of wet and dry snow avalanche deposits reveal a tendency to larger mean particle sizes in wet snow avalanches, suggesting smaller shear gradients (Reference Bartelt and McArdellBartelt and McArdell, 2009). Reference Gauer and ElderGauer (2005) proposed as a solution the modelling of slush flows using numerical techniques, considering wet snow as a multiphase flow of ice and water.
Obtaining experimental data from real-scale avalanches is expensive and time-consuming, hence the use of chute experiments is an alternative method. Reference Kern, Tiefenbacher and McElwaineKern and others (2004) conducted chute experiments to determine the vertical velocity profile and basal friction forces of sheared flow of snow on a rough surface. They reported the presence of a 0.05 m thick shear layer at the bottom and a 0.35 m thick overlaying low shear layer. Reference Platzer, Bartelt and KernPlatzer and others (2007) attempted to determine basal friction (basal shear to normal stress ratio) using chute experiments. Reference Rastello and BouchetRastello and Bouchet (2007) used a similar experimental facility at Cemagref in France to measure surface oscillations and determine friction laws in channelled snow flows.
In the present work, we present the results of wet snow avalanche experiments carried out on the snow chute in Dhundi, Himachal Pradesh, India. The objective of this work is to determine flow parameters such as slip, front and tail velocities of the moving mass, understand the shearing of snow layers from vertical velocity profile data and determine the approximate effective viscosity of snow, and thus obtain an understanding of wet snow avalanche dynamics. We do not consider the formation of wet snow avalanches.
Methodology
Inclined chute facility at Dhundi
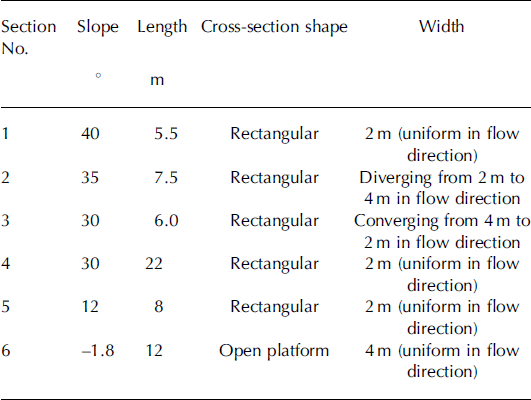
The Snow and Avalanche Study Establishment (SASE), Manali, India, has constructed an inclined chute at Dhundi, which is located about 20 km from Manali at 2800 ma.s.l. (Fig. 1). At this site, cumulative average snowfall of approximately 11m occurs every winter season and average winter ambient temperatures fall in the range –15 to +10°C. The inclined chute is 61 m long and 2 m wide. The side walls of the snow chute’s main channel are 1 m high. A schematic diagram (L-section) of the chute with instrumentation scheme is shown in Figure 2a. The chute is divided into six sections (1–6 from top to bottom); details of each section are shown in Table 1.

Fig. 1. Inclined chute facility at Dhundi.

Fig. 2. (a) Schematic diagram of chute facility at Dhundi. (b) Velocity sensor array 3. (c) Velocity sensor array 4. (d) Arrangement of video cameras, flow height markers and velocity sensor arrays 1 and 2 on chute.
Table 1. Details of different sections of inclined chute
The bottom of the chute is composed of smooth steel sheets. We painted the bottom chute surface in alternate red and grey strips 0.5 m wide, to aid the determination of front velocity with video recordings. The side walls of the chute are made of transparent polycarbonate sheets to minimize friction between the side walls and the flowing snow. These transparent sheets also facilitate observation of the flow through the side walls of the chute.
We gathered snow from the surrounding area to fill chute section 1 and released the snow mass by opening the release gate. The released snow mass flows down the chute and usually stops in the run-up section (chute section 6).
Video data acquisition system
To visualize the snow flow, we mounted video cameras over the side walls of the chute. The image-capturing speed of these cameras was 25 frames s−1. The camera location is shown in Figure 2d. We used recorded video data to determine the flow velocity and flow height of the moving snow mass.
Optical velocity sensors
We used optical velocity sensors at various locations on the chute to determine flow velocity. Each optical velocity sensor consists of two optical sensors placed at a fixed distance of 12 mm inside a tube. Each optical sensor consists of an optical transmitter and a receiver. Any snow particle passing over the optical sensor reflects the transmitted optical signal, which is received by the sensor receiver. We recorded the reflected signal of both optical sensors with a sampling frequency of 20 kHz using an analogue/digital converter. We used stored data to calculate velocity, employing a cross-correlation technique with a time window of 1 s. Velocity calculations using this technique are discussed in detail by Reference McElwaine and TiefenbacherMcElwaine and Tiefenbacher (2003) and Reference Tiefenbacher and KernTiefenbacher and Kern (2004).
Slip velocity measurement
We measured slip velocities at the centre line of the chute bottom surface using velocity sensor arrays 1 and 2 on sections 4 and 5 respectively (Fig. 2d). Each array consists of five optical velocity sensors placed 1 m apart from each other.
Vertical velocity profile measurement
To measure the vertical velocity profiles, we used velocity sensor arrays 3 and 4 on sections 4 and 5 respectively. In array 3, we placed five optical velocity sensors at distances of 24, 34, 44, 54 and 64mm from the chute surface. The maximum downstream distance between the two sensors is not more than 12.5 cm (Fig. 2b). In array 4, we placed five optical velocity sensors at distances of 9, 17, 25, 39 and 53 cm from the chute surface (Fig. 2c).
Flow height measurements
We measured flow heights at two locations on section 4 using video data, and flow height on section 5 using optical sensors of velocity sensor array 4. On section 4 we placed flow height markers 1 and 2 on the side wall and video cameras 2, 3 and 4 (Fig. 2d). By analysing the video data of flowing snow with markers in the background, we estimated the maximum flow height of every avalanche released.
On section 5 we analysed the data of each optical velocity sensor of array 4 and obtained the lower and upper limits of the interval in which flow height at that location lies.
Snow wetness
We used time-domain reflectometer (TDR) techniques to determine snow wetness. The instrument consists of fork-type sensors and a data-logging system. It records the dielectric constant of the material in which the sensor is inserted. We inserted these sensors at depths of 5, 10, 15 and 20 cm from the top snow surface in an observatory near the experimental site and recorded the dielectric constant of the snow samples from 0830 to 1700 h on days of experimentation. Using the measured dielectric constant and density of snow, we calculated the volumetric moisture content (volume of water/volume of snow) of the released snow mass (Reference DenothDenoth, 1994). The equation used for this purpose is

where p is the measured snow density and DC is the measured dielectric constant of snow.
Effective viscosity determination
We used the depth-averaged momentum balance equation for two-dimensional incompressible, steady flows to find the effective viscosity of wet snow. We therefore assume a hydrostatic pressure gradient. This simplified equation is solved with boundary conditions of zero shear stress at the free surface and by replacing the shear stress term according to a Newtonian law. As a result, the following equation for velocity gradient is obtained:
where ∂v/∂z is the velocity gradient in the flow normal direction, μeff is the effective viscosity, p is the density of flowing snow mass, φ is the slope angle and h is the flow height.
Equation (2) can be solved for velocity with boundary conditions of slip velocity, v 0, at the basal chute surface to obtain
where v 0 is the basal slip velocity. Equation (3) is applied to find the effective viscosity of the flowing snow using experimental data of the measured vertical velocity profiles.
Experimentation
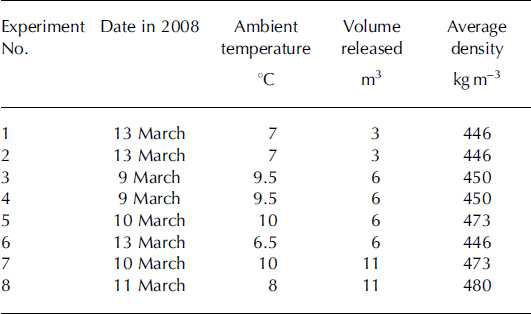
We conducted a total of eight experiments on the chute, with three release volumes and density varying between 400 and 500 kg m−3. Ambient temperatures during experimentation were 5–10°C. Details of these experiments are given in Table 2.
Table 2. Details of experiments
Results and Discussion
Snow wetness
The average wetness of the avalanches released on the Dhundi chute was found to be 10–30%. Average values of snow wetness (with standard deviation) on the days of experimentation are plotted in Figure 3. We measured snow wetness within the top 20cm of the snowpack, but the actual wetness of the avalanche snow released may be somewhat higher due to exposure to higher temperatures at release.
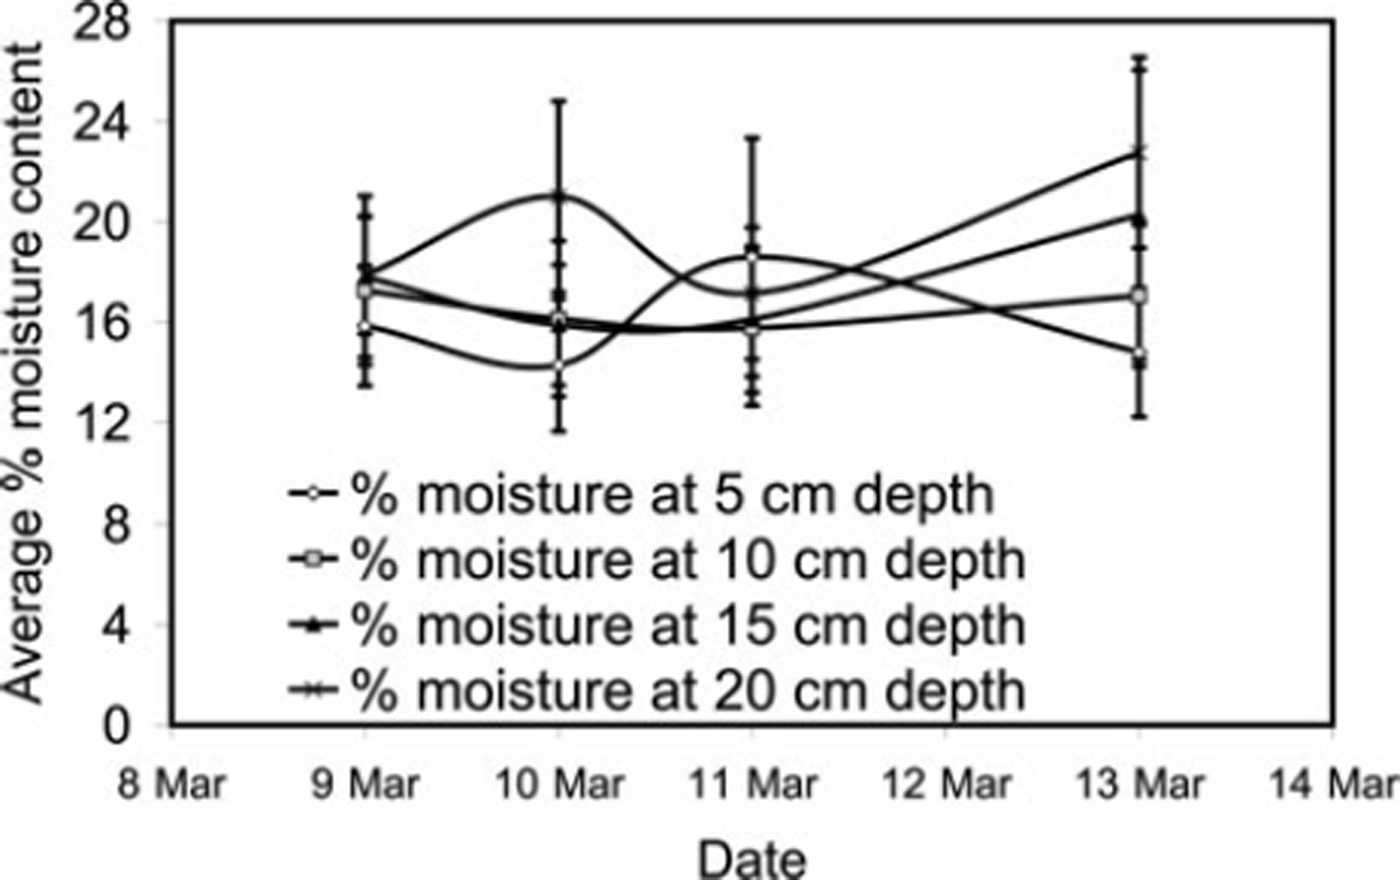
Fig. 3. Snow wetness measured using TDR.
General observations from video data
We observed the accelerating and longitudinally spreading snow mass from section 2 to section 4 (Fig. 4a–c). It comprised non-uniformly distributed softened wet snow and well-bonded discrete snowballs in the avalanche mass. These snowballs either form or disintegrate during the flow and generally remain in the upper part of the flowing mass. Sometimes they roll ahead of the main avalanche body and create an irregular avalanche front. The irregularity of the avalanche front makes it difficult to estimate the front propagation speed using video data.

Fig. 4. (a–c) Longitudinal spreading of moving mass between sections 1 and 4.
Flow velocity using video data
After analysing video data we obtained front propagation velocities of 6–12m s−1 on section 4. We also calculated the probable errors introduced due to speed limitations of the video camera (25 frames s−1) and the spatial resolution of the strips on the chute surface (0.5 m). The flow velocities obtained along with the error bars are plotted in Figure 5a-c for release volumes of 3, 6 and 11 m3, respectively. The results show that flow velocities are 6–10, 7–12 and 8–12 ms−1, respectively. Probable errors were calculated to be ±15–20%. We observed considerably more variation in flow velocity for the 6 m3 release volume than for the other release volumes. We also observed outliers in the velocity data of all the experiments, generally either at the start or the end of the measurement. This large variation in velocity over a small distance is certainly due to human error in identifying the flow front at these locations. Better video data results could be obtained by using high-speed video cameras and improving the spatial resolution of the strips on the chute surface.

Fig. 5. Front velocity at section 4, measured using video data for release volumes of (a) 3 m3, (b) 6m3 and (c) 11 m3.
Slip velocity
We obtained slip velocities of avalanche masses from front to tail at each sensor of velocity sensor arrays 1 and 2 (Fig. 6). Similar curves were obtained for each experiment. In general, we observed a decrease in slip velocity from front to tail of the avalanche, with spikes at irregular intervals. At a few locations we observed a sudden drop in velocity. We obtained the average slip velocity at each sensor location of arrays 1 and 2, by averaging slip velocities of the avalanche from front to tail. Between sections 4 and 5 the average slip velocity varied for release volumes of 3, 6 and 11m3 (Fig. 7a–c).
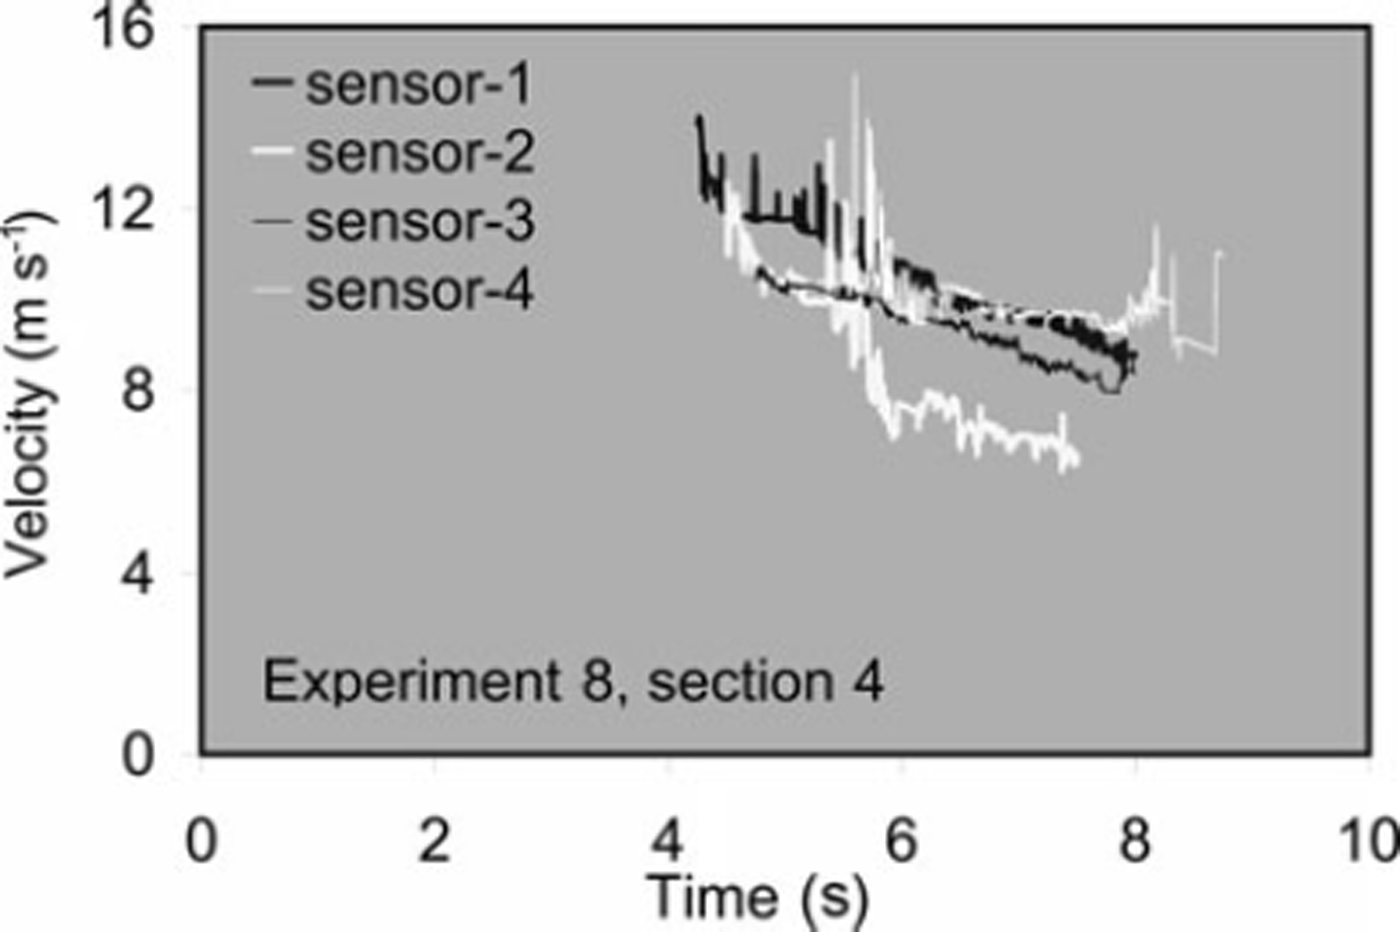
Fig. 6. Slip velocity data obtained using cross-correlation analysis of optical sensor signals.

Fig. 7. Variation of average slip velocity at sections 4 and 5 for release volumes of (a) 3 m3, (b) 6m3 and (c) 11 m3.
For release volumes of 3, 6 and 11 m3 we obtained average slip velocities of 7–10, 6.5–12.5 and 8–12 ms−1, respectively, at section 4, and 4.5–6, 5–8.5 and 5–8 ms−1, respectively, at section 5. The average slip velocities at the end of section 4 were 8.5, 9.25 and 10.25 ms−1 for release volumes of 3, 6 and 11 m3, respectively. These results suggest slightly lower velocities for lower release masses.
We observed a significant decrease in average slip velocity due to slope angle reduction between sections 4 and 5. The average reduction in slip velocity due to slope change was observed to be about 37% for a release volume of 3 m3 and about 30% for release volumes of 6 and 11 m3, indicating that the effect of slope reduction on velocity is greater for small avalanches.
We did not find a specific trend in velocity variation over sections 4 and 5 due to the considerable fluctuations in average slip velocities from front to tail of the avalanche (Fig. 6).
Front and tail velocities
At section 4, we obtained higher average velocities at the avalanche front (9–12 m s−1) than at the tail (6–9ms−1) (Fig. 8). These results are supported by video data observations of longitudinal spreading of the avalanche mass. Also Reference GauerGauer and others (2007), in natural avalanche measurements at the Ryggfonn test site, Norway, found maximum avalanche speed in the frontal part and a rapid decrease in velocity afterwards, with no constant velocity gradient over the avalanche body from front to tail.
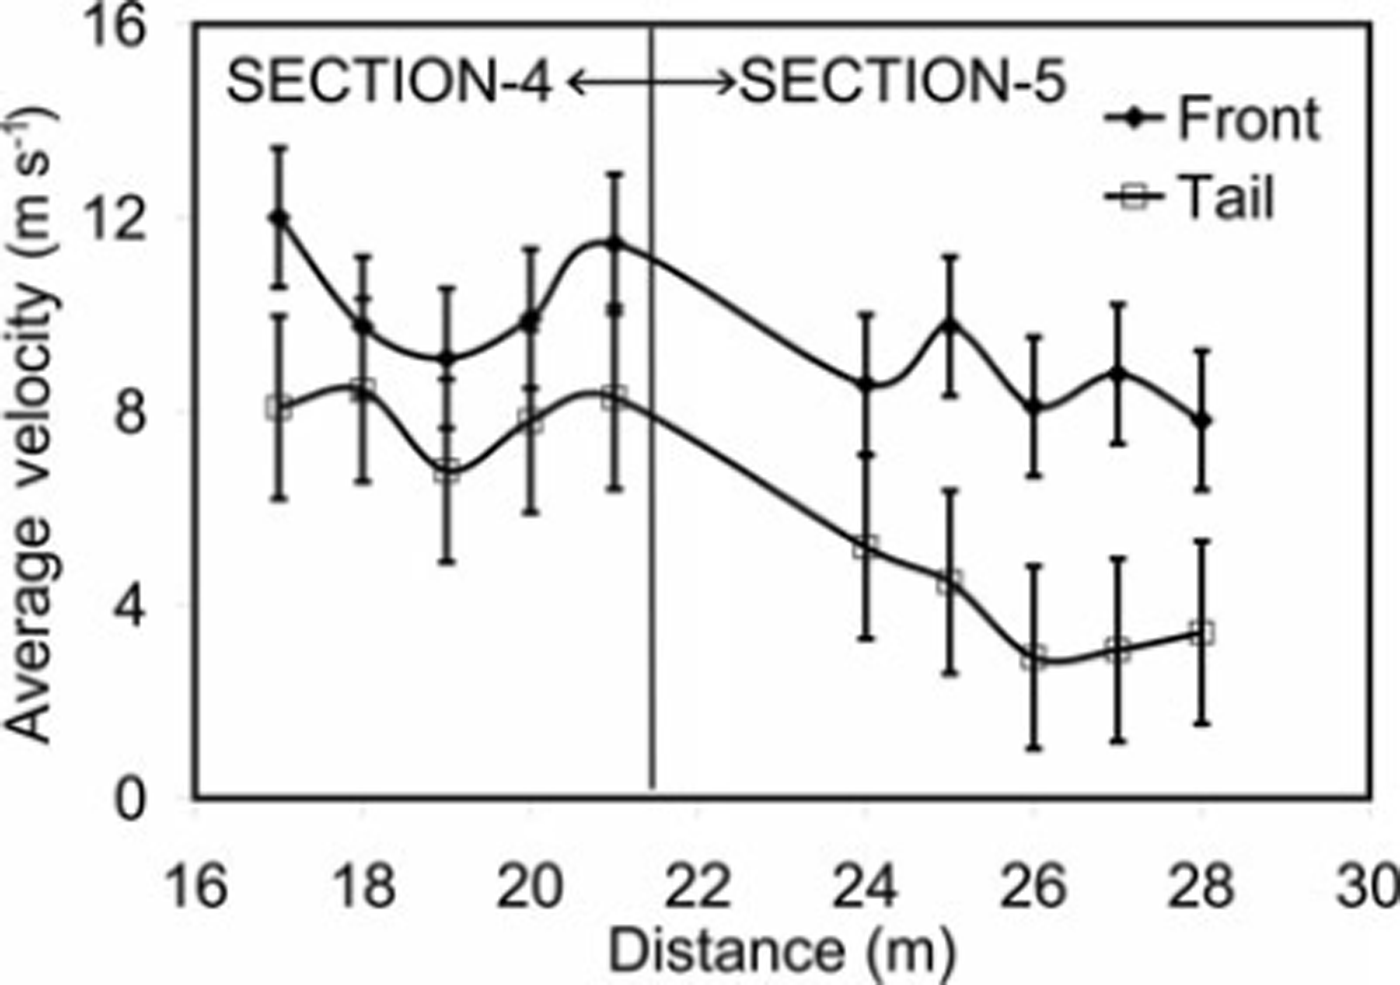
Fig. 8. Variation of front and tail velocities of moving snow mass at sections 4 and 5.
We measured front and tail velocities at section 5 after a slope reduction, and obtained front velocities of 7–10ms−1 and tail velocities of 3–5ms−1 (Fig. 8). These results show a slightly higher reduction in average tail velocity in comparison to front velocity due to slope angle reduction, which leads to a higher difference of front and tail velocity at section 5 in comparison to section 4. This suggests that the effect of a slope reduction is more dominant on a moving mass with lower velocities. Due to the higher difference in front and tail velocities, we can expect higher longitudinal spreading in such conditions.
Vertical velocity profile
We obtained vertical velocity profiles at two locations, one at section 4 at a distance of about 35 m from the point of release (over section 4) and the other at a distance of about 40m (over section 5). At the first location, average slip velocities of about 8 m s−1 and a shear rate of 62.5 s−1 were observed in a bottom layer with thickness of 0.064 m. At the second location, average slip velocities of 7 m s−1 were obtained, with a shear rate of 6 s−1 over the entire flow height. The results obtained are shown in Figure 9. The values of shear rate obtained in our experiments are very close to that obtained by Reference Kern, Tiefenbacher and McElwaineKern and others (2004) for a basal shear layer with an upper plug layer. The presence of different shear rates at two places with different flow conditions shows the varying rheological behaviour of wet snow avalanches as a function of position within the avalanche.
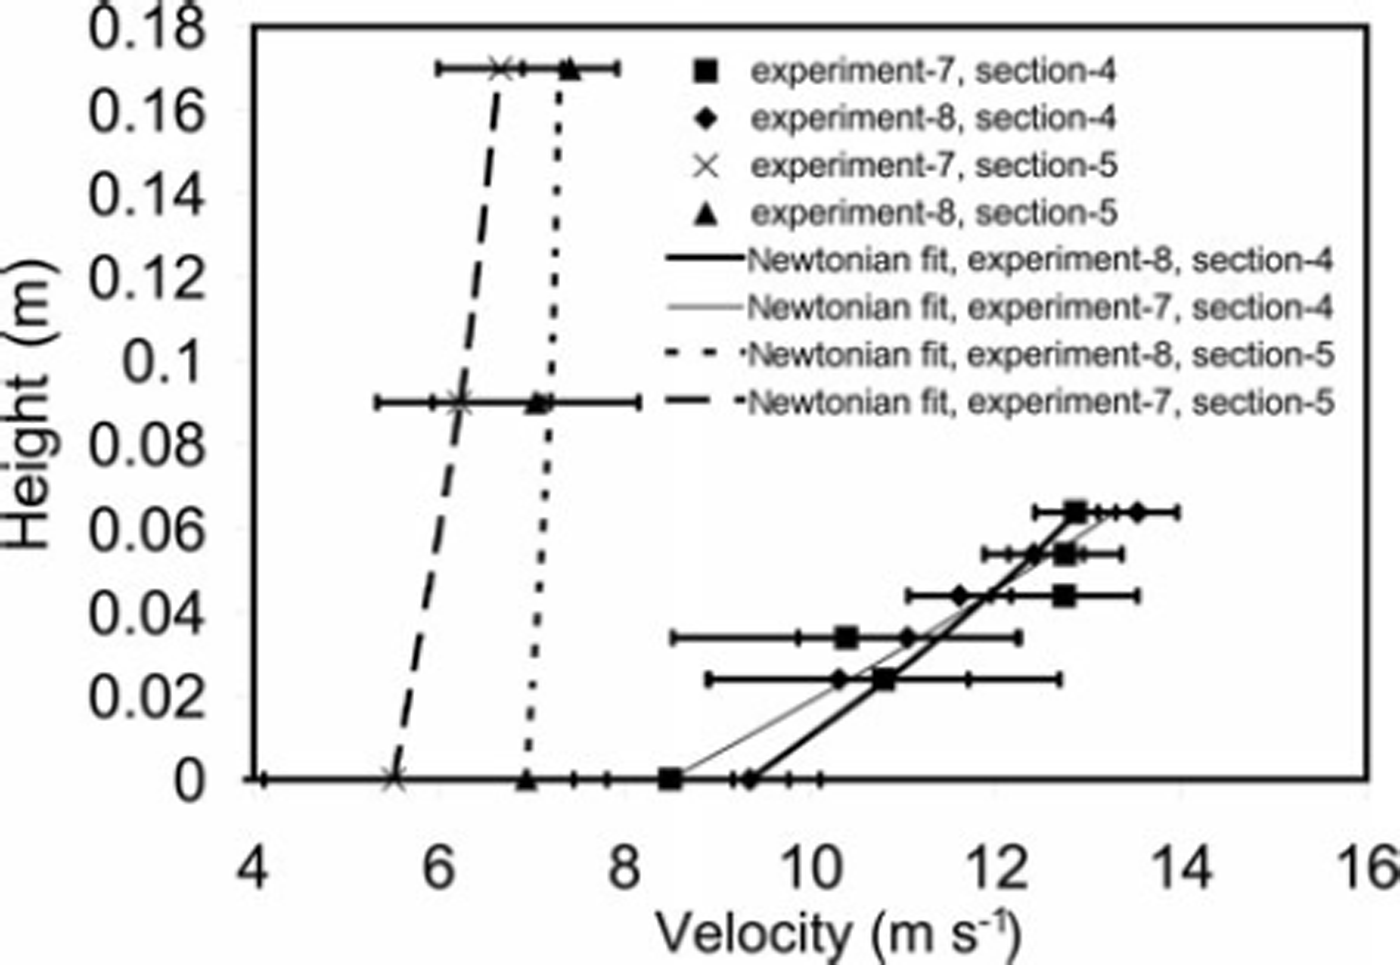
Fig. 9. Vertical velocity profile of moving snow mass on sections 4 and 5.
Flow height
On section 4, we found flow heights of 10–25, 15–35 and 20–35cm for release volumes of 3, 6 and 11 m3, respectively. On section 5 we obtained flow heights of 17–25 cm for a release volume of 11 m3, and 9–17 cm for release volumes of 3 and 6 m3. We used the flow height data to determine the effective viscosity of wet snow.
Effective viscosity
Using the measured vertical velocity profiles and flow heights, we estimated the effective viscosity of the flows and compared it to previously reported values.
Within a 64 mm shear layer at section 4, we obtained an effective viscosity of 8.64±5.23 Pas, averaged over all experiments. The effective viscosity in the run-out zone is higher: 42.2 ± 15.95 Pas at section 5. Thus, the effective viscosity changes as a function of position on the chute.
The viscosity values obtained for section 4 are close to the viscosity of honey (2–10Pas) and molasses (5–10Pas). Assuming an average wet snow density of 450 kgm−3, we found effective kinematic viscosity coefficients of wet snow of 0.019 ± 0.012 m2 s−1 at section 4 and 0.094 ± 0.035 m2 s−1 at section 5. These values are much higher than those of 0.001 m2 s−1 given by Reference Maeno and NishimuraMaeno and Nishimura (1979) and Reference Maeno, Nishimura and KanedaMaeno and others (1980) for dry sieved snow in sub-zero temperatures and 0.004 m2 s−1 given by Reference Dent and LangDent and Lang (1982) for dry snow of density 250–350 kg m−3. Reference Jaedicke, Kern, Gauer, Baillifard and PlatzerJaedicke and others (2008) obtained much higher effective viscosity values (67 ±8 Pas) for their slushflow experiments.
The flow conditions were not the same in all experiments, hence the large standard deviation in effective viscosity values. A decrease in shearing rate and increase in viscosity between sections 4 and 5 indicates the effect of shear rate on the effective viscosity. This increase in viscosity with decrease in shear rate (or vice versa) is termed shear thinning.
Conclusions
The aim of the present investigation was to improve our understanding of wet snow avalanche dynamics by performing medium-scale experiments at the Dhundi snow chute. We released wet snow avalanches with a moisture content of 10–30% by volume. The flowing avalanche mass contained well-bonded snowballs; interstitial pore space contained wet snow ice grains. We obtained maximum average slip velocities of >10ms−1, much higher than the values obtained previously by researchers working on inclined chutes with snow. This is due to the very smooth surface of the Dhundi chute.
The measured slip velocities provide information about the variation of velocity between the avalanche front and tail. For smaller release masses we found lower slip velocities. In addition, the shear velocity gradient varied between front and tail. Front velocities are higher than tail velocities, especially in the acceleration phase, and this is responsible for longitudinal spreading of the avalanche.
Slope reduction contributes to the total energy dissipation, and its effect is greater on smaller avalanches. Avalanche masses moving at lower velocities are affected more at the point of slope reduction.
Internal shearing of snow layers is an integral part of wet snow avalanche rheology. However, the extent of the shearing in the avalanche path depends on the location of the avalanche. Depending upon surface roughness, wet snow avalanches may move with zero shear (plug flow, tail) or as a highly sheared flow (front). We observed shear thinning material behaviour. Hence, a single rheological model cannot define the shearing phenomena in wet snow avalanches. The effective Newtonian shear viscosity for wet snow avalanches, with moisture content 10–30%, is higher than that of dry snow reported in the literature and lower than that of slush flow. However, its value is highly variable depending upon the position.
Our conclusions are based on results from a limited number of experiments. Measurements of slip velocity and vertical velocity profiles at a greater number of locations along the snow chute will contribute to a better understanding of the dynamics of wet snow avalanches.
Acknowledgements
We thank R.N. Sarwade, former Director, and A. Ganju, present Director of the Snow and Avalanche Study Establishment, for constant support for carrying out the present work. We also thank all the members of the Dhundi team for their support during the experiments.


