


Introduction
The Southern Ocean, the world’s ocean south of 35°S, encircles and isolates the Antarctic continent, creating a unique oceanic environment characterized by the absence of continental barriers (Tomczak & Godfrey Reference Tomczak and Godfrey1994, Chapman et al. Reference Chapman, Lea, Meyer, Sallée and Hindell2020). This ocean features one of the strongest current systems on Earth, the Antarctic Circumpolar Current (ACC), which is primarily driven by strong westerlies (Barker & Thomas Reference Barker and Thomas2004, Chapman et al. Reference Chapman, Lea, Meyer, Sallée and Hindell2020). Beneath the wind-driven surface layers, waters are largely in near-geostrophic balance with the circumpolar circulation (Talley et al. Reference Talley, Pickard, Emery and Swift2011, Olivé Abelló Reference Olivé Abelló2023), contributing to the global overturning circulation. This occurs because the ACC connects the three major ocean basins - the Pacific, Atlantic and Indian oceans - and regulates the exchange of mass, heat, salt, carbon, oxygen and other biogeochemical properties between the upper and lower layers of the global ocean (Klinck & Nowlin Reference Klinck, Nowlin and Steel2001, Rintoul et al. Reference Rintoul, Hughes and Olbers2001, Rintoul Reference Rintoul2006, Carter et al. Reference Carter, McCave and Williams2008, Naveira Garabato et al. Reference Naveira Garabato, Ferrari and Polzin2011, Rintoul & Naveira Garabato Reference Rintoul, Naveira Garabato, Siedler, Griffies, Gould and Church2013).
In the Southern Ocean, the transition from warmer subtropical waters to colder Antarctic waters occurs within well-defined and sharply delineated frontal zones (Orsi et al. Reference Orsi, Whitworth and Nowlin1995, Carter et al. Reference Carter, McCave and Williams2008, Sokolov & Rintoul Reference Sokolov and Rintoul2009a,Reference Sokolov and Rintoulb, Talley et al. Reference Talley, Pickard, Emery and Swift2011). These fronts are often defined as the pathways of jets that drive the flow of the ACC (Chapman et al. Reference Chapman, Lea, Meyer, Sallée and Hindell2020, Olivé Abelló et al. Reference Olivé Abelló, Pelegrí, Machín and Vallés-Casanova2021). First, the Subantarctic Front (SAF) marks the northernmost boundary of the ACC, and at most locations it is the southernmost boundary of the Antarctic Intermediate Water (AAIW) and the Subantarctic Mode Water (SAMW), which forms a thick layer at the ocean’s surface. Each water mass is characterized by relatively uniform properties, including temperature, salinity, oxygen levels, nutrient concentrations and others (Chapman et al. Reference Chapman, Lea, Meyer, Sallée and Hindell2020). Conversely, the Subtropical Front (STF) marks the northernmost boundary of the Subantarctic Surface Water (SASW; Orsi et al. Reference Orsi, Whitworth and Nowlin1995), which extends up to 500 m into the upper water column north of the SAF (Talley et al. Reference Talley, Pickard, Emery and Swift2011).
Over the past few decades, the Southern Ocean has undergone rapid changes due to global warming, primarily attributed to the absorption of ~40% of carbon dioxide emissions and over 75% of anthropogenic heat uptake by the global ocean (Sarmiento & Gruber Reference Sarmiento and Gruber2002, Rintoul Reference Rintoul and Steele2009, Sallée et al. Reference Sallée, Matear, Rintoul and Lenton2012, Huguenin et al. Reference Huguenin, Holmes and England2022, Olivé Abelló & Pelegrí Reference Olivé Abelló, Pelegrí, Pelegrí, Gili and de Albéniz2022). Between 1970 and 2017, the Southern Ocean stored 35–43% of the global upper 2000 m ocean heat gain within its surface and subsurface water masses (Auger et al. Reference Auger, Morrow, Kestenare, Sallée and Cowley2021, Meduna Reference Meduna2023). Among these water masses, the SAMW and Subtropical Mode Water (STMW) are those that experienced more significant temperature increases of ~0.29 ± 0.09°C per decade (Auger et al. Reference Auger, Morrow, Kestenare, Sallée and Cowley2021).
Additionally, the properties of these Southern Ocean water masses exhibit strong inter-annual variability, greatly impacted by large-scale fluctuations such as the El Niño-Southern Oscillation (ENSO) and the Southern Annular Mode (SAM), the latter being the dominant form of climatic variability over the whole Southern Hemisphere, at intra-seasonal to inter-annual timescales (Lovenduski & Gruber Reference Lovenduski and Gruber2005, Dätwyler et al. Reference Dätwyler, Grosjean, Steiger and Neukom2020). In particular, these phenomena influence the sea-surface temperature (SST), sea-ice coverage, sea-ice thickness and the intensity of the ocean currents. For instance, during ENSO warm episodes (El Niño events), the central Pacific sector of the Southern Ocean experiences higher SST and reduced sea-ice coverage, while the opposite occurs during La Niña cold events. Regarding the SAM index, a positive phase results in an intensification and southward shift of the westerlies (Turner Reference Turner2004, Talley et al. Reference Talley, Pickard, Emery and Swift2011), implying a higher SST and reduced sea-ice coverage in the ACC region, particularly in the Pacific and Indian sectors of the Southern Ocean.
However, conducting field research in the Southern Ocean to enhance our understanding of these thermohaline anomalies and spatiotemporal variabilities is always challenging and expensive due to its remoteness and extreme environmental conditions (Clementson et al. Reference Clementson, Parslow, Turnbull, McKenzie and Rathbone2001). Consequently, it remains one of the most data-sparse of all major ocean basins (Chapman et al. Reference Chapman, Lea, Meyer, Sallée and Hindell2020, Auger et al. Reference Auger, Morrow, Kestenare, Sallée and Cowley2021). Surface measurements collected by non-research vessels present a valuable opportunity to increase in situ data coverage, mitigating this limitation. Specifically, oceanic races have proven to be effective for tracking real-time SST and salinity without hindering navigation or compromising the competitive nature of the events. It is estimated that increasing amounts of ocean data are collected by non-research vessels, and this trend has been growing in recent years (Salat et al. Reference Salat, Umbert, Ballabrera-Poy, Fernández, Salvador and Martínez2013, Tanhua et al. Reference Tanhua, Gutekunst and Biastoch2020, Umbert et al. Reference Umbert, Hoareau, Salat, Salvador, Guimbard, Olmedo and Gabarró2022, Landschützer et al. Reference Landschützer, Tanhua, Behncke and Keppler2023, Behncke et al. Reference Behncke, Landschützer and Tanhua2024).
In 2011, through a pioneering collaboration between organizers of the Barcelona World Race (BWR-2011), scientists from the Institute of Marine Sciences (ICM-CSIC) and members of the Maritime Catalan Forum (FMC), one of the regatta sailboats was equipped with a MicroCAT temperature and conductivity sensor and an XCAT transmitter to transmit the data. Preliminary scientific findings (Salat et al. Reference Salat, Umbert, Ballabrera-Poy, Fernández, Salvador and Martínez2013) explored the feasibility of leveraging oceanic races to monitor real-time surface temperature and salinity across the world’s oceans, confirming that taking these measurements did not disrupt navigation or compromise competitive integrity. This successful partnership continued with the installation of the same sensors during subsequent editions of the Barcelona World Race 2014/2015 (BWR-2015) and the Vendée Globe Race in 2021 (VGR-2020/2021; Umbert et al. Reference Umbert, Hoareau, Salat, Salvador, Guimbard, Olmedo and Gabarró2022).
Hence, these two world races over the last decade have enhanced the collection of oceanographic measurements: the BWR, a non-stop regatta around the world starting and ending in Barcelona, Spain, and the VGR, which begins and ends in Les Sables-d’Olonne, France. The routes followed by the participating sailboats were remarkably similar, involving navigation across the Atlantic Ocean to the Cape of Good Hope, circumnavigating Antarctica clockwise, passing Cape Leeuwin and Cape Horn to port and returning to the starting point by crossing the Atlantic Ocean from south to north. In this study, we analyse data gathered during the last decade, specifically from the following races: BWR-2011 and BWR-2015, held from 31 December 2010 to 22 April 2011 and from 31 December 2014 to 8 April 2015, respectively, and VGR-2020/2021, conducted from 8 November 2020 to 13 February 2021 (Fig. 1).
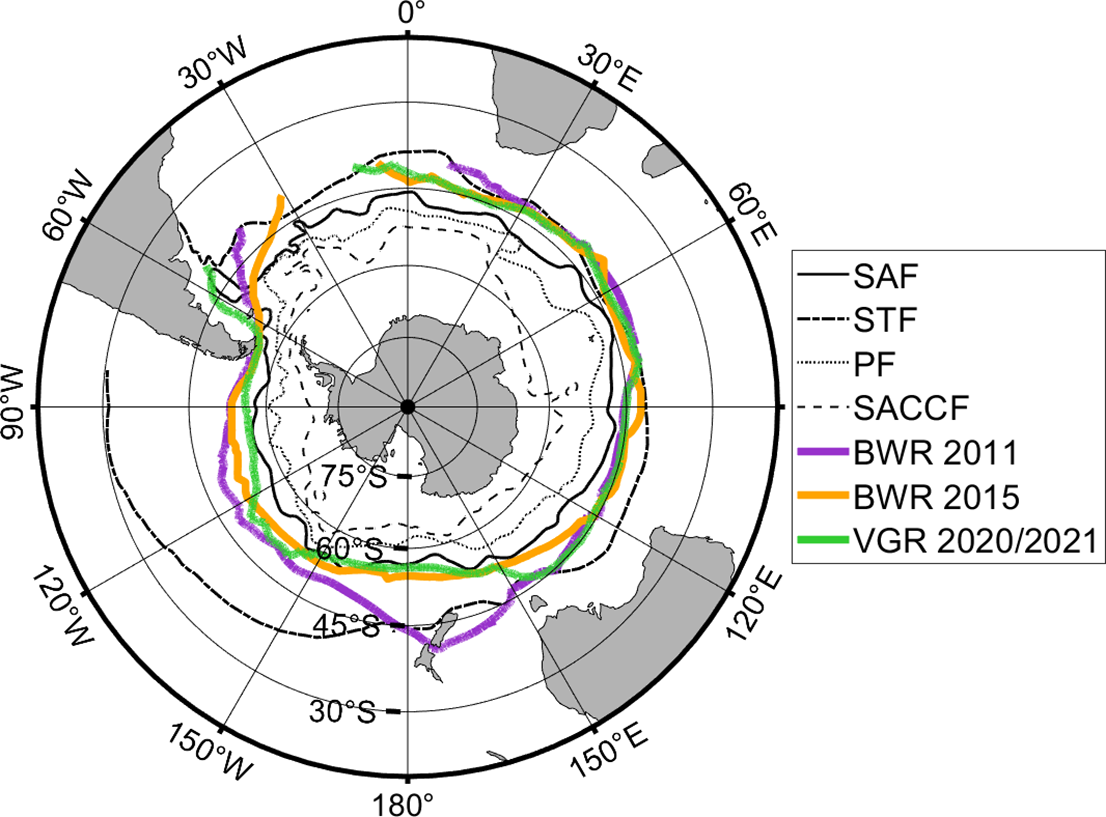
Figure 1. Representation of the three oceanic race trajectories within the Southern Ocean (south of 35°S): Barcelona World Race (BWR)-2011 (thick purple line), BWR-2015 (thick orange line) and Vendée Globe Race (VGR)-2020/2021 (thick green line). The climatological positions of the principal fronts of the region (Orsi et al. Reference Orsi, Whitworth and Nowlin1995) are also indicated, from north to south: the Subtropical Front (STF; dotted and dashed black line), the Subantarctic Front (SAF; solid black line), the Polar Front (PF; dotted black line) and the Southern Antarctic Circumpolar Current Front (SACCF; dashed black line).
The overall objective of this study is to assess the inter-annual changes in SST and sea-surface salinity (SSS) observed in the Southern Ocean over the past decade (2011–2022), proving that in situ measurements sampled by non-research vessels are also precise, reliable and robust and thereby demonstrating that these collaborations represent invaluable opportunities to enhance our understanding of the Southern Ocean.
Data
Barcelona World Race and Vendée Globe Race in situ data
The temperature and salinity time series used in this study correspond to the BWR-2011, BWR-2015 and VGR-2020/2021 races. A MicroCAT temperature and conductivity sensor was installed inside the articulated keel that stabilizes the sailboats (Salat et al. Reference Salat, Umbert, Ballabrera-Poy, Fernández, Salvador and Martínez2013, Umbert et al. Reference Umbert, Hoareau, Salat, Salvador, Guimbard, Olmedo and Gabarró2022), positioned ~60 cm below the surface to ensure continuous contact with well-mixed water along the sailing path. The sensor was configured to record autonomously and to store conductivity and temperature data, with a timestep interval of 10 s for the BWR and 30 s for the VGR. The latitude and longitude positions along the trajectories were determined using the GPS units of the sailboats. To synchronize each data sample with its corresponding position, the timestamp from the sensor was thoroughly aligned with the sailboat’s GPS clock (Umbert et al. Reference Umbert, Hoareau, Salat, Salvador, Guimbard, Olmedo and Gabarró2022). Salinity is expressed using the Practical Salinity Scale in the manuscript and is therefore a dimensionless variable.
ARMOR-3D reanalysis
The ARMOR-3D product (https://doi.org/10.48670/moi-00052; Guinehut Reference Guinehut2021) has been used to compare with the gathered data. Specifically, the dataset-armor-3d-rep-weekly product for ocean surface analysis combines multi-year reprocessed weekly data derived from optimal interpolation of in situ measurements with satellite observations (Greiner et al. Reference Greiner, Verbrugge, Mulet and Guinehut2021). Developed by the CLS Production Unit (MULTIOBSCLS-TOULOUSE-FR), this product offers global Level-4 (L4) analyses of 3D temperature and salinity on a 1/4° regular grid. The ARMOR-3D product is appropriate not only due to its integration of in situ and satellite observations, but also because it can maintain a spatial resolution consistent with the World Ocean Atlas 2023 (WOA-23) climatology that also has a 0.25° grid (see the following subsection). This ensures that the anomalies calculated between in situ data, ARMOR-3D and WOA-23 have comparable representativity errors, avoiding biases that could arise from using products with different resolutions.
World Ocean Atlas 2023 climatology
For the estimation of inter-annual anomalies in temperature and salinity measurements for each regatta, we utilized WOA-23 (Locarnini et al. Reference Locarnini, Mishonov, Baranova, Reagan, Boyer and Seidov2024) climatology as a reference. WOA-23 provides objectively analysed climatological fields of in situ temperature, salinity and other variables on 5°, 1° and 0.25° grid cells, covering annual, seasonal and monthly compositing periods for the global ocean.
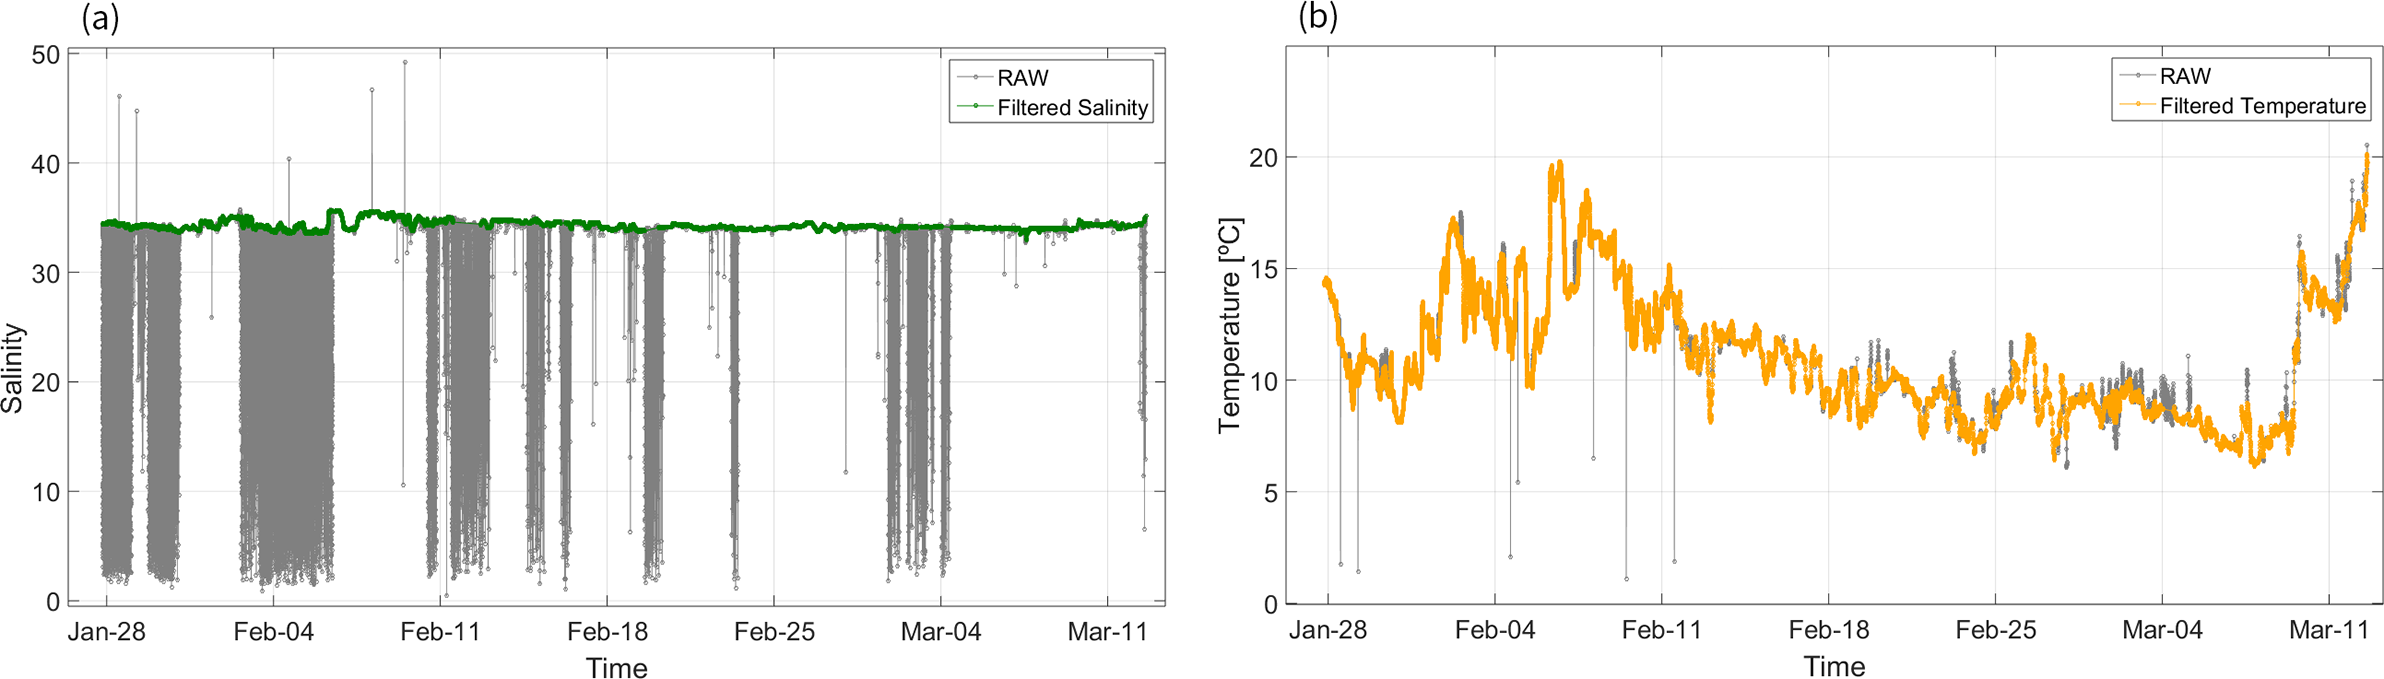
Figure 2. Raw (grey) and filtered (coloured) a. sea-surface salinity and b. sea-surface temperature data of the Barcelona World Race 2015 regatta within the Southern Ocean region.
For this study, we selected the winter seasonal climatology of WOA-23, which includes January, February and March, covering the period from 1991 to 2020 (Locarnini et al. Reference Locarnini, Mishonov, Baranova, Reagan, Boyer and Seidov2024, Reagan et al. Reference Reagan, Seidov, Wang, Dukhovskoy, Boyer and Locarnini2024), for temperature and salinity at the ocean surface. The assessed domain extends from 40°S to 90°S using the highest available spatial resolution of 0.25°.
Methodology
Data filtering
Even though the sensor remained ~60 cm below the ocean surface, measurements can be affected in some scenarios. For instance, sailing at high speeds or in stormy conditions can cause foam to impact sensor readings. This foam introduces bubbles that reduce the effective area of the conductivity sensor, leading to underestimated conductivity data (Umbert et al. Reference Umbert, Hoareau, Salat, Salvador, Guimbard, Olmedo and Gabarró2022). Moreover, high boat speeds or strong swells can cause the sensor to intermittently exit the water, thus reading zero conductivity during these episodes. All these situations affect the quality of the raw data, necessitating a thorough filtering process.
For the filtering of the data gathered during the BWR-2015 regatta, similar criteria for filtering the BWR-2011 and VGR-2020/2021 data (Salat et al. Reference Salat, Umbert, Ballabrera-Poy, Fernández, Salvador and Martínez2013, Umbert et al. Reference Umbert, Hoareau, Salat, Salvador, Guimbard, Olmedo and Gabarró2022) were applied. Temperature drifts indicating stagnant water and salinity spikes caused by foam or air exposures were flagged as bad data. Additionally, discrepancies and delays between salinity and temperature readings, as well as noisy values, were considered as bad data. Very low conductivity values were also filtered out, indicative of foam presence due to high boat speeds or strong swells.
For the BWR-2015 dataset quality control (QC), the ThermoSalinoGraph Quality Control (TSG-QC) software for MATLAB (Alory Reference Alory2021) was employed. QC values associated with each temperature, conductivity and salinity data point are as follows: QC = 1 designates good data, QC = 4 indicates bad data (while QCs of 2 or 3 indicate probably good or bad data, respectively). Note that salinity corresponds to the practical salinity obtained from the Gibbs SeaWater (GSW) Oceanographic Toolbox of TEOS-10 (McDougall et al. Reference McDougall and Barker2011).
Fig. 2 shows both the raw (in grey) and the filtered measurements of the BWR-2015 regatta for the Southern Ocean region only. The resulting filtered temperature and salinity measurements are represented in green and yellow, respectively. Abrupt temperature peaks caused by sensor stagnation are removed. Similarly, salinity measurements affected by bubbles, reflected by sudden drops in salinity values, are also filtered out.
Water mass identification
To characterize the water masses in the Southern Ocean, temperature-salinity (T-S) diagrams are commonly used (Stewart Reference Stewart2008, McDougall et al. Reference McDougall and Barker2011). Table I summarizes the key properties used to identify these water masses (Emery Reference Emery2001, Carter et al. Reference Carter, McCave and Williams2008, Talley et al. Reference Talley, Pickard, Emery and Swift2011).
Given that the regatta track stays away from areas with seasonal sea ice, the predominant water masses expected at the surface are SASW and SAMW, found north of the SAF. SASW typically exhibits temperatures ranging from 6°C to 12°C, although during the summer they can reach up to 14°C, and salinities above 34.3, except in the south-east Pacific and Drake Passage, where salinity values can drop below 34.16 (Carter et al. Reference Carter, McCave and Williams2008). Regarding SAMW, it is characterized by temperatures above 14°C east of South America in the Atlantic sector of the Southern Ocean. As the SAF shifts southwards in the South Pacific, SAMW temperatures decrease, reaching a minimum of ~4°C just west of Drake Passage. In this region, the coldest, densest and freshest SAMW can be found (Talley et al. Reference Talley, Pickard, Emery and Swift2011).
Table I. Physical properties of the oceanic water masses present in the surface layers across the Atlantic, Pacific and Indian sectors of the Southern Ocean.
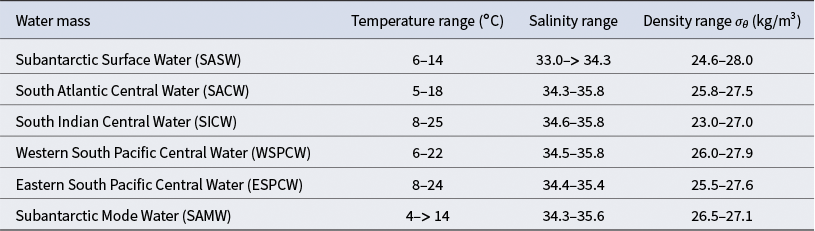
In addition, as the Southern Ocean connects to the Pacific, Indian and Atlantic oceans, several other local water masses can also be found: South Atlantic Central Water (SACW), South Indian Central Water (SICW), Eastern South Pacific Central Water (ESPCW) and Western South Pacific Central Water (WSPCW; Emery Reference Emery2001).
Data reliability and inter-annual variability
Anomalies were calculated by determining the differences between collocated SST or SSS values obtained from in situ observations and corresponding values from annual/weekly SST and SSS climatology/reanalysis datasets. The collocation process involves averaging the in situ data within the common 0.25° regular grid of the gridded product for comparison, ensuring a consistent spatial resolution. By comparing the anomalies of in situ data against the winter seasonal climatology of the WOA-23 dataset (constructed using data from 1991 to 2020), we aim to evaluate inter-annual variability across the three races and how the observed conditions deviate from the long-term mean state of the region. Conversely, by analysing the anomalies of in situ data with the reanalysis, we aim to assess the consistency between our measurements and an independent reference dataset that represents ocean conditions at the same time as when the in situ measurements were taken. This approach provides both a broader climatological context and an evaluation of the reliability of our dataset.
Results
Temperature and salinity distribution
South of 40°S, all three races - BWR-2011, BWR-2015 and VGR-2020/2021 - followed similar trajectories, crossing key oceanographic fronts such as the STF and SAF (Fig. 1). Each route generally aligned with the ACC, although the BWR-2011 course notably deviated by entering the Southern Ocean at higher latitudes. This race passed through the South Pacific sector via the Cook Strait in New Zealand, unlike the BWR-2015 and VGR-2020/2021, which followed a more southerly and consistent path near 55°S, as defined by the race organizers, conditioned by the actual distribution of drifting ice. The timing of each race also differed. Although all occurred during the summer, BWR-2011 crossed the Southern Ocean from 2 February to 26 March 2011, BWR-2015 from 28 January to 14 March 2015 and VGR-2020/2021 from 3 December 2020 to 17 January 2021. As such, the VGR-2020/2021 regatta was the most distinct in terms of seasonal timing (Figs. 3a–f).
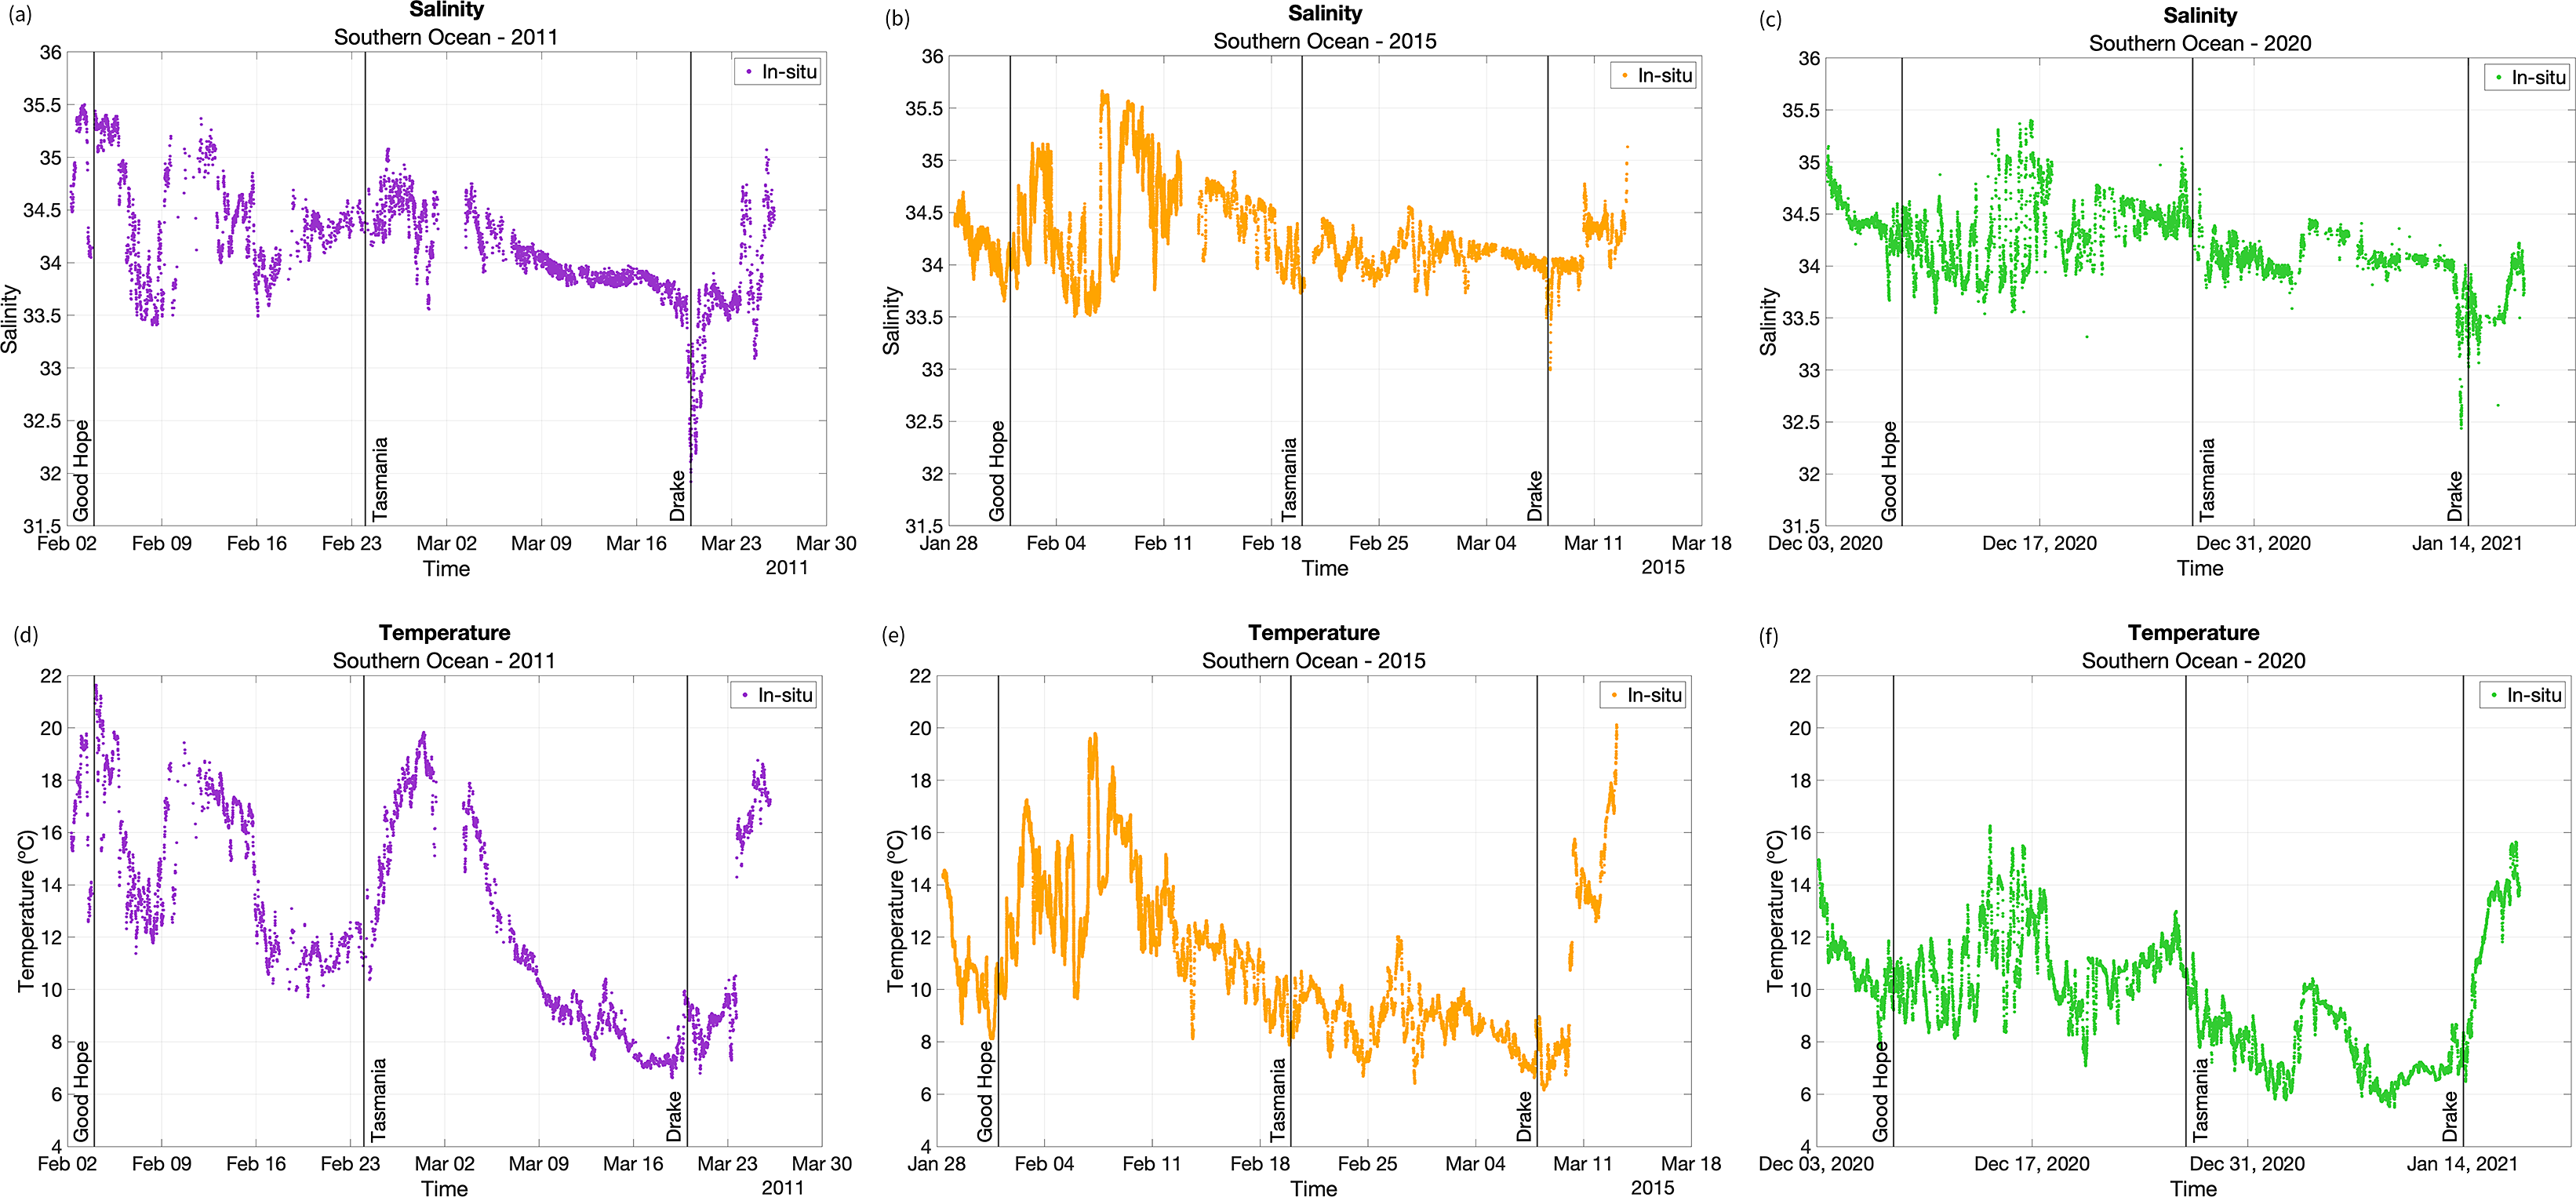
Figure 3. Time series of a.–c. sea-surface salinity and d.–f. temperature for the Barcelona World Races (BWRs) and Vendée Globe Race (VGR); in purple, orange and green are data corresponding to BWR-2011, BWR-2015 and VGR-2020/2021, respectively. The timings of the races passing through the Cape of Good Hope, the Tasmanian Passage and Drake Passage are indicated by black lines.
For the BWR-2011 regatta, salinity ranged from just over 31.5 up to 35.5. The highest values occurred near the Cape of Good Hope, followed by sharp decreases (probably when crossing the STF), a brief rise and a return to lower salinities near Drake Passage. A pronounced minimum of ~32 was recorded before salinity rose again to 35. Temperature values mirrored this pattern, ranging from 7°C to 22°C. After peaking early on, temperature dropped abruptly to 12°C, followed by oscillations and a sharp decline to 10°C in mid-February. It then gradually rose to nearly 19°C.
In BWR-2015, salinity ranged from 33.0 to 35.7. It decreased initially from 34.7 to 33.6, then sharply increased and fluctuated again before reaching a maximum of 35.7, probably upon crossing the STF. It then gradually declined to 33.7 and remained stable for nearly 3 weeks, reaching a minimum of 33.0 at Drake Passage. Afterwards, salinity increased again to 34.7 and peaked at 35.2. The temperature ranged from 6°C to 20°C. The initial sharp drop from 14.2°C to 8.7°C was followed by a gradual decline and a rapid rise to 17°C. This was followed by additional sharp fluctuations and a sustained decrease to 6.8°C by late February, then a partial recovery to 12°C, another decline to 6°C and a final rise to 20°C.
VGR-2020/2021 showed salinity values between 32.4 and 35.4. The initial decline from 35.2 to 34.3 was followed by irregular variations and alternating periods of sharp increases and decreases, probably associated with running approximately parallel to the STF, as is also visible in the temperature data. Salinity dropped to 33.6 before a rapid rise (probably near the SAF), then stabilized at ~34. After crossing Drake Passage, a sharp decrease to 32.5 was observed, followed by a steady increase.
Temperature during VGR-2020/2021 ranged from 5.8°C to 16.2°C. It began with a drop from 15°C to 8°C, then rose again to 16°C. Fluctuations continued for several days until a sharp drop to 7°C around mid-December (probably at the STF). This was followed by a week-long warming phase, another regular drop to 5.8°C and a subsequent increase to 10.3°C (probably at the SAF). After a short cooling period, temperatures rose steadily towards 15.8°C by the end of the leg.
Water mass identification
The T-S diagrams for each race are presented in Fig. 4. Figs. 4a, 4c and 4e show the race tracks colour-coded by date across the Southern Ocean, superimposed with the main frontal systems and the sea-ice extent contour of 15%. The associated T-S diagrams are shown in Figs. 4b, 4d and 4f, with water mass distributions indicated and coloured by date. Across all three races, several Southern Ocean water masses are consistently identified. The SASW and the SICW were observed in all three regattas, reflecting their broad distribution and persistent presence across the Southern Ocean. Notably, the SAMW is only clearly detected in BWR-2015 and VGR-2020/2021, especially around Drake Passage, where it exhibits its coldest characteristics, with temperatures dropping below 6°C. This suggests the local formation or strong influence of the SAMW in this region during those periods.
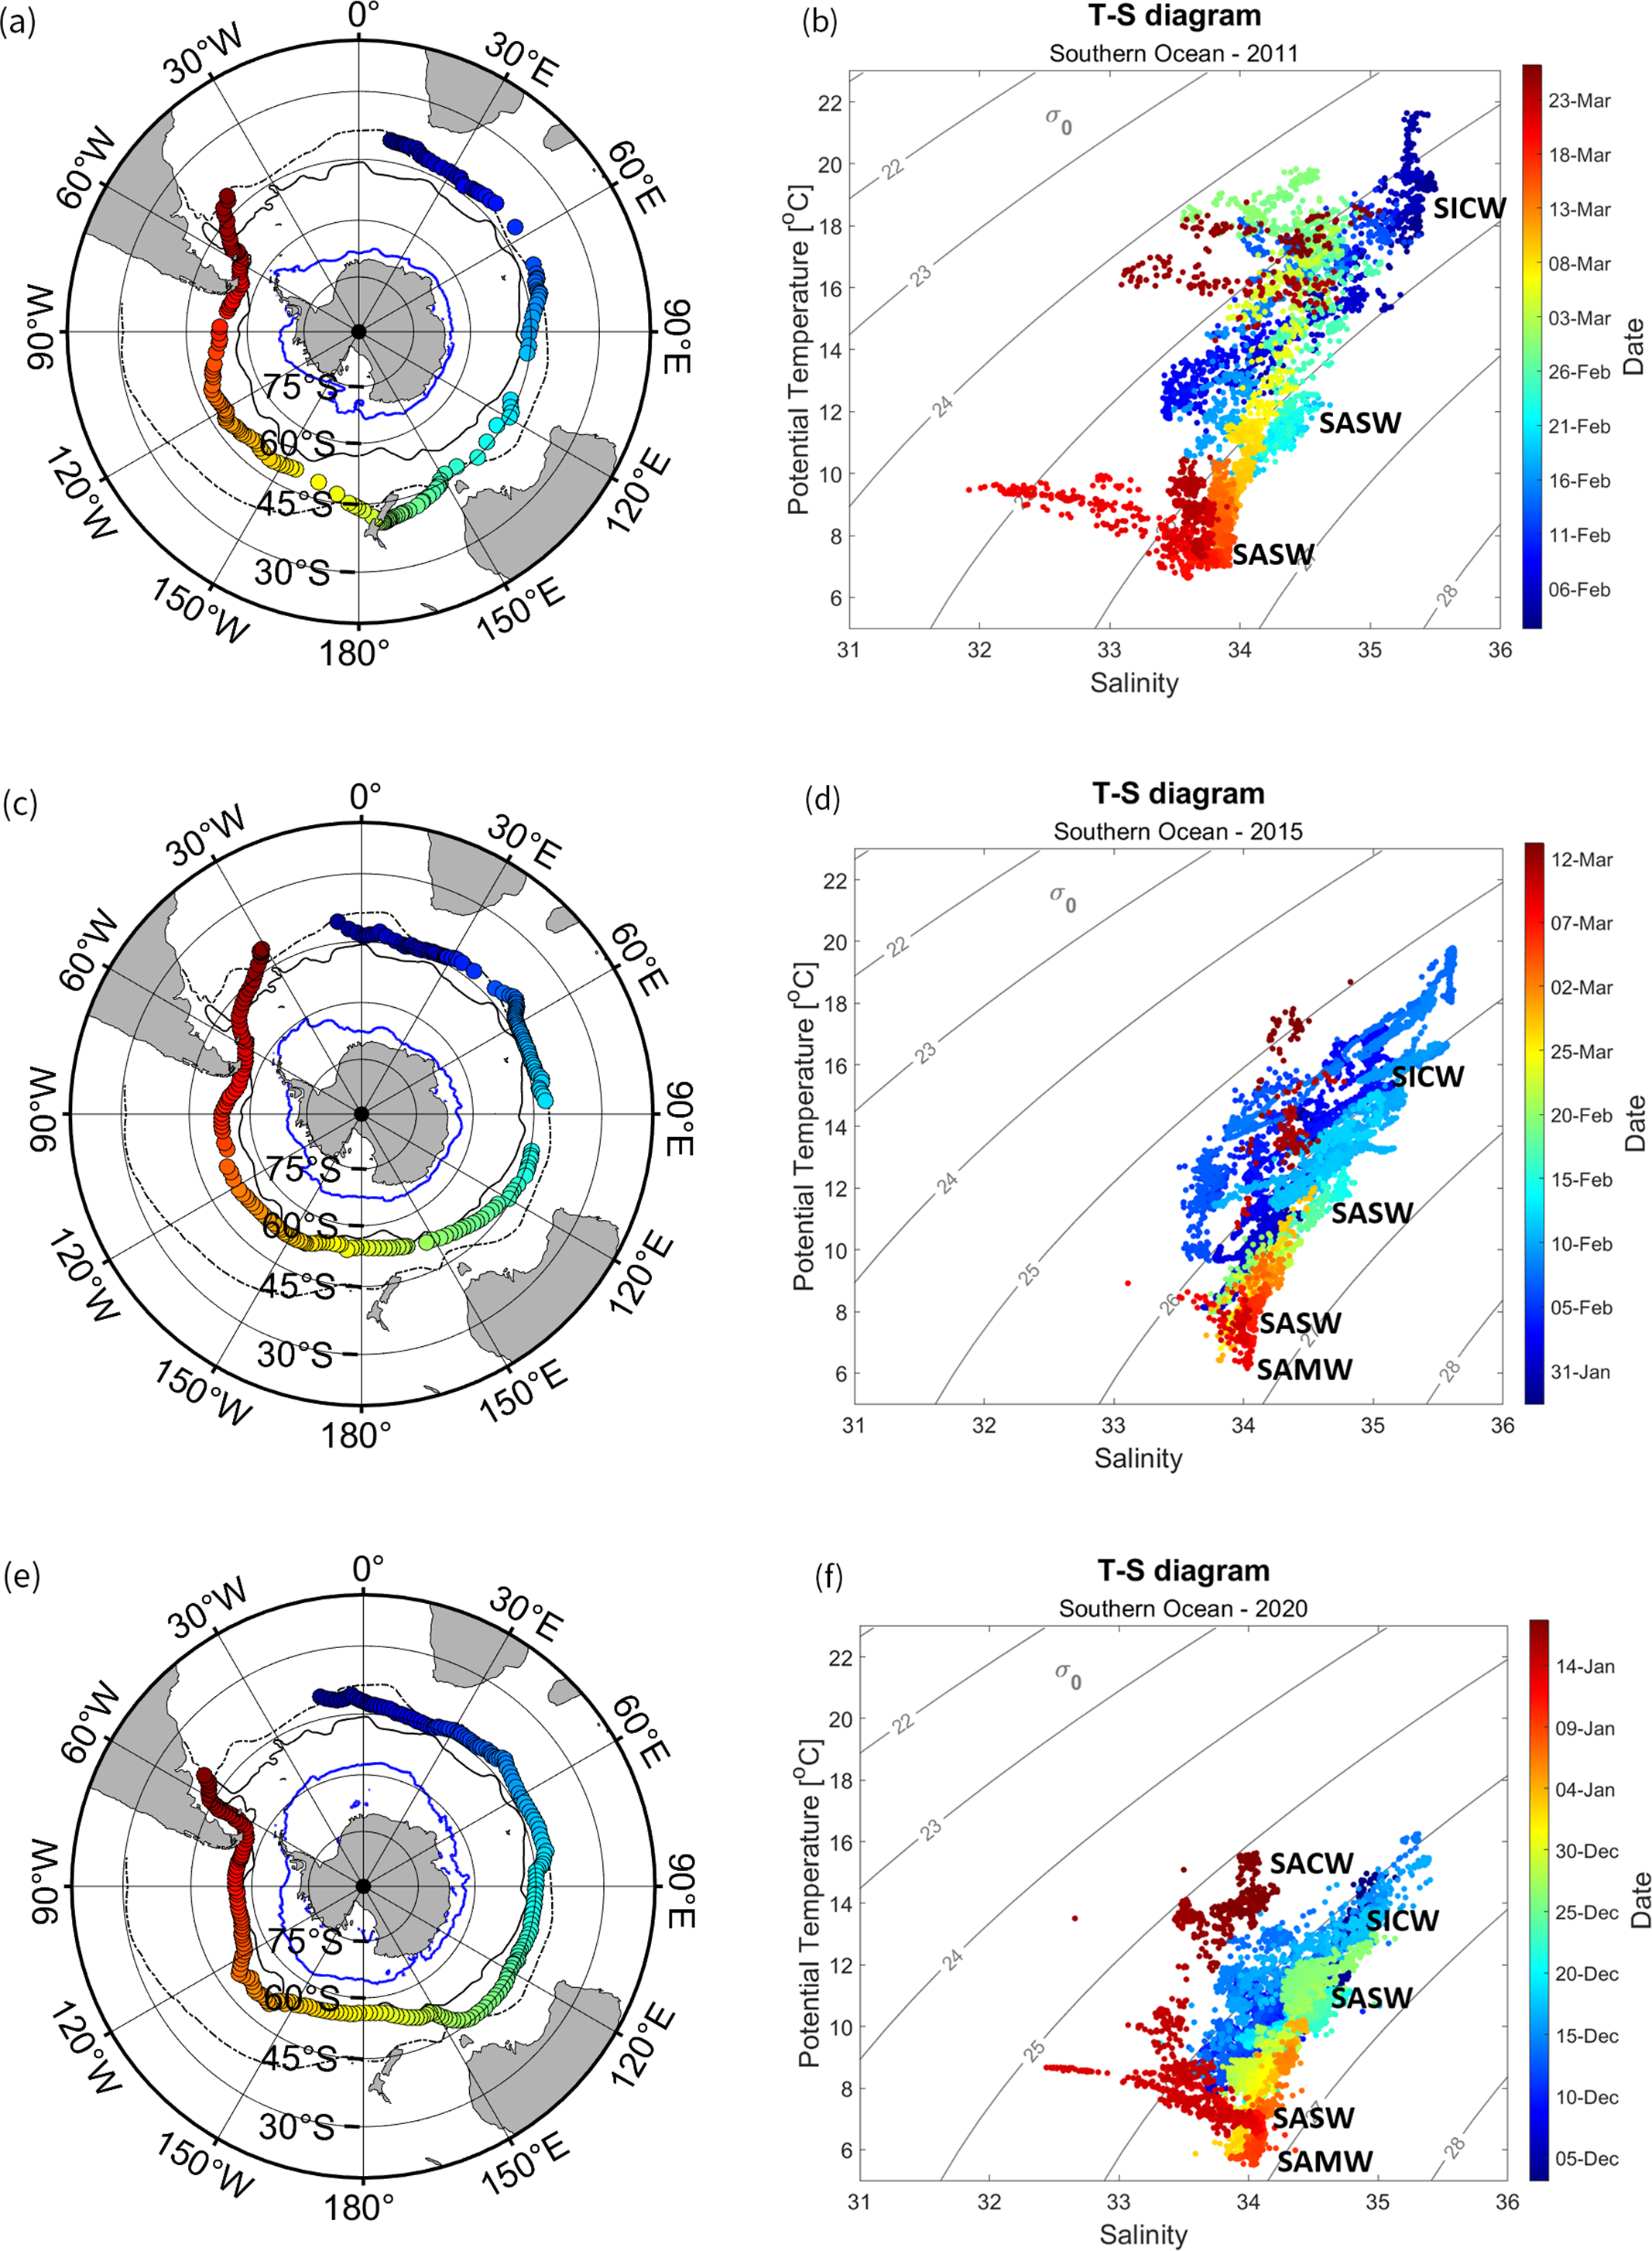
Figure 4. a., c. & e. Trajectories of the Barcelona World Races (2011 and 2015) and the Vendée Globe Race (2020/2021) across the Southern Ocean, overlaid with the climatological frontal positions (as in Fig. 1). The blue contours indicate the sea-ice concentration of 15%. b., d. & f. Corresponding temperature-salinity (T-S) diagram, with data indicated by colour and the identified Southern Ocean water masses according to Table I.
In VGR-2020/2021, an additional water mass - the SACW - is identified, which was not observed in the previous races. Its appearance may point to inter-annual variability or differing route conditions and timings during that race.
Another consistent pattern observed across all datasets - but particularly evident in BWR-2011 and VGR-2020/2021 - is a marked decrease in salinity as the yachts approached and passed through Drake Passage, especially in proximity to South Patagonia and Cape Horn. This salinity drop probably reflects the influence of freshwater input from continental runoff, glacial melt and enhanced mixing near the southern tip of South America, as well as changes in frontal structure and water mass interactions in that dynamic region.
In situ data comparison to ARMOR-3D
In Fig. 5, the differences between the three regattas and the ARMOR-3D reanalysis for SST and SSS are presented. Anomalies are represented along the trajectory of each regatta, where red and blue colours indicate saltier and warmer waters and fresher and less saline waters, respectively, compared to ARMOR-3D. Additionally, time series of salinity and temperature are shown alongside the weekly ARMOR-3D reanalysis values. In the time series panels, anomalies for each collocated data point are colour-coded.
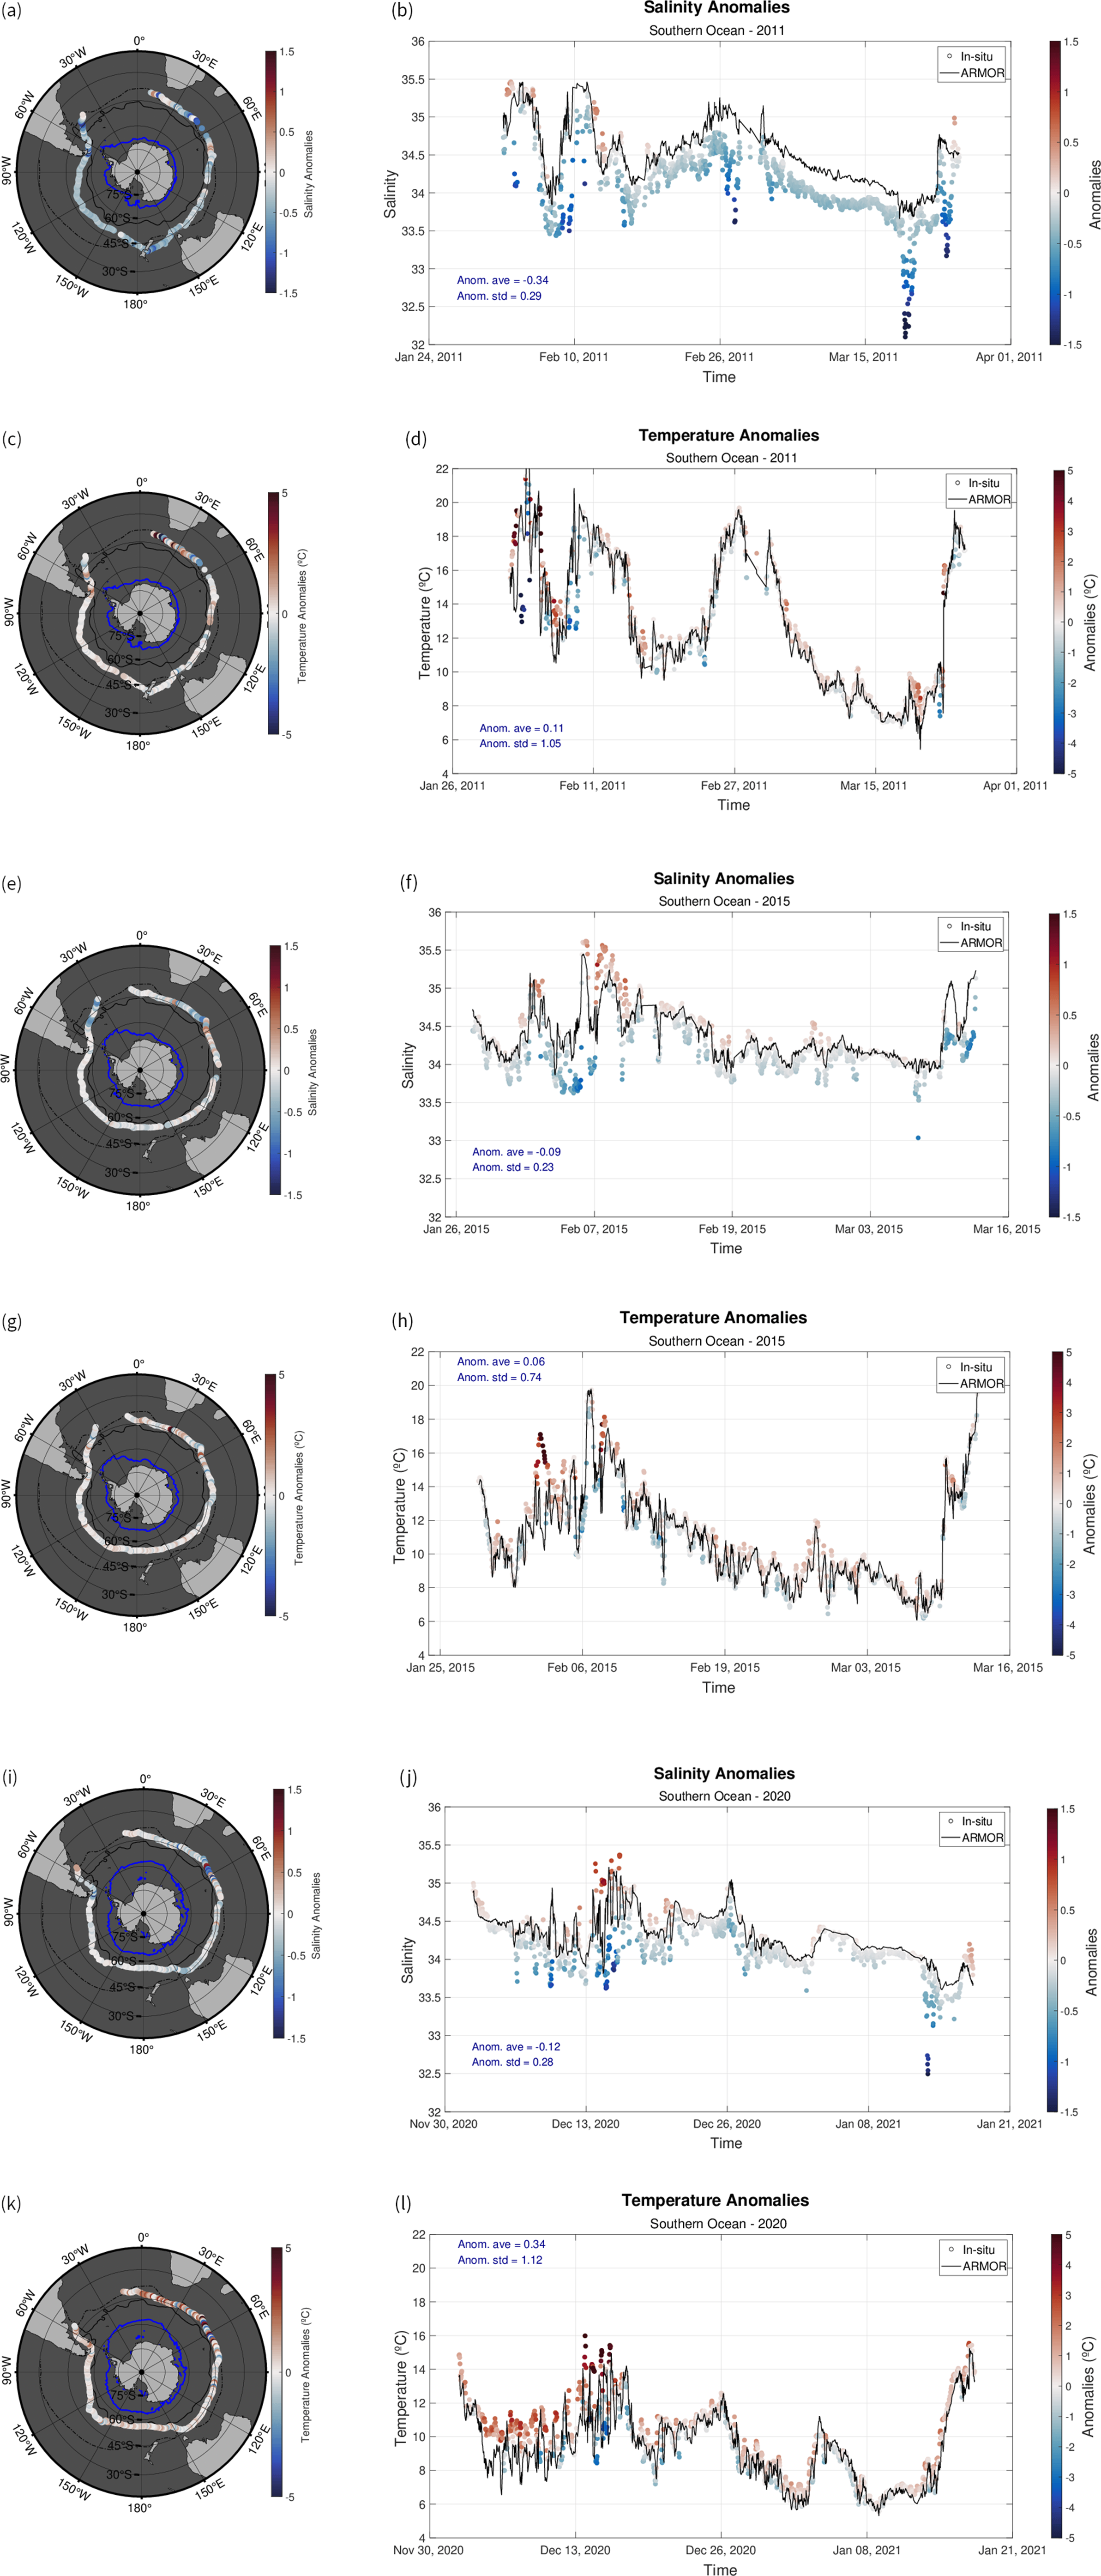
Figure 5. Maps and temporal evolutions of temperature and salinity anomalies of the three regattas (a.–d. Barcelona World Race (BWR)-2011, e.–h. BWR-2015, i.–l. Vendée Globe Race (VGR)-2020/2021) with respect to the ARMOR-3D weekly reanalysis. Fronts are depicted in black lines as in Fig. 1, and a 15% sea-ice concentration contour is shown (blue line).
In general, the salinity values exhibited stronger and more localized negative anomalies in Drake Passage, suggesting the influence of a combination of dynamic oceanographic processes and freshwater inputs from glacial meltwater. The BWR-2011 salinity anomalies (Fig. 5b) ranged from −1.6 to 0.6, with an average anomaly of −0.34 (standard deviation of 0.29), predominantly negative, particularly in the Pacific sector (25 February–23 March). The most intense negative anomalies (< −1.5) were observed in Drake Passage and between 45°W and 55°W in the South Atlantic, reaching −1.3. In contrast, positive anomalies were sporadically recorded between 3 and 20 February in the Atlantic and Indian sectors.
For temperature anomalies in BWR-2011 (Fig. 5d), values ranged between −6°C and 6°C, with an average anomaly of 0.11°C (± 1.05°C). The highest positive and negative anomalies were observed between 3 and 11 February in the Atlantic and Indian sectors, whereas relatively stable anomalies (± 0.5°C) dominated from 11 February to 18 March along longitudes of 60°E to 75°W. Increased variability was found near Drake Passage, with alternating positive and negative anomalies.
For BWR-2015, salinity anomalies (Fig. 5f) ranged between −1 and 1, with an average of −0.09 (± 0.23). The strongest negative anomalies (−1) were found between 45°E and 55°E, contrasting with positive anomalies of 0.4–1.0 in the Indian sector. Between 12 February and 9 March, anomalies were generally weak (−0.2 to 0.2), with fresher values in Drake Passage. Temperature anomalies in BWR-2015 (Fig. 5h) ranged from −2.5°C to 5.7°C, with an average of 0.06°C (± 0.74°C). The most extreme 5.7°C positive anomalies were observed near 30°E and 60°E, while negative values reached −1.7°C at 45°E–55°E. The anomalies alternated throughout the trajectory without a clear spatial pattern.
For VGR-2020/2021, salinity anomalies (Fig. 5j) ranged between −1.4 and 1.3, with an average of −0.12 (± 0.28). The strongest negative anomalies (−1.5) were recorded in Drake Passage, whereas alternating fresh and saline values were noted between 45°E and 65°E in the Indian sector. Temperature anomalies in VGR-2020/2021 (Fig. 5l) ranged between −3.7°C and 5.0°C, with an average of 0.34°C (± 1.12°C). Predominantly positive anomalies (> 2°C, peaking at 5°C) were observed between 45°E and 65°E, and the strongest negative anomalies (−3.7°C) also appeared within the same region. Between 17 December and 13 January, both positive and negative anomalies alternated across the Indian and Pacific sectors, with a slight predominance of positive values.
The salinity anomalies observed during the BWR-2011 cruise, as shown in Fig. 5b, exhibit a predominantly negative trend, with an average anomaly of −0.34 and a standard deviation of 0.29, suggesting generally fresher conditions relative to the ARMOR-3D reanalysis. The largest negative anomalies, exceeding −1.5, were observed in Drake Passage and in the South Atlantic sector between 45°W and 55°W. While this might suggest a systematic offset, we have conducted extensive QC of the in situ data and found no evidence of instrumental drift or sensor malfunction.
Given the consistency of the negative bias across the different oceanic regions, we interpret these anomalies as reflective of actual oceanographic conditions rather than an instrumental issue. Additionally, the fact that the comparison with WOA-23 climatology yields similar negative anomalies further supports the validity of our observations. The observed discrepancies probably stem from short-term mesoscale variability that is not fully captured by reanalysis or climatological products rather than from a bias in the in situ measurements.
Furthermore, similar fresh anomalies are present in the 2015 and 2020/2021 cruises, albeit with reduced magnitudes. This suggests that inter-annual variability in freshwater content, possibly linked to regional oceanographic processes, plays a role in the observed patterns. It is worth noting that reanalysis products such as ARMOR-3D, while incorporating observational data, are subject to smoothing and interpolation, which may result in systematic differences when compared with direct in situ measurements, particularly in dynamic regions such as the Southern Ocean.
Inter-annual variability between the three regattas
Fig. 6 presents the spatial distribution (left) and temporal evolution (right) of salinity and temperature anomalies observed during the three regattas: BWR-2011 (Fig. 6a–d), BWR-2015 (Fig. 6e–h) and VGR-2020/2021 (Fig. 6i–l). These anomalies are calculated relative to the WOA-23 climatology and help assess inter-annual hydrographic variability in the Southern Ocean.
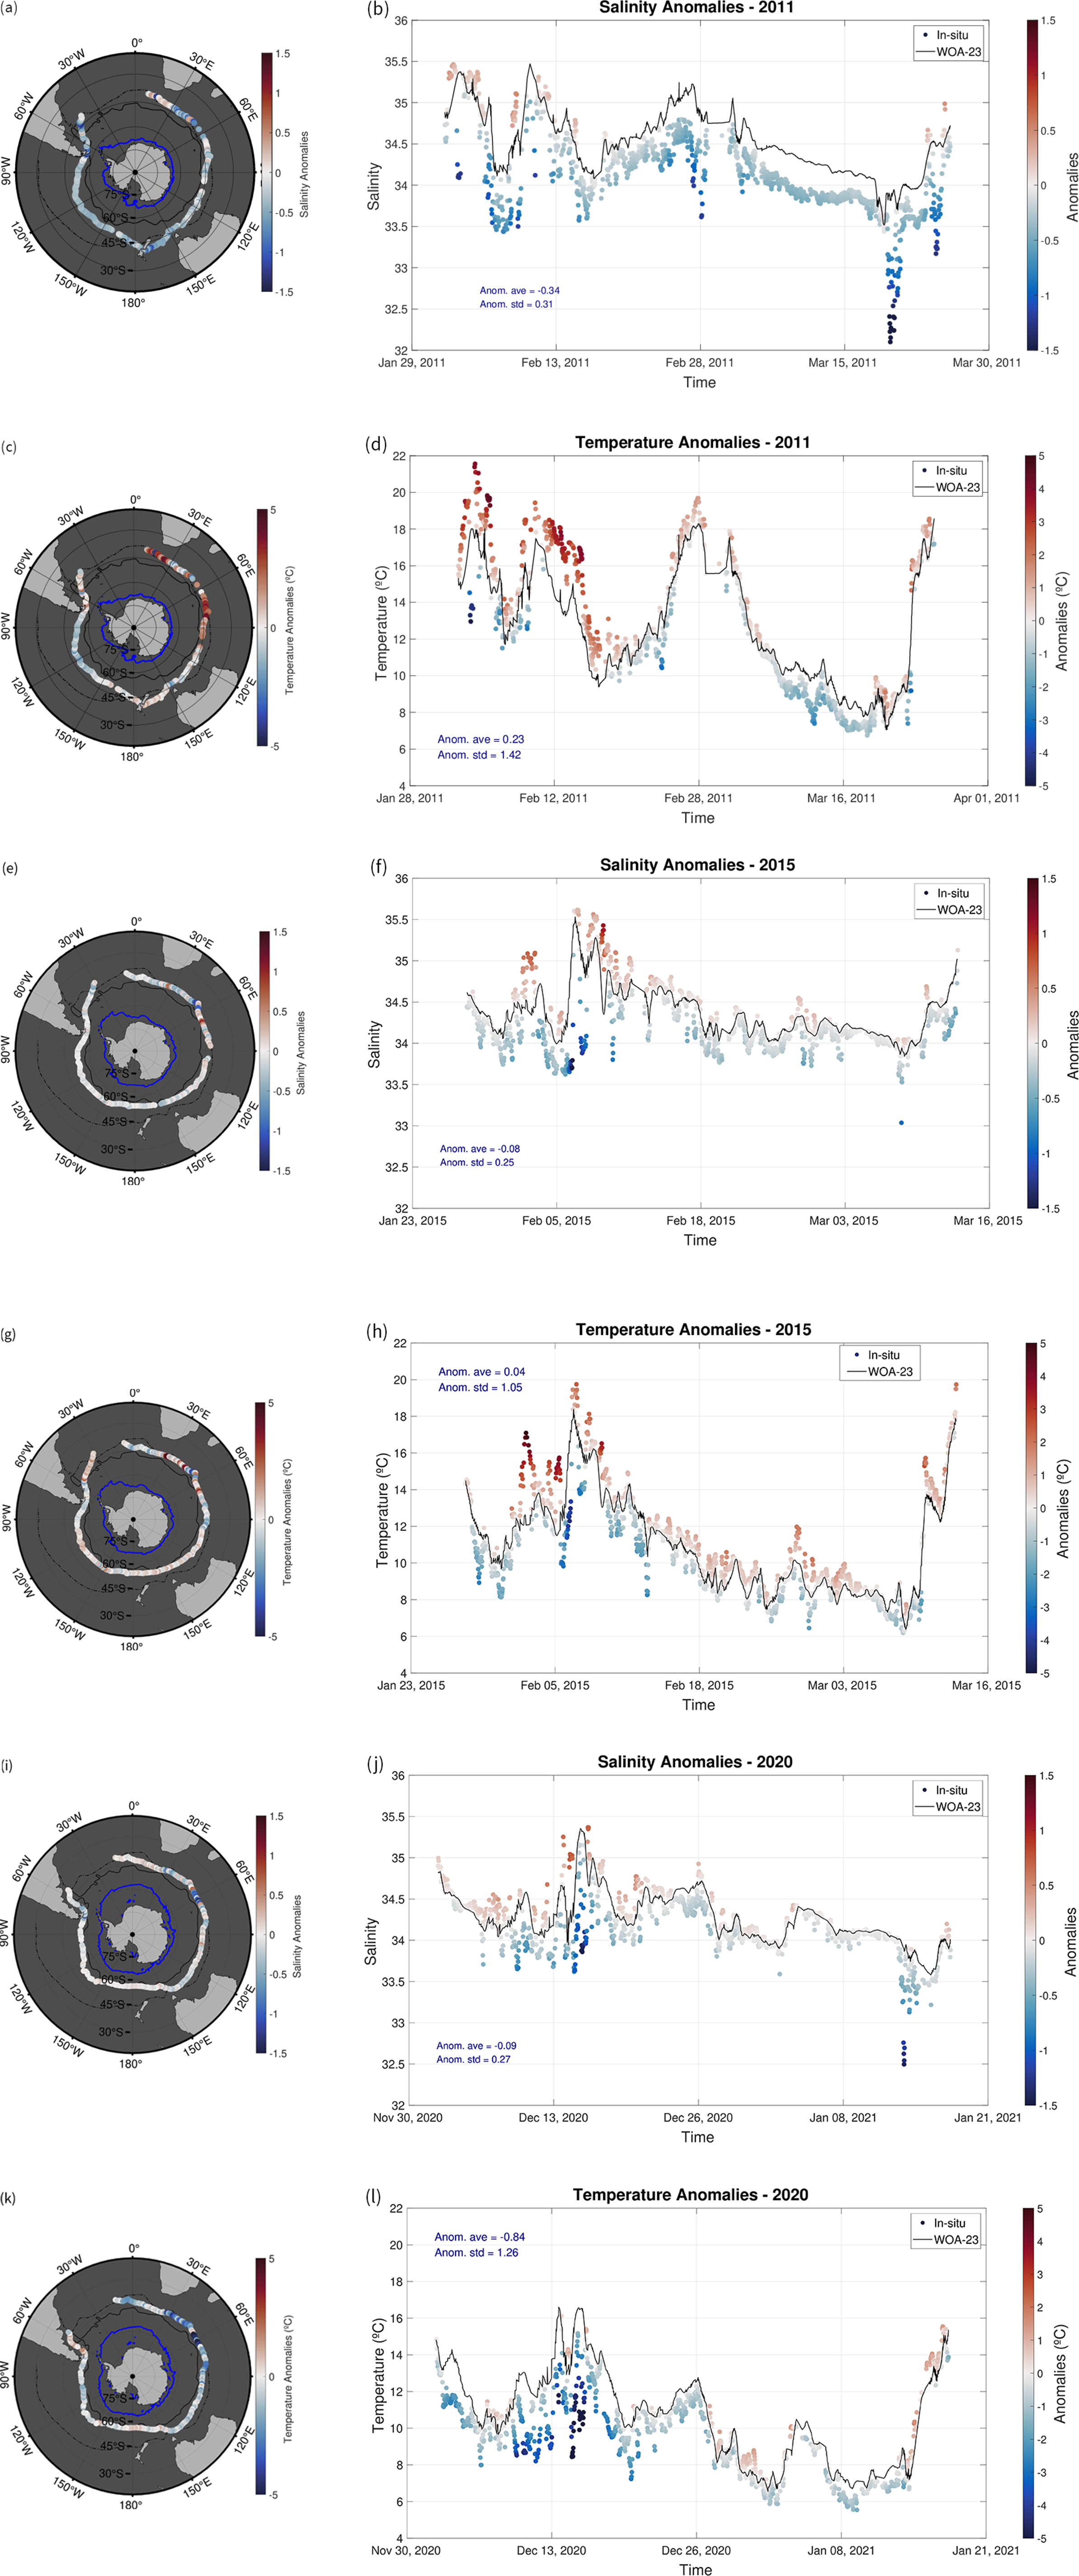
Figure 6. Maps and temporal evolutions of temperature and salinity anomalies of the three regattas (a.–d. Barcelona World Race (BWR)-2011, e.–h. BWR-2015, i.–l. Vendée Globe Race (VGR)-2020/2021) with respect to World Ocean Atlas 2023 (WOA-23) climatology. Fronts are depicted in black lines as in Fig. Fig. 1, and a 15% sea-ice concentration contour is shown (blue line).
The maps in Fig. 6 indicate regions where surface waters were fresher (negative anomalies) or saltier (positive anomalies) compared to the climatological mean. The time series in Fig. 6 illustrate how salinity and temperature evolved along the race trajectories.
For the BWR-2011 regatta, salinity anomalies relative to the WOA-23 climatology ranged from approximately −1.7 to 0.5, with the most negative anomalies (indicating freshening) coinciding with Drake Passage on 19 March. The average anomaly was −0.34 (standard deviation of 0.31). Overall, the anomalies exhibited a negative trend, representing freshening of the water, with a few positive anomalies (indicating saltier waters) observed at the beginning and end of the time series. The predominantly negative anomalies were particularly pronounced in the Pacific sector and near New Zealand, whereas positive anomalies appeared initially as the sailboat transited southern Africa, spanning ~10°E to 50°E. Temperature anomalies for the same regatta ranged from approximately −5.0°C to 4.5°C, with an average anomaly of 0.2°C (standard deviation of 1.4°C). Unlike salinity, the anomalies displayed a more balanced distribution between positive and negative, indicating regions with both warmer (Indian Ocean) and cooler (Pacific Ocean) water conditions. Notable negative anomalies, reaching approximately −5.0°C, were observed at various points along the trajectory. Positive anomalies generally remained below 4.5°C, with some exceptions near the beginning and end of the period. Similar to the salinity patterns, regions near New Zealand and southern Africa exhibited higher anomalies, reaching up to 4–5°C, indicating localized warmer and fresher water conditions. Overall, both salinity and temperature anomalies demonstrated that regions with higher (lower) measurements correspondingly exhibited higher (lower) anomalies.
For the BWR-2015 regatta, salinity anomalies ranged from approximately −1.5 to 1.1, with an average anomaly of −0.08 (standard deviation of 0.25). The most notable anomalies, both negative and positive, were concentrated between 15°E and 75°E, with the minimum occurring on 8 February at ~50°E to 60°E. That minimum was followed by maximum anomalies on 10 February near 65°E, primarily within the Indian sector. Overall, although less pronounced compared to other cases, the anomalies tended to be negative, at approximately −0.5 or slightly less negative. In terms of temperature, the anomalies were generally positive, with an average anomaly of 0.04°C (standard deviation of 1.05°C), indicating overall warmer water conditions, with a few instances of negative anomalies of approximately −1.0°C. Anomalies typically ranged from 1°C to 2°C, except in regions spanning between 25°E and 70°E and between 30°W and 55°W, where anomalies exceeded 3°C and reached maximum values, corresponding to the Indian and Atlantic sectors, respectively. In summary, both salinity and temperature anomalies exhibited a fairly homogeneous pattern, with notable deviations in certain regions, particularly within the Indian and Atlantic sectors.
For the VGR-2020/2021 regatta, salinity anomalies ranged from approximately −1.5 to 0.8, with an average anomaly of −0.1 (standard deviation of 0.3). The most notable anomalies, both negative and positive, were concentrated between 45°E and 65°E, primarily within the Indian sector. Additionally, significantly negative anomalies were observed at ~30°E, south of Africa, and at Drake Passage. Across other regions, anomalies fluctuated between negative and positive values, with negative anomalies being more prevalent and of greater magnitude in absolute terms, although both were generally less than 0.5. Regarding temperature, anomalies ranged from approximately −6.6°C to 1.7°C, with an average anomaly of −0.8°C (standard deviation of 1.3°C). The most extreme negative temperature anomaly, reaching −6.6°C, occurred at ~60°E, coinciding with the lowest temperature anomaly along the entire trajectory and corresponding salinity minimum. Subsequently, anomalies became predominantly positive; indeed, near the south-east coast of South America, the highest anomalies of up to 1.7°C were observed.
To sum up, a general trend of freshening is evident, particularly at Drake Passage and south of Africa and in the Indian sector. Temperature anomalies display strong regional variability, with notable cooling in the Pacific sector and warmer anomalies in the Indian and Atlantic sectors. The VGR-2020/2021 regatta shows generally lower temperature anomalies, suggesting cooler conditions during that period. These findings highlight the spatial and temporal variability in hydrographic properties, linking them to large-scale oceanographic processes and inter-annual climate variability.
Fig. 7 presents a scatter plot of surface temperature and salinity anomalies for the three regattas relative to WOA-23. The BWR-2011, BWR-2015 and VGR-2020/2021 regattas are colour-coded to facilitate comparison of their anomaly distributions. Fig. 7 provides insights into how temperature and salinity anomalies co-vary across different years and regions. A general negative correlation is observed, indicating that fresher waters often correspond to cooler anomalies. The VGR-2020/2021 regatta exhibits broader variability, particularly in terms of negative temperature anomalies, suggesting that this regatta encountered relatively cooler waters compared to previous ones, possibly reflecting the specific period during which this race took place. The spread of salinity anomalies also reflects regional differences in water mass properties, with some positive salinity anomalies indicating localized variability in oceanographic conditions.
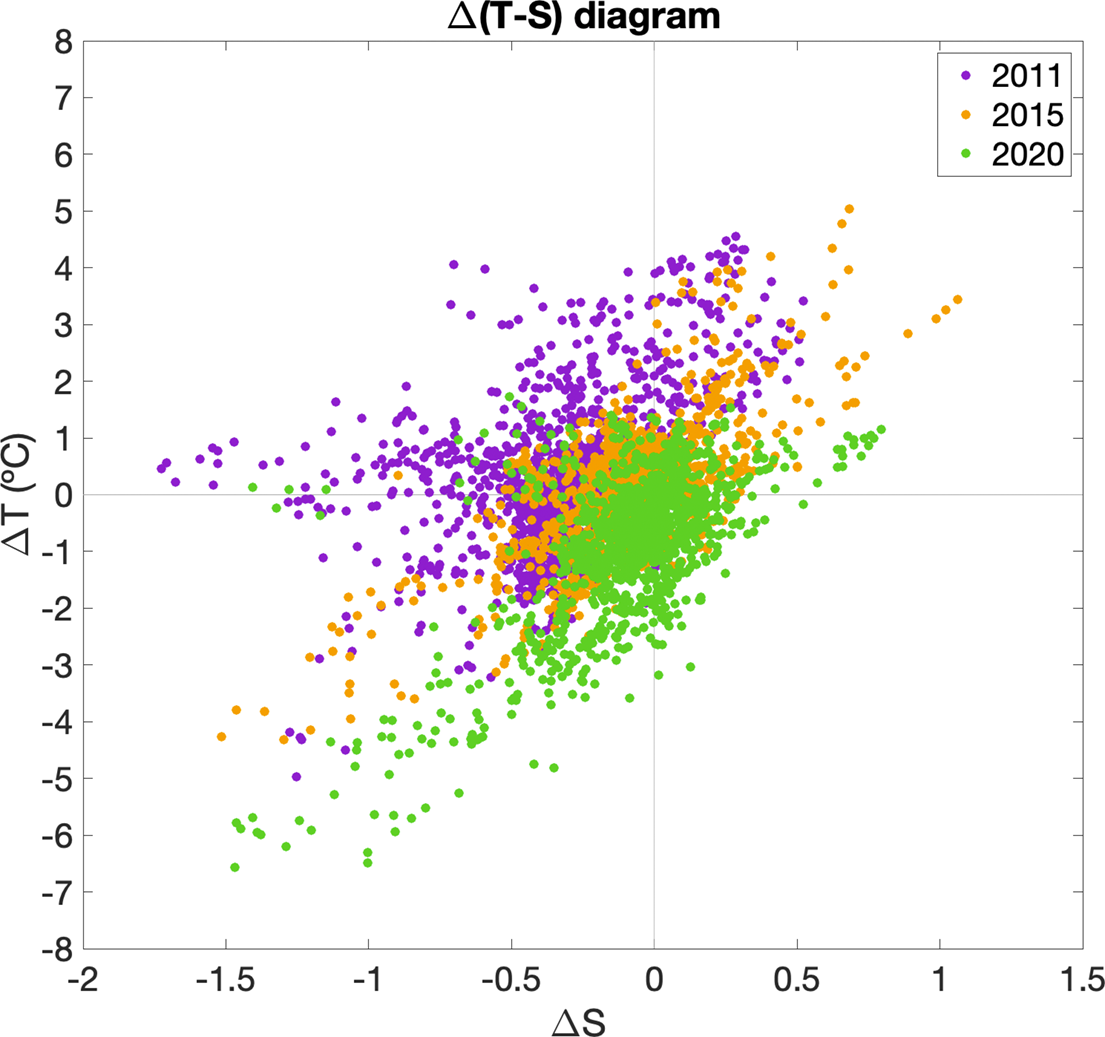
Figure 7. Diagram of the temperature (T) and salinity (S) anomalies of the Barcelona World Race (BWR)-2011 (in purple), BWR-2015 (in orange) and Vendée Globe Race (VGR)-2020/2021 (in green) with respect to World Ocean Atlas 2023 climatology.
Table II summarizes the averages and standard deviations of temperature and salinity anomalies for each regatta. The values highlight differences between anomalies calculated with respect to ARMOR-3D and WOA-23. Overall, anomalies relative to ARMOR-3D tend to be lower, indicating that this dataset is more consistent with in situ measurements. However, some local variability is not captured, as seen in the standard deviations.
Table II. Average (Ave.) and standard deviation (Std.) of sea-surface temperature (SST) and sea-surface salinity (SSS) anomalies for the three regattas (Barcelona World Race (BWR)-2011, BWR-2015, Vendée Globe Race (VGR)-2020/2021) calculated relative to the World Ocean Atlas 2023 (WOA-23) climatology and ARMOR-3D reanalysis.
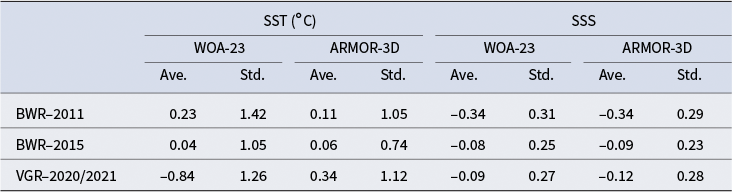
For SST anomalies, the VGR-2020/2021 regatta exhibits a negative mean anomaly with respect to WOA-23, suggesting cooler waters compared to climatology, while ARMOR-3D presents a positive mean anomaly, indicating a closer match to in situ conditions. The standard deviation values reflect the spread of anomalies, with higher variability observed in WOA-23-based anomalies. Regarding SSS anomalies, all three regattas show predominantly negative anomalies, consistent with the freshening trend observed in Fig. 6. The differences between WOA-23 and ARMOR-3D are smaller than those observed for temperature, suggesting that both datasets provide a reasonable approximation of salinity variability, although ARMOR-3D exhibits slightly better agreement with the in situ data.
Fig. 8 presents scatter plots comparing in situ SST data with reanalysis (ARMOR-3D) and climatology (WOA-23) for each regatta below 40°S. Figs. 8a, 8c and 8e compare in situ SST with ARMOR-3D, while Figs. 8b, 8d and 8f compare in situ SST with WOA-23.
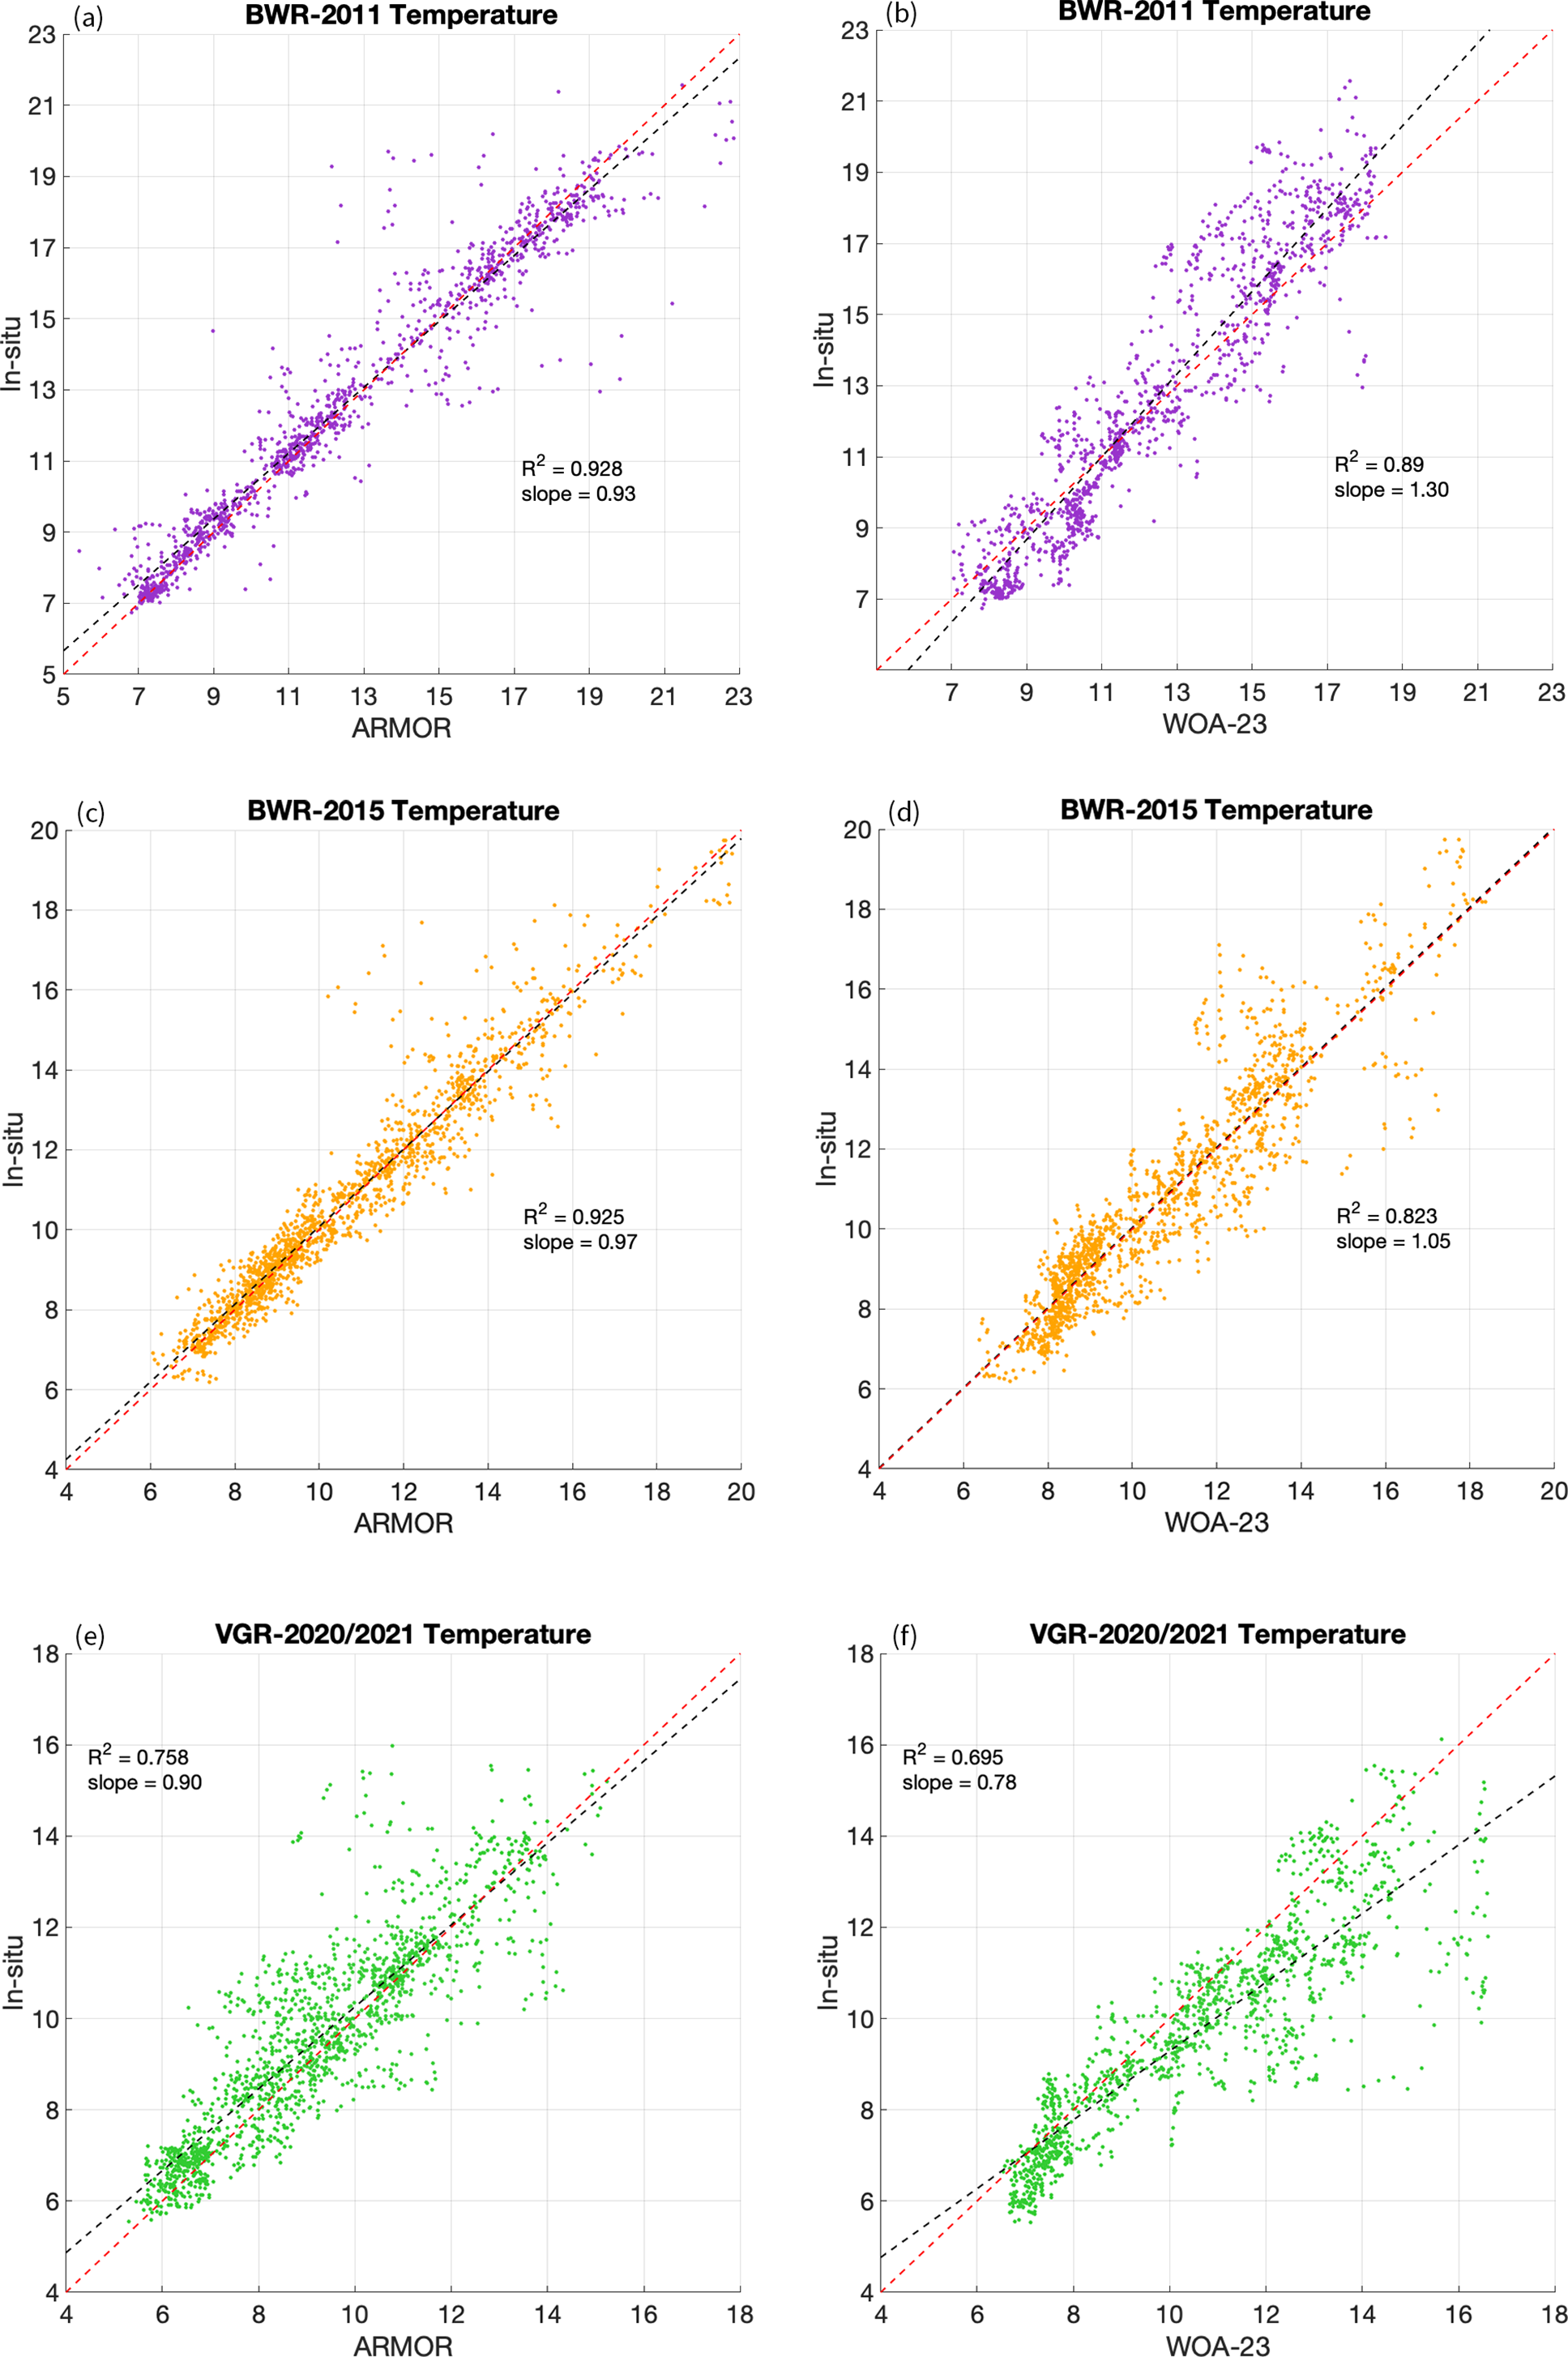
Figure 8. Scatter plots between in situ sea-surface temperature and reanalyses (ARMOR-3D) and climatology (World Ocean Atlas 2023 (WOA-23)) data for a. & b. Barcelona World Race (BWR)-2011, c. & d. BWR-2015 and e. & f. Vendée Globe Race (VGR)-2020/2021. The ${R}^2$
and slope coefficients of the linear fit are indicated in each plot.
${R}^2$
and slope coefficients of the linear fit are indicated in each plot.
For each plot, the red dashed line shows the ${x = y}$
. The regression lines (black dashed) and
${x = y}$
. The regression lines (black dashed) and ${R}^2$
values indicate how well each dataset aligns with in situ observations. ARMOR-3D exhibits higher
${R}^2$
values indicate how well each dataset aligns with in situ observations. ARMOR-3D exhibits higher ${R}^2$
values and slopes closer to 1, indicating that it better captures SST variability than WOA-23. The agreement is particularly strong in BWR-2015 and VGR-2020/2021, reaffirming ARMOR-3D as a more reliable reference for SST anomalies in the region. The scatter plots also reveal that WOA-23 tends to overestimate SST in some cases, leading to slopes that deviate from 1, particularly in BWR-2011.
${R}^2$
values and slopes closer to 1, indicating that it better captures SST variability than WOA-23. The agreement is particularly strong in BWR-2015 and VGR-2020/2021, reaffirming ARMOR-3D as a more reliable reference for SST anomalies in the region. The scatter plots also reveal that WOA-23 tends to overestimate SST in some cases, leading to slopes that deviate from 1, particularly in BWR-2011.
Overall, higher ${R}^2$
values and slope values closer to 1 are obtained for the scatter plots related to ARMOR-3D, indicating that the in situ data better fit the reanalyses.
${R}^2$
values and slope values closer to 1 are obtained for the scatter plots related to ARMOR-3D, indicating that the in situ data better fit the reanalyses.
Fig. 9 follows a similar structure to Fig. 8 but focuses on SSS instead of SST. For each plot, the red dashed line shows the ${x = y}$
. The black dashed line indicates the linear fit through the data cloud. The
${x = y}$
. The black dashed line indicates the linear fit through the data cloud. The ${R}^2$
and slope coefficients of the linear fit are indicated in each plot. Figs. 9a, 9c and 9e compare in situ SSS with ARMOR-3D, while Figs. 9b, 9d and 9f compare it with WOA-23. Unlike temperature, salinity correlations are generally weaker, probably due to local-scale variability in SSS that is not fully captured by large-scale reanalyses. The BWR-2011 regatta exhibits more scatter, indicating higher variability in salinity measurements compared to the climatological mean. While ARMOR-3D still provides a closer fit than WOA-23, the differences are less pronounced than in the SST comparisons. WOA-23 generally shows a larger spread in salinity values, leading to weaker correlation coefficients compared to ARMOR-3D, suggesting that the reanalysis data better capture in situ conditions. Fig. 9 provides insights into the strengths and limitations of using reanalysis and climatology for salinity studies in the Southern Ocean.
${R}^2$
and slope coefficients of the linear fit are indicated in each plot. Figs. 9a, 9c and 9e compare in situ SSS with ARMOR-3D, while Figs. 9b, 9d and 9f compare it with WOA-23. Unlike temperature, salinity correlations are generally weaker, probably due to local-scale variability in SSS that is not fully captured by large-scale reanalyses. The BWR-2011 regatta exhibits more scatter, indicating higher variability in salinity measurements compared to the climatological mean. While ARMOR-3D still provides a closer fit than WOA-23, the differences are less pronounced than in the SST comparisons. WOA-23 generally shows a larger spread in salinity values, leading to weaker correlation coefficients compared to ARMOR-3D, suggesting that the reanalysis data better capture in situ conditions. Fig. 9 provides insights into the strengths and limitations of using reanalysis and climatology for salinity studies in the Southern Ocean.
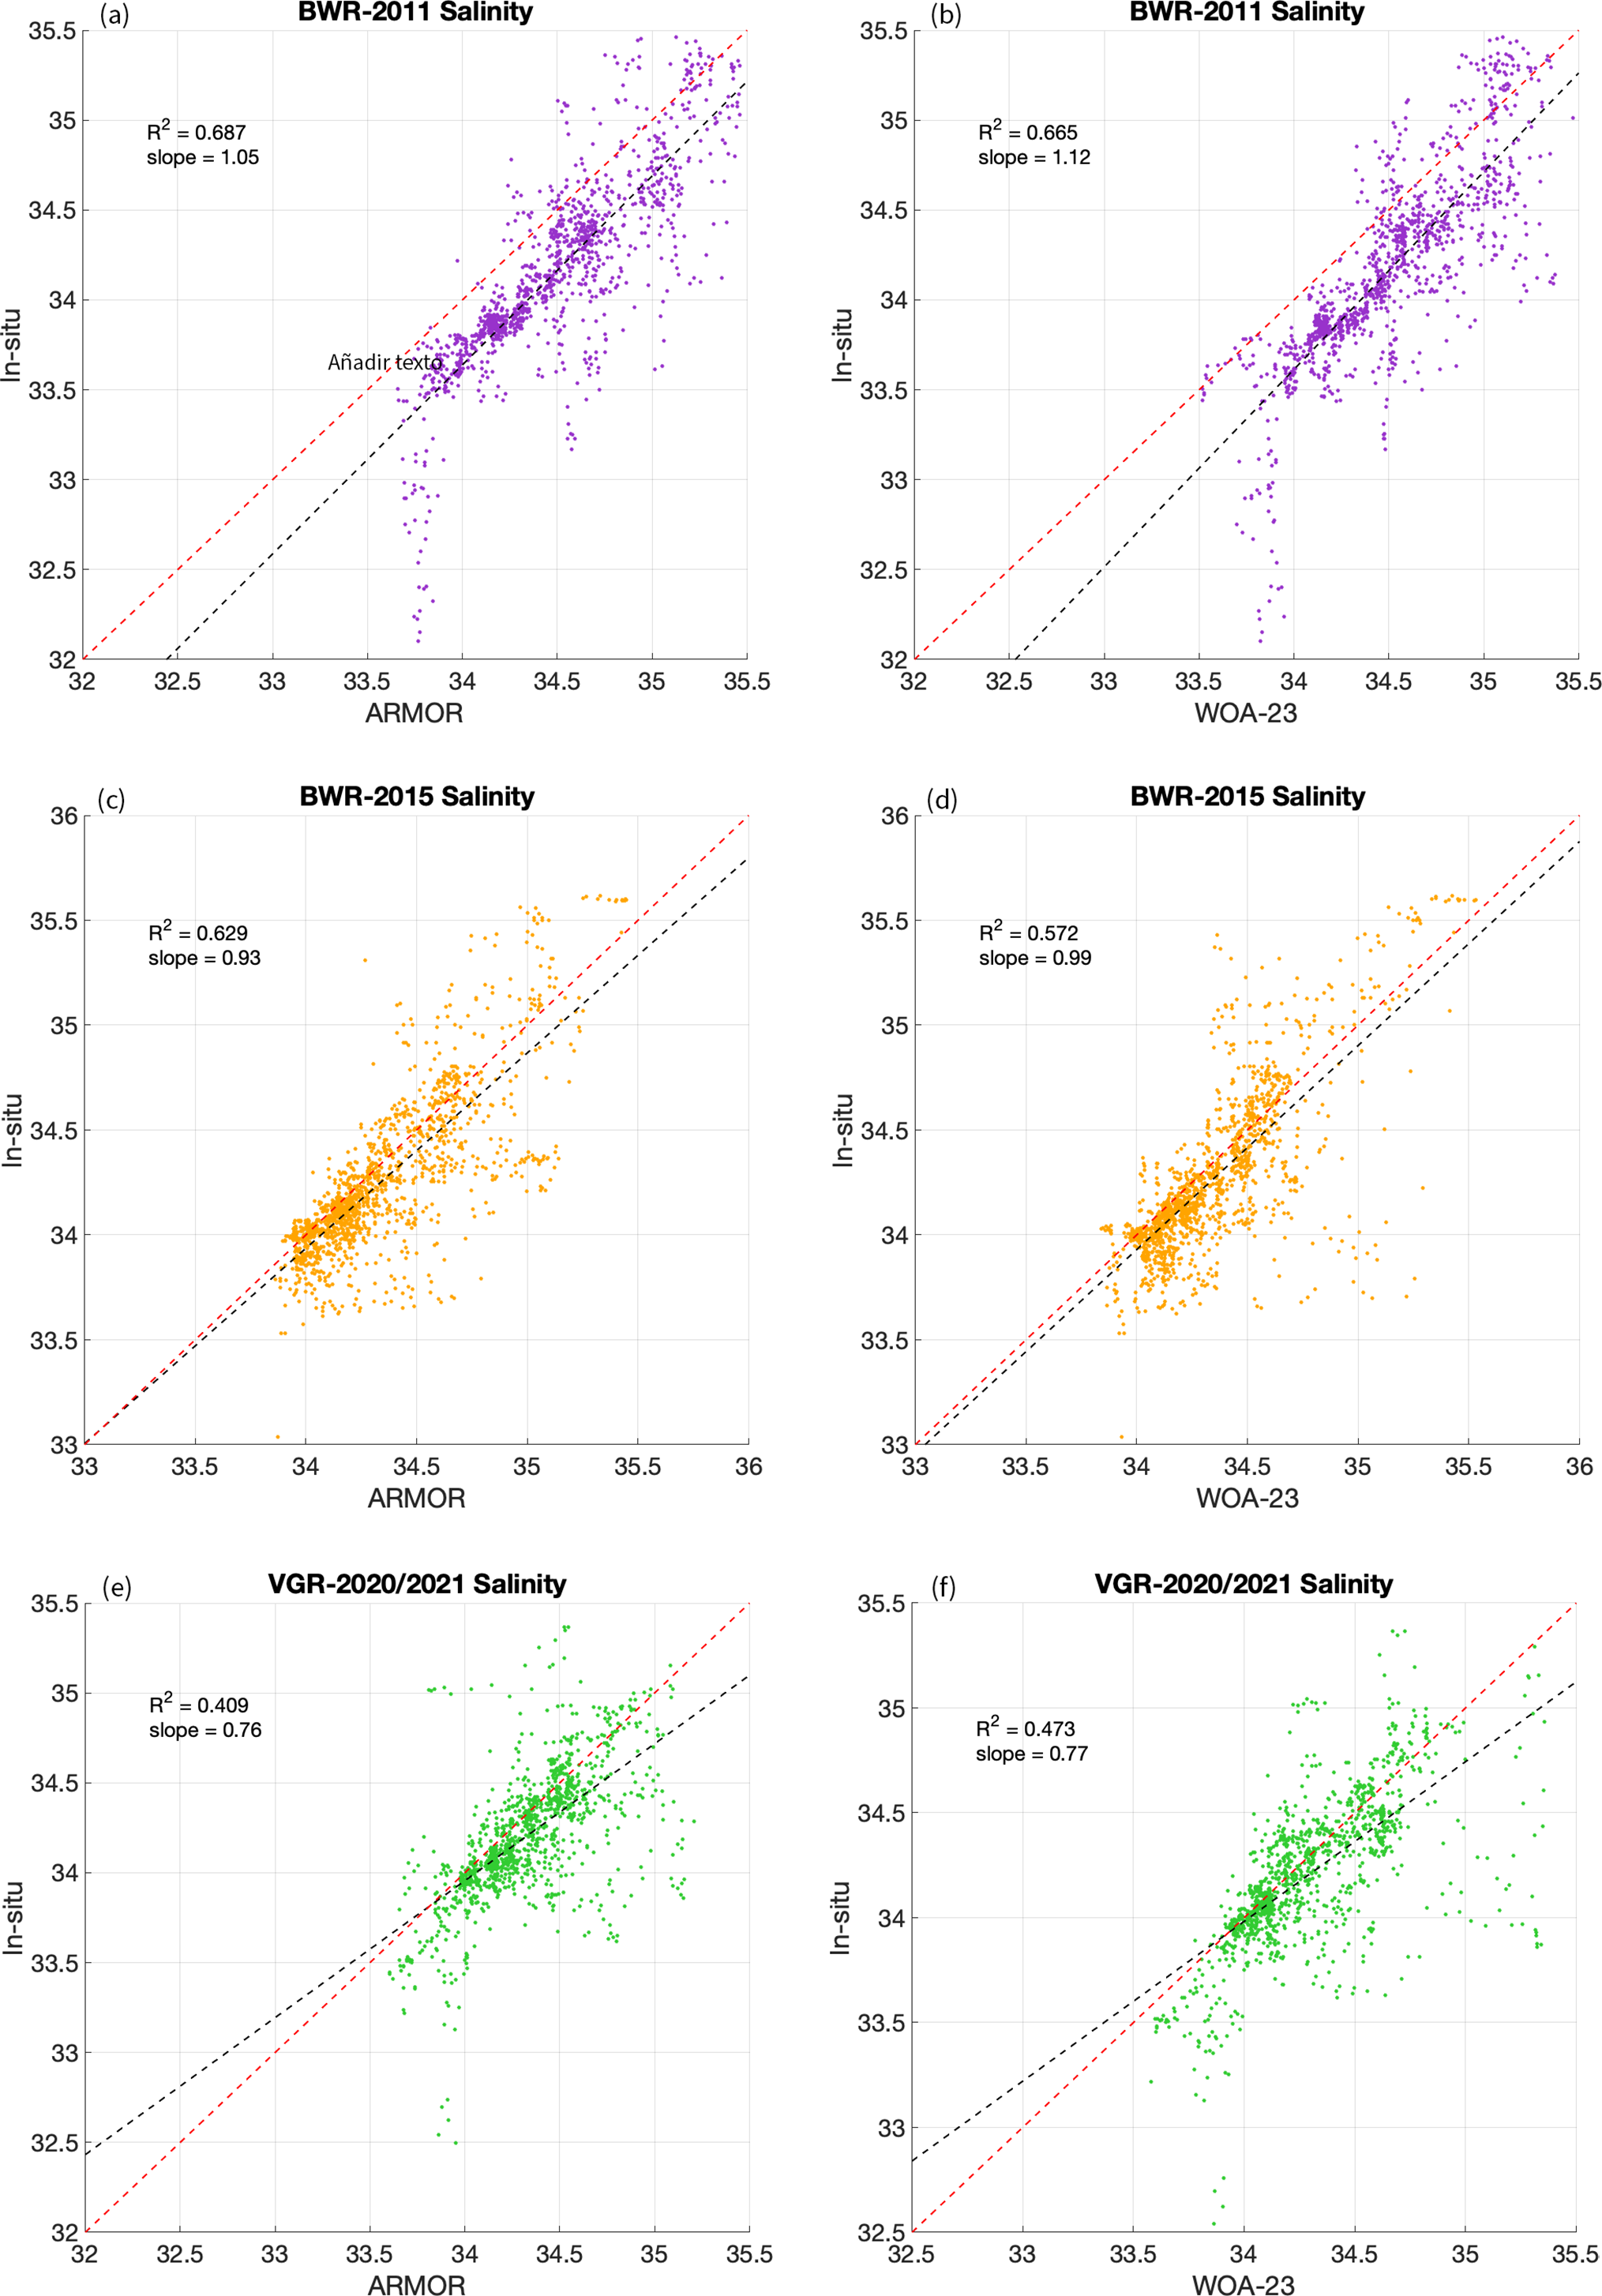
Figure 9. Scatter plots between in situ sea-surface salinity and reanalyses (ARMOR-3D) and climatology (World Ocean Atlas 2023 (WOA-23)) data for a. & b. Barcelona World Race (BWR)-2011, c. & d. BWR-2015 and e. & f. Vendée Globe Race (VGR)-2020/2021. The ${R}^2$
and slope coefficients of the linear fit are indicated in each plot.
${R}^2$
and slope coefficients of the linear fit are indicated in each plot.
In summary, we observe that the in situ data (temperature and salinity) generally aligned more closely with the reanalysis data than with climatology, as expected; lower averages and standard deviations were obtained in the case of anomalies corresponding to ARMOR-3D. Notably, during the 2011 period, the in situ data indicates greater freshness compared to both reanalysis and climatology. Finally, the reanalysis data exhibited greater variability; however, finer-scale and localized variability was still not captured due to a lack of in situ data in those particular zones.
Discussion
These regattas have helped identify several key sub-Antarctic water masses, such as SASW, SAMW, SICW and SACW. Comparing SST and SSS anomalies across the regattas reveals notable inter-annual variability (Tables II & III). In general, higher temperatures were recorded in 2011 (BWR-2011), while lower temperatures were observed in 2020/2021 (VGR-2020/2021). This is probably due to VGR-2020/2021 taking place earlier in the summer, whereas the other two regattas occurred later in the season. Salinity differences between the years were less pronounced, but the freshest surface waters were observed in Drake Passage, during both the BWR-2011 and VGR-2020/2021, probably due to the influence of glacial meltwater from Patagonia (Umbert et al. Reference Umbert, Hoareau, Salat, Salvador, Guimbard, Olmedo and Gabarró2022).
Table III. Averages (Ave.) and standard deviations (Std.) for sea-surface temperature (SST) and sea-surface salinity (SSS) anomalies relative to World Ocean Atlas 2023 climatology for different ocean basins. We define the three ocean basins south of 40°S as follows: the Pacific sector (145°E to 70°W), the Indian sector (20°E to 145°E) and the Atlantic sector (70°W to 20°E).
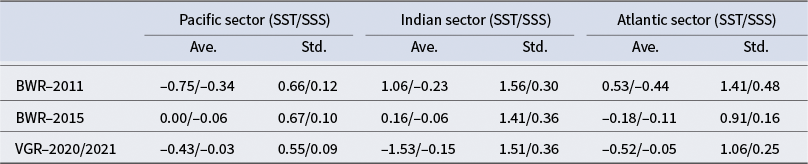
BWR = Barcelona World Race; VGR = Vendée Globe Race.
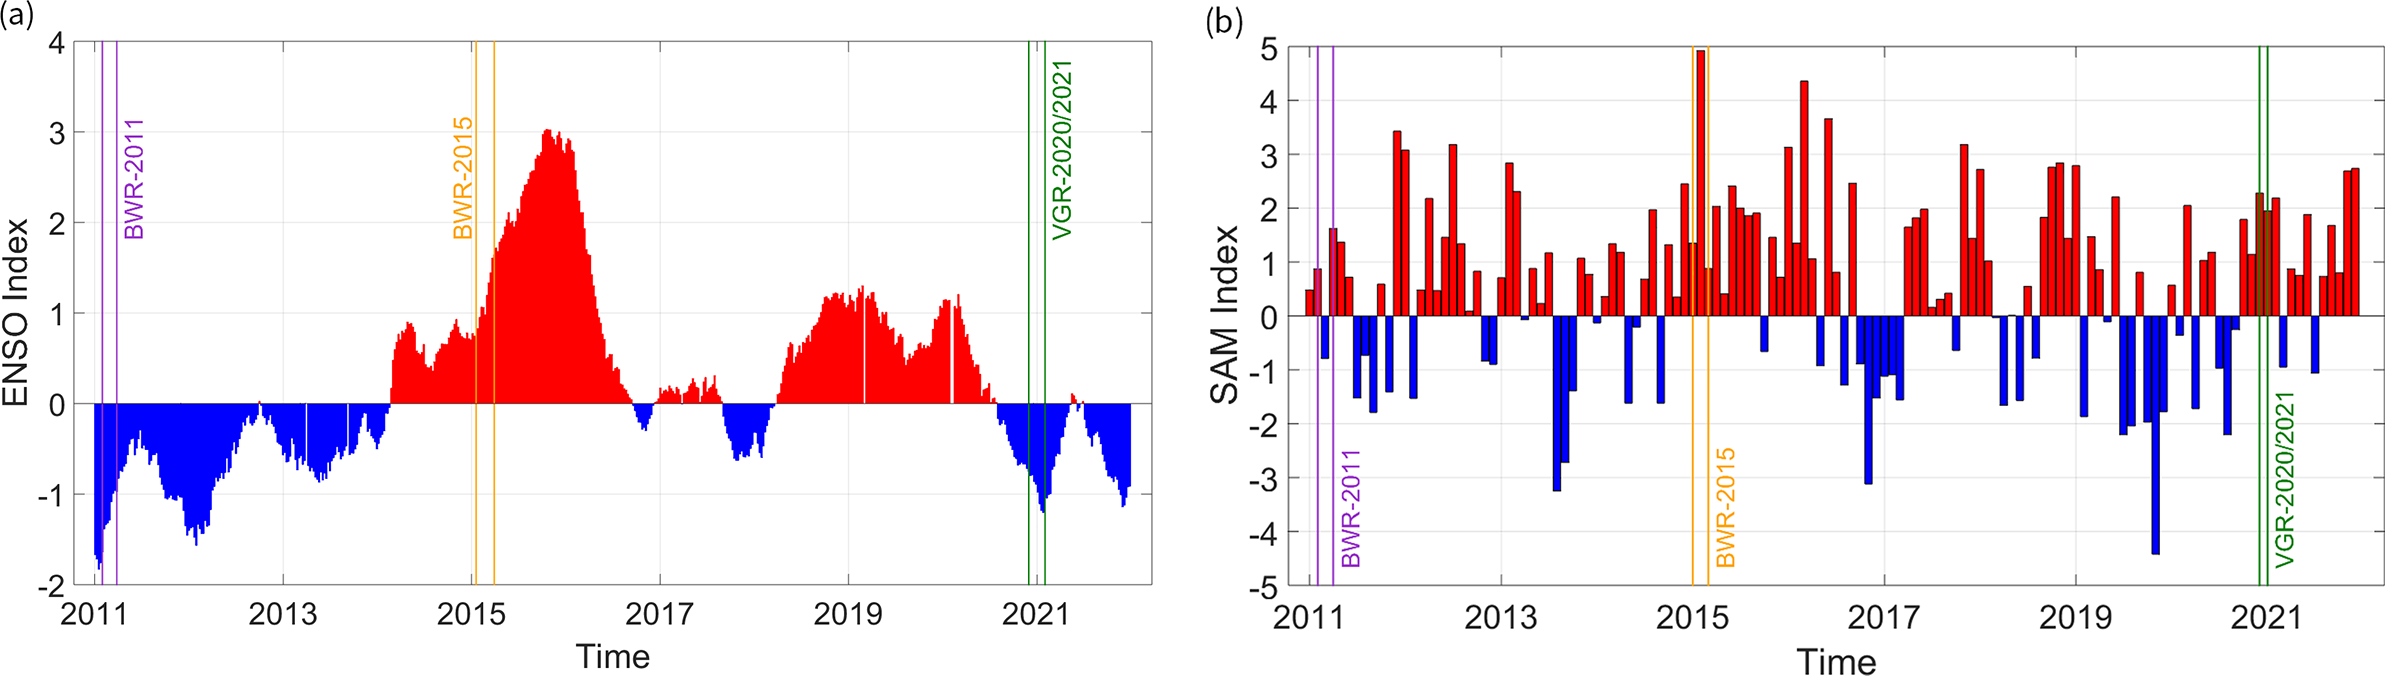
Figure 10. Time series of a. the El Niño-Southern Oscillation (ENSO) index (Hamlington et al. Reference Hamlington, Cheon, Piecuch, Karnauskas, Thompson and Kim2019) and b. the Southern Annular Mode (SAM) index (Marshall Reference Marshall2025) from 2011 to 2021; positive values are in red and negative values are in blue. The periods when the Barcelona World Race (BWR)-2011, the BWR-2015 and the Vendée Globe Race (VGR)-2020/2021 passed through the Southern Ocean are marked with coloured lines in purple, orange and green, respectively.
Across all three regattas, the Pacific sector consistently exhibited the lowest temperatures, while the highest temperatures were found in the Atlantic and Indian sectors. In 2015 and 2020/2021, warmer waters in the Indian sector were primarily observed in its south-western region, whereas BWR-2011, which followed a different trajectory in this sector, recorded notably higher temperatures near New Zealand. A similar spatial pattern was found in the salinity distribution.
Inter-annual variability in anomalies
The inter-annual variability, assessed through anomalies relative to WOA-23, shows a consistent pattern across the three regattas: temperature anomalies were predominantly positive, while salinity anomalies tended to be negative. The largest anomalies occurred in 2011, with widespread positive temperature anomalies and negative salinity anomalies along most of the trajectory. In 2015, temperature anomalies remained positive, while positive salinity anomalies were particularly notable in the Indian sector. In contrast, 2020/2021 exhibited a slight predominance of negative temperature anomalies in the Indian sector, coinciding with areas of positive salinity anomalies.
Across all three years, the Indian sector consistently showed the highest absolute values of both temperature and salinity anomalies, a pattern that was also evident in the Atlantic sector, particularly along the south-eastern coast of South America. In BWR-2011 and BWR-2015, positive temperature anomalies were strongest in the Indian sector, whereas in 2020/2021 negative temperature anomalies became more dominant. Notably, BWR-2011 displayed both highly negative salinity anomalies and strongly positive temperature anomalies in the Indian sector, indicating warmer and fresher conditions. This is consistent with other studies, where an increase in SSS was observed in the Indian Sector between 1993 and 2021 (Akhoudas et al. Reference Akhoudas, Sallée, Reverdin, Haumann, Pauthenet and Chapman2023). In contrast, 2015 showed no clear salinity anomaly pattern, while 2020/2021 had slightly negative salinity anomalies, probably influenced by the early summer timing of the race.
In addition to the Indian sector, high-temperature anomalies were consistently observed in the western sub-Atlantic sector across all three years. Both BWR-2011 and BWR-2015 exhibited strongly negative salinity anomalies in this region, while the Pacific sector consistently showed the lowest anomalies in both salinity and temperature.
Implications for climate variability
This analysis (Fig. 6 & Table III) reveals a significant correspondence between areas with the higher (or lower) temperature and salinity values and those with higher (or lower) anomalies. This correspondence suggests that warmer regions tend to further warm and fresher regions tend to become even fresher, reflecting regional hydrological changes over time. These findings align with other studies indicating a general trend of warming and freshening in the study area (Swart et al. Reference Swart, Gille, Fyfe and Gillet2018, Auger et al. Reference Auger, Morrow, Kestenare, Sallée and Cowley2021).
During BWR-2011, both climatology and reanalysis products showed systematically higher temperature and salinity values compared to in situ measurements. This discrepancy is probably due to the limited availability of in situ observations before 2014, when the number of Argo profilers below 40°S increased from 778 in 2011 to 846 in 2015 and 969 in 2021, which probably improved the representation of the sub-Antarctic Southern Ocean in climatology and reanalysis datasets.
Additionally, the overestimation of salinity relative to temperature observed in both climatology and the 2011 reanalysis, which decreased during 2015 and 2020, underscores the importance of expanding in situ observations to mitigate data gaps in future assessments. The unique dataset collected during the regattas offers valuable opportunities to refine and validate climate products in regions with limited observational coverage.
Finally, we assess whether the regattas coincided with significant climate events such as the ENSO and the SAM (Fig. 10). These large-scale climate modes have well-documented impacts on Southern Ocean circulation, temperature and salinity, which may explain some of the inter-annual differences observed in our study.
The ENSO influences the Antarctic climate through a dipole pattern, with two distinct centres of action: the Ross Sea (Pacific sector) and the Weddell Sea (Atlantic sector). During El Niño events, the Pacific sector centre typically experiences warmer SSTs and reduced sea-ice coverage, whereas the Atlantic sector shows the opposite response, with colder SSTs and increased sea-ice extent. The pattern reverses during La Niña events, with cooler SSTs in the Pacific sector and warmer conditions in the Atlantic sector.
The SAM index, on the other hand, modulates the strength and position of Southern Hemisphere westerlies. A positive SAM phase intensifies these westerlies, shifting them southwards, thereby enhancing Ekman transport, upwelling and surface salinity variations in the Southern Ocean (Talley et al. Reference Talley, Pickard, Emery and Swift2011).
The timing of the regattas aligns with key ENSO and SAM phases, which probably influenced our observations. BWR-2011 occurred during a La Niña event, while BWR-2015 coincided with an El Niño event, and VGR-2020/2021 took place during another La Niña episode (Hamlington et al. Reference Hamlington, Cheon, Piecuch, Karnauskas, Thompson and Kim2019, NOAA Physical Sciences Laboratory 2024). Notably, the 2015–2016 El Niño event was among the strongest recorded in the past 145 years (IPCC 2023).
Regarding the impact of the SAM on our observations, BWR-2015 and VGR-2020/2021 took place during periods of positive SAM indices, which are associated with stronger westerlies, enhanced upwelling and regional SST variations. In contrast, BWR-2011 coincided with both positive and negative SAM phases, which may have contributed to the greater variability observed in temperature and salinity anomalies during that regatta (Cheon & Gordon Reference Cheon and Gordon2019, Dirscherl et al. Reference Dirscherl, Dietz and Kuenzer2021, IPCC 2022, Marshall & National Center for Atmospheric Research Staff Reference Marshall2022, Marshall Reference Marshall2025).
The observed temperature anomalies support these climate influences. VGR-2020/2021 exhibited the lowest SSTs, consistent with expectations for La Niña conditions, which generally bring cooler temperatures to the Southern Ocean (Welhouse et al. Reference Welhouse, Lazzara, Keller, Tripoli and Hitchman2016, Ferster et al. Reference Ferster, Subrahmanyam and Macdonald2018). Additionally, our results show that the Pacific sector generally experienced lower temperatures, which aligns with the negative correlation between SST and SAM in this region: higher SAM indices correspond to cooler SSTs. Conversely, in the Atlantic sector, a positive correlation exists, meaning that higher SAM values tend to coincide with warmer SSTs (Lovenduski & Gruber Reference Lovenduski and Gruber2005, Ferster et al. Reference Ferster, Subrahmanyam and Macdonald2018). This pattern is also evident in the temperature anomalies observed, particularly along the south-eastern coast of South America.
Thus, our findings suggest that large-scale climate variability plays a crucial role in modulating regional SST and SSS patterns in the Southern Ocean. The data collected during these regattas provide valuable in situ evidence supporting the connection between the ENSO, the SAM and ocean variability, reinforcing previous studies while offering new insights into regional responses to climate forcing.
Conclusions
Leveraging data from round-the-world regatta races has proven to be an innovative and valuable approach, particularly in the data-scarce Southern Ocean, where traditional observational measurements are highly limited. These expeditions provided high-resolution and widespread coverage, enabling the tracking of distinct water masses and sea-surface thermohaline properties across the sub-Antarctic region. This unique dataset is crucial for assessing climate variability and understanding the mechanisms driving oceanic changes in one of the most vulnerable areas of the planet.
The inter-annual analyses of SST and SSS anomalies over the last decade reveal a persistent warming and freshening trend in the Southern Ocean. Notably, the Indian and Atlantic sectors exhibit the highest temperature and salinity anomalies, while the Pacific sector shows relatively lower values. This spatial variability suggests a regionally dependent response to global climate forcing, where areas with historically warmer conditions experience amplified temperature increases, whereas low-salinity regions show a persistent freshening trend over time. These trends are consistent with broader climate change projections, indicating a potential shift in the thermohaline structure of the Southern Ocean.
Furthermore, observations collected from an instrumented sailboat during BWR-2010/2011, BWR-2014/2015 and VGR-2020/2021 captured not only inter-annual variability but also key hydrodynamic patterns associated with large-scale climatic modes. In particular, our results show that during positive phases of the SAM, lower SST anomalies prevail in the Pacific sector, while south-eastern South America experiences pronounced warming. Additionally, La Niña events contribute to lower temperatures during early summer, highlighting the strong interaction between oceanic and atmospheric processes in the region.
These findings underscore the critical importance of sustained monitoring efforts in the Southern Ocean to better understand its role in global climate dynamics. The use of non-traditional observational platforms, such as instrumented racing yachts, has proven to be an effective strategy for complementing existing monitoring efforts. These data not only enhance our observational capacity but also provide novel insights into the variability and long-term changes in Antarctic and sub-Antarctic waters. Expanding these unconventional observational networks could significantly improve climate models and our understanding of ocean-atmosphere interactions in a rapidly changing climate.
Acknowledgements
We thank the Fundació per la Navegació Oceànica (FNOB), the crew members of the boats, Ludovic Aglaor, Gerard Marín, Aleix Gelabert and Dídac Costa, and their respective technical teams, as well as the sponsors of the boats: Fòrum Marítim Català, Pharmaton, IOC/UNESCO and the FNOB itself. Finally, thanks to Pedro Fernández and Kintxo Salvador, from the ICM-CSIC, for preparing and installing the sensors on the ships. We also acknowledge the UAR IMAGO for the TSGQC software support.
Financial support
N. Werner-Pelletier and M. Umbert are funded by the ERC-2024-StG FRESH-CARE (Grant Agreement: 101164517). This work is a contribution to the Conexión PolarCSIC and is supported by the Spanish Government through the ‘Severo Ochoa Centre of Excellence’ accreditation (CEX2019-000928-S).
Competing interests
The authors declare none.
Data availability
The in situ data from BWR-2015 are available at the following repository: https://doi.org/10.20350/digitalCSIC/16424. Regarding the WOA-2023 data (Reagan et al. Reference Reagan, Seidov, Wang, Dukhovskoy, Boyer and Locarnini2024, Locarnini et al. Reference Locarnini, Mishonov, Baranova, Reagan, Boyer and Seidov2024), the SST and SSS data are freely available at https://www.ncei.noaa.gov/access/world-ocean-atlas-2023/. The ARMOR-3D product (Guinehut Reference Guinehut2021) is also available upon request at https://data.marine.copernicus.eu/product/MULTIOBS_GLO_PHY_TSUV_3D_MYNRT_015_012/services. Finally, the SAM index data are available at https://legacy.bas.ac.uk/met/gjma/sam.html, and the ENSO index data are available at https://sealevel.jpl.nasa.gov/overlay-elnino/.
Author contributions
Conceptualization: MU, NH. Methodology: MH, MU, NH, AO-A. Data filtering: MH. Data visualization: MH, NW-P, MU, NH. Writing - original draft: MH, MU, AO-A. Revisions of the final draft: NW-P, MU, NH, AO-A, JS. All authors approved the final submitted draft.


 Open access