


Introduction
Deception Island (South Shetland Islands, Antarctica), located in the western Bransfield Strait, is one of the most active volcanoes in Antarctica, with several historical (1842, 1912, 1917) and recent eruptions (1967, 1969 and 1970; Smellie et al. Reference Smellie, López-Martínez, Headland, Hernández-Cifuentes, Maestro and Millar2002, Bartolini et al. Reference Bartolini, Geyer, Martí, Pedrazzi and Aguirre-Díaz2014). The island presents a horseshoe shape with an inner caldera forming a bay of ~15 km in diameter. A seismic tomography study imaged a magmatic chamber in the centre of the bay (Zandomeneghi et al. Reference Zandomeneghi, Barclay, Almendros, Ibáñez, Wilcock and Ben-Zvi2009). A study combining previous and new petrological and geochemical results has revealed the existence of a complex conduit system under the caldera (Martí et al. Reference Martí, Vila and Rey1996). This system was composed of several shallow magmatic chambers (≤ 10 km) that was fed by magmas rising directly from the mantle or from a magma accumulation zone located at the crust-mantle boundary (15–20 km depth; Geyer et al. Reference Geyer, Álvarez-Valero, Gisbert, Aulinas, Hernández-Barreña, Lobo and Marti2019).
Since 1994, the Andalusian Institute of Geophysics of the University of Granada (IAG-UGR) has studied the seismic activity and structure of the Deception Island volcano and the Bransfield Strait through several research projects (Almendros et al. Reference Almendros, Ibáñez, Alguacil, Del Pezzo and Ortiz1997, Reference Almendros, Ibáñez, Alguacil and Del Pezzo1999, Reference Almendros, Carmona and Ibáñez2004, Reference Almendros, Carmona, Jiménez-Morales, Díaz-Moreno and Lorenzo2018, Ibáñez et al. Reference Ibáñez, Morales, Alguacil, Almendros, Ortiz and Del Pezzo1997, Reference Ibáñez, Del Pezzo, Almendros, La Rocca, Alguacil, Ortiz and García2000, Reference Ibáñez, Almendros, Carmona, Martínez-Arévalo and Abril2003a,Reference Ibáñez, Carmona, Almendros, Saccorotti, Del Pezzo, Abril and Ortizb, Alguacil et al. Reference Alguacil, Almendros, Del Pezzo, García, Ibáñez and La Rocca1999, Saccorotti et al. Reference Saccorotti, Almendros, Carmona, Ibañez and Del Pezzo2001, Martínez-Arévalo et al. Reference Martínez-Arévalo, Bianco, Ibáñez and Del Pezzo2003, Benítez et al. Reference Benítez, Ramírez, Segura, Ibáñez, Almendros, García-Yeguas and Cortés2007, Carmona et al. Reference Carmona, Almendros, Peña and Ibáñez2010, Reference Carmona, Almendros, Martín, Serrano, Stich and Ibáñez2012, Reference Bartolini, Geyer, Martí, Pedrazzi and Aguirre-Díaz2014, Stich et al. Reference Stich, Almendros, Jiménez, Mancilla and Carmona2011). The TOMODEC project was conducted to obtain a 3D tomographic image of the velocity structure of the Deception Island volcano (Zandomeneghi et al. Reference Zandomeneghi, Barclay, Almendros, Ibáñez, Wilcock and Ben-Zvi2009, García-Yeguas et al. Reference García-Yeguas, Almendros, Abella and Ibáñez2011, Luzón et al. Reference Luzón, Almendros and García-Jerez2011, Prudencio et al. Reference Prudencio, Ibáñez, García-Yeguas, Del Pezzo and Posadas2013, Reference Prudencio, De Siena, Ibáñez, Del Pezzo, García-Yeguas and Díaz-Moreno2015, Ibáñez et al. Reference Ibáñez, Díaz-Moreno, Prudencio, Zandomeneghi, Wilcock and Barclay2017), and later, the CORSHET project deployed three permanent stations for seismic monitoring of the Bransfield Strait (Jiménez-Morales et al. Reference Jiménez-Morales, Almendros and Carmona2017, Reference Jiménez-Morales, Almendros and Carmona2022). In addition, the BRAVOSEIS project, through the deployment of a seismic network, studied the structure of submarine volcanoes in the central Bransfield Strait basin and their relationship to the geodynamics of the area (Almendros et al. Reference Almendros, Wilcock, Soule, Teixidó, Vizcaíno and Ardanaz2020, Moreno-Vacas & Almendros Reference Moreno-Vacas and Almendros2021, Parera-Portell et al. Reference Parera-Portell, Mancilla, Almendros, Morales and Stich2023). Numerous geophysical studies have been conducted on the Deception Island volcano, including geochemical, petrological, deformation and palaeostress analyses. Palaeostress analyses show subaerial and submarine macrofaults on Deception Island, indicating six main systems controlling the morphology of the island: N-S, NNE-SSW, NE-SW, ENE-WSW to E-W, WNW-ESE and NNW-SSE. This trend is coincident with geochemical patterns related to submarine hydrothermally influenced fault and fissure pathways (Maestro et al. Reference Maestro, Somoza, Rey, Martínez-Frías and López-Martínez2007). The three most important faults of this system are parallel to the most recent eruptions: 1) the NW-SE extensional regime, from Punta Murature to Telephone Bay and related to the 1967 and 1970 eruptions, 2) the E-W system aligned to Kirkwood Mount and related to the 1842 eruption (this alignment is also coincident to the direction of the submarine cone line inside the caldera) and 3) the third fault system with a NNW-SSE trend that seems coincident to the Costa Recta alignment (Fernández-Ibáñez et al. Reference Fernández-Ibáñez, Pérez-López, Martínez-Díaz, Paredes, Giner-Robles, Caselli and Ibáñez2005), the Pond Mount fault system and the 1969 eruption fissures (Fig. 1; Rey et al. Reference Rey, Somoza and Martínez-Frías1995). After these eruptions, four episodes of volcanic reactivation have occurred on Deception Island: in 1992 (Ortiz et al. Reference Ortiz, García, Aparicio, Blanco, Felpeto, Del Rey and Ricci1997), 1999 (Ibáñez et al. Reference Ibáñez, Carmona, Almendros, Saccorotti, Del Pezzo, Abril and Ortiz2003b), 2015 (Almendros et al. Reference Almendros, Carmona, Jiménez-Morales, Díaz-Moreno and Lorenzo2018) and 2020 (Carmona et al. Reference Carmona, De Gil, Jiménez-Morales, Rosado, Serrano and Fernández-Ros2024).
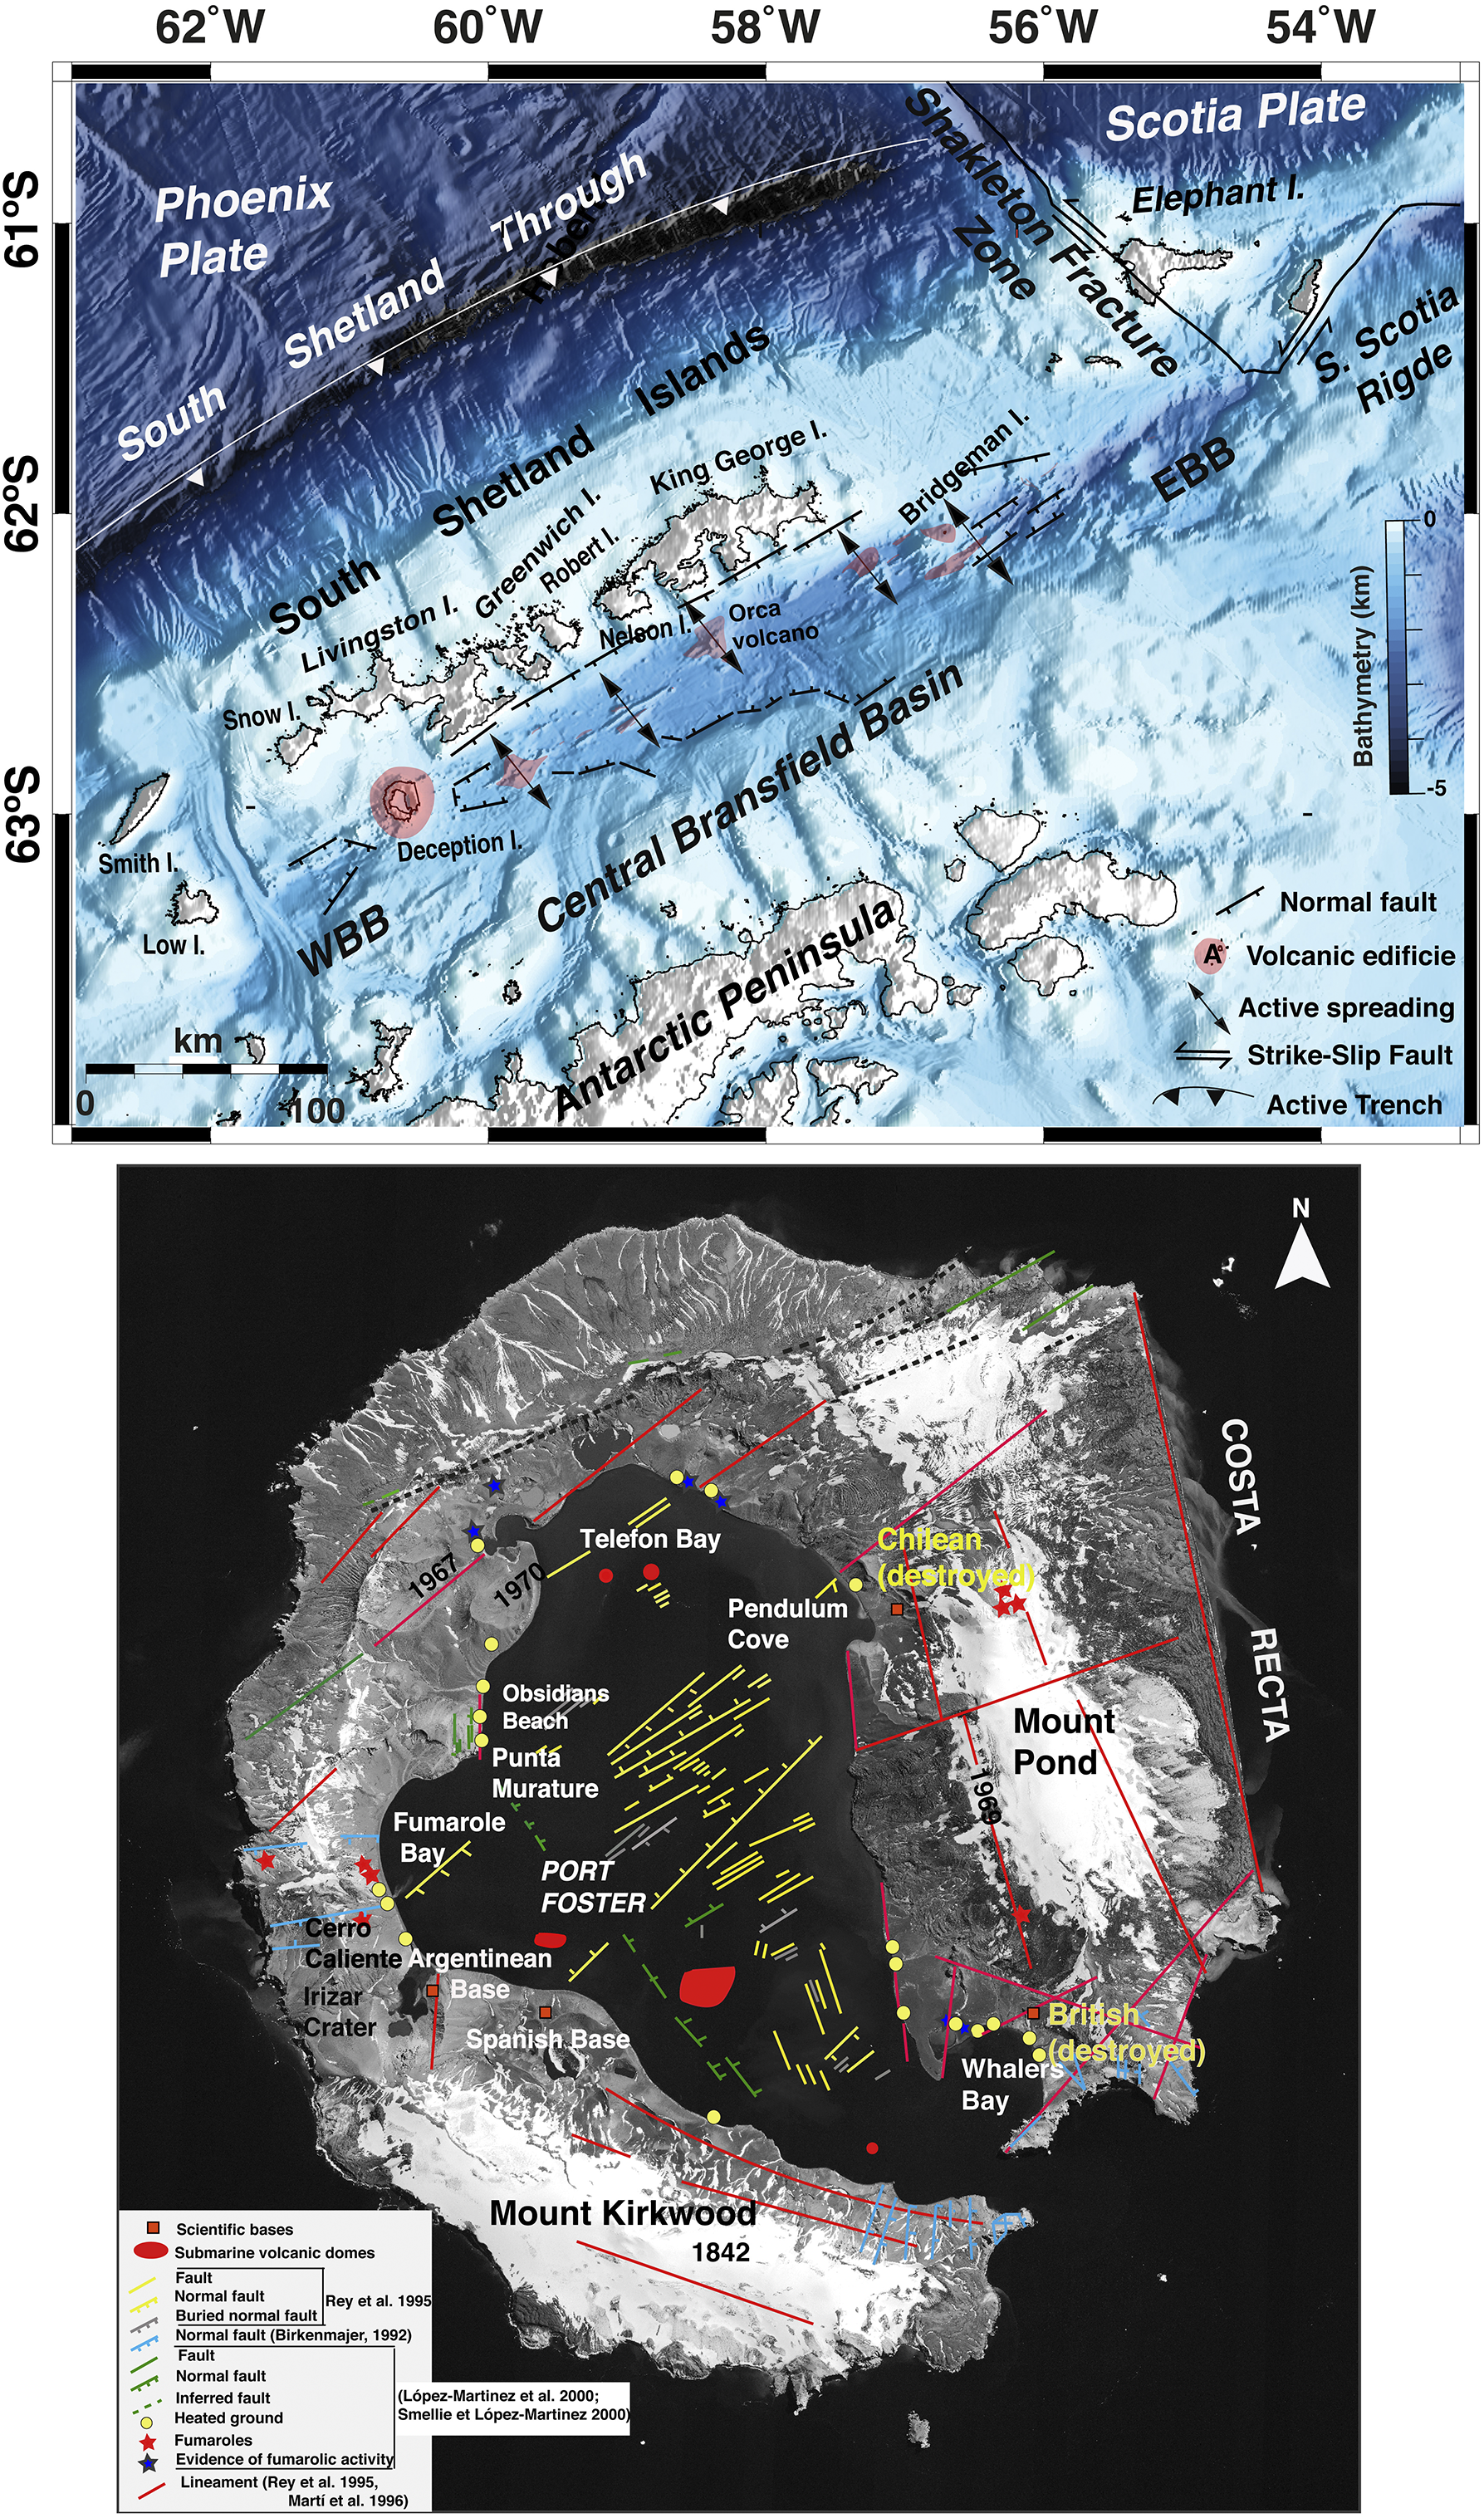
Figure 1. (Top) Simplified regional tectonic map and location of the South Shetland Islands with the main tectonic and volcanic features compiled from Gràcia et al. (Reference Gràcia, Canals, Lí Farràn, Prieto, Sorribas and Team1996). EBB = East Bransfield Basin; FZ = Fracture Zone; WBB = West Bransfield Basin. (Bottom) Deception Island orthophotomap (data obtained from Spatial Data Infrastructure for Deception Island (SIMAC); Torrecillas et al. Reference Torrecillas, Berrocoso, García-García, Fütterer, Damaske, Kleinschmidt, Miller and Tessensohn2006) with main system faults and volcanic features compiled from Maestro et al. (Reference Maestro, Somoza, Rey, Martínez-Frías and López-Martínez2007).
The results of deformation studies have shown that, after the 1999 seismic crisis, the island underwent a change in elevation and extension, leading to a deflation process in the north and north-east of the island. These results demonstrated that the origin of the surface deformation was in the inner bay of the island, in front of the Obsidianas Beach (OBS; Berrocoso et al. Reference Berrocoso, García-García, Martín-Dávila, Catalán-Morollón, Astiz, Ramírez, Damaske, Kleinschmidt, Miller and Tessensohn2006, Reference Berrocoso, Fernández-Ros, Prates, García and Kraus2016). Rosado et al. (Reference Rosado, Fernández-Ros, Berrocoso, Prates, Gárate, De Gil and Geyer2019) analysed the time series of GPS observations from 1991 to 2018 and suggested that periods of high seismic activity at the Deception Island volcano are preceded by inflation phases, as indicated by the measured extension and uplift in the geodetic network, and followed by deflation phases.
Geochemical gas measurements obtained after the 1999 seismic crisis and the high seismic activity during the 2003–2004 survey revealed an increase in sulphur dioxide in Fumarole Bay (FUM; Caselli et al. Reference Caselli, Santos-Afonso and Agusto2004). This increase seems to be related to the presence of dykes in near-surface layers. These dykes caused the formation of layers of sulphur and iron deposits in the fumarole systems of the bay.
Deception Island is one of the most visited volcanos of Antarctica, with two scientific bases operating during the summer, and it is among the most active volcanoes in Antarctica, having experienced over 15 explosive eruptions in the last 200 years and recent eruptions in 1967, 1969 and 1970 (Geyer et al. Reference Geyer, Pedrazzi, Almendros, Berrocoso, López-martínez, Maestro, Smellie, Panter and Geyer2021). Observations from past eruptions indicate that hydrovolcanic activity is the primary cause of volcanic hazards on Deception Island (Pedrazzi et al. Reference Pedrazzi, Németh, Geyer, Álvarez-Valero, Aguirre-Díaz and Bartolini2018). Recently, Bartolini et al. (Reference Bartolini, Geyer, Martí, Pedrazzi and Aguirre-Díaz2014) provided a volcanic hazard map in which they estimated the probability that different areas could be invaded by lava flows, or lahars. Its recent eruptions and the current presence of volcanic activity render the continuous surveillance of its seismicity necessary.
Volcanic seismicity is considered one of the best geophysical tools for monitoring active volcanoes (Aki & Ferrazzini Reference Aki and Ferrazzini2000, Senyukov et al. Reference Senyukov2012). In order to monitor seismic movements, it is necessary to identify and characterize recorded signals and therefore differentiate between events caused by regional or local tectonic activity and those caused by volcanic processes.
For Deception Island, regional seismic activity is triggered by the dynamics within the Bransfield Strait, involving a process of extension, related to the opening of the Bransfield Strait basin (Barker et al. Reference Barker, Dalziel and Storey1991 ), an active subduction beneath the South Shetland Islands (Maestro et al. Reference Maestro, Somoza, Rey, Martínez-Frías and López-Martínez2007) and the left-lateral displacement of the Scotia and Antarctic plates along the transtensional fault zone that extends along the South Scotia Ridge (e.g. Galindo-Zaldívar et al. Reference Galindo-Zaldívar, Gamboa, Maldonado, Nakao and Bochu2004 ). Most of these earthquakes in the region are shallow, generally at below 40 km depth, which is related to the rifting process and subduction of the Drake Plate below the Antarctic Plate (Fig. 1; Pelayo & Wiens Reference Pelayo and Wiens1989).
In this work, we present a review of the seismo-volcanic activity detected and analysed at the Deception Island volcano during the 2011–2022 summer surveys.
Volcanic seismicity
Local seismicity on Deception Island can be classified according to its origin: those of tectonic origin (volcanic-tectonic (VT) events) and those of fluid-driven origin (long-period (LP) seismicity). In addition to these two types, we found seismic activity related to the dynamics of the glaciers and permafrost on the island (Carmona et al. Reference Carmona, Almendros, Martín, Serrano, Stich and Ibáñez2012).
VT events are earthquakes in response to changes in the stress states of a medium. These events have a large spectral content, not necessarily of magmatic origin, and are generated within the volcanic edifice of Deception Island (Fig. 2). The waveform is characteristic, with clear arrivals of the primary (P) and secondary (S) waves, followed by a final decay in the form of a decreasing exponential, called a ‘coda’. This type of signal can arise individually or in groups of seismic swarms due to instability in the fault systems of volcanic zones (Ibáñez et al. Reference Ibáñez, Carmona, Almendros, Saccorotti, Del Pezzo, Abril and Ortiz2003b, Carmona et al. Reference Carmona, Almendros, Martín, Serrano, Stich and Ibáñez2012).
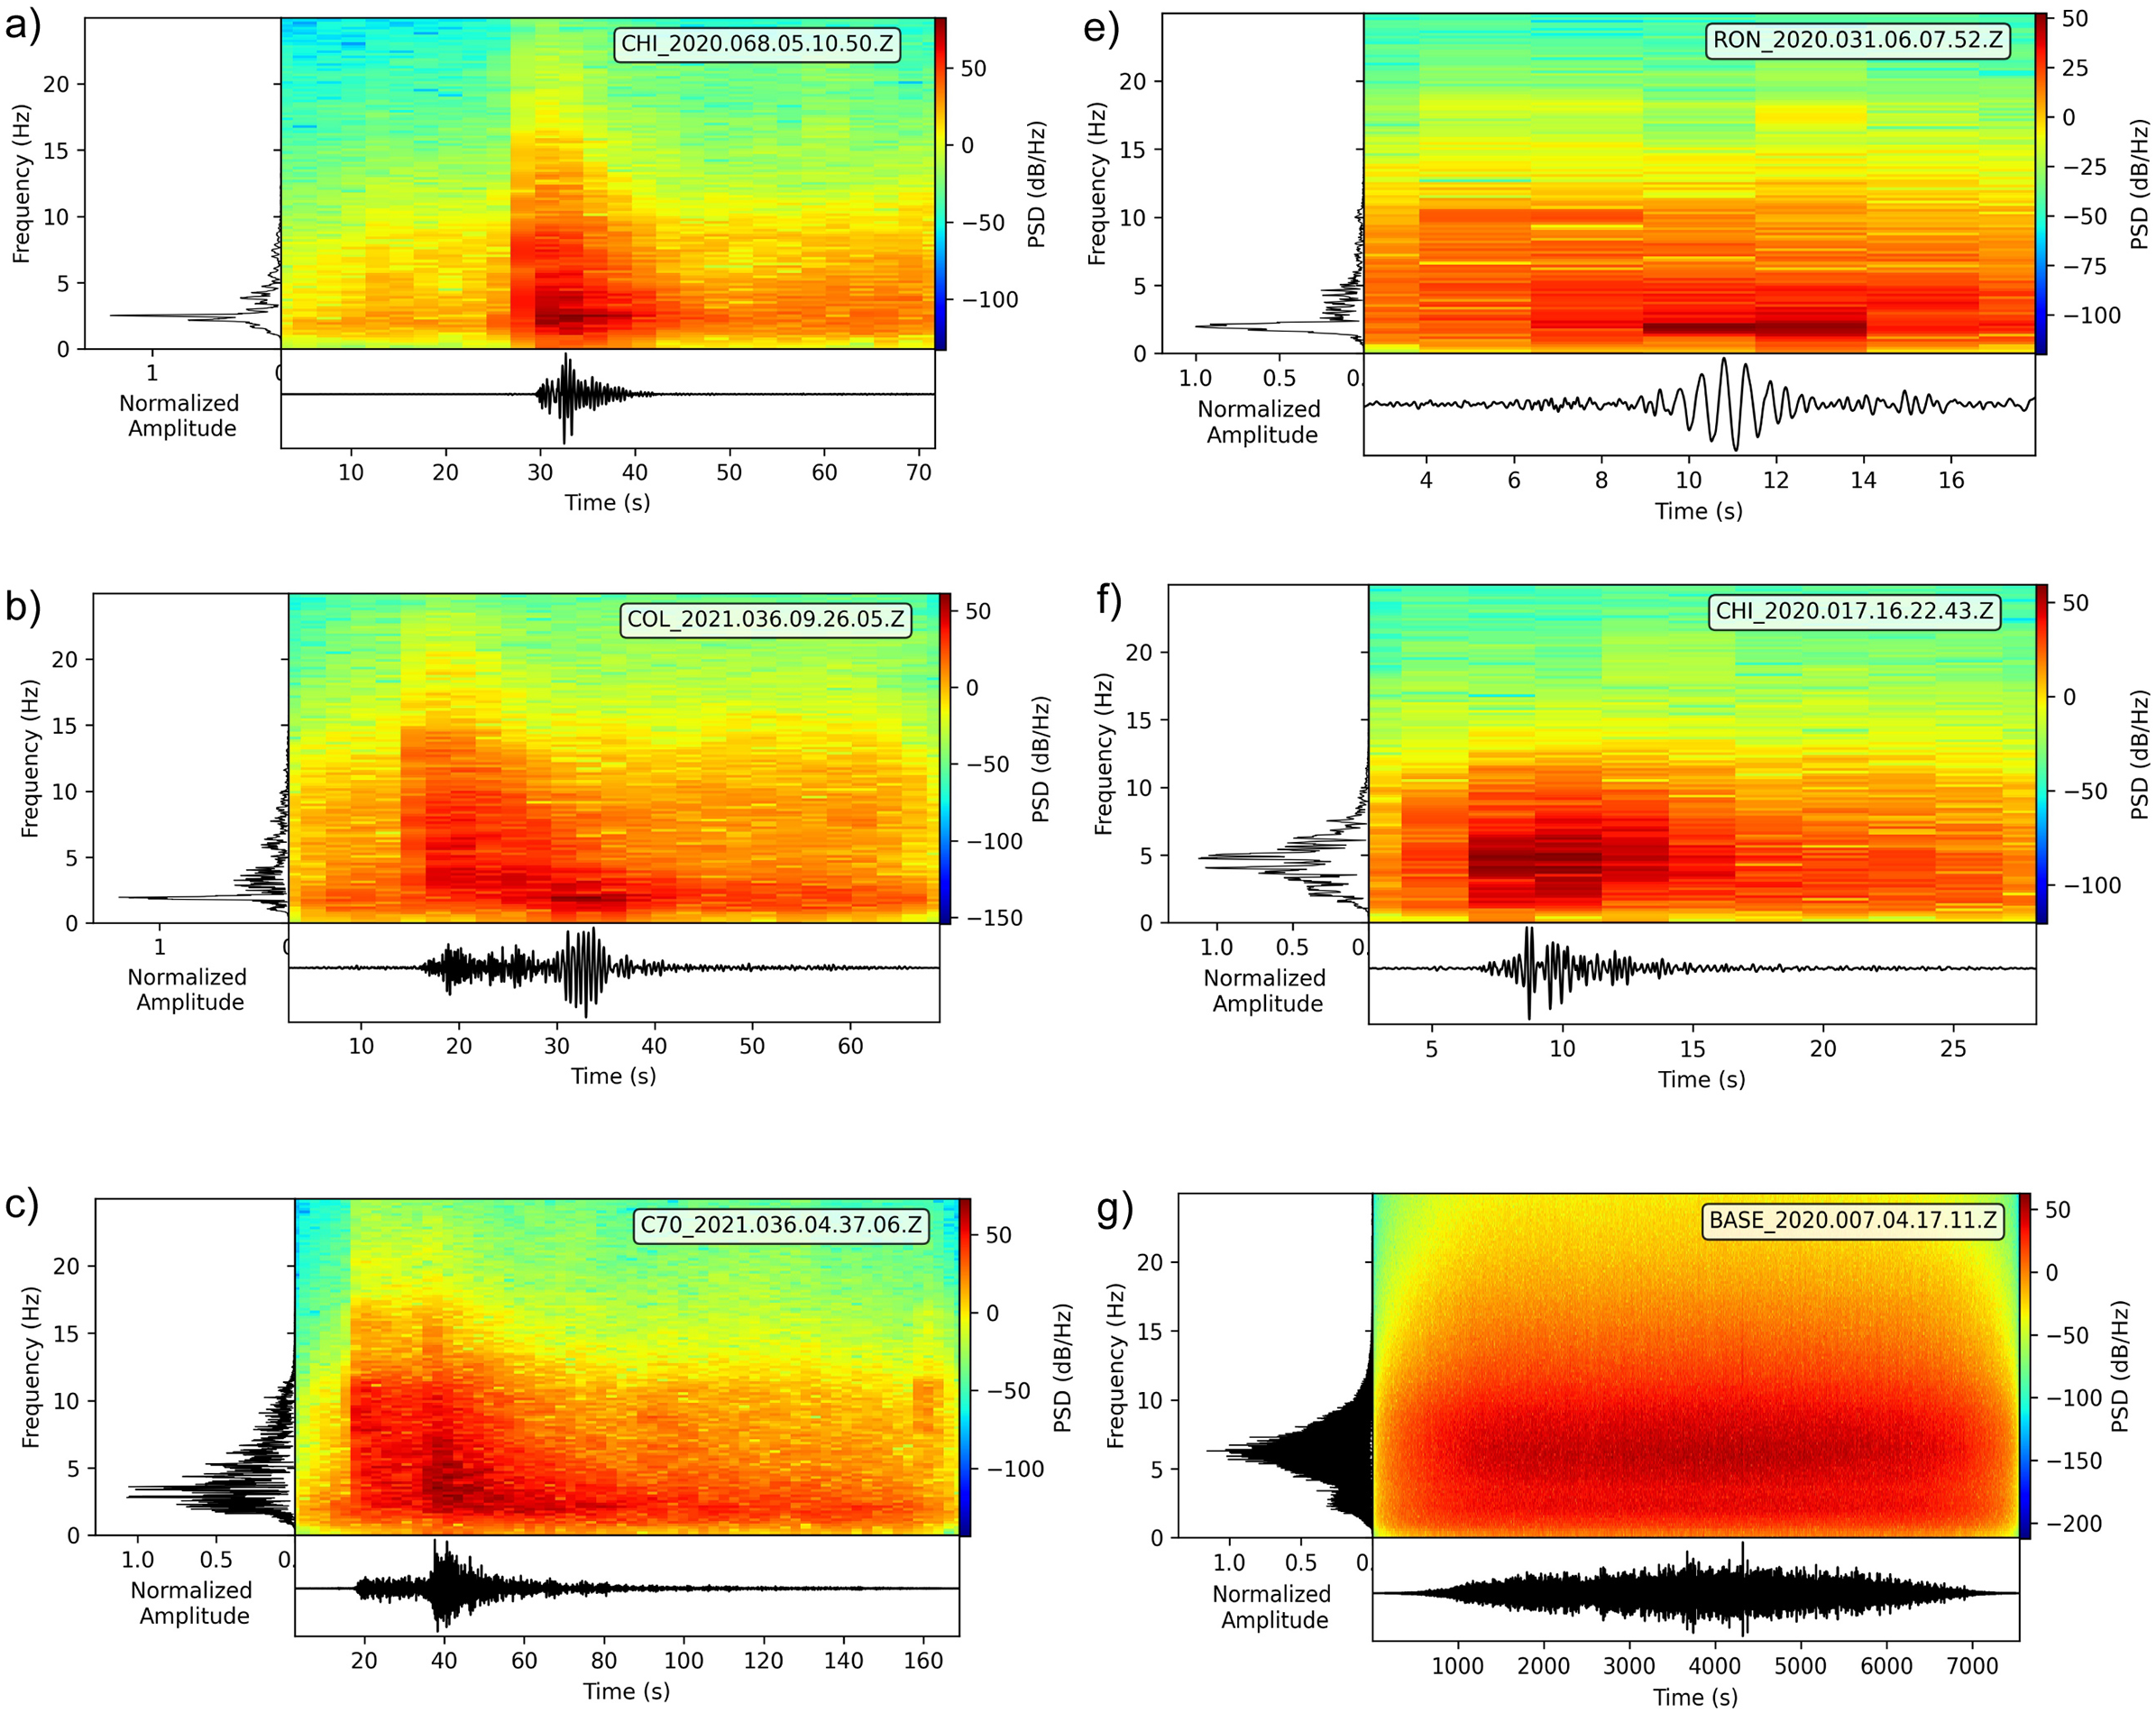
Figure 2. Examples of seismic signals recorded at Deception Island volcano: a. volcanic-tectonic earthquake, b. hybrid event, c. regional earthquake, d. long-period event, e. high-frequency long-period event and f. tremor episode. The images are of 2–10 Hz bandpass-filtered vertical-component seismograms, with the corresponding power spectral density (PSD) on the top along the normalized amplitude (arbitrary units) of the frequencies to the left. The legend in the PSD plot indicates the station name, Julian calendar day and start time of the signal.
VT earthquakes can occur at different depths, from several tens of kilometres to the surface of a volcano. The spatial distribution can be centred around a conduit or dispersed throughout the volcanic system. In certain volcanoes, VT seismic swarms may be related to magma intrusion or the reactivation of tectonic faults in the volcanic system, but this does not necessarily mean that the volcano will erupt (Ibáñez et al. Reference Ibáñez, Carmona, Almendros, Saccorotti, Del Pezzo, Abril and Ortiz2003b). In some volcanoes, eruption occurs without significant increases in seismic activity (Beniot & McNutt 1996). However, an increase in VT events remains one of the major indicators of volcanic reactivation (Mezcua & Rueda Reference Mezcua and Rueda2023 ), and these were always present in the volcanic crises on Deception Island (Ortiz et al. Reference Ortiz, García, Aparicio, Blanco, Felpeto, Del Rey and Ricci1997, Ibáñez et al. Reference Ibáñez, Carmona, Almendros, Saccorotti, Del Pezzo, Abril and Ortiz2003b, Carmona et al. Reference Carmona, Almendros, Martín, Serrano, Stich and Ibáñez2012, Almendros et al. Reference Almendros, Carmona, Jiménez-Morales, Díaz-Moreno and Lorenzo2018).
There are also LP events on Deception Island (Chouet Reference Chouet1996, Reference Chouet2003). They do not come from tectonic plate movements but rather from internal activity in the volcano and its fluids. In this group are included LP events, high-frequency LP (HLP) events, harmonic tremors (HTRs), non-harmonic tremors (TRs) and hybrid (HB) events (Fig. 2; Ibañez & Carmona Reference Ibáñez, Carmona, Astiz and Garcia2000, Ibáñez et al. Reference Ibáñez, Almendros, Carmona, Martínez-Arévalo and Abril2003a,Reference Ibáñez, Almendros, Carmona, Martínez-Arévalo and Abrilb, Jiménez-Morales et al. Reference Jiménez-Morales, Almendros and Carmona2022 ).
LP events are typical signs of volcanic environments and are found in most active volcanoes around the world. They are usually related to the presence of fluids, occurring individually but also often as seismic swarms. In some volcanoes, the presence of swarms may indicate a possible eruption, but this is not always the case, as has been observed for VT earthquakes (Chouet Reference Chouet1996).
LP events typically last for several seconds to 1 min. The frequency content of this signal can vary between different volcanoes and even within the same volcano, but it generally tends to be monochromatic, below 4 Hz (LP) and occasionally above that frequency (HLP). The most widely used model for such events is the ‘fluid-controlled fracture model’ proposed by Chouet in 1996. This model involves filling cracks or fractures with fluids that have experienced imbalances. Pressure would build up in these fractures, leading to disturbance. The frequency and shape of a wave are determined by the geometry of the resonance cavity, the type of excitation and the characteristics of the fluids (Kumagai & Chouet Reference Kumagai and Chouet2000).
In the Deception Island volcanic edifice, the presence of fluids and fumaroles made LP events the most numerous during Antarctic surveys compared to other types of activity. Because these events are always present and occur in large numbers in most surveys, they have not been taken into account, unlike VT events, regarding increasing the alert level for volcanic reactivation, as occurred during two of the seismic crises on the island (Ibáñez et al. Reference Ibáñez, Almendros, Carmona, Martínez-Arévalo and Abril2003a, Almendros et al. Reference Almendros, Carmona, Jiménez-Morales, Díaz-Moreno and Lorenzo2018).
The tremors recorded on Deception Island usually exhibit narrow-band signals in the frequency range of 1–4 Hz, characterized by low amplitudes and durations of less than a few hours (Fig. 2; Vila et al. Reference Vila, Martí, Ortiz, García and Correig1992, Jiménez-Morales et al. Reference Jiménez-Morales, Almendros and Carmona2022). We additionally noted multiple spasmodic tremors with energy distributed across various frequency bands (Vila et al. Reference Vila, Martí, Ortiz, García and Correig1992, Almendros et al. Reference Almendros, Ibáñez, Alguacil, Del Pezzo and Ortiz1997, Ibáñez et al. Reference Ibáñez, Almendros, Carmona, Martínez-Arévalo and Abril2003a, Carmona et al. Reference Carmona, Almendros, Martín, Serrano, Stich and Ibáñez2012) or tremors referred to as Deception long-duration signals (DLDSs) that can endure for long durations, ranging from a few hours to several days (Jiménez-Morales et al. Reference Jiménez-Morales, Almendros and Carmona2017).
HB events are characterized by the arrival of high-frequency waves, similar to those of VT earthquakes, where the P and S phases can be distinguished, as well as later arrivals of low-frequency monochromatic waves, similar to LP events (Fig. 2). In the low-frequency region, fluid resonance originates from fault rupture in the HB events, similar to LP events (Carmona et al. Reference Carmona, Almendros, Martín, Serrano, Stich and Ibáñez2012).
The presence of glaciers and permafrost on Deception Island means that seismic events called ‘icequakes’ (IQ) are generated (Fig. 2). IQ events are triggered by glacier dynamics, by ice slides and falls or by glacier movement itself. They usually have a wide frequency spectrum and can last from seconds to minutes. Those short signals lasting just 1 s with high frequencies above 20 Hz come from small fractures in the glaciers, rock falls at the front of the glacier or microcracks in the permafrost (Walter et al. Reference Walter, Deichmann and Funk2008). In previous studies analysing the seismic activity of Deception Island, these types of signals were called impulsive (IP) events (Ibáñez & Carmona Reference Ibáñez, Del Pezzo, Almendros, La Rocca, Alguacil, Ortiz and García2000, Carmona et al. Reference Carmona, Almendros, Martín, Serrano, Stich and Ibáñez2012) or short-period (SP) events (Jiménez-Morales et al. Reference Jiménez-Morales, Almendros and Carmona2022). This type of activity is not related to the dynamics of the volcano, but it is important to consider it when studying the glacial dynamics of the island.
The Deception Seismic Network
During the 1994–2022 surveys, the instrumentation deployed for seismic monitoring of Deception Island was composed of a seismic network of autonomous stations distributed along the inner bay together with the installation of a seismic antenna. The instrumentation has been enhanced from 1994 to 2022, leading to an update of the seismic stations. Furthermore, the spatial coverage of the network was improved by adding new stations and increasing the resolution of the analogue-to-digital converter of the seismic antennas.
Considerable advances have been made in the type of sensors used. Mark L28 sensors with a 4.5 Hz response and Mark L4C sensors with a natural frequency of 1 Hz (Havskov & Alguacil Reference Havskov and Alguacil2016) were used up to the end of the 1990s, and these were upgraded to short-period sensors and broadband sensors from 2000 to 2022.
In 2008, for the International Year of Geophysics, three permanent broadband stations were installed on Deception Island, Livingston Island and Caleta Cierva (Antarctic Peninsula). Each station was equipped with an electrochemical, three-component, broadband (16 s) seismometer (Eentec SP400) and a low-power, 24-bit datalogger (Eentec DR4000) powered by batteries and solar panels (Carmona et al. Reference Carmona, Almendros, Martín, Cortés, Alguacil and Moreno2014). These stations recorded without interruption during all those years and made available continuous recording data for the first time during the winter, providing information on the seismic activity of the Bransfield Strait and Deception island volcano even when the Spanish Antarctic bases were closed (Jimenez-Morales et al. Reference Jiménez-Morales, Almendros and Carmona2017).
From 2008 to 2022, most surveys used three-component Lennartz 3D/5s and SARA SS20 sensors with extended responses to 1 s connected to SARA SR04 digitizers with 24 bit resolution and a sampling rate of 100 sps. These systems were recording in almost every survey, except for one, in which 120 s Trillium Posthole sensors and a Centaur digitizer were installed, both produced by Nanometrics.
Data acquisition and transmission occurred within three essential stages. Before the 2000–2001 survey, data were manually gathered on field computers that maintained the information in the same location as the acquisition system at each autonomous station.
From this survey, it decided to deploy autonomous stations with one vertical component sensor to facilitate data transmission via radiofrequency. Real-time data were obtained from three main locations on the island (OBS, 70s Craters Beach (C70) and Chilean Refuge (CHI) to the BAE scientific module (BAE)). This marked the start of the Deception Seismic Network (DSN; Fig. 3). This stage occurred during the 2008–2009 survey, when transmission data via Wi-Fi was introduced, until its full implementation in the 2019–2010 survey. Monitoring stations sent real-time data by seedlink protocol to a SEICOMP system (GFZ 2008) installed in the BAE scientific module, which enhanced the quality of acquisition data and volcanic monitoring.
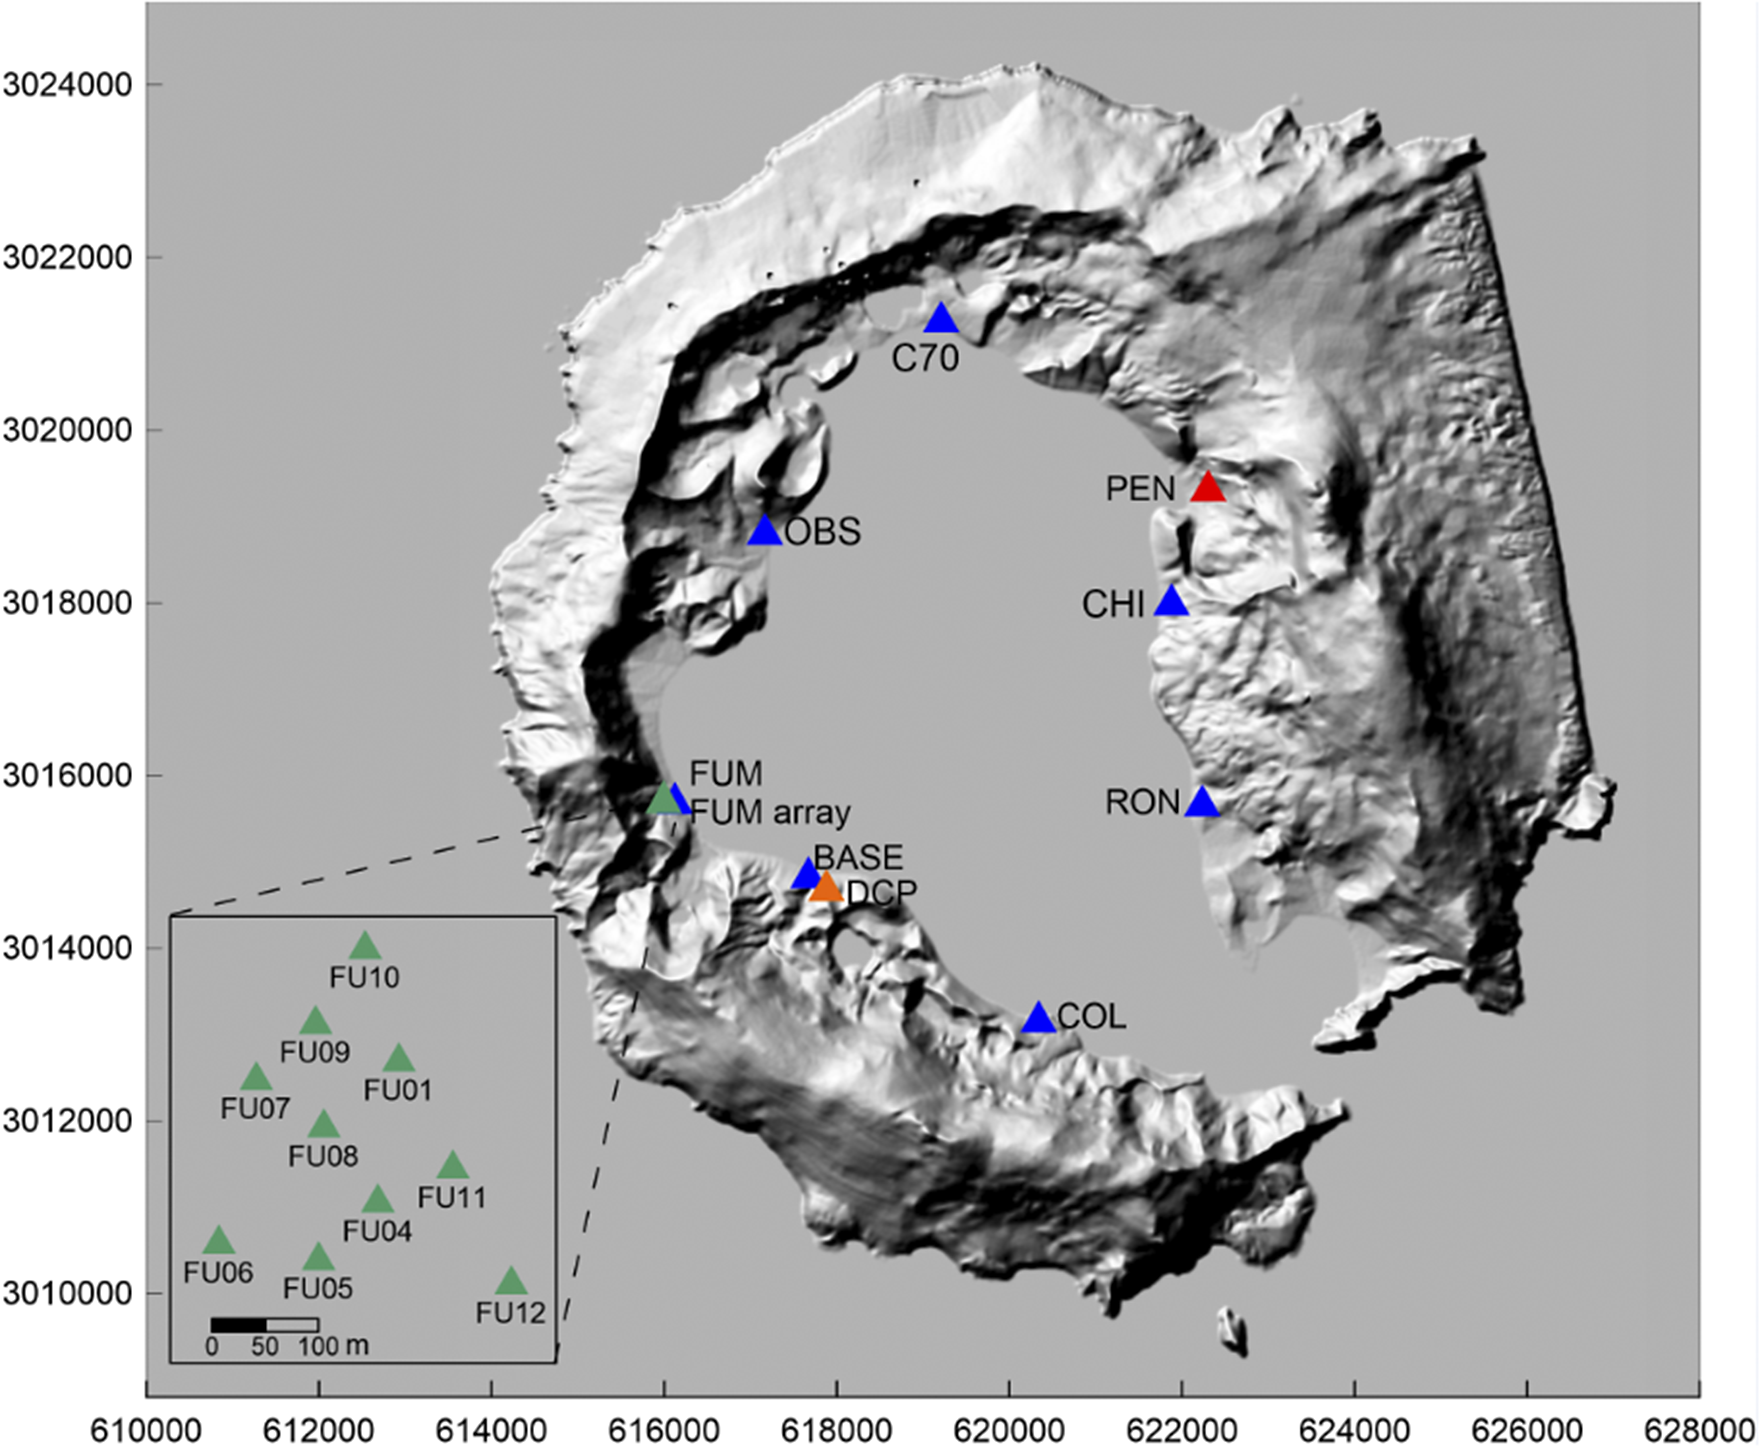
Figure 3. Shaded relief map of Deception Island. Blue triangles show the seismic network (BASE, FUM, OBS, C70, CHI, RON, COL); the red triangle shows the temporary PEN station; green triangles show the FUM seismic array; and the orange triangle shows permanent DCP station, operating since 2008. See main text for abbreviations.
Seismic antennas were installed in all surveys since 1994. The network locations and stations have remained consistent, ensuring continuous data collection. The most frequent installation location was south of FUM. Seismic arrays can be used independently to locate VT events in order to complement the DSN and, more importantly, to estimate the azimuth apparent slowness vector and apparent velocity of LP seismicity. From the 1999–2003 surveys, the recording systems used for the seismic arrays had a resolution of 16 bits, 8 channels and a sampling rate of 200 sps, and they recorded data by triggering (Ibáñez et al. Reference Ibáñez, Carmona, Almendros, Saccorotti, Del Pezzo, Abril and Ortiz2003b, Almendros et al. Reference Almendros, Carmona and Ibáñez2004 , Carmona et al. Reference Carmona, Almendros, Martín, Serrano, Stich and Ibáñez2012). In the 2003–2004 survey, a new digitizer for the seismic array was developed at the IAG-UGR with a 24 bit A/D converter, a sampling rate of 100 sps, 12 channels and continuous recording of data (Abril Reference Abril2007). Continuous recording of seismic activity is an invaluable resource for developing effective volcano monitoring protocols and enhancing the detection of low-amplitude signals linked to magmatic processes such as TRs or LP events.
The timeline for the installation of the temporary DSN depended on the opening of the Gabriel de Castilla Spanish Antarctic base (BASE). This has always taken place in the summer, generally starting in December and ending at March’s end of the following year. The number of deployed stations in the DSN has been increasing during the various surveys depending on equipment and logistical availability. Since the two seismic arrays in the first surveys, one of them installed near BASE and the other in the southern area of FUM, a total of seven seismic stations and one seismic array have been installed in the areas with relevant seismic activity in such a way that better coverage of the entire volcano is achieved. In the first stage, these stations were installed in OBS, C70 and CHI. Early in the 2016–2017 survey, a seismic station was installed in Cerro Ronald (RON) to improve the coverage to the north-east of the island, near Whalers Bay. Later, in the 2019–2020 survey, a new seismic station was installed in Colatinas (COL) to improve the spatial coverage of the southern area of island (Fig. 3). Finally, the DSN was composed of seven autonomous stations with three channels and half-band sensors, transmitting seismic data in real time by Wi-Fi antenna (Table I).
Table I. Instrumentations during the 2011–2022 surveys.

AR = Seismic Array 12 channel. Seismic stations: BASE = Gabriel de Castilla base; C70 = 70s Craters Beach; CHI = Chilean Refuge; COL = Colatinas; FUM = Fumarole Bay; OBS = Obsidianas Beach; PEN = Pendulo; RON = Cerro Ronald. Sensors: BB = Trillium Posthole/120s; EE = Eentec SP400/16s; L4 = Mark L4C/1s; LE = Lennartz LE-3D/5s; SA = Sara SS20/2s; SP = Mark L28/1s. Data transmission: Loc = local data logger; Wi = Wi-Fi.
For the seismic monitoring of Deception Island, an analysis is needed to know 1) the numerical and temporal distribution of the events, 2) the characteristics of the waveforms (amplitude, duration, phase arrivals, etc.) and their spectral content, 3) the origin of the earthquakes to distinguish between volcanic and tectonic events, 4) the type of event (VT, LP, HB), 5) the frequency content, intensity and duration of the volcanic tremor and 6) the source parameters (size, time of origin and hypocentral location). For this analysis of seismic activity, several types of software have been used to manage, evaluate, classify and locate seismic events.
For the acquisition, SeisComP was used. It is a software for seismology that has been developed by the GEOFON programme (GFZ, Potsdam, Germany). The SeisComP3 package used in the campaigns consists mainly of packages such as SeedLink for real-time data acquisition, ArcLink for fast access to archive data and graphical user interfaces for waveform visualization. Through the SeisComP program, the DSN station data can been received by the scientific module in real time, which is fundamental for seismic monitoring.
For the database management and, especially, the localization of VT events and regional earthquakes, we used the software SEISAN (Havskov & Ottemoller Reference Havskov and Ottemoller1999), a package of programs developed at the University of Bergen (Norway) that is widely used by many geophysical institutions including the IAG-UGR. The velocity structure model used for location routine is from Ibañez et al. (Reference Ibáñez, Del Pezzo, Almendros, La Rocca, Alguacil, Ortiz and García2000), with a P-wave velocity (Vp)/S-wave velocity (Vs) ratio of 1.74.
In more recent surveys, two software packages were used for the visualization and classification of seismic events. Firstly, SEISVO (https://github.com/ifmelchor/seisvo) was used, which permits the identification and classification of seismic events in volcanic environments and the creation of a database of classification, time and duration in SQlite. In the last two surveys (2020–2021 and 2021–2022), SWARM software (https://github.com/usgs/swarm) was used. This software is a Java application developed by the United States Geological Survey (USGS) that is designed to display and analyse seismic waveforms and their spectrograms in real time, enabling their classification.
Field surveys, 2011–2022
During the 2011–2022 period, the seismicity levels at Deception Island were very different between the surveys (Figs 4 & 5 & Table II). Some of them presented very low seismic activity compared with others with high levels of activity leading to a change to the level of seismic alert regarding the volcano (Fig. 6). Analysis of seismic activity was conditioned by the survey duration during the Antarctic summer (from December to March). Some of them were only a month long (2013–2014 and 2020–2021 surveys), whereas others had a duration of 3–4 months. Some of these surveys were completed using operative winter stations.
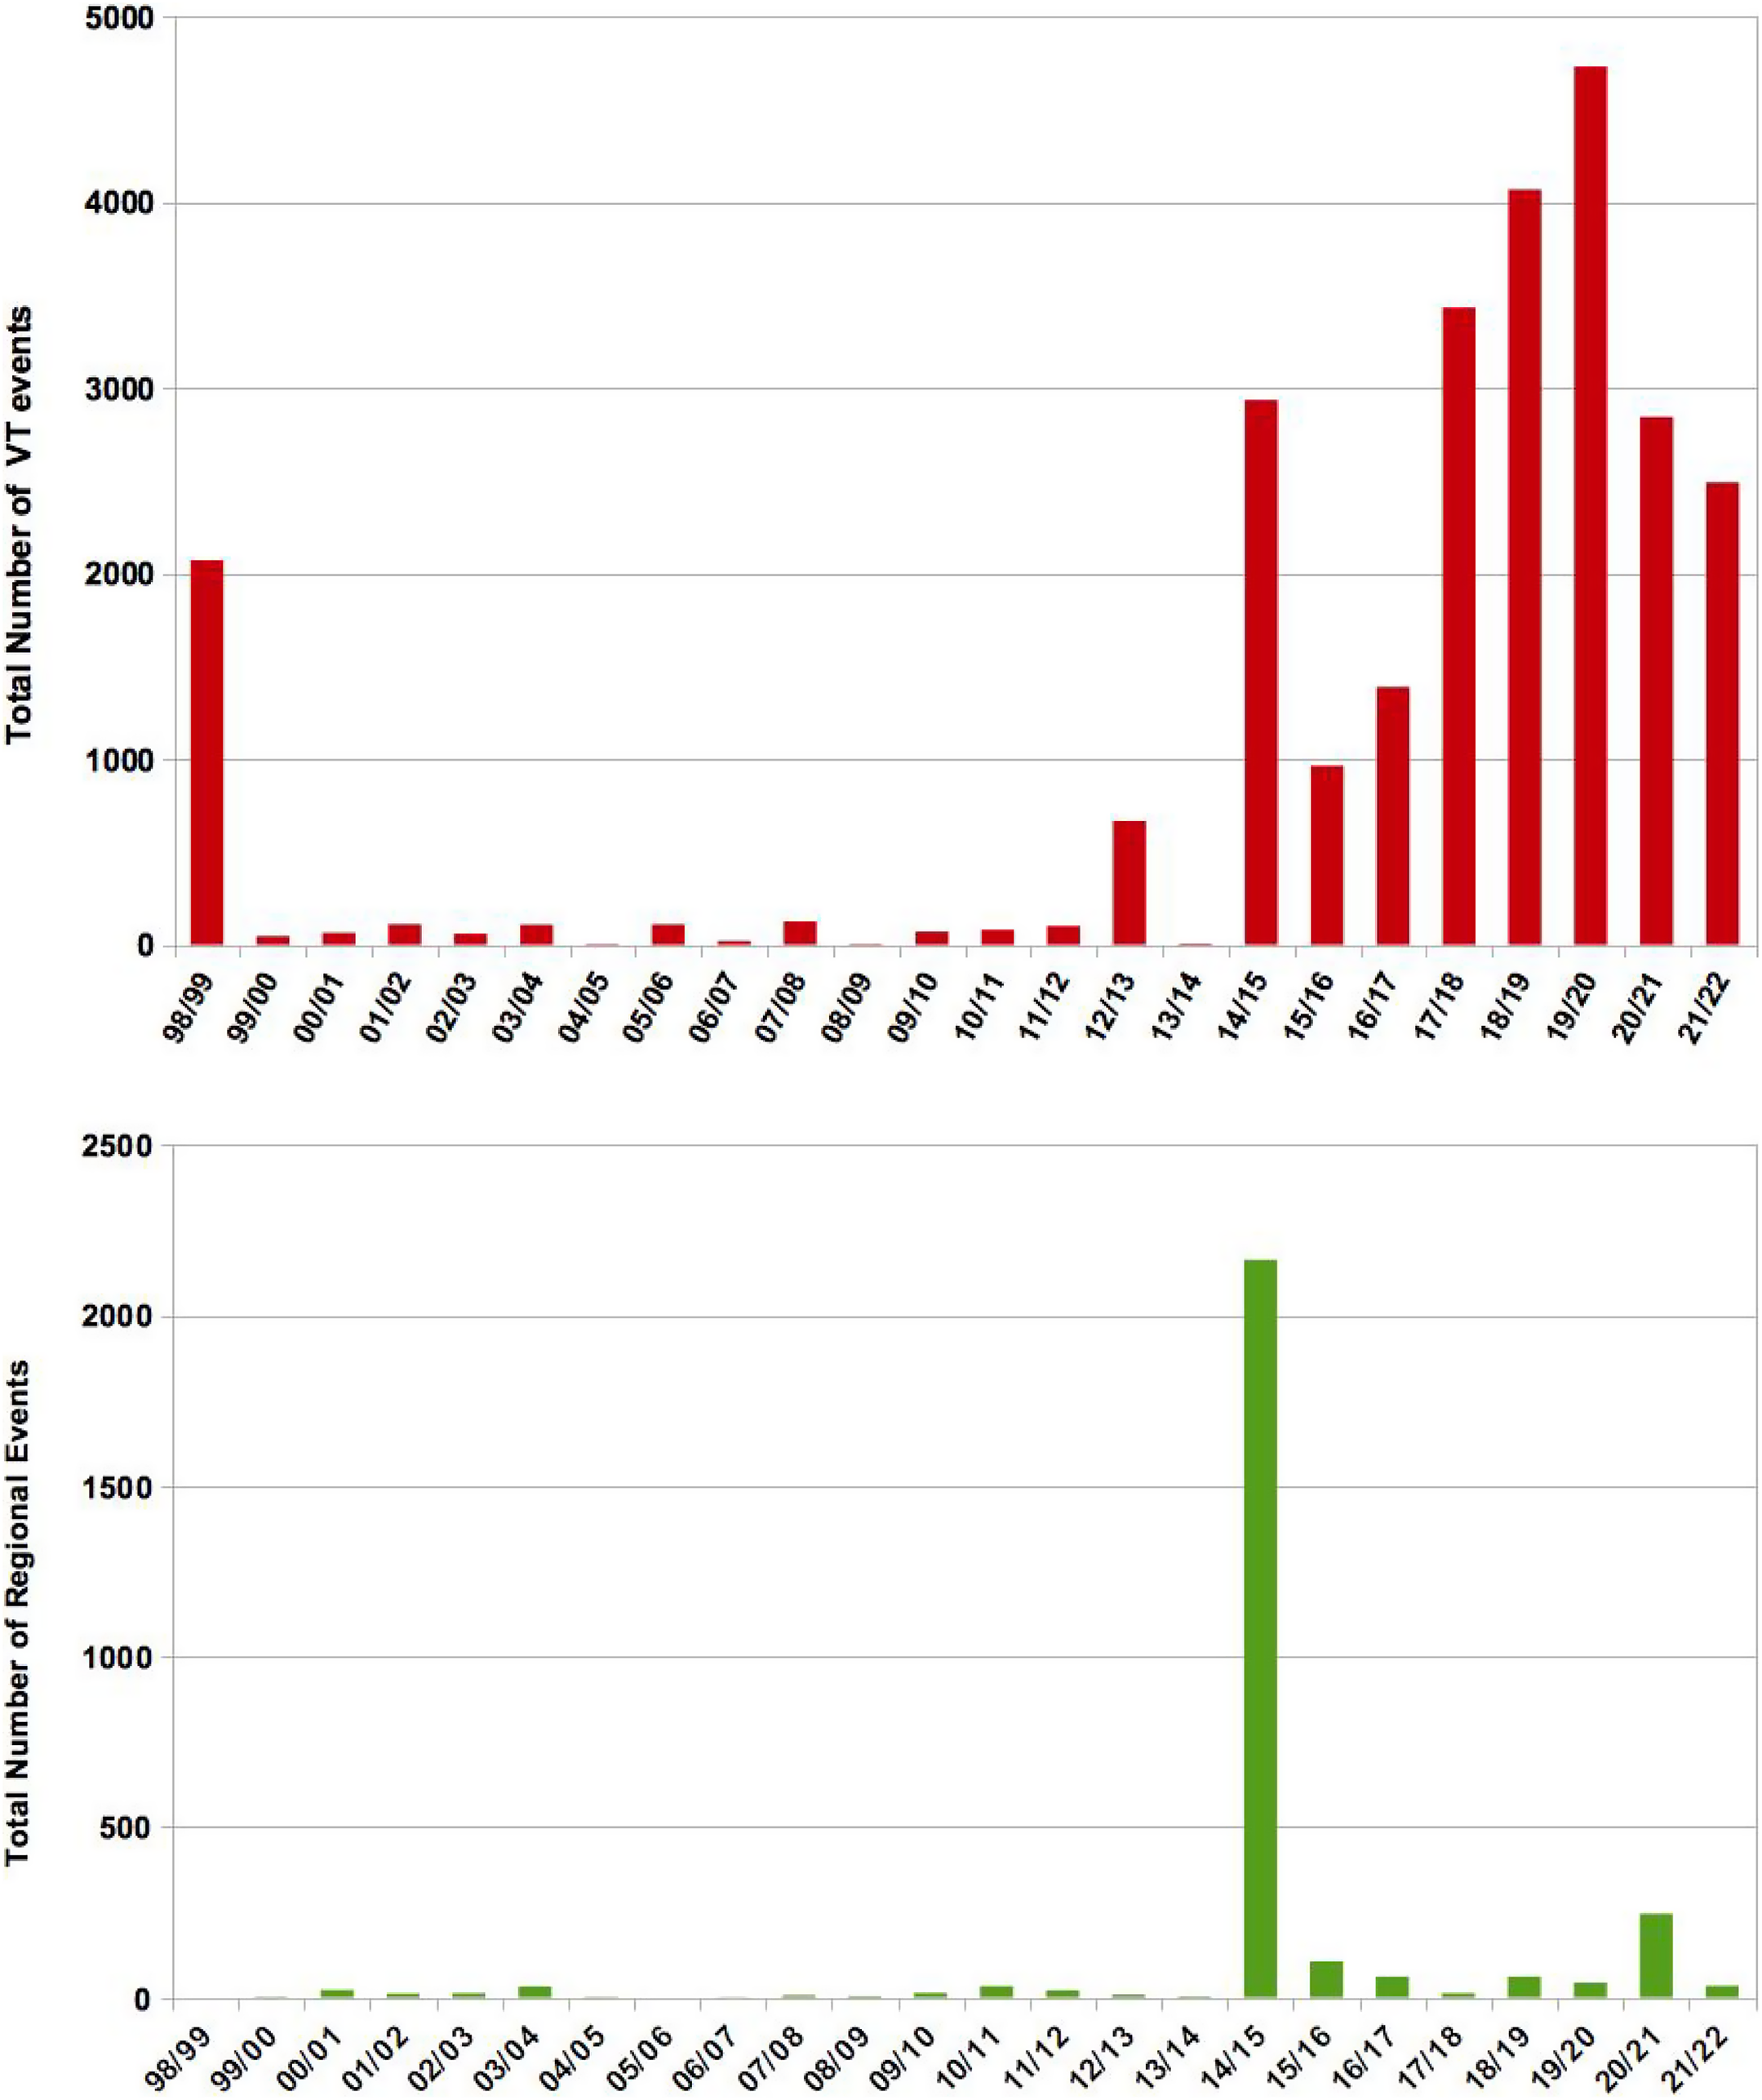
Figure 4. Histogram of total number of volcanic-tectonic (VT) and regional (RE) events detected during monitoring surveys from 1998 to 2022.
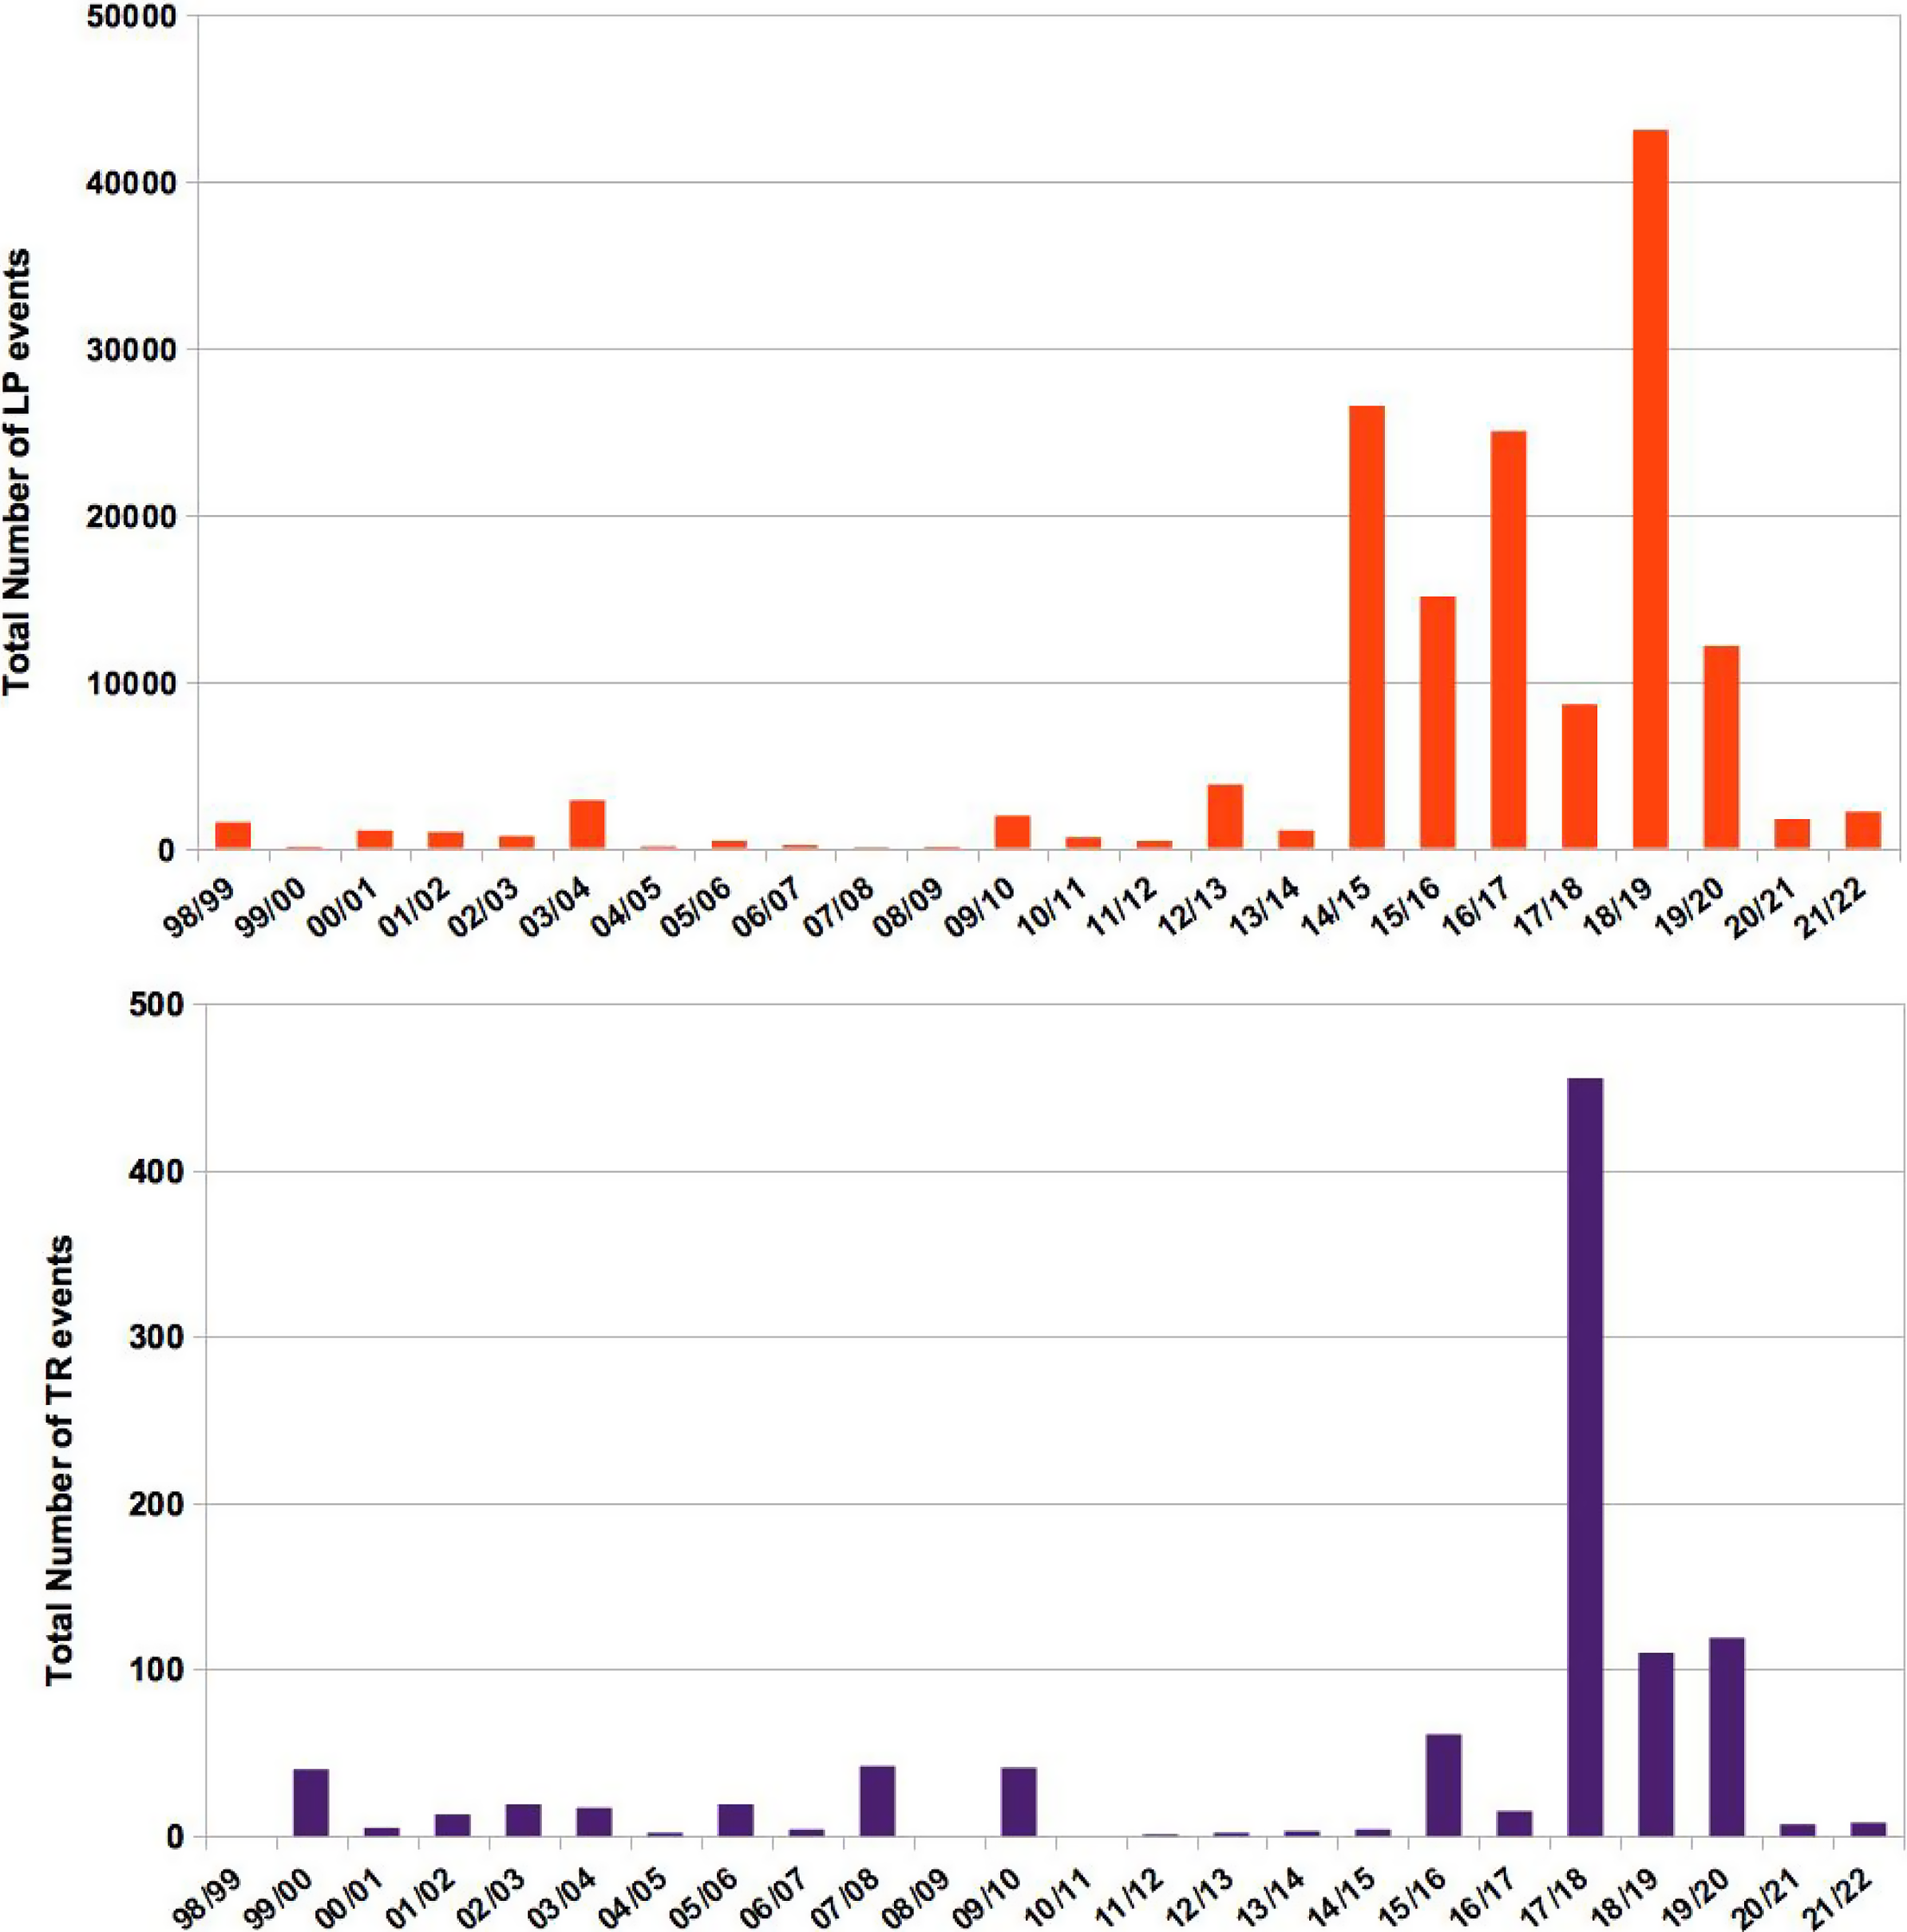
Figure 5. Histogram of long-period (LP) events and tremor (TR) episodes detected during monitoring surveys from 1998 to 2022.
Table II. Total number of events detected during the 2011–2022 surveys.
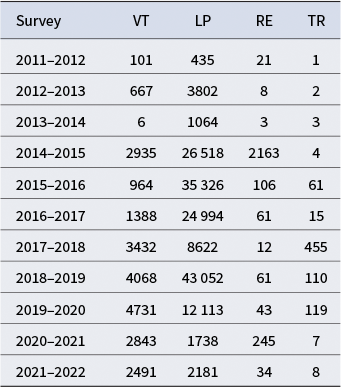
LP = long period; RE = regional event; TR = tremor; VT = volcanic-tectonic.
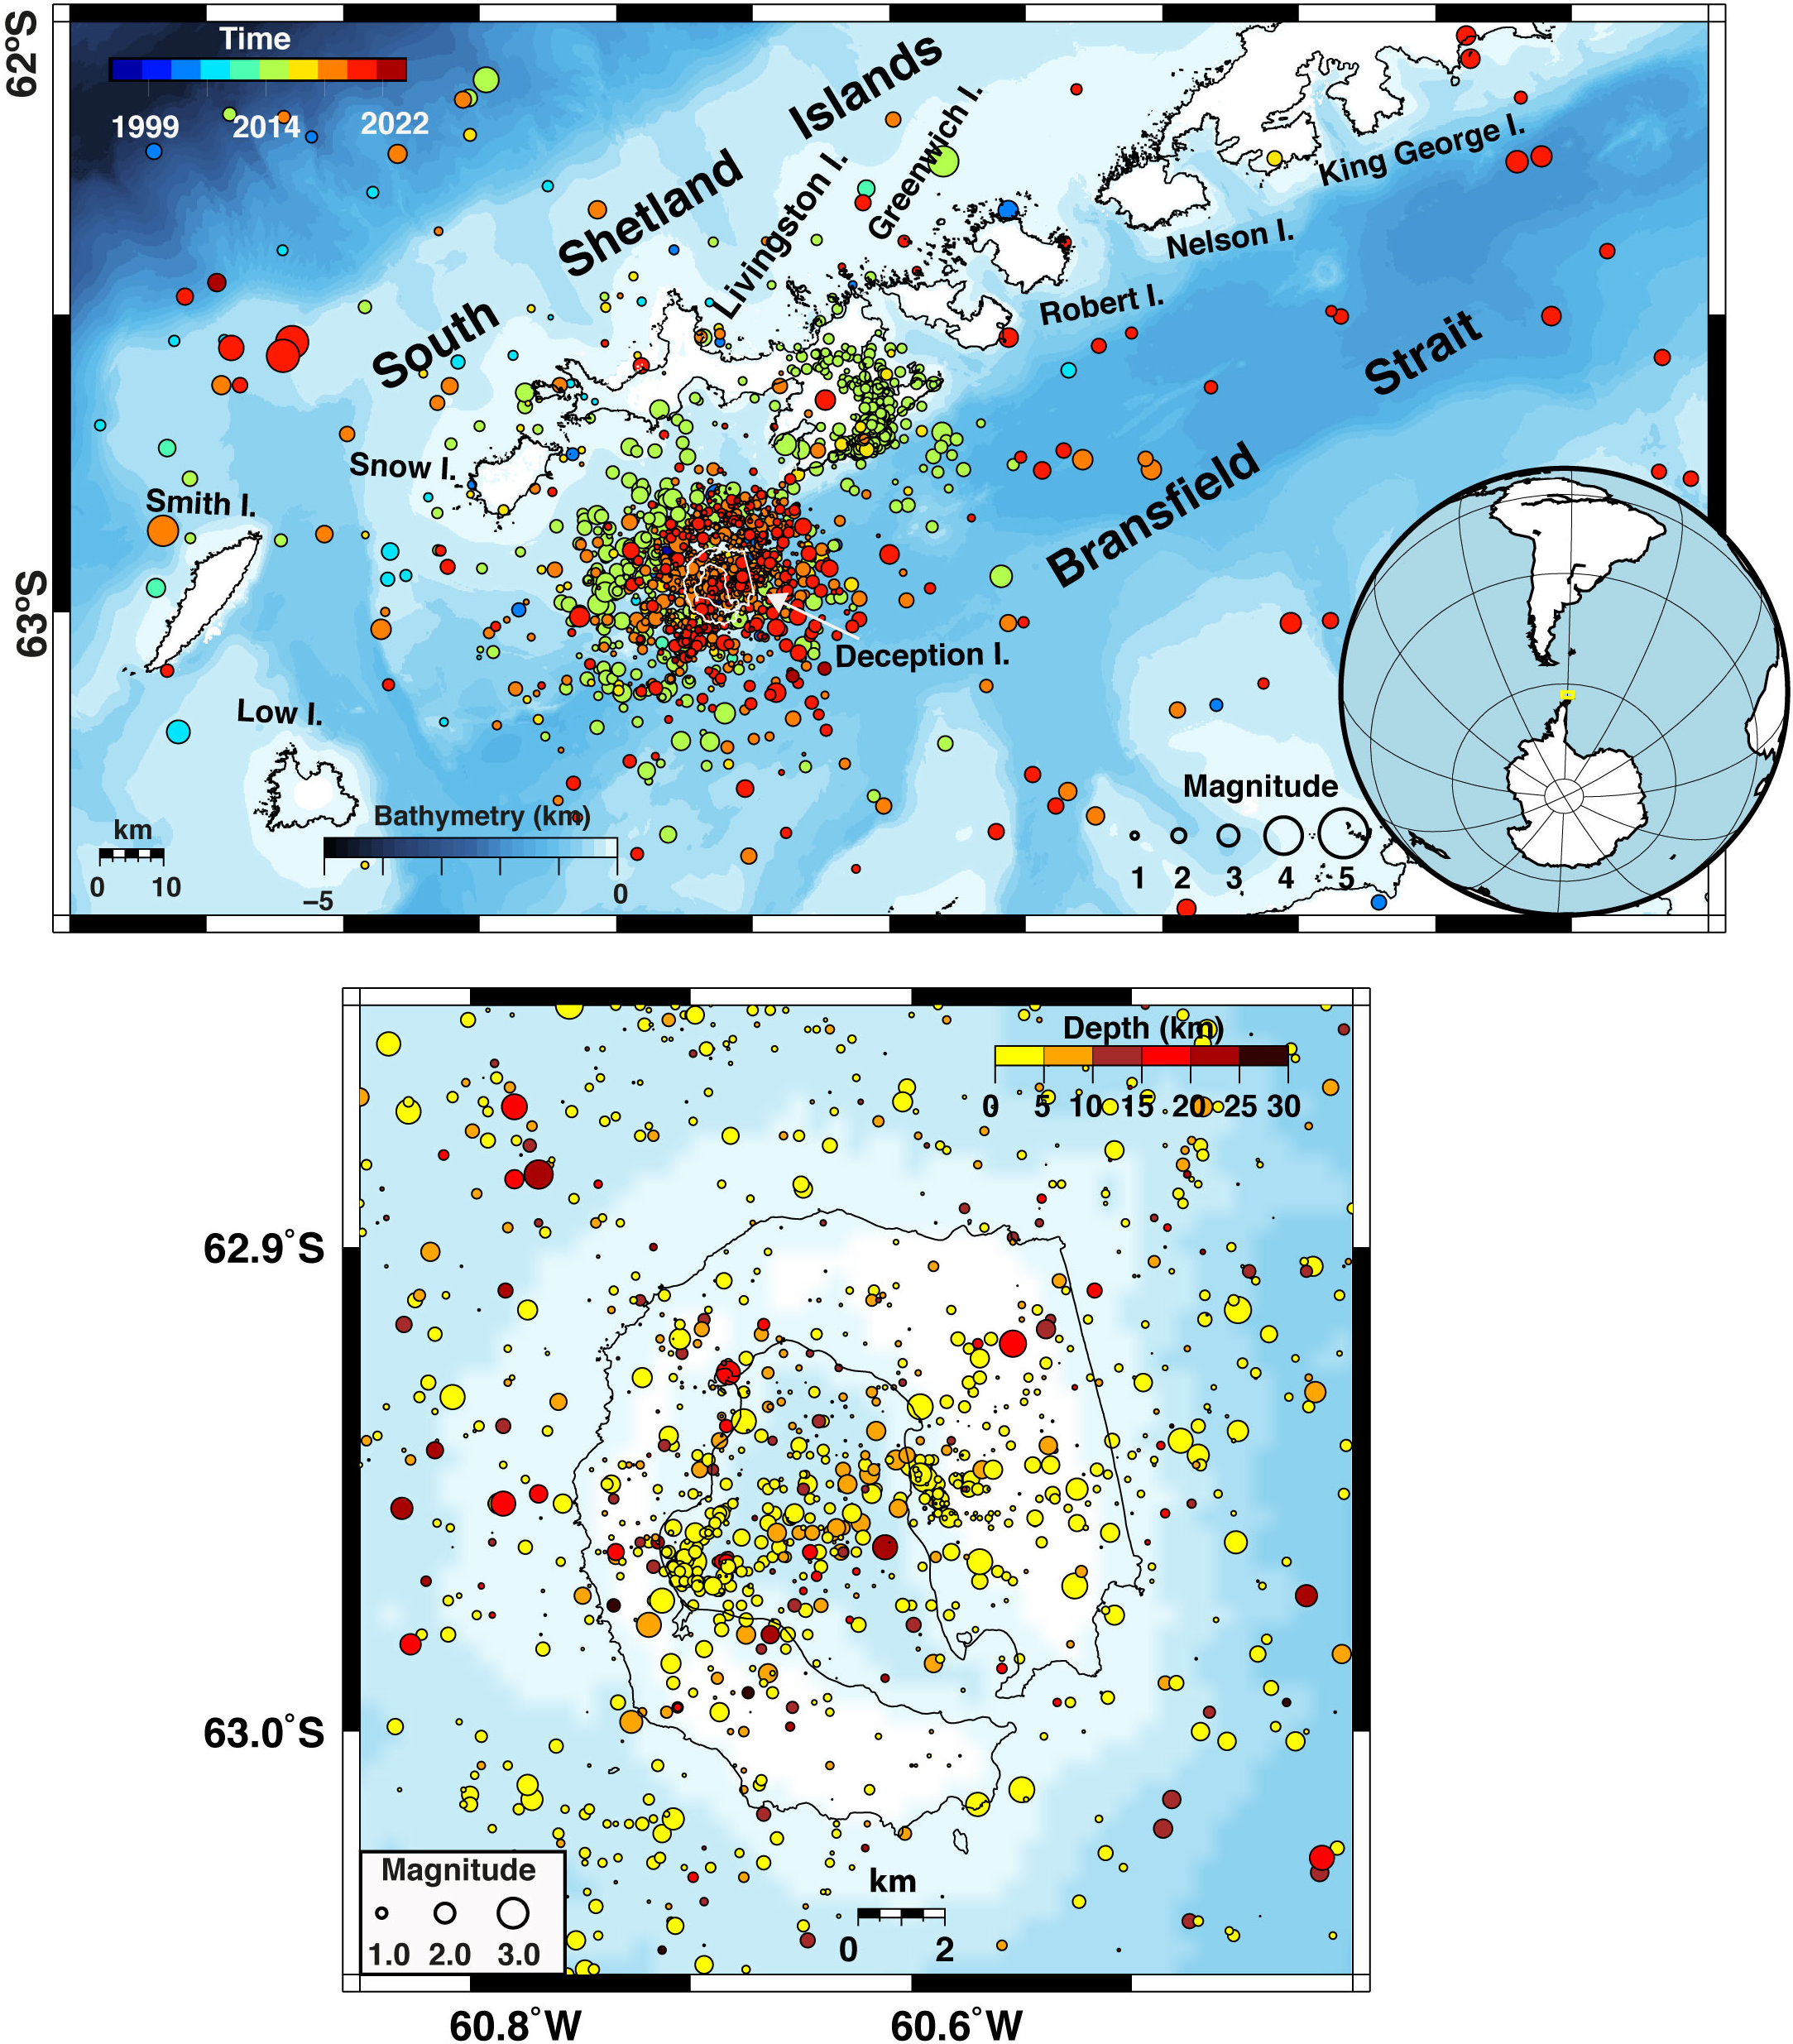
Figure 6. (Top) Epicentral map displaying the earthquake locations localized during all periods of monitoring surveys of the Andalusian Institute of Geophysics of the University of Granada (IAG-UGR) since 1998–1999 until 2021–2022. The symbol sizes represent the earthquake magnitudes and the colours indicate origin times. (Bottom) Same as top image, but for Deception Island volcano, for which epicentres are coloured by source depths.
2011–2014 surveys
During the 3 months of the 2011–2012 survey, the seismicity level was very low (Figs 4 & 5). Hundreds of LP events of low amplitude were detected, with a probably hydrothermal origin. A few HB events were also registered, as well as very local volcanic tremor episodes, especially in OBS station. This LP activity dominated in the island during this survey. Otherwise, VT events were very scarce, as only a few dozen of VT events were counted. The largest VT earthquake (coda magnitude (Mc) = 1) was located at the centre of Port Foster at ≤ 10 km depth (Fig. 7). At the same time, several microseismic events related to breaking ice at the glacier were detected, mainly in at C70 and CHI. Some local and regional earthquakes were registered, highlighting that the seismic swarm happened in mid-January in the eastern Bransfield Strait basin, near Elephant Island (Fig. 7).
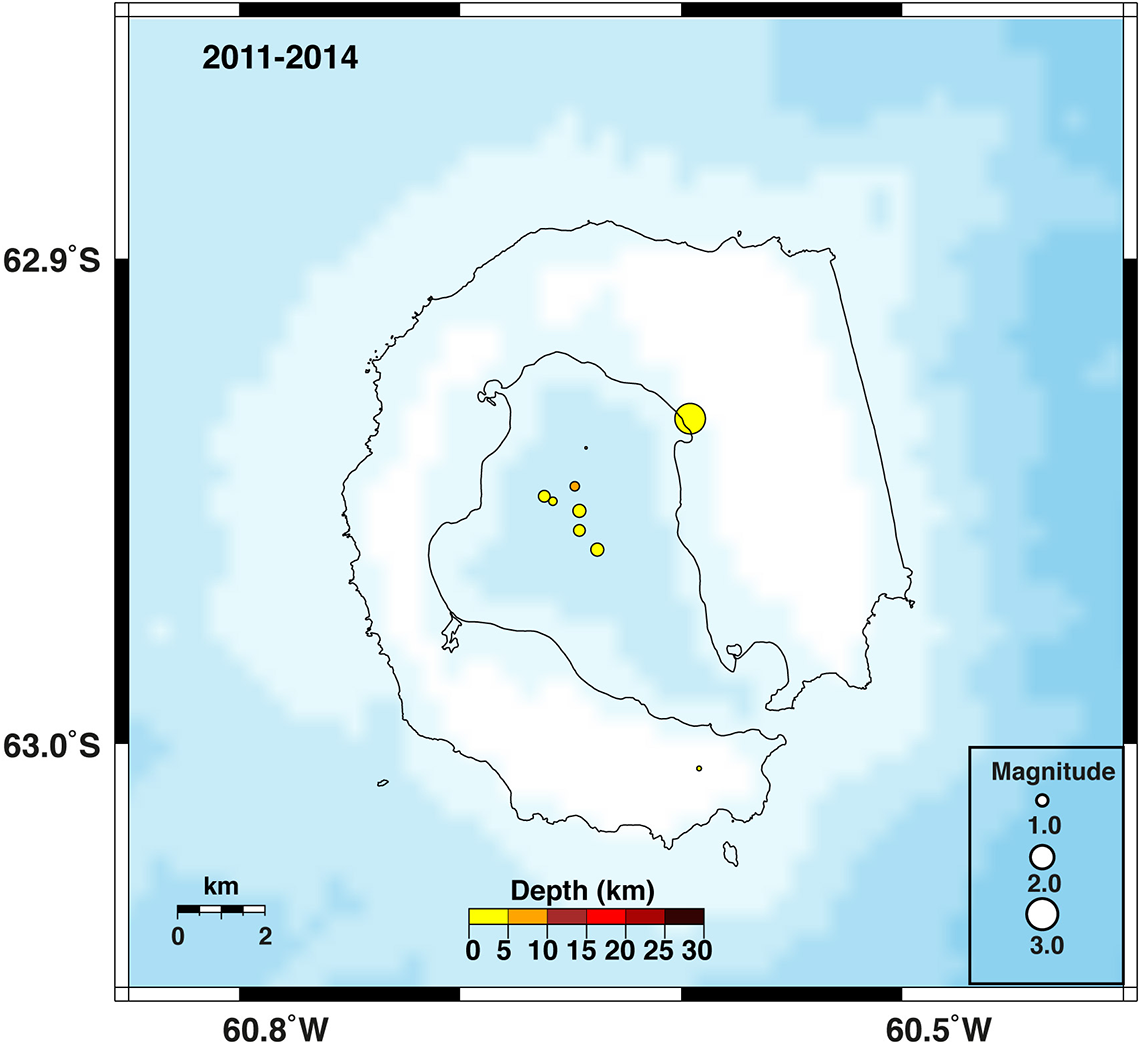
Figure 7. Epicentral map of the earthquake locations localized during the 2011–2012, 2012–2013 and 2013–2014 surveys of Deception Island volcano. The symbol sizes represent the earthquake magnitudes and the colours indicate the source depths.
During the 2012–2013 survey, the seismic activity was higher in terms of the number of seismic events registered compared to previous surveys (2010–2011 and 2011–2012; Figs 4 & 5). A considerable number of LP events were registered in the area of FUM and OBS. The large number of VT events was noticed at CHI and less so at C70. Some of these events were only registered at these stations. An auxiliary broadband station was installed in Pendulo (PEN) to be able to localize these events. In this survey, for the first time, a large number of LP events was detected, but only at C70. Because these events were only registered at C70, a possible origin could be some hydrothermal source situated on the north-western exterior of the volcanic edifice.
The 2013–2014 survey had the shortest duration of all of these Antarctic surveys. Independent of its duration, the seismic activity was very low during this survey in comparison with the preceding one (Figs 4, 5 & 7).
2014–2015 survey
During this survey, the greatest seismic activity was recorded over the whole period, which contributed to changing, for first time since the 1998–1999 seismic crisis, the alert level regarding Deception Island volcano to yellow (Figs 4 & 5).
LP seismicity was notable, focused particularly at western Deception Island, according to the analysis of the data registered by the seismic array. This activity changed to volcanic tremors over several hours. Sharp LP activity started on 22 January and continued over several days, with some peaks of activity occurring. This activity decreased at the end of January. Most of this activity was recorded in OBS, probably due to the presence of thermal anomalies and CO2 emissions in this area. The seismic activity in this area has also been observed in previous surveys. Some this activity was also detected at FUM and BASE stations. This LP activity seems to have been very local and probably associated with the hydrothermal systems in FUM. This seismic activity was also coincident with the warmest days and the greatest melting of ice that took place on the island.
Application of array techniques to the FUM array LP events enabled estimation of the slowness vector of these signals. This vector give us information regarding the azimuth and apparent velocity of the sources of the seismic signals. The results showed a 305°–315° back-azimuth and a high slowness (low apparent velocity) of ~1 s/km. These high values imply a surface or near-array source.
The highlights of this survey were the unusual number of regional events recorded related to the geodynamic activity in the Bransfield Strait. These events displayed S-P delays of ~6 s, which means that they originated dozens of kilometres away, considering the relation between distance (D), S-P delay (∆) and Vs/Vp ratio (∝) given by Equation 1:
 $$ \begin{align}D=\Delta(\mathrm{V}_\mathrm{p}/(\propto/(\propto-1)))\end{align} $$
where Vp and Vs are the velocity of P and S waves and Vp/Vs is 1.74, which is used for routine locations of VT events at Deception Island. Location estimations of these earthquakes suggested low magnitudes (~2) and that they occurred in the southern region of Livingston Island. A large amount of these events occurred in the east region of Livingston Island, extending over all of Deception Island volcano from early February 2015. Most of these earthquakes were only registered in C70 and CHI with S-P delays of ~1 s, meaning that they occurred 4 km away from these stations. Similar events have been detected in other surveys. Additional VT events have occurred in the volcano edifice, indicating the great instability of hydrothermal volcanic system (Fig. 8).
Figure 8. (Top) Epicentral map of the earthquake locations localized during the 2014–2015 survey. The symbol sizes represent the earthquake magnitudes and the colours indicate the origin times. The purple triangle indicates the location of the Livingston Island (LVN) seismic station. (Bottom) Zoomed-in image of Deception Island from the top map. The symbol sizes represent the earthquake magnitudes and the colours indicate the source depths.
There was an increase in the number of VT events from 8 January, with some peaks of activity on 9 and 10 January. These events were mainly recorded at CHI and to a lesser extent at C70. A VT event swarm was registered at C70 during 21 and 22 January with S-P delays of ~1 s. This activity decreased until a new peak of activity occurred on 30 January, with similar characteristics, S-P delays of ~1 s and low magnitudes. It is noteworthy that this increase in activity coincided with the day with the highest number of LP events recorded at OBS over the whole campaign. On 6 and 7 February, a new peak of VT event activity with S-P delays of ~2 s occurred (Fig. 8).
A posterior analysis of this swarm showed these earthquakes started to group in two main clusters in February. The last one presented higher numbers of earthquakes and magnitudes up to 3.3. The seismic activity continued through March and April, displaying lower S-P delays and magnitudes, and it was still relevant when the Deception Island station (DCP) stopped working in May 2015. Source distances based on S-P delays were estimated for 773 earthquakes recorded by the temporary network and the DCP station. Source locations based on phase arrival times to the stations of the temporary network were obtained for 298 earthquakes between December and February (Fig. 6). The early clusters were located south-west of Deception Island, although in February epicentral locations surrounded the volcano in all directions. Depths were mostly limited to the first 10 km of the crust (Almendros et al. Reference Almendros, Carmona, Jiménez-Morales, Díaz-Moreno and Lorenzo2018).
LP events displayed a sharp increase compared with previous surveys. The total number of LP events recorded during the survey increased by an order of magnitude compared to previous surveys.
Analysis of long-term continuous data from permanent stations deployed in DCP and Livingston Island (LVN) showed a seismic swarm that started near Livingston Island in late August 2014 and overlapping with the Deception Island 2015 VT event series. Approximately 9000 earthquakes were detected, most of them with S-P delays at LVN station in the range of 2.9–3.5 s. The epicentres clustered in a region south-east of Livingston Island, close to Humpback seamount, at ~35 km north-east of Deception Island, with magnitudes of up to 4.6 (Almendros et al. Reference Almendros, Carmona, Jiménez-Morales, Díaz-Moreno and Lorenzo2018).
Other signs of increasing instability were detected before the 2015 seismic crisis thanks to the long-term monitoring of the volcano. For example, significant variations in the temperature trends of the Port Foster seawater and the Cerro Caliente hotspot were observed in 2012 (Berrocoso et al. Reference Berrocoso, Prates, Fernández-Ros, Peci, De Gil and Rosado2018), as was an increase in the number of long-duration volcanic tremors between 2012 and 2015 (Jiménez-Morales et al. Reference Jiménez-Morales, Almendros and Carmona2017).
Even though periods of intense activity were registered during all of the surveys, in the last 3 weeks of this survey this activity became continuous, leading to a change in the volcanic alert level to yellow on 17 February 2015. This change requires an increase in the surveillance of seismic and deformation parameters, including thermometric measurements in different areas of the island. Over the following days, this activity decayed, and on 20 February the alert level regarding the volcano returned to green.
2015–2016 survey
During the 2015–2016 survey, the activity level was lower than the previous one but high in comparison to those surveys from before 2014 (Figs 4 & 5). An intense LP seismicity was recorded in the last year, focused on western Deception Island. The greatest number of LP events was detected in OBS and the seismic array in FUM. Application of array techniques to the FUM array LP events enabled estimation of the slowness vector of these signals. This vector gives us information about the azimuth and apparent velocity of the source of the seismic signals (Fig. 9). Most of these LP events were in the order of 10 s long, with frequencies ranging 2 to 4 Hz. LP activity was also recorded at C70, similarly to the 2012–2013 survey. This suggested a possible increment of hydrothermal activity in this area. In this survey, volcanic tremors were detected at all stations of the DSN. Lower numbers of local and regional VT earthquakes were registered during this survey compared to the 2014–2015 survey, but these numbers were still significantly higher than those from earlier surveys. In general, during this survey the level of seismic activity was moderate (Fig. 10).
Figure 9. Analysis of long-period seismicity with seismic array techniques. (Left) Representation of waveform, spectrogram, cross-correlation, azimuth and slowness. (Right) Representation of apparent slowness vector.
Figure 10. Epicentral maps of the earthquake locations localized during the 2015–2016, 2016–2017 and 2017–2018 monitoring surveys. The symbol sizes represent the earthquake magnitudes and the colours indicate the source depths. All plots present the same size and colour scales as the upper-left plot.
2016–2017 survey
A dominance of LP events was recorded during the 2016–2017 survey, similarly to previous surveys, although this number was lower than that registered in the 2015–2016 survey (Figs 4 & 5). Most of these events were registered at OBS and FUM, related to known thermal and geochemical anomalies and apparently associated with a system of north-east to south-west factures (Fig. 1; Ortiz et al. Reference Ortiz, García, Aparicio, Blanco, Felpeto, Del Rey and Ricci1997, Smellie et al. Reference Smellie, López-Martínez, Headland, Hernández-Cifuentes, Maestro and Millar2002, Padron et al. Reference Padrón, Hernández, Carmona, Pérez, Melián and Sumino2015). These authors proposed that hydrothermal fluids are produced by venting of shallow aquifers heated convectively by gasses released from an underlying magma chamber. OBS was the station with the highest number of LP events registered. Fewer events were detected at BASE and FUM.
VT earthquake locations extended across the whole volcanic edifice. Most of the VT events were detected at CHI and RON. S-P delays of 1–2 s implied possible event locations at 4 km away from these stations. Similar VT events were detected in the same zones as from previous surveys. The locations showing seismicity extended across the entire volcanic edifice, with magnitudes ranging −0.2 to 2.0 and from 10 to 30 km depth. Due to the local character of this VT activity, the incorporation of RON (north-east of Deception Island) into the DSN made it possible to locate a greater number of VT events occurring in the outer northern part of the volcano than in previous years. These new locations showed a dispersed distribution of earthquakes over the entire volcanic edifice (Fig. 10).
Additionally, regional earthquakes associated with the geodynamics of Bransfield Strait were detected, with S-P delays of up 4 s. The number of these events notably decayed, and the seismic swarm that began during the 2014–2015 survey in south Livingston Island seemed almost finished. We were aware of the presence of earthquakes (or IQs) related to the presence of glaciers and unstable mountain systems during this survey, and we were able to locate and characterize these events thanks to the incorporation of RON. They originated from partial micro-breaks of glaciers or some detachments of glacier fronts or rocks. These events were localized to Glacier Negro. A future study of these events would be very interesting, and would help us to understand the interaction between glaciers and volcanic activity.
2017–2018 survey
In this survey, despite the level of seismicity being lower than in preceding years, the LP activity continued to dominate (Fig. 5). VT earthquakes followed similar patterns as in previous surveys (Fig. 4). Most of them were detected at C70, CHI and RON. Similarly to the LP events, the number of VT events was lower than in the preceding years, with two peaks of ~100 events at C70 during the second stage of this survey. This high activity decreased until it had almost disappeared at the end of the survey. In addition, very-low-intensity VT swarms were also detected during this survey, only at C70 and, in some cases, at CHI. They presented a heterogeneous temporal distribution, reaching a maximum of up to 100 VT swarms at C70 and a minimum 2 weeks later, with two of them being recorded at OBS (Fig. 10). This continuous occurrence of VT events can be interpreted as a consequence of a destabilization of the fault system. Moreover, a VT cluster was localized near CHI, following an north-west to south-east alignment parallel to Pendulum Cove (Fig. 10), which coincides with a faulting structure described in Rey et al. (Reference Rey, Somoza and Martínez-Frías1995) (Fig. 1). Some regional earthquakes were been detected, with S-P delays of up 4 s, which are related to the regional tectonics of the Bransfield Strait. In this survey, the number of regional events decreased significantly. Earthquakes related to ice fractures in glaciers (IQs) were also recorded, especially at CHI and RON.
In summary, during this survey the seismic activity remained at a moderate to low level, with low levels of the activity related to the Deception Island volcanic edifice.
2018–2019 survey
The seismic activity detected during this survey represented a significant increase compared to the 2017–2018 survey (Figs 4 & 5). This activity was mainly local where the different stations registered the characteristic activity of the zone where they are installed. Sometimes this activity could be detected in other stations at the same time. As usual for Deception Island volcano, the predominant seismic activity was LP (LP and TR). These signals were detected at OBS and FUM associated with known hydrothermal and geothermic systems in the area around these stations. During this survey, a remarkable number of LP and TR events were registered at BASE and C70, and less so at RON and CHI. A total of 74 466 events, including LP events, LP swarms, TR events and HLP events, were detected, with ~500 LP events per day and peaks ranging from 1000 to 2500 LP events in a single day. Most of LP events and LP swarms were registered at OBS and C70. In spite of all stations registering this type of event, the highest level of LP activity was concentrated at the northern and western stations.
It is worth noting the high number of VT events registered at BASE and C70 at the beginning of the survey. This activity decreased at BASE, whereas at C70 there were several increases and decreases throughout the survey. These VT events were also accompanied by VT swarms. VT event detections were less numerous at the rest of the stations (Fig. 11).
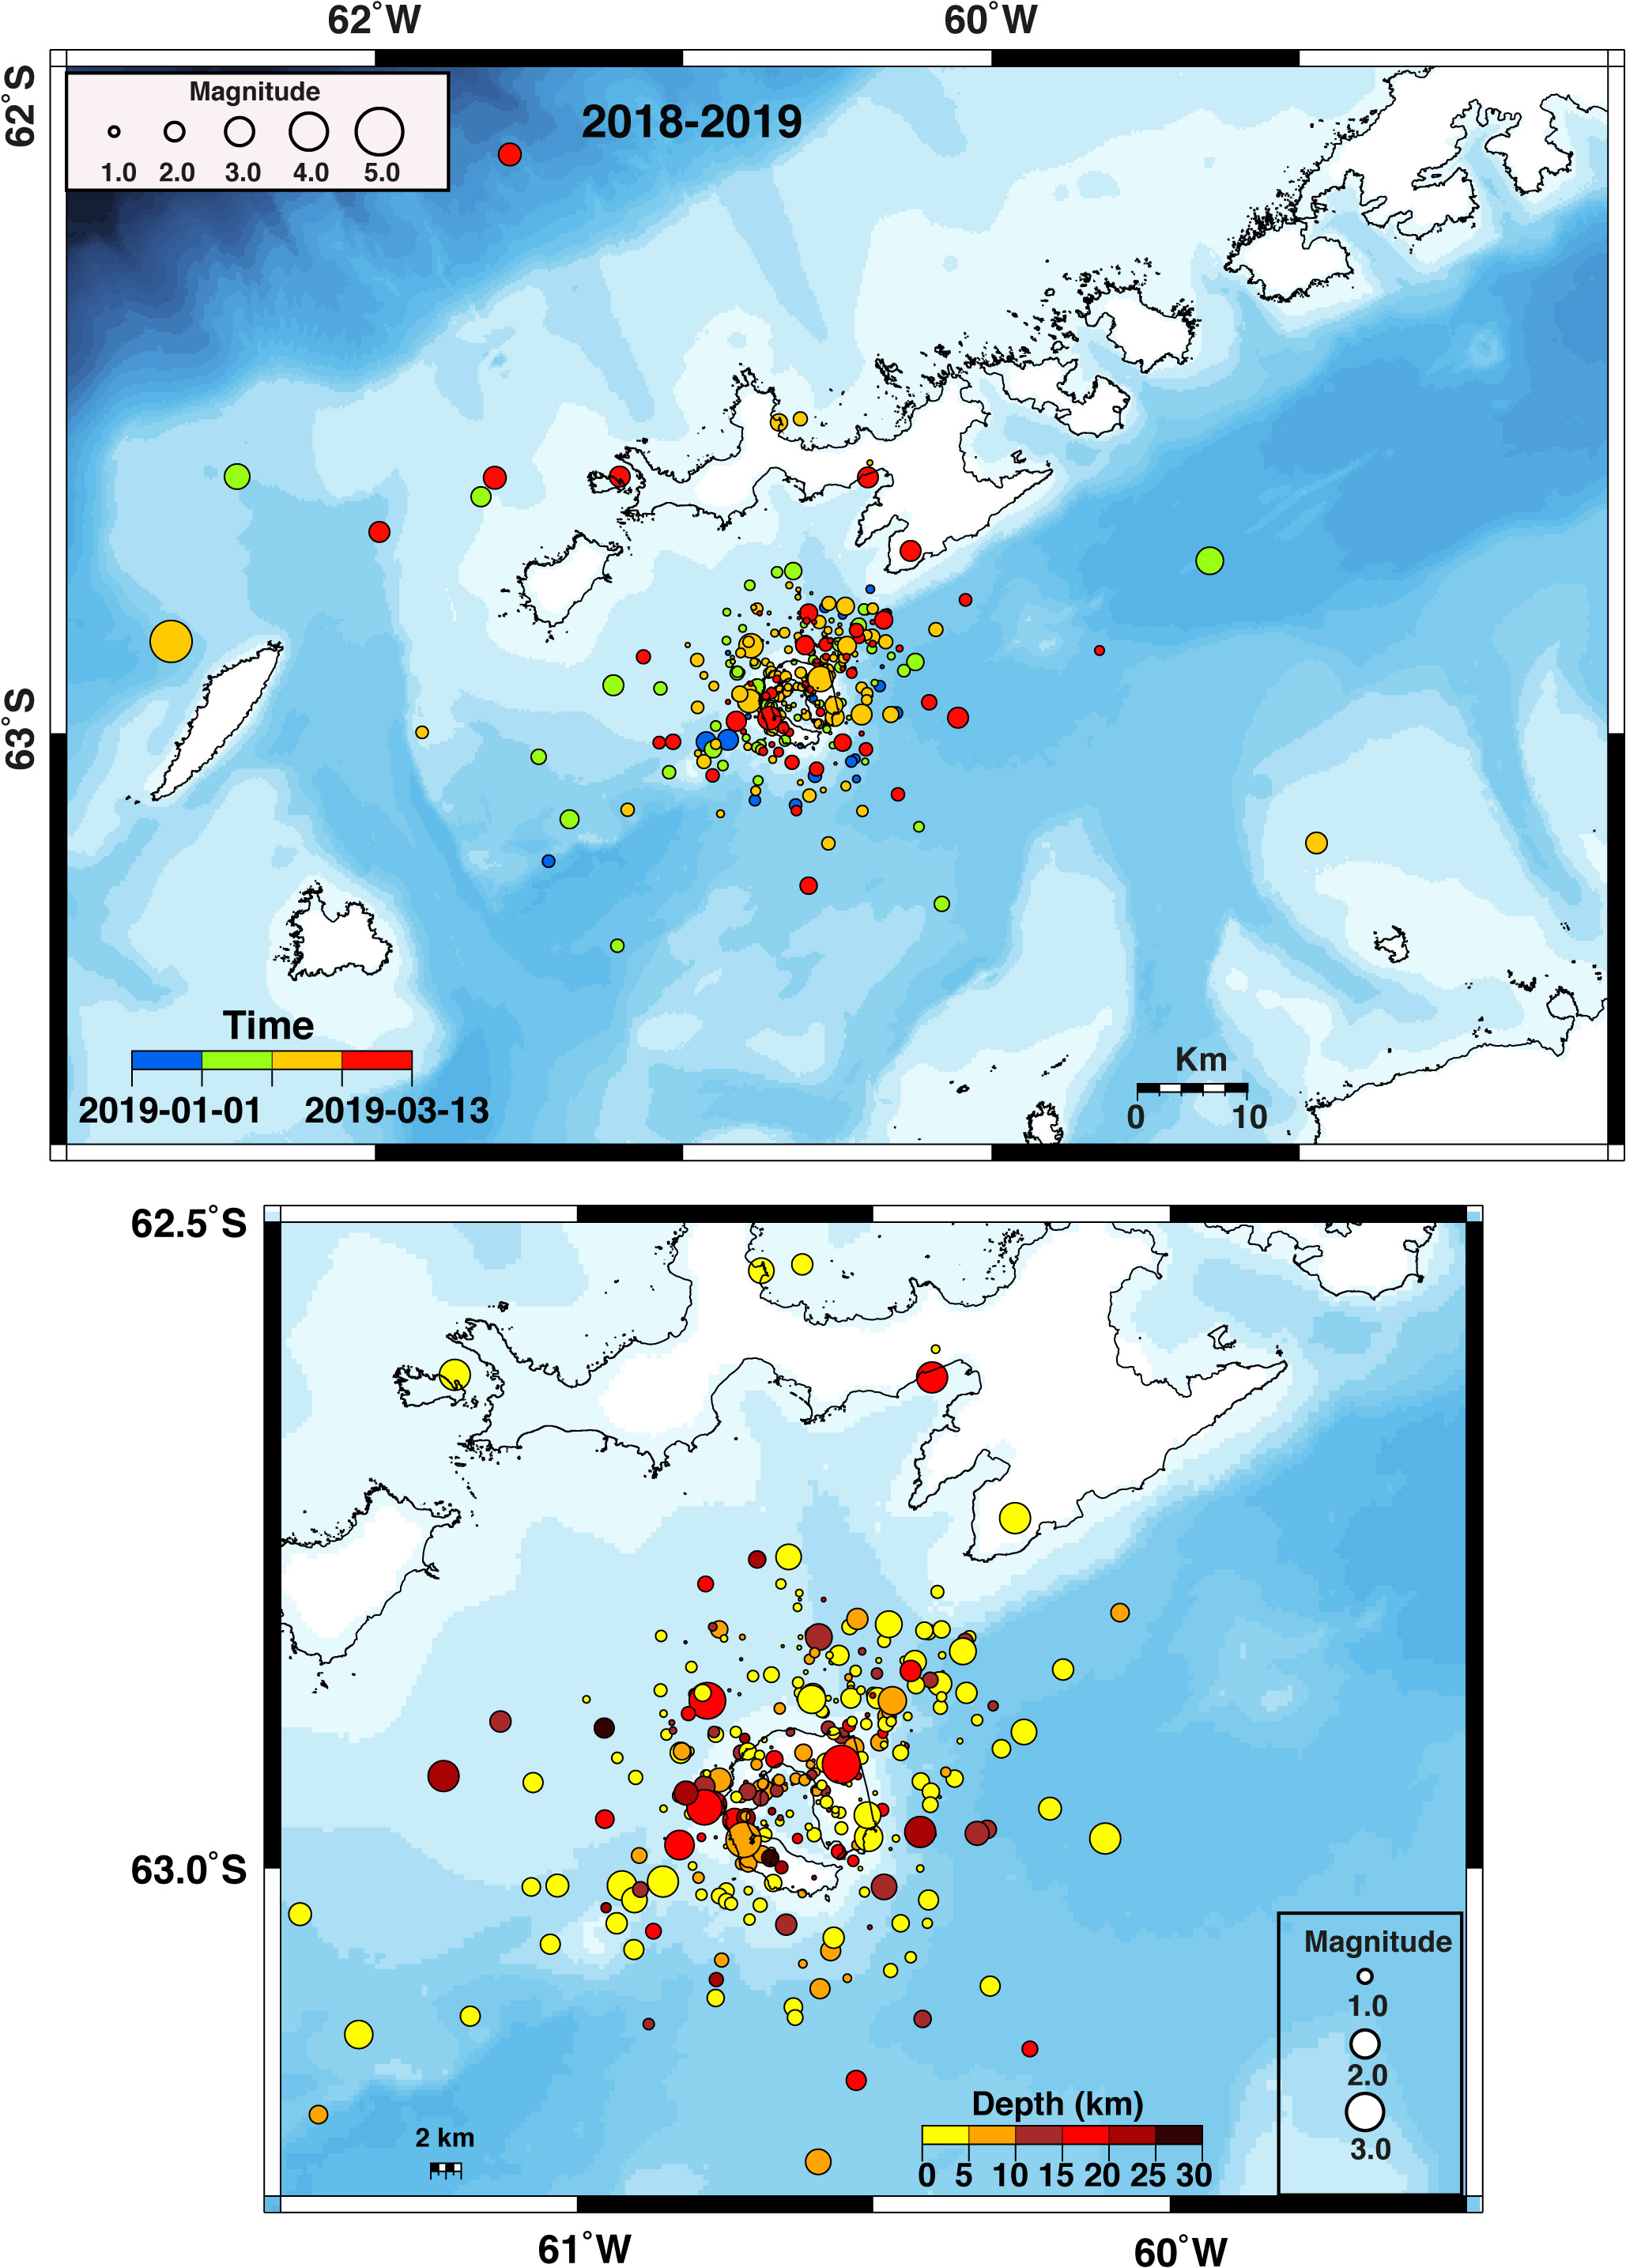
Figure 11. (Top) Epicentral map of the earthquake locations localized during the 2018–2019 monitoring survey. The symbol sizes represent the earthquake magnitudes and the colours indicate the origin times. (Bottom) Zoomed-in image of Deception Island from the top map. The symbol sizes represent the earthquake magnitudes and the colours indicate the source depths.
Local volcanic TR episodes were observed at several stations, mainly at BASE, where more than 100 TR events were recorded out of a total of 213. The durations of these TR events were variable, from minutes to more than 29 h (the longest one being registered at RON), with frequencies centred at 3 Hz, but also at 6 and 8 Hz.
A high number of HLP signals with energy above 5 Hz were detected at specific times. This type of HLP event had the same origin as LP events but was more common and could be detected at more than one station, mainly at OBS and FUM.
A total of 5155 VT events and 648 VT swarms were registered, most of them at C70, but a significant number were also detected at OBS and CHI, with some of them also being observed at RON, FUM and BASE. These events showed S-P delays of 2–4 s for the farthest ones, which would indicate that they would have occurred more than 8 km away. The location distribution of the earthquakes across the island was homogeneous over the entire volcano edifice (Fig. 9). These events presented magnitudes ranging from 0.0 to 2.5 Mc and mostly at depths < 20 km. These results indicated a dispersed and low-energy seismicity across the volcano during the whole survey. The events were localized around the island, some of them concentrated near the fault systems of Deception Island, especially to the north and west of the island. The greatest concentration of earthquakes was observed near C70. A high number of regional earthquakes (69) with a maximum magnitude of 4.5 were localized across all of the Shetland South Islands associated with the geodynamics of the Bransfield Strait. This number increased during the second stage of the survey. The seismic activity generated by the glacier dynamics decreased over the course of the survey.
2019–2020 survey
During this survey, the seismic activity was high, with a slight increase of VT earthquakes with respect to those registered during the 2018–2019 survey (Fig. 4). However, there was a remarkable decrease in LP events, although they remained the predominant type of activity on the island (Fig. 5). These events were mostly detected at OBS, as was also the case for the preceding surveys. HLP events (5 Hz) were also detected (Fig. 2), but, in contrast to previous years, the greatest number of them were detected at CHI. There were a few days of intense LP activity, especially at OBS and FUM. Local volcanic TR periods were registered at BASE, lasting from 1 min to 1 day in duration. At FUM and C70, HTRs of several minutes in duration were identified.
VT events and VT swarms were also observed related to a seismic swarm detected mainly at C70. Many of these events were also registered at CHI and less so at FUM. VT events detected only at CHI and RON showed S-P delays of ~1 s, indicating that they were localized 3–8 km away from CHI. These events have continued to occur virtually since the survey began, averaging 40 events per day. Similar events were recorded in other surveys. Along with these events, a larger number of HB events were also recorded compared to other surveys, mainly at CHI, RON and C70. By applying array techniques to these events, it was possible to determine source azimuths of 50° and 55° and to calculate that they arrived first at RON and CHI, hence it can be estimated that the zone where these events were generated is near RON and CHI (Fig. 10). Strong correlations are found for this analysis when applying a 3 s window time, 25% overlap, 0.6 s/km maximum slowness, 0.02 s/km slowness variation and a filter between 2 and 5 Hz to the data recorded at both stations. The average magnitude estimated for these events was 0.4 Mc, indicating that they were of very low magnitude.
The localized VT earthquakes showed a homogeneous distribution across the whole volcanic edifice, with magnitudes ranging from −0.3 to 1.5 Mc and at depths of 0–20 km, being more concentrated in a north-west to south-east orientation across the island (Fig. 12).
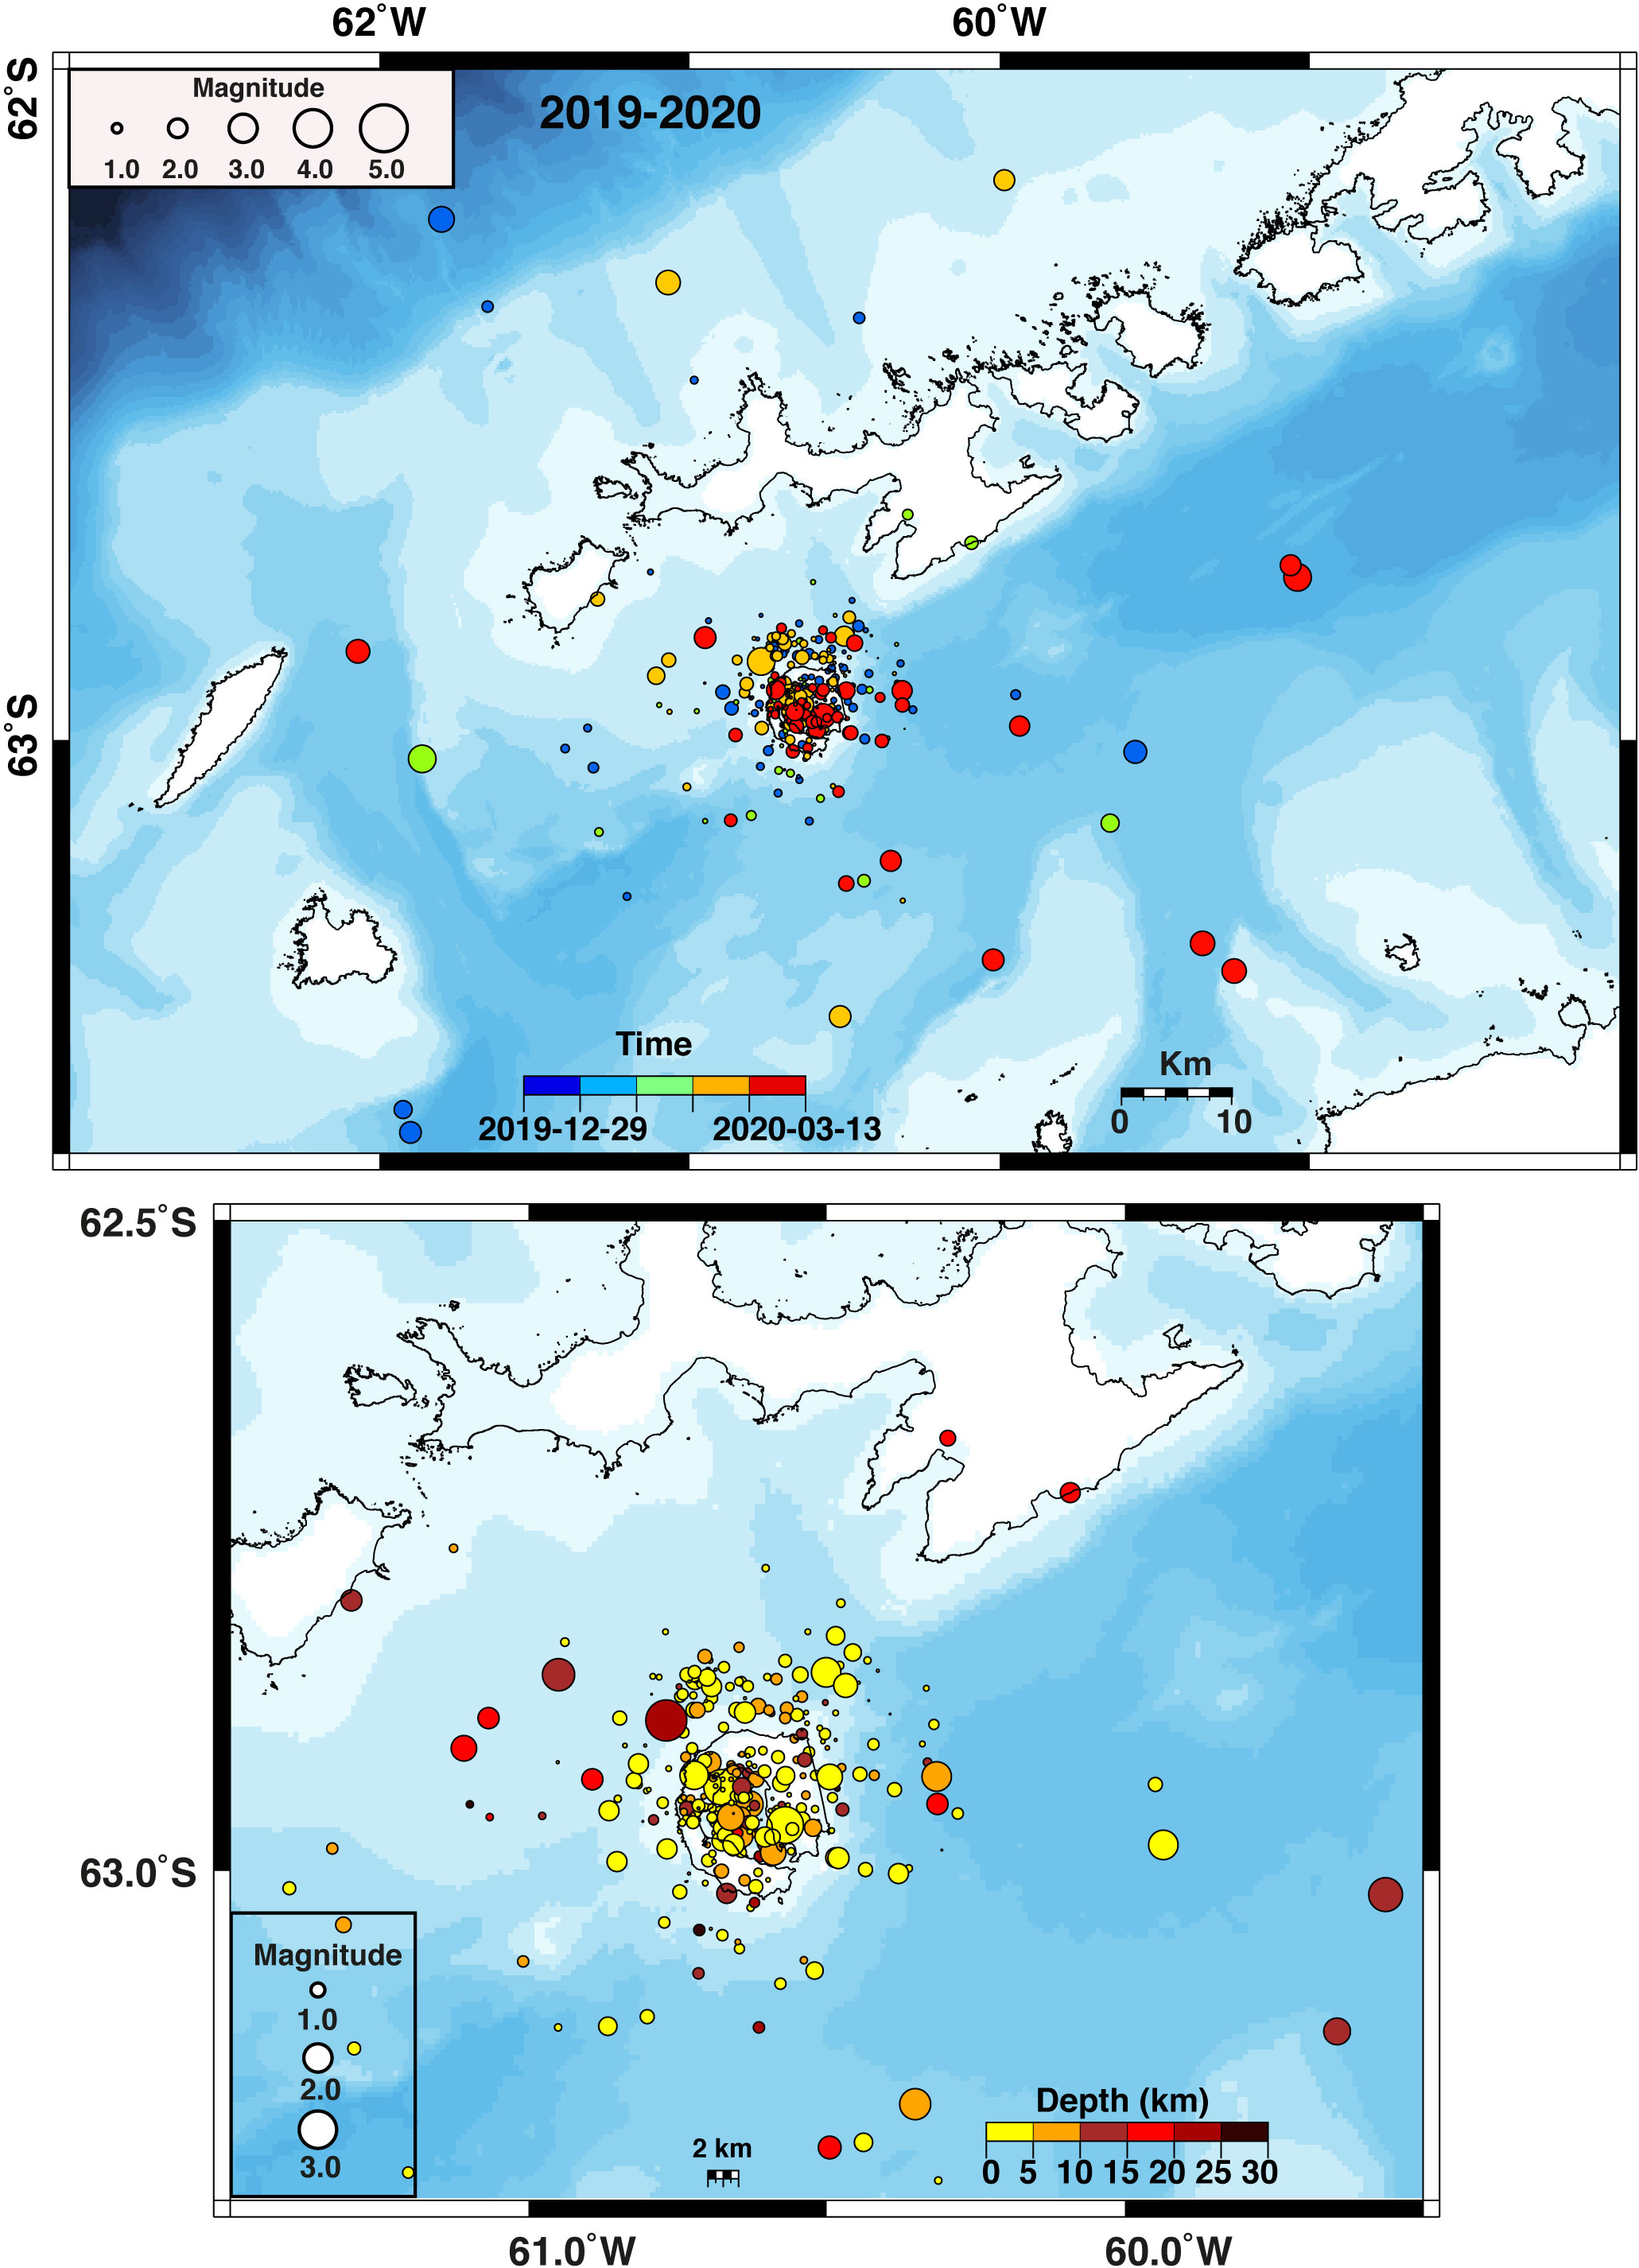
Figure 12. Epicentral map of the earthquake locations localized during the 2019–2020 monitoring survey. The symbol sizes represent the earthquake magnitudes and the colours indicate the origin times. (Bottom) Zoomed-in image of Deception Island from the top map. The symbol sizes represent the earthquake magnitudes and the colours indicate the source depths.
From the start of the survey, a very high rate of deformation (Carmona et al. Reference Carmona, De Gil, Jiménez-Morales, Rosado, Serrano and Fernández-Ros2024) was observed, especially with respect to the distance between BASE and Pendulum Cove. This anomaly remained constant throughout survey. As a consequence of this anomalous deformation value, on January 2020 the level of alert regarding Deception Island volcano was changed to yellow. Seismicity remained high throughout the survey, but it was stable and similar to other surveys, so there was no indication of a seismic unrest process. Seismicity and deformation use different timescales. Deformation changes are slow (Rosado et al. Reference Rosado, Fernández-Ros, Berrocoso, Prates, Gárate, De Gil and Geyer2019), potentially developing over several years, but they appear earlier than seismicity and therefore are often taken as indicators of long-/medium-term volcanic activity. Seismicity, on the other hand, tends to vary abruptly during a volcanic process, and it is a more suitable indicator of short-term volcanic activity. This situation of rapid and sustained deformation, accompanied by a high level of seismicity of low energy, remained until the end of the survey.
2020–2021 survey
The execution of the BASE opening protocol for this survey was different from the other surveys due to two issues. The main issue was the closure of a previous survey with a yellow volcanic alert level as a consequence of an unusual increase in deformation parameters. In addition, an intense seismic swarm had been occurring near King George Island since late August 2020. In addition, seismic information from the winter seismic station of the base had not been available since 5 January 2021 due to communication problems with the satellite. Entry to Port Foster was under discussion, and for these reasons two seismic stations were installed at Lobera beach on 21 January to monitor seismic activity of the volcano; meanwhile, the vessel Sarmiento de Gamboa was forced to remain outside Deception Island, near the Neptune Bellows. These seismic stations registered data until 23 January. The data analysed permitted the entry of the vessel into Foster Bay. Later, the vessel proceeded to deploy GPS stations to evaluate the state of deformation of the volcano. In summary, the registered seismic activity showed similar patterns to the previous survey (Figs 4 & 5), with a dominance of LP events and some VT events, highlighting the presence of regional earthquakes in the north-east of the Bransfield Strait (Fig. 6). It was observed that the accelerated deformation process, which started at the beginning of the 2019 survey, had stopped, leading to a state of relaxation of the volcanic system. These conclusions led to a change in the volcanic alert level from yellow to green. This was confirmed by Comité Polar Español (CPE) on 2 February. From that point on, the level of seismicity remained lower than that observed during the preceding three surveys (Fig. 13).

Figure 13. Epicentral map of the earthquake locations localized during the 2020–2021 monitoring survey. The symbol sizes represent the earthquake magnitudes and the colours indicate the origin times. (Bottom) Zoomed-in image of Deception Island from the top map. The symbol sizes represent the earthquake magnitudes and the colours indicate the source depths.
LP activity remained dominant at Deception Island volcano, with OBS being the seismic station recording the greatest number of events, followed by FUM. In this survey, many of these events were also detected at C70, probably due to the increase in the energy released by the degasification process near OBS. Two peaks of short duration (< 10 s) and of 3–4 Hz of monochromatic frequency were detected at OBS. One of them was also registered at FUM, probably related to active fluid systems at FUM and OBS. In general, most of the detected LP events presented monochromatic frequencies of ~3 Hz. These types of low-frequency LP event were the most characteristic of Deception Island volcano until the 2009–2010 survey started to detect monochromatic LP events of higher frequencies of up to 8 Hz. HLP events are probably produced by change in the size of fluid-filled cracks or by changes to the fluid composition. In this survey, the number of these events was very low. A similar pattern of TR and HB event activity compared to previous surveys was detected.
Notably, two small VT seismic swarms were detected, mainly at C70. The largest of these events was also registered at PEN, RON and OBS, enabling its localization to the north and east, beyond of the island itself (Fig. 13).
Furthermore, a large number of regional earthquakes were also detected, belonging to the seismic swarm in the area of Orca volcano, north-east of the Bransfield Strait, which extended east of the Bransfield Strait in 23 January, where a significant earthquake occurred (6.9 moment magnitude (Mw), USGS catalogue). Only a few of these events were available for location (Fig. 13).
2021–2022 survey
The seismic activity detected during the 2021–2022 survey was of an average level, in the order of the previous 2020–2021 survey (Figs 4 & 5). The volcanic level alert was not changed, remaining at the green level at all times during the operation of BASE.
The type of events observed were very similar to those in previous years, with the presence of mainly LP volcanic events and VT events in all campaigns. The activity of the VT events was moderate, with most of them having been detected at C70, as in previous campaigns. This type of activity appeared in the form of seismic swarms, as a consequence of a destabilization of the Bransfield Rift fault system. This type of VT activity occurred offshore, to the north-east, 8–10 km from the coast, between Deception Island and Livingston Island. Most of these events could not be localized because they were only detected at C70 and occasionally at OBS, complicating the use of location techniques. Two swarms were detected: one on 4 January and the other on 12 and 13 January (Fig. 14).
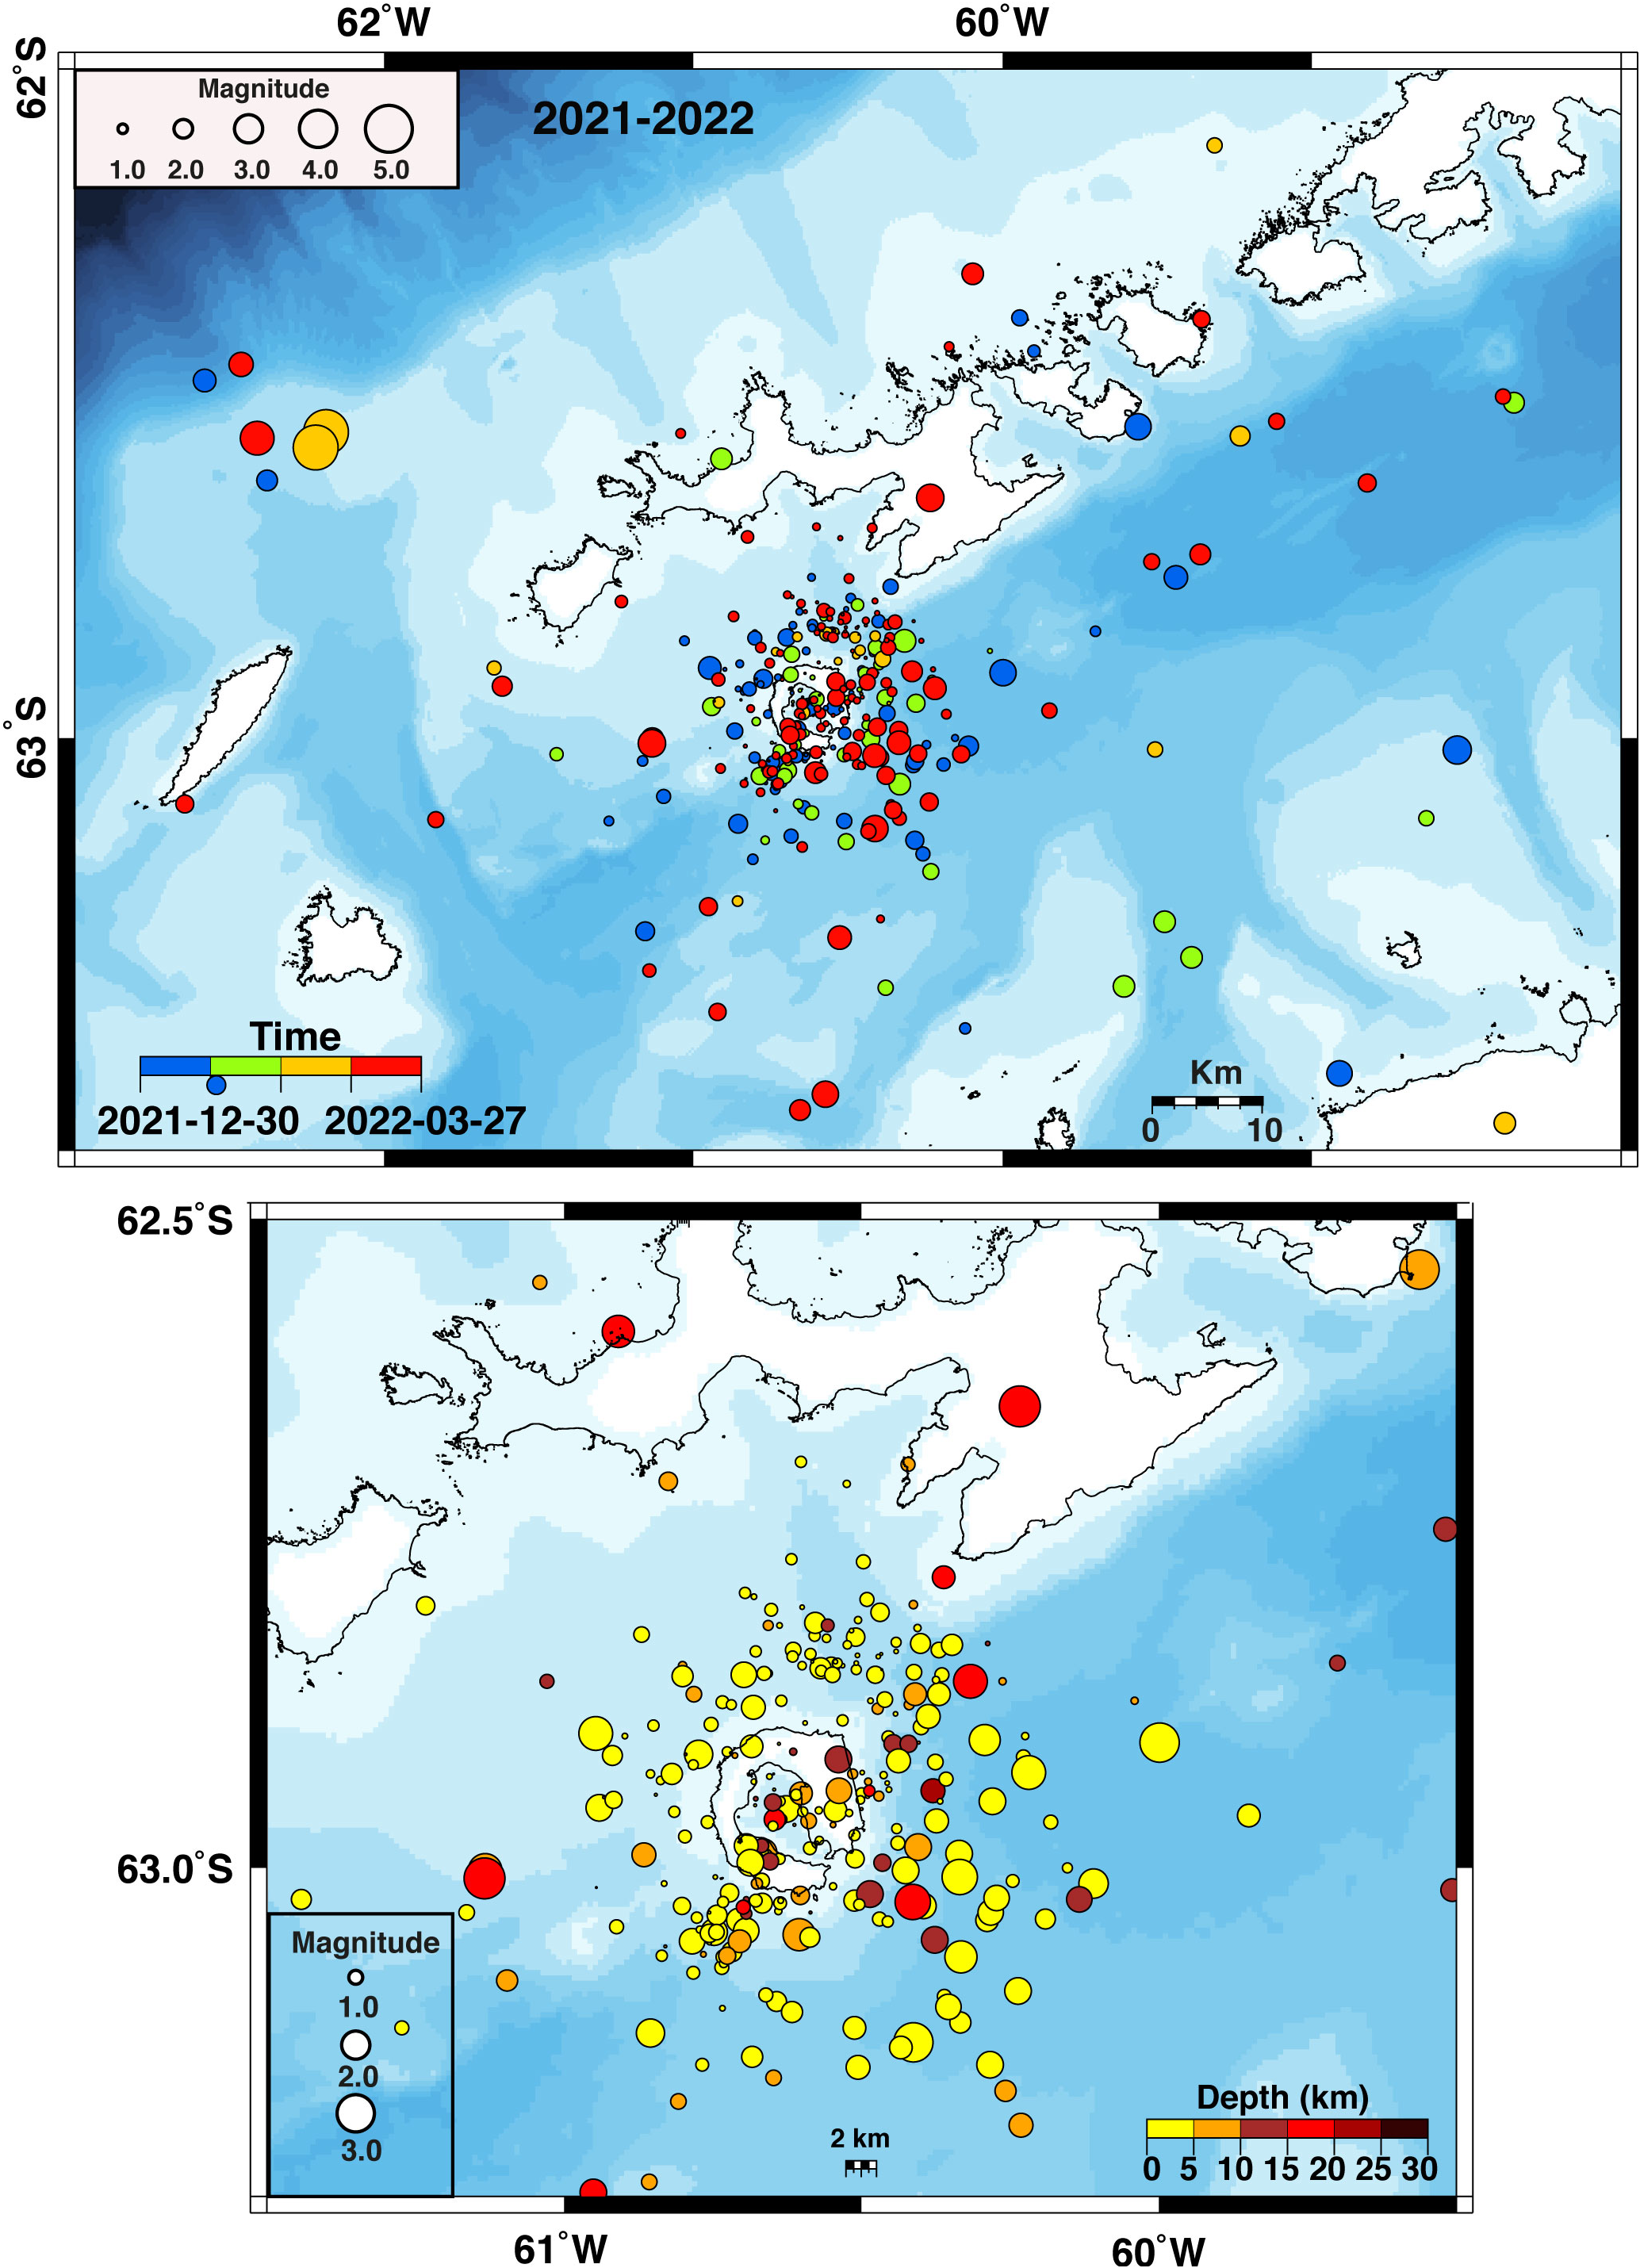
Figure 14. Epicentral map of the earthquake locations localized during the 2021–2022 monitoring survey. The symbol sizes represent the earthquake magnitudes and the colours indicate the origin times. (Bottom) Zoomed-in image of Deception Island from the top map. The symbol sizes represent the earthquake magnitudes and the colours indicate the source depths.
The volcanic activity of the LP events was recorded mainly at OBS and FUM, where some of the most important hydrothermal systems of the island are located. This activity has been observed since seismic records have been kept at these seismic stations.
The main difference in seismic activity compared to the preceding year was the large number of regional earthquakes detected at all of the stations. This increase was due, on the one hand, to the Bransfield Strait seismic series that began in August 2020 and was still active, although with reduced incidence, and, on the other hand, the series that began on 23 January 2021 in the nearby area of Elephant Island, with a main earthquake of magnitude 6.9.
Seismic crises
In recent decades, Deception Island has experienced at least four episodes of intense seismic activity: during 1992 (Ortiz et al. Reference Ortiz, García, Aparicio, Blanco, Felpeto, Del Rey and Ricci1997), 1999 (Ibáñez et al. Reference Ibáñez, Carmona, Almendros, Saccorotti, Del Pezzo, Abril and Ortiz2003b), 2015 (Almendros et al. Reference Almendros, Carmona, Jiménez-Morales, Díaz-Moreno and Lorenzo2018) and 2020 (Carmona et al. Reference Carmona, De Gil, Jiménez-Morales, Rosado, Serrano and Fernández-Ros2024).
1992 crisis
Between 21 December 1991 and 23 February 1992, 766 seismic events were recorded on Deception Island, although the island had previously exhibited low seismic activity. Most of these events had magnitudes between 0.8 and 2.0, although there were four felt events, three over magnitude 3 and one reaching magnitude 3.4. Many of the earthquakes occurred in swarms lasting several days, often followed by similar events within 1 h. During 9 and 10 January 1992, over 150 events occurred near Deception Base (Argentinian base), probably linked to increased fumarolic activity. Further seismic swarms occurred on 18–19 January and 2 February 1992. The seismic activity gradually decreased by late February 1992, returning to pre-1992 levels. Although the precise origin of these events is unclear, available analyses suggested it was located beneath FUM, ~2–3 km from the coast (Ortiz et al. Reference Ortiz, García, Aparicio, Blanco, Felpeto, Del Rey and Ricci1997). Other signs of volcanic instability, such as increased ground temperature near FUM and Cerro Caliente, were observed. Ortiz et al. (Reference Ortiz, García, Aparicio, Blanco, Felpeto, Del Rey and Ricci1997) suggested that these phenomena were caused by a magma intrusion beneath Deception Island, explaining the observed seismicity, deformation, gravity changes, magnetic anomalies and alterations to the fumarole and hydrothermal systems.
1999 crisis
During the 1998–1999 campaign, there was a significant increase in seismic activity, with 3643 events recorded, including 2072 VT earthquakes, 1556 LP events and 15 HB events (Ibáñez et al. Reference Ibáñez, Carmona, Almendros, Saccorotti, Del Pezzo, Abril and Ortiz2003b). Two earthquakes with magnitudes of 2.8 and 3.4 occurred in January 1999, being felt by people at BASE. A total of 863 VT earthquakes were successfully located using array techniques and ray-tracing methods (Ibáñez et al. Reference Ibáñez, Del Pezzo, Almendros, La Rocca, Alguacil, Ortiz and García2000, Saccorotti et al. Reference Saccorotti, Almendros, Carmona, Ibañez and Del Pezzo2001). The majority of these VT events were located near the seismic antenna at depths of ~2 km, showing alignments in the N45°E and N80°E directions. LP events and volcanic tremors were analysed in different frequency bands, indicating hydrothermal origins unrelated to VT events. Further studies revealed that the 1999 series was influenced by regional tectonics, with magma chamber reactivation probably causing the destabilization (Carmona et al. Reference Carmona, Almendros, Peña and Ibáñez2010). The 1999 crisis consisted primarily of small-magnitude earthquakes, occurring continuously over 1.5 months and located at shallow depths (< 4 km) within the caldera, mainly along a WSW-ENE trend parallel to the Bransfield Rift.
2015 crisis
During the 2014–2015 survey, an intense seismic swarm occurred near Livingston Island, with ~9000 earthquakes detected over an 8 month period. The swarm began in early September 2014, following some precursory seismicity in August (Almendros et al. Reference Almendros, Carmona, Jiménez-Morales, Díaz-Moreno and Lorenzo2018). The largest earthquakes (up to magnitude 4.6) and earthquake rates (up to ~180 events per day) occurred early in the series (September–October). There were two major phases of earthquake occurrence during September, although further large earthquakes were also recorded in October. After September, the number of earthquakes declined slowly over time, with occasional additional bursts of activity. The seismicity lasted for 8 months, until it faded away in April–May 2015. Seismic network recordings on Deception Island during a 2.5 month survey enabled the localization of a small part of the series. The results identified a source region near the eastern end of Livingston Island (Fig. 6). The 2015 crisis had higher-magnitude earthquakes than the 1992 and 1999 crises. They were located in deeper areas (< 10 km), with epicentres distributed around Deception Island, at distances up to 30 km. In addition, distal VT seismicity (~35 km) was detected south-east of Livingston Island months before the start of the 2015 series. A deep magmatic intrusion on Deception Island may have triggered both the Livingston Island series and the Deception Island VT activity (Almendros et al. Reference Almendros, Carmona, Jiménez-Morales, Díaz-Moreno and Lorenzo2018, Moreno & Almendros Reference Moreno-Vacas and Almendros2021).
2020 crisis
After the 2015 crisis, there was initially a decrease in seismic activity between the 2015–2016 and 2016–2017 surveys, before an increase in seismic activity began from the 2017–2018 survey, until it reached a peak in the 2019–2020 survey (Fig. 13). This peak coincided with anomalous deformation values during this campaign (Carmona et al. Reference Carmona, De Gil, Jiménez-Morales, Rosado, Serrano and Fernández-Ros2024). From the beginning of the survey, a very high deformation rate was observed, especially between the BASE and PEN stations. This anomalous deformation rate remained approximately constant over the whole survey. As a consequence of this anomalous data, at the end of January the volcanic alert level was changed from green to yellow. Seismicity remained at high levels throughout the survey but at low energy, without an indication of volcanic reactivation. Timescales in deformation changes are slow, but such changes appear early, so they are usually taken as an indicator of long-/medium-term volcanic activity. In contrast, seismicity usually varies abruptly during volcanic processes and is a more appropriate indicator of short-term volcanic activity. This situation of rapid and sustained deformation, accompanied by high-rate and low-energy seismicity, was maintained until the end of the survey, with the closure of the base and the volcanic alert level remaining at yellow.
The 2020 crisis shows different characteristics from the three previous episodes recorded on Deception Island. The previous crises could all be related to magmatic intrusions beneath the volcano, altering the state of stress and triggering the occurrence of VT seismicity in the fragile volume of the volcanic edifice. The 1992 and 1999 crises were caused by a shallow intrusion of small volume over a short period of time, whereas the 2015 series was the product of a deeper magmatic intrusion of large volume and long duration (Almendros et al. Reference Almendros, Carmona, Jiménez-Morales, Díaz-Moreno and Lorenzo2018, Moreno & Almendros Reference Moreno-Vacas and Almendros2021). In turn, the 2020 crisis could be related to a much larger, regional deformation event that occurred at the South Shetland Islands with the massive earthquake swarm in the area of the Orca volcano, culminating in two Mw 5.8 and 5.9 earthquakes at ~10 km depth (Parera-Portell et al. Reference Parera-Portell, Mancilla, Almendros, Morales and Stich2023). Earthquake swarms and deformation events have also been attributed to a magmatic dike intrusion in the north-east Bransfield Strait (Cesca et al. Reference Cesca, Sugan, Rudzinski, Vajedian, Niemz and Plank2022).
Origin of the seismicity
Since 1994 and until 2022, the IAG-UGR has carried out surveillance of Deception Island volcano through real-time monitoring and seismic analysis during the summer operation of BASE. This volcanic monitoring has been realized in collaboration with the University of Cadiz, which has analysed the volcanic and tectonic deformation of the island. Over these years, monitoring of the volcano has enabled a reference level to be obtained regarding the seismic and deformation parameters necessary to establish the level of volcanic alert during the BAE operation protocol and in case of reactivation of the volcano. From 2022 to 2023, the National Geographic Institute (IGN) was responsible for seismic and deformation monitoring of the volcano.
The level of seismicity of Deception Island volcano was highly variable and ranged from rest periods to intense seismic swarms (Vila et al. Reference Vila, Martí, Ortiz, García and Correig1992, Ibáñez et al. Reference Ibáñez, Carmona, Almendros, Saccorotti, Del Pezzo, Abril and Ortiz2003b, Carmona et al. Reference Carmona, Almendros, Martín, Serrano, Stich and Ibáñez2012, Almendros et al. Reference Almendros, Carmona, Jiménez-Morales, Díaz-Moreno and Lorenzo2018, Carmona et al. Reference Carmona, De Gil, Jiménez-Morales, Rosado, Serrano and Fernández-Ros2024).
The seismic activity of Deception Island is determined by the volcano morphology (Smellie et al. Reference Smellie, López-Martínez, Headland, Hernández-Cifuentes, Maestro and Millar2002) along the regional tectonics of the Bransfield Strait (Almendros et al. Reference Almendros, Carmona, Jiménez-Morales, Díaz-Moreno and Lorenzo2018). A shallow magmatic chamber, aquifers fed by glaciers, barometric variations due to the geographical location and regional and local active faults influence the generation of seismic signals. We identified two main types of seismic signals produced by the volcano: VT events (earthquakes generated by fractures inside the volcanic edifice in response to changes in the stress distribution) and LP seismicity related to the interaction of shallow aquifers with high-temperature rocks where resonances in cracks are excited by exploding or imploding steam bubbles (Almendros et al. Reference Almendros, Ibáñez, Alguacil, Del Pezzo and Ortiz1997), including LP, TR and HB events.
During these surveys, the seismic activity was evaluated through the analysis of the number of seismic signals from the volcano. The number of VT events was the parameter used to distinguish between active or low-activity surveys. This temporal distribution showed two different patterns. In some surveys, such as from 2011 to 2014, VT events occurred in a uniform manner and with low frequency. However, in others, such as those surveys after 2014, periods of high activity could last from a few days to months. These two patterns could be the result of different processes possibly related to regional stresses or caused by the internal volcanic dynamics of the island.
The analysis of seismic activity during the 2011–2022 period presents similar characteristics as the 1998–2011 period (Carmona et al. Reference Carmona, Almendros, Martín, Serrano, Stich and Ibáñez2012). Over this earlier period, it was found that there was no direct relationship between surveys with many VT events and others with many LP events, as in the 1999 crisis (Ibáñez et al. Reference Ibáñez, Carmona, Almendros, Saccorotti, Del Pezzo, Abril and Ortiz2003b). Moreover, the zone of origin of LP events was not the same as that of VT events. Histograms show how the low number of VT events coincides with the low number of LP events, and the same could be observed for when the activity was high. One possible cause of this relationship between VT, LP and tremor events could be the sealing of small fractures in the aquifer zones. According to Caselli et al. (Reference Caselli, Badi, Bonatto, Bengoa, Agusto, Bidone and Ibáñez2007), when a certain pressure is reached, small local VT events occur due to the activation of microfractures. When microfractures open again and become active, the frequency of VT events is reduced, leading to the occurrence of LP volcanic events caused by the release of gasses to the surface. This does not necessarily mean that VT and LP events occur in the same zone. Sealed cracks could gradually release energy, producing volcanic seismicity over an extended period. This may explain why some events decreased, such as during the 2013–2014 survey, and then increased in the next survey, such as during the 2014–2015 survey.
VT events are generated by fractures within the volcanic edifice that have been destabilized by stress from tectonic and volcanic activity in the Bransfield Strait. These VT events are produced by faults as small as 100 m in length generating microseismicity (Carmona et al. Reference Carmona, Almendros, Peña and Ibáñez2010). This activity can be generated by three types of mechanism. The first involves the presence of the magma chamber, which destabilizes the heterogeneous system of the surface faults. This destabilization could be caused by the release of volatiles from the magma, which would alter the flow conditions in the conduits, generating a decompression of the magmatic system (Álvarez-Valero et al. Reference Álvarez-Valero, Sumino, Caracausi, Polo, Geyer and Borrajo2022). This decompression would, at the same time, produce a misalignment in the microfault system (Trasatti et al. Reference Trasatti, Acocella, Di Vito, Del Gaudio, Weber and Aquino2019). Another cause could be the surface deformation induced by a magmatic intrusion such as the 1992, 1999 and 2015 seismic crises (Ibáñez et al. Reference Ibáñez, Almendros, Carmona, Martínez-Arévalo and Abril2003a, Almendros et al. Reference Almendros, Carmona, Jiménez-Morales, Díaz-Moreno and Lorenzo2018), with average radial and vertical deformations of 2.1 and 2.6 cm/year during 1992 crisis and of 5.2 and 5.5 cm/year during the 1999 crisis, respectively, as well as a 2.3 cm/year radial average subsidence during the 2015 crisis (Rosado et al. Reference Rosado, Fernández-Ros, Berrocoso, Prates, Gárate, De Gil and Geyer2019). The second mechanism could be the partial sealing of aquifers leading to a pressure build-up in small faults (Caselli et al. Reference Caselli, Badi, Bonatto, Bengoa, Agusto, Bidone and Ibáñez2007). The third mechanism could be via the interaction of regional stress leading to a destabilization of microfractures. The first mechanism would imply a large number of VT events, as in the 1992, 1999 and 2015 crises. However, the last two mechanisms would lead to moderate VT event activity, as occurred during most of the surveys (Fig. 13).
LP seismicity on Deception Island is generated by the presence of driven fluids in conduits and by the presence of a magmatic chamber that could perturb the system. Meltwater could seep through preexisting fractures and cause imbalances with the hot materials. This could cause a phase change, triggering seismic signals, and the resonance produced would generate the rest of the low-frequency signals (LP events). The increase in pressure due to the expulsion of magmatic gasses would produce a disturbance in the walls of those conduits where these fluids are found. Two kinds of frequencies would therefore appear: one due to the disturbance and the other due to the lower-frequency resonance, which will depend on the structure of the conduit (Petrosino & Cusano Reference Petrosino and Cusano2020, Cadena & Sánchez Reference Cadena and Sánchez2022). However, this disturbance could be of non-volcanic origin due to changes in barometric pressure, in the form of baroseismics (i.e. seismic movement due to strong changes in atmospheric pressure). Such baroseismics could create misalignments in the aquifers, generating pressure changes and thus causing disturbances in the cavities, producing LP swarms and tremor episodes periodically (Stich et al. Reference Stich, Almendros, Jiménez, Mancilla and Carmona2011).
The array analysis of this survey shows high values of slowness (between 2 and 3 s/km), indicating that the source is very shallow, at only hundreds of metres. They still have frequencies centred around 3–5 Hz, as occurred in surveys prior to 2011 (Carmona et al. Reference Carmona, Almendros, Martín, Serrano, Stich and Ibáñez2012). However, in the more recent surveys, especially from 2018 to 2019 onwards, LP events with frequencies higher than 5 Hz appeared. This type of LP event was already detected in the 2009–2010 survey at ~8 Hz. The presence of these events with frequencies higher than 5 Hz would indicate that the conduits where the fluids are confined had undergone structural changes, generating resonance frequencies. Another possibility is a change in the chemical composition of the fluids in the fluid-filled cracks (Kumagai & Chouet Reference Kumagai and Chouet1999).
Several types of models have been considered to explain the generation of tremors: movements related to the magma chamber, excitation and resonance of fluid-filled cracks (e.g. Kumagai & Chouet Reference Kumagai and Chouet2000), fluid flow-induced oscillations (e.g. Julian Reference Julian1994) or oscillations of the volcanic plumbing system (Konstantinou & Schlindwein Reference Konstantinou and Schlindwein2003 ). Shallow tremors can be produced by bubble growth or collapse due to hydrothermal boiling of groundwater (e.g. Leet Reference Leet1988), periodic pressure oscillations emerging spontaneously beneath permeable media (e.g. fractured magma caps; Girona et al. Reference Girona, Caudron and Huber2019) or hydrothermal flow instability (Fujita Reference Fujita2008). Previous studies on Deception island, using the seismic array in FUM, described three types of tremor according to their spectral features (Ibañez et al. Reference Ibáñez, Del Pezzo, Almendros, La Rocca, Alguacil, Ortiz and García2000): 1) a low-frequency tremor, with a spectral peak between 1 and 2 Hz, 2) a spasmodic tremor, with a rough envelope and broader spectral content with two predominant bands (2–3 and 4–8 Hz) and 3) a quasi-monochromatic tremor, with a peak of ~3 Hz and sporadic secondary peaks. These tremors, along with other seismo-volcanic signals observed (VT, LP and HB events), were related to a common source: a shallow fluid-filled crack system at a depth of some hundreds of metres close to the array site (Fig. 3) and interpreted as a stable stationary geothermal process.
A more recent study, including long-term data, presented long-duration tremors related to large-amplitude oceanic microseismics. These tremors can induce external forcing and introduce pressure variations into the hydrothermal volcanic fluids (Jiménez-Morales et al. Reference Jiménez-Morales, Almendros and Carmona2017).
In some cases, LP events with an initial high-frequency energetic onset may be mistaken for HB events. Although the low-frequency signature is originated in both cases by the resonance of a fluid-filled cavity, in the case of HB events the initial pressure step that triggers the resonance is caused by a brittle failure process (Ibáñez et al. Reference Ibáñez, Almendros, Carmona, Martínez-Arévalo and Abril2003a). The number of HB events in the 2011–2022 period was very low compared to VT and LP events. This pattern has been maintained since 1994. However, the 2015–2016 and 2019–2020 surveys recorded a high number of HB events. In this last survey, it was possible to analyse these events using array techniques, obtaining maximum slowness values of 0.6 s/km and an azimuth direction of the source of between 50° and 55° from the centre of the array located in FUM. This would indicate that these HB events originated in a nearby area between the RON and CHI huts, which also coincides with the first signal arrival to RON and CHI.
During the analysis of these surveys, ice signals were been detected, such as IQs and SP events, due to the presence of glaciers and permafrost on the island. These types of events are generated especially during the warmer months, although they have also been found to occur during the winter months (Jiménez-Morales et al. Reference Jiménez-Morales, Almendros and Carmona2022). SP events are more numerous than IQ events and are associated with microfractures of the glacier or even of the permafrost, especially during the ice-melting seasons. Unlike IQ events, they have very high frequencies and durations of 2–3 s. Such glacial seismicity has been detected during all of the recent surveys thanks to the incorporation of stations (RON and COL) very close to the largest glaciers of Deception Island, such as the Black Glacier.
The seismic activity analysed during the 2011–2022 period could be divided into several distinct periods depending on level of activity (Figs 4 & 5 & Table II). During the first period, from the 2011–2012 to 2013–2014 surveys, the activity was low to moderate. The number of VT, LP and tremor events was maintained at a similar level to surveys prior to the 1999 seismic crisis (Figs 4 & 5). During this period, the state of the volcano could be considered stable and at rest. The second period occurred during the 2014–2015 survey, when an intense seismic series originated in Livingston Island and generated a swarm of VT events around Deception Island (Almendros et al. Reference Almendros, Carmona, Jiménez-Morales, Díaz-Moreno and Lorenzo2018, Moreno-Vacas & Almendros Reference Moreno-Vacas and Almendros2021). The stress produced by these regional earthquakes could have induced overpressure in the fault system of the volcano edifice and provoked the VT swarm. Therefore, the seismic swarm of Livingston Island as well as the Deception Island seismic swarm could have originated from magmatic intrusion, as occurred in the 1992 and 1999 seismic series, without reaching the surface (Ibañez et al. Reference Ibáñez, Almendros, Carmona, Martínez-Arévalo and Abril2003a, Almendros et al. Reference Almendros, Carmona, Jiménez-Morales, Díaz-Moreno and Lorenzo2018, Geyer et al. Reference Geyer, Pedrazzi, Almendros, Berrocoso, López-martínez, Maestro, Smellie, Panter and Geyer2021, Moreno-Vacas & Almendros Reference Moreno-Vacas and Almendros2021). These cases of magmatic intrusion could be called ‘failed eruptions’ (Morán et al. Reference Moran, Newhall and Roman2011). Analysis of the 1999 series showed that the magmatic intrusion was shallow (at only 4 km depth), small in volume and short in duration, whereas the 2015 series was deeper (up to 10 km depth), large in volume and long in duration (Moreno-Vacas & Almendros Reference Moreno-Vacas and Almendros2021). The Livingston Island series could be an example of a distal swarm triggering Deception Island VT events, as is common in long-inactive volcanoes and prior to a magmatic intrusion (White & McCausland Reference White and McCausland2019 , Coulon et al. Reference Coulon, Hsieh, White, Lowenstern and Ingebritsen2017). This high VT activity led to a change in the volcanic alert level from green to yellow in February 2015 for ~1 week, until the alert level was returned to green due to a decrease in seismic activity (Fig. 13). The 2015 ‘failed eruption’ must have contributed to raising a significant volume of deeper magma to shallower levels, which may have increased the amount of magma in the shallow conduit system (Moreno-Vacas & Almendros Reference Moreno-Vacas and Almendros2021).
The next period includes the 2015–2016, 2016–2017 and 2017–2018 surveys, during which the level of seismic activity decreased with respect to 2015 (Figs 4 & 5 & Table II). During these surveys, the level of activity was high, but without reaching the level of 2015. The activity levels during these three surveys were very similar, with LP activity in the form of LP events and episodes of tremors and VT events, especially in the areas of C70 and CHI, coinciding with the activity of previous surveys (Carmona et al. Reference Carmona, Almendros, Martín, Serrano, Stich and Ibáñez2012). It is worth noting that, in the 2017–2018 survey, important tremor episodes were registered, which could have been the beginning of a destabilization process in the hydrothermal system affecting the following surveys.
The fourth notable period occurred during the 2018–2019 and 2019–2020 surveys (Figs 13 & 14 & Table II). During these surveys, the seismicity increased with respect to the previous period, with high levels of VT and LP events in the form of swarms. But the main difference during these surveys was the large number of tremor episodes, with frequencies centred between 2 and 5 Hz and between 6 and 8 Hz. The duration of the tremors was variable, ranging from a few minutes to more than 20 h. Although this activity was very local, it was detected mainly at the BASE station only. The tremor episodes during these two campaigns coincided with the presence of HLP events of > 5 Hz and HB events. This could indicate changes in the conduits and further destabilization of the hydrothermal system. All of this seismic activity coincided with an abrupt increase in deformation between the BASE and Pendulum Cove observed by the University of Cadiz in the middle of the 2019–2020 survey (Carmona et al. Reference Carmona, De Gil, Jiménez-Morales, Rosado, Serrano and Fernández-Ros2024). This increase in deformation led to a change in the volcanic alert level from green to yellow, which was maintained until the following survey (2020–2021), after the opening of BASE and the verification that the values of the deformation decreased significantly and seismic activity remained at normal levels. Although seismic activity remained high in energetic terms, with the occurrence of low-magnitude VT events, the seismicity was not considered as an anomalous parameter necessitating a change to the level alert, as was the case with the previously recorded deformation. Seismic activity and deformation in active volcanoes such as that on Deception Island have always been related. A previous analysis of GPS time series from between 1991 and 2018 on Deception Island showed that high levels of seismicity coincided with phases of inflation and uplift, as occurred during the 1992, 1999 and 2015 crises, whereas periods of low activity coincided with phases of deflation (Rosado et al. Reference Rosado, Fernández-Ros, Berrocoso, Prates, Gárate, De Gil and Geyer2019).
The last period analysed includes the 2020–2021 and 2021–2022 surveys, during which the seismic activity decreased significantly to moderate values. The operation of BASE was unusual because it was carried out under a yellow volcanic alert level following the ending of the previous survey due to the deformation parameter. In addition, an intense seismic series developed at the end of August 2020 in the outer region of King George Island (Cesca et al. Reference Cesca, Sugan, Rudzinski, Vajedian, Niemz and Plank2022), near the Orca submarine volcano. These two events led to a special operation protocol being enacted in January 2021. After the analysis during the operation protocol, the conclusions were 1) that the recorded seismic activity showed the same pattern as in previous surveys, with a predominance of LP and VT events, highlighting the presence of regional earthquakes located in the north-east zone of the Bransfield Rift near Orca volcano, and 2) that the accelerated process observed in the deformation parameter during the previous survey had decreased considerably and led to an extraordinary relaxation of the volcanic system. These conclusions led to a change of the volcanic alert level from yellow to green, which was suggested and confirmed by the Spanish Polar Committee on 2 February 2020. From that day until the closure of the BAE, seismic activity remained at low levels compared to previous surveys. One notable feature during this period was the huge number of regional earthquakes of the Orca series, and another was the presence of two small seismic series of VT events in the north and east area, both in the outer part of King George Island. The following survey (2021–2022) recorded at very similar seismicity levels to the previous one. In these two surveys, there was a decrease in the number LP events and tremor episodes compared to the 2018–2019 and 2020–2021 surveys. This indicates that Deception Island had entered a quiet state of moderate activity similar to what happened after the three previous seismic crises.
Conclusions
This work has analysed the seismic activity from 2011 to 2022 during the summer and operational months of the Spanish Antarctic bases. Thanks to this work by the IAG-UGR and the deformation studies conducted by the University of Cadiz, we have been able to establish parameters that can provide information regarding the state of Deception Island in a quantitative way for the monitoring of this volcano. In this way, a volcanic alert level has been established to clearly and simply establish the state of the island. For this volcanic alert level, different measurement parameters from various geophysical disciplines are used, among which seismicity and deformation play an important role. In addition, a protocol has been created for the operation of BASE at the beginning of a survey, including the assumption that BAE can operate under a yellow volcanic alert level regarding either of the seismic or deformation parameters.
In the three volcanic reactivation crises of 1992, 1999 and 2015, the number of VT events increased considerably, but the number of LP events was not sufficiently decisive to declare a volcanic reactivation. Therefore, it is possible to consider two regimes that mark the state of the Deception Island volcano. The first one, called ‘dormant’, is that which has been the case for most of the campaigns since 1994, with the occurrence of LP seismicity, sometimes with episodes of low-energy tremors generated by the circulation of fluids in the hydrothermal system and the presence of VT and even HB events. Deception Island has been in this dormant state during the campaigns following the 1999 crisis until the 2015 crisis.
The second state, called ‘unrest’, shows a high number of VT events, sometimes energetic, and the presence of LP events and tremor episodes with sufficient energy to be detected at several stations at the same time. This state has been related to huge misalignment of the brittle system caused by possible magmatic intrusion without such magma reaching the surface, as happened in the crises of 1992, 1999 and 2015. After this last crisis, the level of seismic activity in terms of VT, LP and tremor events remained very high until the 2019–2020 survey, when there was a high rate of increase in the deformation parameter, especially between the GPS stations at BASE and PEN. This led to a change to the volcanic alert level from green to yellow for the deformation parameter, without the seismic activity parameter being triggered due to the low energy of the VT events. Since the 2019–2020 survey, the level of seismic activity has remained at moderate levels, suggesting that Deception Island has returned to a dormant state.
Since the volcanic crisis of 2020, Deception Island is currently in a ‘dormant’ state, according to both ways of estimating volcanic activity. However, as one of the most active volcanoes in Antarctica, and with it having had recent destructive eruptions, it is still very important to monitor it for future volcanic reactivations.
Acknowledgements
We are grateful to the Spanish Polar Committee, Spanish Army, Spanish Navy and Marine Technology Unit of the Spanish Council for Scientific Research for providing logistical support for these research activities in Antarctica. We also thank all participants in the surveys of the Andalusian Institute of Geophysics of the University of Granada from 2011 to 2022: Rafael Abella, J. Félix Agüí, F. Javier Almendros, Oier Ardanaz, Enrique Carmona, David Crespo, Alejandro Díaz, Iván Fernández, Itahisa González, Vanessa Jiménez, Jose Ángel López, Francisco Lorenzo, Rosa Martín, Jose Benito Martín, Alejandro Moreno, Alfonso Ontiveros, Jose A. Peña, Joan Perera, Janire Prudencio, Inmaculada Serrano, Levín Streit, Teresa Teixidó, Manuel Titos, Federico Torcal and Luis Vizcaíno. Bathymetry data are from GMRTv.2 (Ryan et al. Reference Ryan, Carbotte, Coplan, O'Hara, Melkonian and Arko2009). Coastlines are from SCAR Antarctic Digital Database (Gerrish et al. Reference Gerrish, Fretwell and Cooper2020). Maps are plotted with GMT (https://www.generic-mapping-tools.org). We thank the reviewers of the article, especially Ivan Melchor, for their suggestions, which greatly improved the quality of the article. To Andrés Barbosa and Manuel Catalán, exceptional scientists and the best people and friends.
Availability of data and material
Data are available from the Spanish National Polar Data Centre (CNDP): http://cndp.utm.csic.es/portal/.
Financial support
This work was partially funded by the Spanish Ministry of Economy through projects POL2006-08663, CTM2009-08085, CTM2010-11740 and CTM2011-16049 and by Assignment IGME-1198 for Supporting Activities to the Spanish Polar Committee. Additional support comes from project CTM2016-77315-R. Funding for the open-access charge was provided by Universidad de Granada/CBUA.
Competing interests
The authors declare none.
Author contributions
Conceptualization: Enrique Carmona, Rosa Martín, F. Javier Almendros. Data curation: Enrique Carmona, Rosa Martín, Vanessa Jiménez-Morales, Inmaculada Serrano, Daniel Stich, Rafael Abella. Funding acquisition: F. Javier Almendros, Inmaculada Serrano, Daniel Stich. Supervision: Daniel Stich. Writing - original draft: Enrique Carmona, Rosa Martín. Writing - review & editing: Enrique Carmona, Rosa Martín, Vanessa Jiménez-Morales, Inmaculada Serrano, Daniel Stich, Rafael Abella.


 Open access