I. INTRODUCTION
Speech enhancement is a focused topic in the speech signal-processing area. The noise reduction or noise masking is often concerned in the speech enhancement. They aim to remove or mask a certain amount of background noise from noisy speech and make the enhanced speech have a better quality and a higher intelligibility. A lower speech intelligibility in the background noise remains a major complaint of the comfort and hearing fatigue by listeners. Although the state-of-the-art monaural speech enhancement algorithms have achieved an appreciable suppression of the noise and improved speech quality certainly, it is still a challenge for them, thus far, to improve the intelligibility of noise-degraded speech.
Monaural speech enhancement, i.e., speech enhancement from single-microphone recordings, is particularly challenging due to an infinite number of solutions. From the application point of view, monaural speech enhancement is perhaps most desirable compared with multi-microphone solutions, since a monaural system is less sensitive to room reverberation and spatial source configuration. In the past several decades, many monaural speech enhancement methods have been proposed, such as spectral-subtraction [Reference Boll1,Reference Li and Liu2], Wiener filtering [Reference Loizou3], and statistical-model-based methods [Reference Ephraim and Malah4] enhanced in the frequency domain. These approaches are more suitable to handle the stationary noise (e.g., white or car noise) rather than non-stationary noise (e.g., babble and street noises). The musical noise and vacuum feeling are usually caused by these typical methods. In the face of these problems, a very effective de-nosing method [Reference Erkelens, Hendriks, Heusdens and Jensen5] was proposed with Generalized Gamma Prior (GammaPrior), which was extended from the minimum mean-square error (MMSE) estimation of discrete Fourier transform (DFT) magnitude. In this method, two classes of generalized Gamma distributions were adopted for the complex-valued DFT coefficients. The better performance on subjective and objective tests was achieved compared with typical Wiener filter and statistical-model-based methods. Zoghlami proposed an enhancement approach [Reference Zoghlami, Lachiri and Ellouze6] for noise reduction based on non-uniform multi-band analysis. The noisy signal spectral band is divided into subbands using a gammatone filterbank, and the sub-bands signals were individually weighted according to the power spectral subtraction technique and the Ephraim and Malah's spectral attenuation algorithm. This method is a kind of sub-band spectral subtraction or Wiener filter method.
However, the difficulties of non-stationary noise are still not solved very well based on the above methods. Thus, the baseline Hidden Markov Models (HMMs) [Reference Zhao and Kleijn7] and Codebook-driven [Reference Srinivasan, Samuelsson and Kleijn8] methods with a priori information (i.e., spectral envelops or spectral shapes) about speech and noise were proposed to overcome the situation of non-stationary noise. Some revised methods based on codebook and HMM were proposed in recent years. For example, the Sparse Autoregressive Hidden Markov Models (SARHMM) method [Reference Deng, Bao and Kleijin9] modeled linear prediction gains of speech and noise in non-stationary noise environments. The likelihood criterion was adopted to find the model parameters, combined with a priori information of speech and noise spectral shapes by a small number of HMM states. The sparsity of speech and noise modeling helped to improve the tracking performance of both spectral shape and power level of non-stationary noise. Another very new codebook-based approach with speech-presence probability (SPP) [Reference He, Bao and Bao10] also achieved a very good result on speech enhancement of non-stationary noise environment. This kind of codebook-based method with SPP (CBSPP) utilized the Markov process to model the correlation between the adjacent code-vectors in the codebook for optimizing Bayesian MMSE estimator. The correlation between adjacent linear prediction (LP) gains was also fully considered during the procedure of parameter estimation. Through the introduction of SPP in the codebook constrained Wiener filter, the proposed Wiener filter achieved the goal of noise reduction.
The aforementioned methods are focused on noise reduction. These noise reduction methods often utilize a gain function into each time–frequency (T–F) bin to suppress the noise based on a T–F representation of the noisy speech. The usage of the gain function over all T–F bins can be considered as an attenuation of noise magnitude in each T–F bin. These methods generally derive their gains as a function of the short-time signal-to-noise ratio (SNR) in the respective T–F bin, that is, speech and noise powers at each T–F bin need to be estimated. With respect to the noise masking, the Computational Auditory Scene Analysis (CASA) [Reference Hu and Wang11,Reference Bao and Abdulla12] is considered as an effective approach. By incorporating auditory perception model (i.e., Gammatone filterbank), it could mask the noise based on an estimation of the binary mask in each T–F unit that includes the different number of T–F bins concerned in noise reduction methods. Because the result of binary mask only corresponds to value 0 dominated by noise or value 1 dominated by the speech in each T–F unit, these CASA methods based on the binary mask often wrongly remove the background noise in a weak T–F unit dominated by the speech and seriously affect the hearing quality. A good solution for the shortage of binary mask is ideal ratio mask (IRM) [Reference Wang, Narayanan and Wang13,Reference Williamson, Wang and Wang14] that a priori knowledge of speech and noise is known in advance in the derivation of the mask. The IRM could be considered as a soft decision that the mask values continuously vary from 0 to 1 instead of a hard decision that the mask value is 0 or 1 derived from the ideal binary mask (IBM) [Reference Madhu, Spriet, Jansen, Koning and Wouters15,Reference Koning, Madhu and Wouters16]. The IRM is more reasonable to handle the situations that speech energy is larger or less than noise in each T–F unit. These ratio mask estimators [Reference Wang, Narayanan and Wang13,Reference Williamson, Wang and Wang14] operated in DFT domain. It is a kind of Weiner filtering solution that the transfer function of Weiner filter can be obtained by estimating speech and noise powers.
Because of the huge and complicated training process of speech and noise priori information, the noise reduction methods based on HMM and codebook or deep learning-based noise ratio masking method may have some limitations on solving the practical issues. Particularly worth mentioning is that the noise types and priori information are not easy and unrealistic to predict in advance.
Therefore, we propose a noise-masking method without any priori information and assumption of speech and noise signals. This proposed method can better mimic the hearing perception properties of the human being to improve the intelligibility of the enhanced speech. The soft decision factor, ratio mask, is used to resynthesize speech signal so that it can avoid the wrong elimination of weak speech T–F units caused by the binary mask. Furthermore, the ratio mask in our proposed method is a kind of ratio between the estimated speech and noise powers. Considering the superiority of solving the minimization problem, the speech power is estimated by convex optimization [Reference Boyd and Vandenberghe17,Reference Bao and Abdulla18] in the proposed method. For further compensating the powers of weak speech components, the estimated ratio mask is modified and interpolated to recover parts of speech components.
The remainder of this paper is organized as follows. In Section II, we present the overall principle of the proposed method. The performance evaluation is described in Sections III and IV provides the conclusions.
II. THE PRINCIPLE OF THE PROPOSED METHOD
Figure 1 describes the main block diagram of the proposed noise-masking method. First, the input noisy speech is decomposed into 128 channels by using Gammatone filterbank [Reference Patterson, Nimmo-Smith, Holdsworth and Rice19,Reference Abdulla20]. Then, the signal of each channel is windowed in time domain and a fast Fourier transform (FFT) is done for this windowed signal to obtain the power spectrum of noisy speech. The feature extraction module is utilized to calculate the noise power spectrum by Minima Controlled Recursive Averaging (MCRA) [Reference Cohen21] and normalized cross-correlation coefficient (NCCC) [Reference Bao, Dou, Jia and Bao22] between the spectra of noisy speech and noise. The NCCC is used to represent the proportion of noise power in noisy speech, which will contribute to the convex optimization of speech power. The objective function used for convex optimization is built based on noisy speech power and NCCC in each channel, and minimized by the gradient descent method [Reference Gardner23]. The speech power is estimated by minimizing the objective function. After that, the powers of estimated speech and noise are used to estimate the ratio mask. This ratio mask is then modified based on the adjacent T–F units and further smoothed by interpolating with the estimated binary mask for increasing the accuracy of ratio mask estimation. Finally, the enhanced speech is resynthesized from the smoothed ratio masks [Reference Weintraub24].
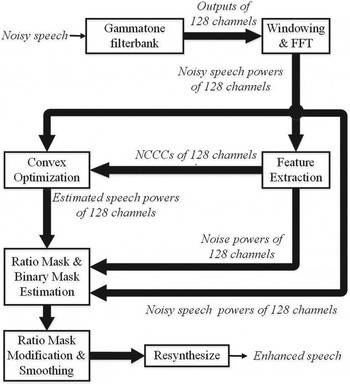
Fig. 1. The Block diagram of the proposed method.
Based on above block diagram, we mainly describe four key parts. In Section II-A, the speech synthesis mechanism will be described, which is a basic orientation of the proposed work. The estimation method of the ratio mask and binary mask concerned in speech synthesis are given in Sections II-B and II-C, respectively. The speech power estimation closely related to the ratio mask and binary mask estimation is deduced in Section II-D.
A) Speech synthesis mechanism
In the proposed method, the enhanced signal is resynthesized in time domain based on CASA model [Reference Weintraub24], which is different from the frequency domain synthesis method, such as the Wiener filter method. In the last stage of the speech enhancement system, the target speech is synthesized by means of the estimated ratio mask and filter responses of noisy speech signal in each Gammatone channel.
The Gammatone filter response of arbitrary channel is, G c[y(t)],
such as c is the Gammatone channel index and t is the time index. The symbol * is the convolution operation by Gammatone filter [Reference Patterson, Nimmo-Smith, Holdsworth and Rice19]. g c(t) is a Gammatone filter impulse response [Reference Abdulla20] described as:
where a = 4 is the order of the filter, b is the equivalent rectangular bandwidth, which increases as the center frequency f c increases.
Then, the first filtering response of the noisy speech signal, g c(t), is reversed in time domain again and further filtered by the Gammatone filter, that is, F c[y(t)],
where ![]() $\overline{G_{c}\lsqb y\lpar t\rpar \rsqb }$ represents the time-reverse operation of G c[y(t)].
$\overline{G_{c}\lsqb y\lpar t\rpar \rsqb }$ represents the time-reverse operation of G c[y(t)].
These twice time-reverse operations eliminate the phase difference between the filter outputs of the Gammatone channels. The phase-corrected output from each filter channel is then divided into time frames by a raised cosine window for the overlap-and-add. Figure 2 shows the block diagram of the speech synthesis mechanism.
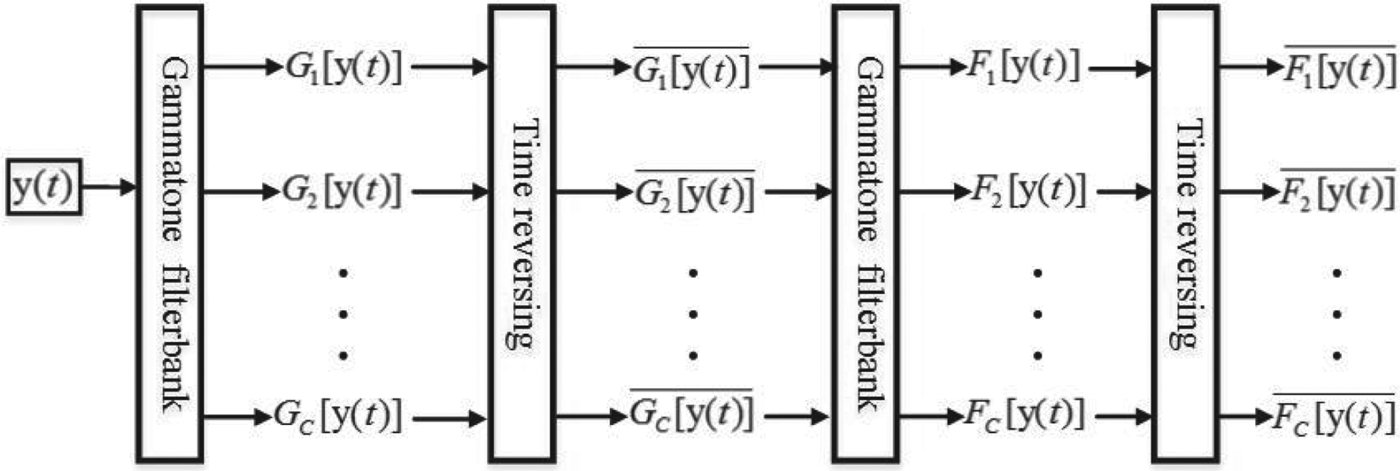
Fig. 2. The Block diagram of the speech synthesis mechanism.
The signal magnitude in each channel is then weighted by the corresponding ratio mask value at that time instant. The weighted filter responses are then summed across all Gammatone channels to yield a reconstructed speech waveform as follows:
where c and C are the Gammatone channel index and number, respectively. M(c, t) is the estimated ratio mask. ![]() $\overline {F_c[y{\rm (}t{\rm )]}} $ is the time-reverse signal of F c[y(t)]. W(c, t) is a raised cosine window. x̂(c, t) is the resynthesized speech signal.
$\overline {F_c[y{\rm (}t{\rm )]}} $ is the time-reverse signal of F c[y(t)]. W(c, t) is a raised cosine window. x̂(c, t) is the resynthesized speech signal.
B) Ratio mask estimation
In our noise-masking method, the noisy speech signal with 4 kHz bandwidth is decomposed into the T–F units by a 128-channel Gammatone filterbank [Reference Patterson, Nimmo-Smith, Holdsworth and Rice19,Reference Abdulla20] whose center frequencies are quasi-logarithmically spaced from 80 to 4000 Hz. In the proposed method, we assume that the clean speech and noise are additive and statistically independent in each gammatone channel. Thus, the powers of noise and speech in each channel can be expressed as follows:
where c is the channel index, m is the frame index, P y(c, m), P x(c, m), and P d(c, m) indicate the powers of the noisy speech, clean speech, and noise in the cth channel of the mth frame, respectively. The ratio mask can be estimated as follows:
 $$V_{R}(c,m)=\displaystyle{{\hat{P_{x}}(c,m)}\over{\hat{P_{x}}(c,m)+\hat{{P}_{d}}(c,m)}},$$
 where V R(c, m) is the initial ratio mask estimation in the cth channel of the mth frame. ![]() $\hat{P_{x}}\lpar{\cdot}\rpar $ and
$\hat{P_{x}}\lpar{\cdot}\rpar $ and ![]() $\hat{P_{d}}\lpar{\cdot}\rpar $ are the estimated powers of speech and noise, respectively. The speech power estimation will be given in Section II-D and the noise power is obtained by the MCRA method [Reference Cohen21].
$\hat{P_{d}}\lpar{\cdot}\rpar $ are the estimated powers of speech and noise, respectively. The speech power estimation will be given in Section II-D and the noise power is obtained by the MCRA method [Reference Cohen21].
As equation (6), the ratio mask changes from 0 to 1 rather than 0 or 1 happened in the binary mask. The ratio mask value will close to 0, if the current T–F unit is dominated by the noise, that is, the noise power is larger than speech power. On the contrary, the ratio mask approximates to 1, if the speech dominates the current T–F unit. Thus, the soft discrimination factor, ratio mask, can keep parts of speech component in the weak voiced fragments by using a smaller ratio value instead of 0 caused by the binary mask estimation.
The speech components at low frequency are more important than that of at high frequency because the information of low frequency contributes to more speech intelligibility. Therefore, the ratio mask at low frequency is modified by its adjacent T–F units to further preserve the speech energy in the proposed method. The modified ratio mask, Ṽ R, is obtained as
where
here V a(c, m) represents the average of ratio masks in three adjacent T–F units of the same frame. The purpose that we average the adjacent T–F units is to eliminate the outliers units and keep the speech energy. The initial ratio mask defined in equation (6) is only modified below the 50th channel which corresponds to the center frequencies of 636 Hz, because the speech components are more important below this frequency based on the hearing perception. Thus, the basic idea of equation (7) is to recover the partial speech energy that has been masked in the initial ratio mask estimation.
The binary mask can be deemed as a hard decision and is easy to keep more speech components due to its binary discriminant. Also, parts of the noise components are not masked enough and kept at the same time. Comparatively speaking, the ratio mask has a good ability of masking noise, but it simultaneously damages some speech components. Thus, combining the advantages of both ratio mask and binary mask, the linear interpolation between them given in equation (9) is utilized to smooth the ratio mask, when the binary mask value is 1. The smoothed ratio mask is obtained by
 $$\hat V_R(c,m) = \left\{ {\matrix{ {\eta \cdot {\tilde V}_R(c,m) + } & {(1 - \eta )\cdot V_B(c,m),} \cr {} & {{\rm if }V_B(c,m) = 1} \cr {{\tilde V}_R(c,m),} & {} \cr {} & {{\rm if }V_B(c,m) = 0} \cr } ,} \right.$$
 where η = 0.2 is a smoothing factor obtained by massive listening test. Meanwhile, we also use the average HIT-False Alarm rate (HIT-FA) objective test [Reference Bao and Abdulla25] to determine the credibility of η = 0.2. Figure 3 shows the HIT-FA score curve versus the smoothing factor η which varies from 0 to 1.0. The speech signal is subjected to five types of noises (white, babble, office, street, and factory1 noise) under three kinds of SNRs (0, 5, and 10 dB). The highest point appears in the condition of η = 0.2 for three SNRs. Thus, in the paper, we set the factor η to 0.2. V B(c, m) is the estimated binary mask value [Reference Bao and Abdulla25] that will be introduced in the following Section II-C and ![]() $\tilde{V}_{R}\lpar c\comma \; m\rpar $ is the modified ratio mask given in equation (7).
$\tilde{V}_{R}\lpar c\comma \; m\rpar $ is the modified ratio mask given in equation (7).
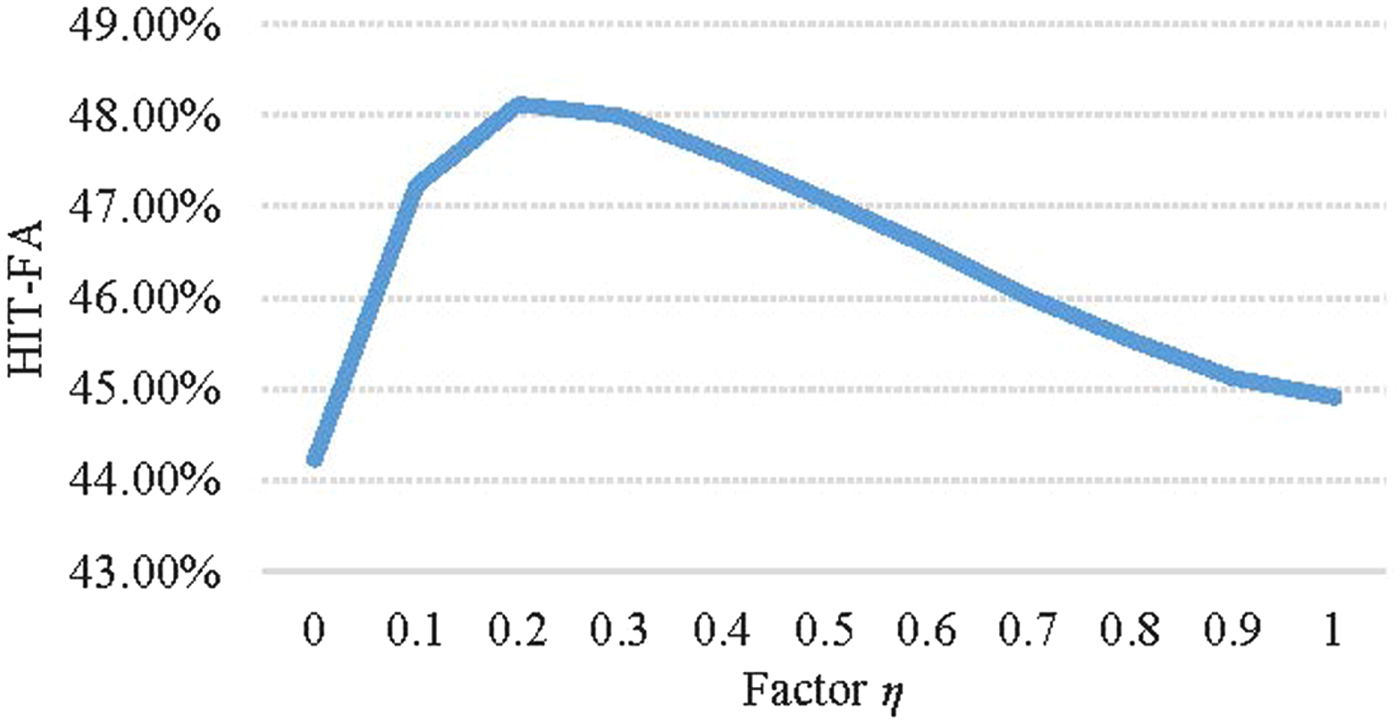
Fig. 3. Average HIT-FA score histogram with respect to factor η.
C) Binary mask estimation
Due to the power estimation error, the estimated powers of speech and noise do not meet equation (5) any more. So, we introduce a factor to solve this issue, that is, the noisy speech power can be expressed as
where P y(c, m), ![]() $\hat{P}_{x}\lpar c\comma \; m\rpar $, and
$\hat{P}_{x}\lpar c\comma \; m\rpar $, and ![]() $\hat{P}_{d}\lpar c\comma \; m\rpar $ are the noisy speech power, estimated speech power and estimated noise power in the cth channel of the mth frame, respectively. σ(c, m) is a factor to balance equation (10). Thus, the power estimation errors of the speech and noise are compensated by the factor σ(c, m). When the factor σ(c, m) increases, the noise components will be reduced in the current T–F unit. It means that the current T–F unit is dominated by speech components, when σ(c, m) has a larger value. Oppositely, when the factor σ(c, m) has a smaller value, the noise components dominate the current unit. Based on equation (10), the factor σ(c, m) can be given as
$\hat{P}_{d}\lpar c\comma \; m\rpar $ are the noisy speech power, estimated speech power and estimated noise power in the cth channel of the mth frame, respectively. σ(c, m) is a factor to balance equation (10). Thus, the power estimation errors of the speech and noise are compensated by the factor σ(c, m). When the factor σ(c, m) increases, the noise components will be reduced in the current T–F unit. It means that the current T–F unit is dominated by speech components, when σ(c, m) has a larger value. Oppositely, when the factor σ(c, m) has a smaller value, the noise components dominate the current unit. Based on equation (10), the factor σ(c, m) can be given as
 $$\sigma(c,m)=\displaystyle{{P_{y}(c,m)-\hat{P}_{x}(c,m)}\over{\hat{P}_{d}(c,m)}}.$$
 The difference of P y(c, m) and ![]() $\hat{P}_{x}\lpar c\comma \; m\rpar $ in the numerator of equation (11) corresponds to the noise power derived from the speech power estimation. The denominator is the noise power obtained by MCRA method [Reference Cohen21]. The factor σ(c, m) makes the estimated powers,
$\hat{P}_{x}\lpar c\comma \; m\rpar $ in the numerator of equation (11) corresponds to the noise power derived from the speech power estimation. The denominator is the noise power obtained by MCRA method [Reference Cohen21]. The factor σ(c, m) makes the estimated powers, ![]() $\hat{P}_{x}\lpar{\cdot}\rpar $ and
$\hat{P}_{x}\lpar{\cdot}\rpar $ and ![]() $\hat{P}_{d}\lpar{\cdot}\rpar $, meet equation (5). The σ(c, m) can be considered as a boundary factor [Reference Bao and Abdulla25] to distinguish the speech or noise T–F unit. In our experiments, if factor σ(c, m) is larger than the threshold ξ, the current T–F unit is dominated by speech components and labeled as value 1. Otherwise, the noise components dominate the current T–F unit labeled as value 0. Thus, the binary mask V B(c, m) used in equation (9) can be determined as
$\hat{P}_{d}\lpar{\cdot}\rpar $, meet equation (5). The σ(c, m) can be considered as a boundary factor [Reference Bao and Abdulla25] to distinguish the speech or noise T–F unit. In our experiments, if factor σ(c, m) is larger than the threshold ξ, the current T–F unit is dominated by speech components and labeled as value 1. Otherwise, the noise components dominate the current T–F unit labeled as value 0. Thus, the binary mask V B(c, m) used in equation (9) can be determined as
By a HIT-FA objective test based on equation (12), we found that HIT-FA has a good result when the threshold ξ is chosen as 3. Figure 4 shows the average HIT-FA score histogram about threshold ξ with the value from 1.6 to 3.8 based on five types of noises (white, babble, office, street, and factory1 noise) under three kinds of SNRs situations (0, 5 and 10 dB).
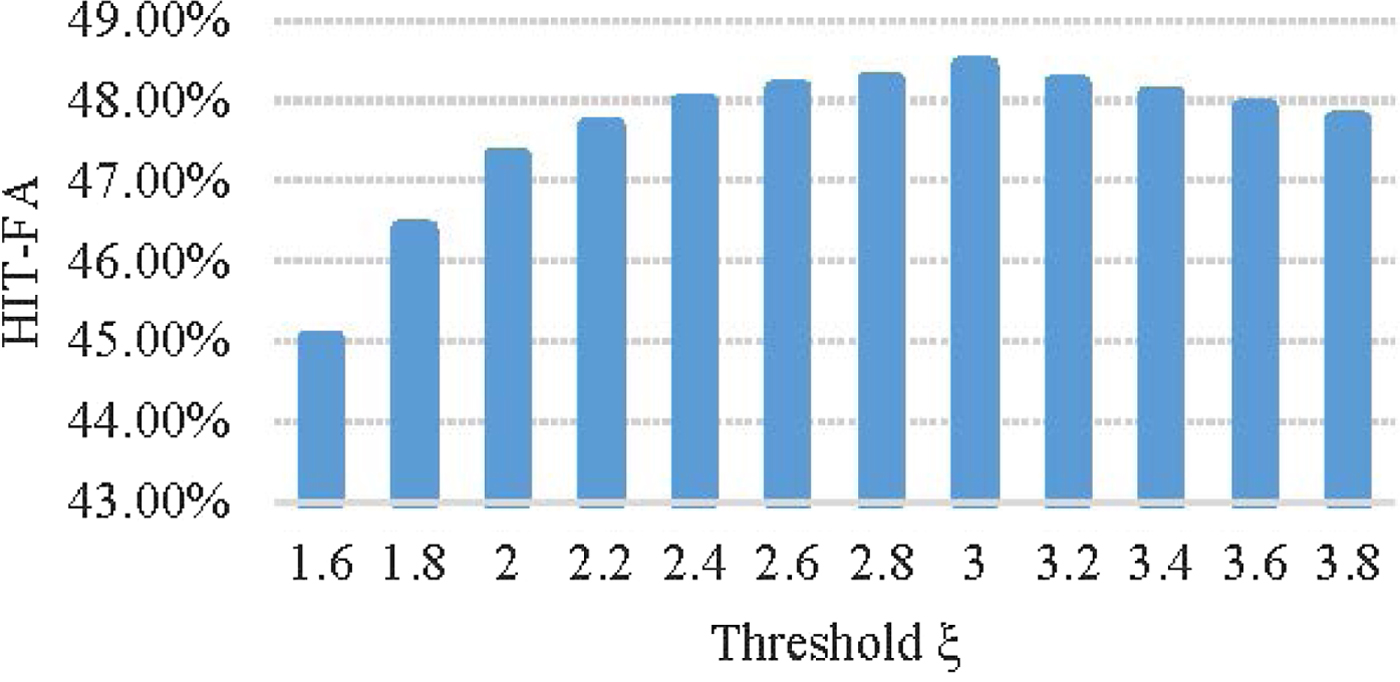
Fig. 4. Average HIT-FA score histogram with respect to threshold ξ.
D) Speech power estimation
The enhanced speech is resynthesized by the estimated ratio mask defined in equation (9), which relies on the powers of the estimated speech and noise. Thus, the speech power is the key point of our proposed noise-masking method. The speech power estimation can be deemed as a minimizing problem. We apply the convex optimization [Reference Boyd and Vandenberghe17] that its local optimal solution easily matches the global optimum to solve the minimization problem.
For real and positive speech power vector ![]() ${\bf p}_{x}\in\Re^{n}$ composed of 128 channels, if objective function
${\bf p}_{x}\in\Re^{n}$ composed of 128 channels, if objective function ![]() $J\colon \Re^{n}\rightarrow\Re$ is convex, J(px) has the minimum value with respect to px. The vector px can be estimated by the minimization problem without constrains. The optimal solution can be reached when we optimize each element of px individually. Thus, the optimal value
$J\colon \Re^{n}\rightarrow\Re$ is convex, J(px) has the minimum value with respect to px. The vector px can be estimated by the minimization problem without constrains. The optimal solution can be reached when we optimize each element of px individually. Thus, the optimal value ![]() $\hat{P}_{x}\lpar c\comma \; m\rpar $ of P x(c, m) can be obtained as follows:
$\hat{P}_{x}\lpar c\comma \; m\rpar $ of P x(c, m) can be obtained as follows:
The above minimization problem is a kind of convex optimization with respect to variable P x(c, m) based on objective function J[P x(c, m)]. This convex optimization can be easily implemented by the gradient descent method. Here, the objective function J(·) is built as follows:
 $$\matrix{ {J\left[P_x(c,m)\right]} \hfill & { = \sum\limits_{c = 1}^{128} \left[ P_y(c,m) - P_d(c,m) - P_x(c,m)\right]^2} \hfill \cr {} \hfill & {\quad + \lambda \cdot \varphi \left(P_x(c,m)\right).} \hfill \cr } $$
 The first term in equation (14) is defined in the sense of minimum mean-square error, which is completely convex, i.e., the square error between P y(·) and P d( · ) + P x( · ) should equal to 0, when P d(·) and P x(·) are correctly estimated. Since the estimation errors with respect to P d(·) and P x(·) exist in practical situation, the second term in equation (14) is introduced for the error constrain. The function φ( · ) is called the regularization or penalty function. Here we use the l 1 norm as a penalty function, i.e., ![]() $\varphi {\rm (}P_x{\rm )} = \sum\nolimits_{c = 1}^{128} { \vert P_x \vert } $. The λ > 0 is the regularization parameter. By varying the parameter λ, we can trace out the optimal trade-off solution of equation (14). Due to the non-negativity of λ and φ( · ), equation (14) is also a completely convex function. It means that the approximative value
$\varphi {\rm (}P_x{\rm )} = \sum\nolimits_{c = 1}^{128} { \vert P_x \vert } $. The λ > 0 is the regularization parameter. By varying the parameter λ, we can trace out the optimal trade-off solution of equation (14). Due to the non-negativity of λ and φ( · ), equation (14) is also a completely convex function. It means that the approximative value ![]() $\hat{P}_{x}\lpar{\cdot}\rpar $ can be estimated by minimizing equation (14).
$\hat{P}_{x}\lpar{\cdot}\rpar $ can be estimated by minimizing equation (14).
In equation (14), P y(·) is the noisy speech power obtained in time domain. We assume that the noise has been pre-estimated by the MCRA [Reference Cohen21] method. Thus, the objective function (14) only has one variable, P x(·). Then, we further utilize the relationship of noise and noisy speech to obtain the proportion of noise power within the noisy power. Multiplying noisy power by this proportion, we can get a modified objective function as follows
 $$\eqalign{J\left[ {P_x(c,m)} \right] =& \sum\limits_{c = 1}^{128} {\left[ {P_y(c,m) - \rho (c,m)\cdot P_y(c,m)} \right.} \cr & \left. { - P_x(c,m)} \right]^2 + \lambda \cdot \sum\limits_{c = 1}^{128} {P_x} (c,m),} $$
where ρ(c, m) is the normalized cross-correlation coefficient [Reference Bao, Dou, Jia and Bao22] between noise and noisy speech spectra calculated in the frequency domain. The ρ(c, m) · P y(c, m) is considered as an approximative value of noise power. Actually, the factor ρ(c, m) indicates the percentage of noise components within the noisy speech signal. Therefore, we apply this coefficient to represent the proportion of noise power in noisy speech signal, instead of using noise power spectrum directly. The common situation of noise overestimation can make the estimated speech power negative, which is impossible for the real application. The usage of normalized cross-correlation coefficient cleverly avoids noise overestimation, because ρ(c, m) varies from 0 to 1. Therefore, the ρ(c, m) · P y(c, m) is always smaller than noisy speech power, P y(c, m).
Figure 5 shows an examples that two NCCCs vary with the time with respect to the channel index and frame index in five channels. The channel indexes are 20, 50, 70, 100, and 120 which correspond to the center frequencies of 237, 636, 1077, 2195, and 3432 Hz, respectively. Figure 5(a) describes the NCCC, χ(c, m), between the true noise and noisy speech, and Fig. 5(b) shows the NCCC, ρ(c, m), between of the estimated noise and noisy speech. From Fig. 5, we can find that each Gammatone channel has different NCCC value because the signal energy of each channel is different, where more energy is concentrated at low frequencies. The estimated ρ(c, m) approximately matches to the ideal ratio trajectory χ(c, m). Thus, it is confident to apply the estimated noise with MCRA to obtain the proportion of noise power in noisy speech. The ρ(c, m) in the unvoiced fragments is larger than that in voiced fragments, because the signal components in the unvoiced segments more like the noisy components. Moreover, [1 − ρ(c, m)] · P y(c, m) can ensure the difference between noisy and noise signals is not negative since ρ(c, m) is less than or equal to 1 based on the following normalized cross-correlation:
 $$\rho(c,m)=\displaystyle{{\sum^{L}_{l=1} Y(c,m,l)\cdot {\hat{D}(c,m,l)}}\over{\sqrt{\sum^{L}_{l=1}Y^{2}(c,m,l) \cdot \sum^{L}_{l=1}\hat{D}^{2}(c,m,l) }}},$$
 where L is the number of FFT points, l is the frequency index, and Y(c, m, l) and ![]() $\hat{D}\lpar c\comma \; m\comma \; l\rpar $ are the spectral magnitude of noisy speech and the estimated noise in the cth channel of the mth frame, which are calculated by FFT with the size of 256 and MCRA method [Reference Cohen21], respectively.
$\hat{D}\lpar c\comma \; m\comma \; l\rpar $ are the spectral magnitude of noisy speech and the estimated noise in the cth channel of the mth frame, which are calculated by FFT with the size of 256 and MCRA method [Reference Cohen21], respectively.

Fig. 5. An example of normalized cross-correlation coefficient in different channels (Input SNR = 5 dB, white noise). (a) True noise condition. (b) Estimated noise condition.
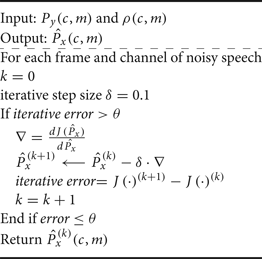
Equation (15) can be solved by the gradient descent method [Reference Gardner23] to calculate the approximative value of the estimated speech power, ![]() $\hat{P}_{x}\lpar c\comma \; m\rpar $, in each channel of each frame. The complete algorithm framework is presented in Table 1. The input of iteration algorithm is noisy power and ρ(c, m). The output of iteration algorithm is the optimal solution of speech power. By taking derivation of J(·) in equation (15) with respect to
$\hat{P}_{x}\lpar c\comma \; m\rpar $, in each channel of each frame. The complete algorithm framework is presented in Table 1. The input of iteration algorithm is noisy power and ρ(c, m). The output of iteration algorithm is the optimal solution of speech power. By taking derivation of J(·) in equation (15) with respect to ![]() $\hat{P}_{x}\lpar c\comma \; m\rpar $, we can get the gradient ∇ of objective function. Then, moving
$\hat{P}_{x}\lpar c\comma \; m\rpar $, we can get the gradient ∇ of objective function. Then, moving ![]() $\hat{P}_{x}\lpar c\comma \; m\rpar $ to the direction of the negative gradient to obtain the (k + 1)th iteration solution. After that, the iterative error of adjacent two iterations is computed to determine if the iteration is over. The iteration will stop, if the iterative error is smaller than threshold θ where it is set to 1 based on objective and subjective tests. Otherwise, the iteration will keep going until convergence.
$\hat{P}_{x}\lpar c\comma \; m\rpar $ to the direction of the negative gradient to obtain the (k + 1)th iteration solution. After that, the iterative error of adjacent two iterations is computed to determine if the iteration is over. The iteration will stop, if the iterative error is smaller than threshold θ where it is set to 1 based on objective and subjective tests. Otherwise, the iteration will keep going until convergence.
Table 1. Iterative algorithm of ![]() $\hat{P}_{x}$.
$\hat{P}_{x}$.
III. EXPERIMENTS AND RESULTS
In this section of performance evaluation, we discuss the enhanced results of our proposed method named as ConvexRM. The test clean speeches are selected from TIMIT [Reference Garofolo, Lamel, Fisher, Fiscus, Pallett and Dahlgrena26] database including 50 utterances. Five types of noises from NOISEX-92 [Reference Varga, Steeneken, Tomlinson and Jones27] noise database are used, which include white, babble, office, street, and factory1 noises. The input SNR is defined as −5, 0, 5 and 10 dB, respectively. The sampling rate of the noisy speech signal is 8 kHz. We apply segmental SNR (SSNR) improvement measure [Reference Quackenbush, Barnwell and Clements28], log spectral distortion (LSD) measure [Reference Abramson and Cohen29], and short-time objective intelligibility (STOI) [Reference Taal, Hendriks, Heusdens and Jensen30] to evaluate the objective quality of the enhanced signal. Meanwhile, the Multiple Stimuli with Hidden Reference and Anchor (MUSHRA) listening test [Reference Vincent31] is utilized to measure the subjective performance. To put our results in perspective, the GammaPrior [Reference Erkelens, Hendriks, Heusdens and Jensen5], SARHMM [Reference Deng, Bao and Kleijin9], and CBSPP [Reference He, Bao and Bao10] are selected as reference enhancement methods and their related ready-made batch program and source codes are used for tests. The IRM is the ideal situation that the clean speech and noise signals are known in advance.
A) Experiment setup
In the Section II-D, the objective function (15) was solved by the gradient descent method. The iteration times should be seriously considered. A large number of iterations can not only obtain a better estimated result but also make the enhanced system very complicated. However, the enhanced performance may be degraded, if the number of iterations is unreasonably constrained. Therefore, we analyze the average iteration error in all 128 channels between 30 and 70 iterations to ensure the reasonable number of iterations. An example of average errors in terms of "dB" is expressed in Fig. 6. In this error comparison, we use four kinds of SNRs under five types of noises to determine the number of iterations. From Fig. 6, we can find that the power error reaches a lower value when the number of iterations is larger than 60. Therefore, during the convex optimization of speech power, the number of iterations in the gradient descent method is set to 60, which adequately satisfies the convergent condition.
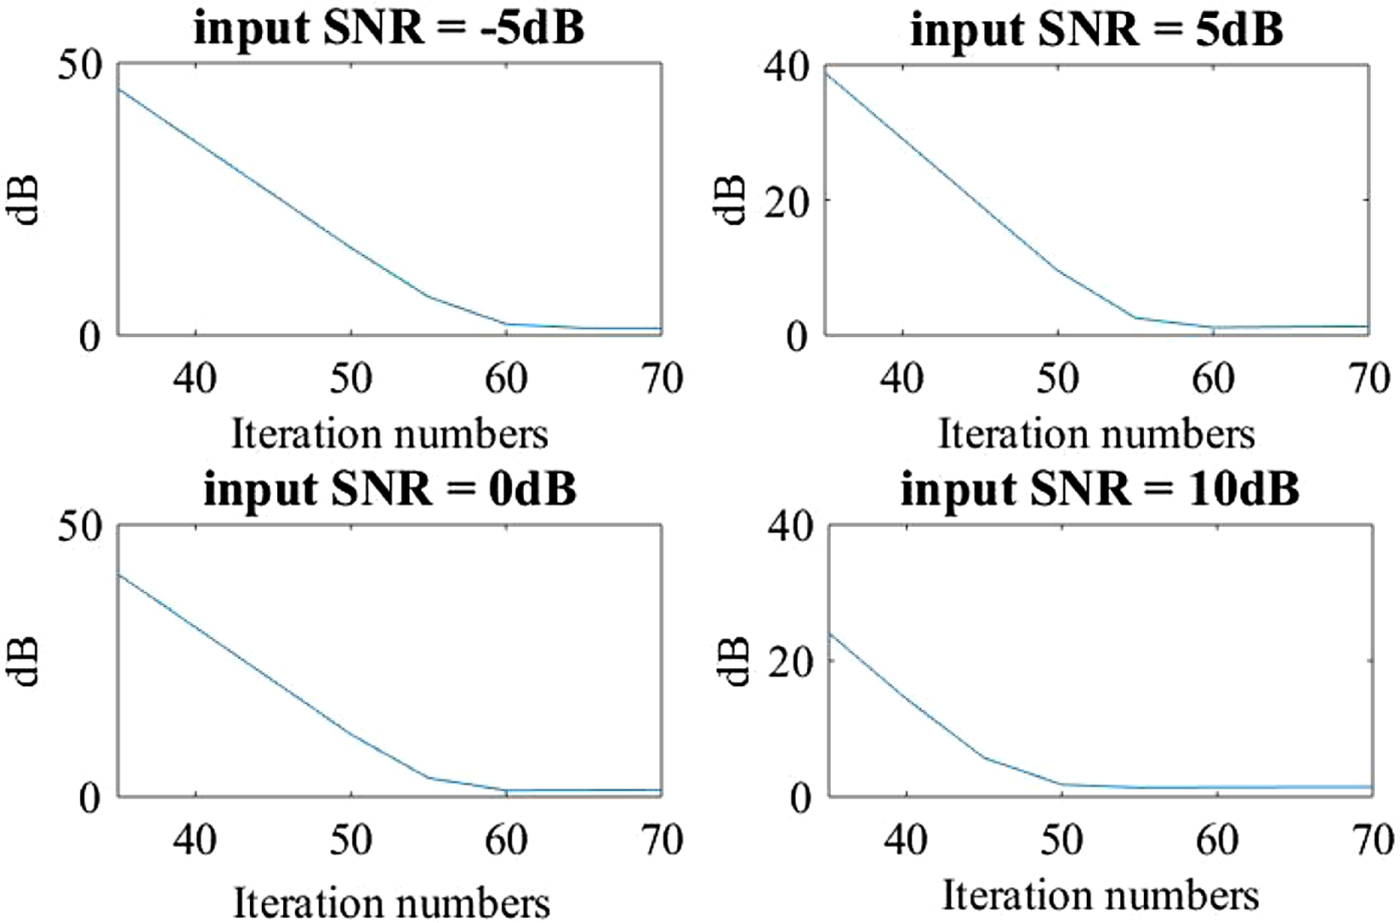
Fig. 6. Power error comparison of speech against the number of Iteration.
Although the proposed method needs to iteratively estimate the speech power, we set a fixed iterative number of 60 to reduce the computation complexity. The SARHMM and CBSPP not only need the prior information and big database but also cost a lot of time to search the mapping pairs during the online enhancement. However, the iterative estimation of our proposed method is very simple with a small iteration number. Our proposed method is a slightly more complex than the GammaPrior approach, but the proposed method does not need the additive Gaussian noise assumption and the complexity of it is tolerable.
An example of cochleogram comparison based on ratio mask estimations is given by Fig. 7 to observe the estimation performance. Figure 7(a) is the cochleogram based on the ideal ratio mask that the clean speech and noise are known in advance. Figure 7(b) is the cochleogram obtained through the estimated binary mask by equation (12). Figure 7(c) is the cochleogram acquired via the initial estimation of ratio mask by equation (6). Figure 7(d) is the cochleogram based on the modified ratio mask by adjacent T–F units and the cochleogram of Fig. 7(e) is the final estimated ratio mask interpolated with the binary mask in equation (9). The speech components at low frequency usually contain some useful information and, so it is unrealistic to totally remove the background noise at low frequency. Thus, in Figs 7(d) and 7(e), we deliberately keep the very little energy of the T–F units as the floor noise below the 12th Gammetone channels that correspond to the center frequencies of 120 Hz. The binary mask estimation loses some speech T–F units at low frequency and keeps parts of speech units at the middle frequency. The initial ratio mask has relatively good results on remaining the speech components at the middle frequency but misses too many speech T–F units at low frequency. By using the modified algorithm given by equation (7), the ratio masks at low frequency are recovered. Moreover, Combining the feature of better preservation of speech T–F units at the middle frequency of binary mask, the smoothed ratio mask given by equation (9) recovers and enlarges the edge of speech T–F units. Based on the above analysis, the final estimated ratio mask (V̂ R) obtains a better performance and is considered as the key point in our proposed method (ConvexRM).

Fig. 7. The cochleogram comparison (Input SNR = 5 dB, factory1 noise). (a) The cochleogram resynthesized by idea ratio mask; (b) The cochleogram resynthesized by the estimated binary mask V B; (c) The cochleogram resynthesized by the initial ratio mask V R; (d) The cochleogram resynthesized by the modified ratio mask with adjacent T–F units Ṽ R; (e) The cochleogram resynthesized by the smoothed ratio mask with binary mask V̂ R.
To further observe the noise-masking performance in each Gammatone channel, Fig. 8 shows an example that the waveforms vary with the time in five channels. The clean speech, noisy speech and enhanced speech are shown in Figs 8(a)–8(c), respectively. From this figure, we can find that the enhanced speech waveforms match the clean speech waveforms well in the 50th, 70th, 100th, and 120th channels. For the 20th channel, the enhanced speech has more background noise than clean speech, because Gammatone filter prefers to reinforce the energy at low frequency. Actually, this energy level of noise does not affect the hearing quality too much.

Fig. 8. Speech waveform comparison of five channels (Input SNR = 5 dB, white noise). (a) Clean speech; (b) Noisy speech; (c) Enhanced speech.
To demonstrate the effectiveness of the proposed method with 60 iterations using the gradient descent method, the spectrograms of the enhanced speech by different methods are shown in Fig. 9 for verifying the noise masking.

Fig. 9. Spectrogram comparison (Input SNR = 5 dB, factory1 noise), (“She had your dark suit in greasy wash water all year”).
From the Fig. 9, we can find that the proposed ConvexRM method masks more background noise and keeps more speech components than other three reference approaches, respectively. The GammaPrior algorithm removes the least noise in these methods. Although the SARHMM wipes off noise components to a certain degree, it also loses parts of speech components in high frequency. As the CBSPP approach, the parts of weak speech components are eliminated after enhancement. Our ConvexRM method has better results on noise masking and speech energy reservation. To further observe the performance of noise elimination, The SSNR, LSD, STOI, and MUSHRA tests are discussed in the next subsections.
B) SSNR improvement test results
The average SSNR measurement [Reference Quackenbush, Barnwell and Clements28] is often utilized to evaluate the denoising performance of speech enhancement method. The input SNR and the output SNR are defined as follows, respectively. The average SSNR improvement is obtained by subtracting S in from S out.
 $$S_{in}=10\cdot\log_{10} \displaystyle{{\sum_{n=0}^{N-1}x^{2}(n)}\over {\sum_{n=0}^{N-1}[x(n)-y(n)]^{2}}},$$
 $$S_{out}=10\cdot\log_{10} \displaystyle{{\sum_{n=0}^{N-1}x^{2}(n)}\over{\sum_{n=0}^{N-1}[x(n)-\hat{x}(n)]^{2}}},$$
where N is the number of samples. x(n) is the original clean speech, y(n) represents the input noisy speech and x̂(n) denotes the enhanced signal.
The average SSNR improvement of various enhancement methods for stationary and non-stationary noise conditions are presented in Table 2 for different input SNRs (i.e., −5, 0, 5, and 10 dB). As Table 2, the ConvexRM method generally shows a higher value than other three reference methods. To give more details, the proposed ConvexRM is a little higher than the CBSPP method in babble and office noises. Both CBSPP and SARHMM approaches are better than the GammaPrior on the performance of reducing the background noise.
Table 2. SSNR improvement results.

C) LSD test results
During the signal enhancement, although parts of background noises are removed, the signal may also distort at the same time. Therefore, in order to further check the spectrum distortion of the enhanced signal, the LSD measure [Reference Abramson and Cohen29] is employed to evaluate the objective quality of the enhanced speech. It measures the similarity between the clean speech spectrum and the enhanced speech spectrum, and is defined as
 $$l=\displaystyle{{1}\over{M}} \sum\limits_{m=0}^{M-1} \sqrt{\displaystyle{{1}\over{K}}\sum\limits_{k=0}^{K-1} \left[10\cdot\log_{10} \displaystyle{{ \vert \hat{X}(m,k) \vert ^{2}}\over{ \vert X(m,k) \vert ^{2}}}\right]^{2}},$$
 where k is the index of frequency bins. K = 512 is the FFT size. m is the frame index, and M is the total number of frames. |X(m, k)| denotes the clean speech amplitude of DFT coefficients, and ![]() $\vert \hat{X}\lpar m\comma \; k\rpar \vert $ denotes the enhanced speech amplitude of DFT coefficients.
$\vert \hat{X}\lpar m\comma \; k\rpar \vert $ denotes the enhanced speech amplitude of DFT coefficients.
The LSD test results are given in Table 3. From Table 3, we can see that the ConvexRM method has less distortion than other methods in −5, 0, 5, and 10 dB conditions. Additionally, the SARHMM method almost shares the same level of spectral distortion with our proposed system in 10 dB situation that our method is still better than other two reference approaches. It means that our ConvexRM method masks more background noise and causes less spectral distortion.
Table 3. LSD results.

D) STOI test results
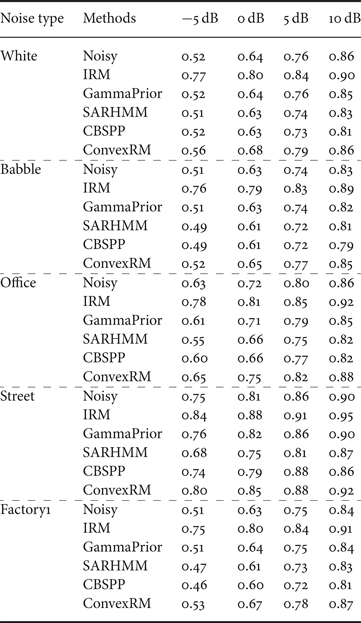
STOI [Reference Taal, Hendriks, Heusdens and Jensen30] denotes a correlation of short-time temporal envelopes between clean and enhanced speech, and has been shown to be highly correlated to human speech intelligibility score. The STOI measure is derived based on a correlation coefficient between the temporal envelops of the clean and enhanced speech in short-time regions and the score of STOI ranges from 0 to 1. The higher the STOI value is, the more the intelligibility has. Table 4 describes the STOI results that the enhanced signal by ConvexRM holds the highest intelligibility among all methods, especially in the low SNR conditions (−5 and 0 dB). Three reference methods even are lower than the noisy signal in several situations(e.g., 10 dB white, −5, and 0 dB office noise) because they lose parts of speech components in the weak speech fragments. All the methods obtained the high scores under street noise. The reason is that the street noise given in NOISEX-92 database is a kind of relatively stationary noise and the more noise energy is usually existed at the low frequency. Actually, the street noise is also easier to process than white and much easier than the babble or office noise.
Table 4. STOI results.
E) Subjective listening test results
In our experiments, the MUSHRA listening test [Reference Vincent31] is used to evaluate the subjective quality of the enhanced speech. The MUSHRA listening test consists of several successive experiments. Each experiment aims to compare a high-quality reference speech (i.e., clean speech) to several test speech signals sorted in random order, in which the subjects are provided with the signals under test as well as one clean speech and hidden anchor. Each subject needs to grade the whole test speech signals on a quality scale between 0 and 100.
During the MUSHRA test, we used as hidden anchor a speech signal having an SNR of 0 dB less than the noisy speech to be enhanced. Seven male and seven female listeners participated in the tests, and each listener did the test two times. The listeners were allowed to listen to each test speech several times and had access to the clean speech reference. The ten test utterances used were contaminated by aforementioned five types of noises using a 5 dB input SNR. A statistical analysis of the test results was conducted for the different de-noising methods under five noise conditions.
Figure 10 shows the averaged MUSHRA listening test results with a 95% confidence interval. Most of the listeners preferred to the proposed ConvexRM method over the other methods under five types of noises. SARHMM and CBSPP are the very competing methods to the proposed one. In the situations of white, street and factory1 noises, ConvexRM obtains an obvious preference compared with other three reference approaches. As the conditions of babble and office noise, most listeners still chose the proposed ConvexRM method despite its score has a little decline. From the hearing perception, the enhanced speech by the proposed method is more comfortable and continuous than SARHMM and CBSPP methods. Meanwhile, the proposed method can feel less background noise than GammaPrior method.
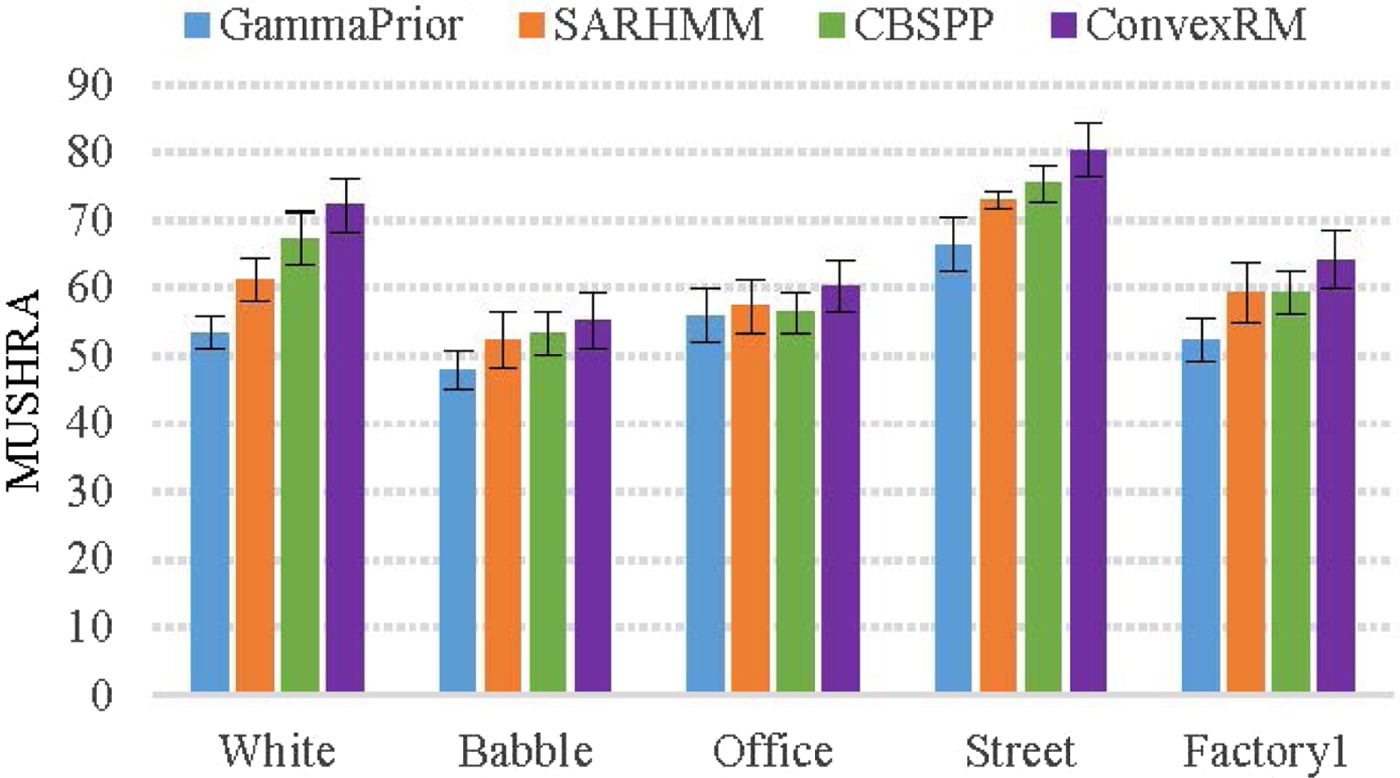
Fig. 10. The MUSHRA results for five types of noises.
IV. CONCLUSIONS
In this paper, we proposed a novel method for noise masking based on an effective estimation of ratio mask in Gammatone domain instead of DFT domain. The convex optimization algorithm was applied to estimate the speech power, combined with an adaptive factor named NCCC. The adjacent T–F units were considered for keeping the speech components at the low frequency. To recover weak speech components, the linear interpolation between the ratio mask and the binary mask was utilized to smooth the estimated ratio mask. By objective measures and subjective listening test, our proposed method has shown a better performance than other three reference methods, especially in the low SNR conditions the improvement of intelligibility is obvious. This also implies that our noise-masking method is effective.
Feng Bao received the B.S. and M.S. degrees in Electronic Engineering from Beijing University of Technology in 2012 and 2015, respectively. From October 2015, he started to pursue Doctor degree in the Department of Electrical and Computer Engineering, University of Auckland, Auckland, New Zealand. His research interests are in the areas of speech enhancement and speech signal processing. He is the author or coauthor of over 20 papers in journals and conferences.
Waleed H. Abdulla holds a Ph.D. degree from the University of Otago, New Zealand. He is currently an Associate Professor in the University of Auckland. He was Vice President-Member Relations and Development (APSIPA). He has published more than 170 refereed publications, one patent, and two books. He is on the editorial boards of six journals. He has supervised over 25 postgraduate students. He is the recipient of many awards and funded projects such as JSPS, ETRI, and Tsinghua fellowships. He has received Excellent Teaching Awards for 2005 and 2012. He is also a Senior Member of IEEE. His research interests include human biometrics; signal, speech, and image processing; machine learning; active noise control.
