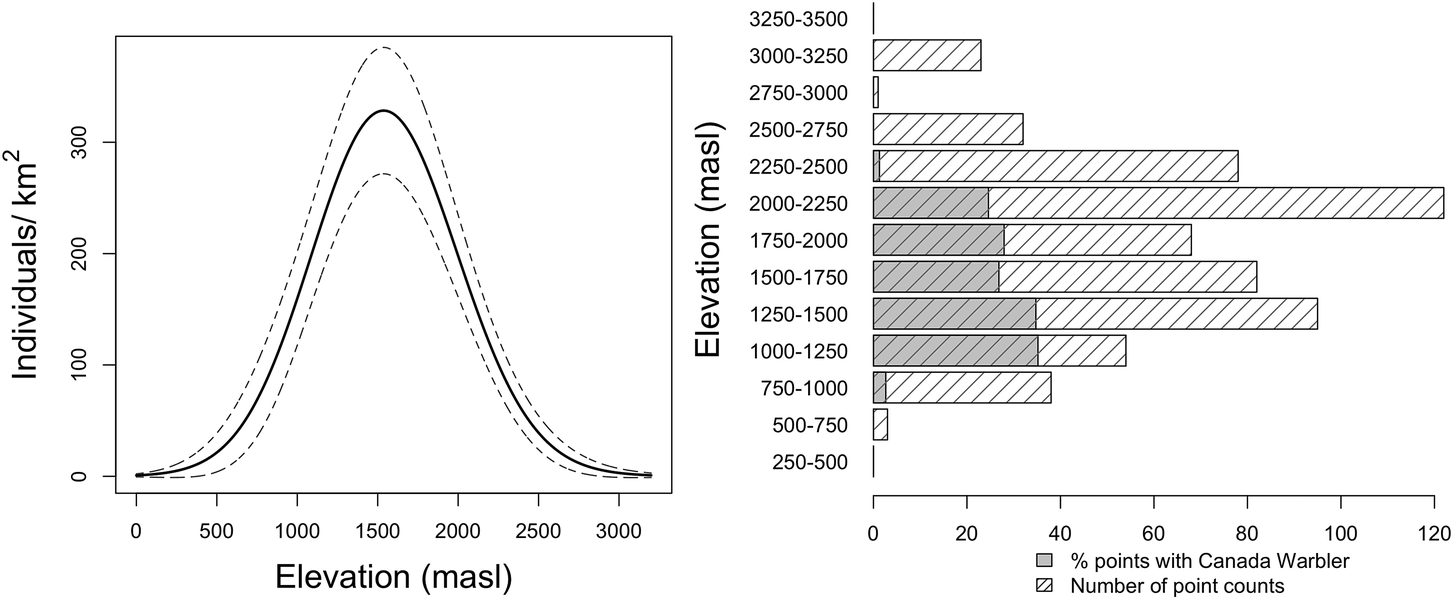
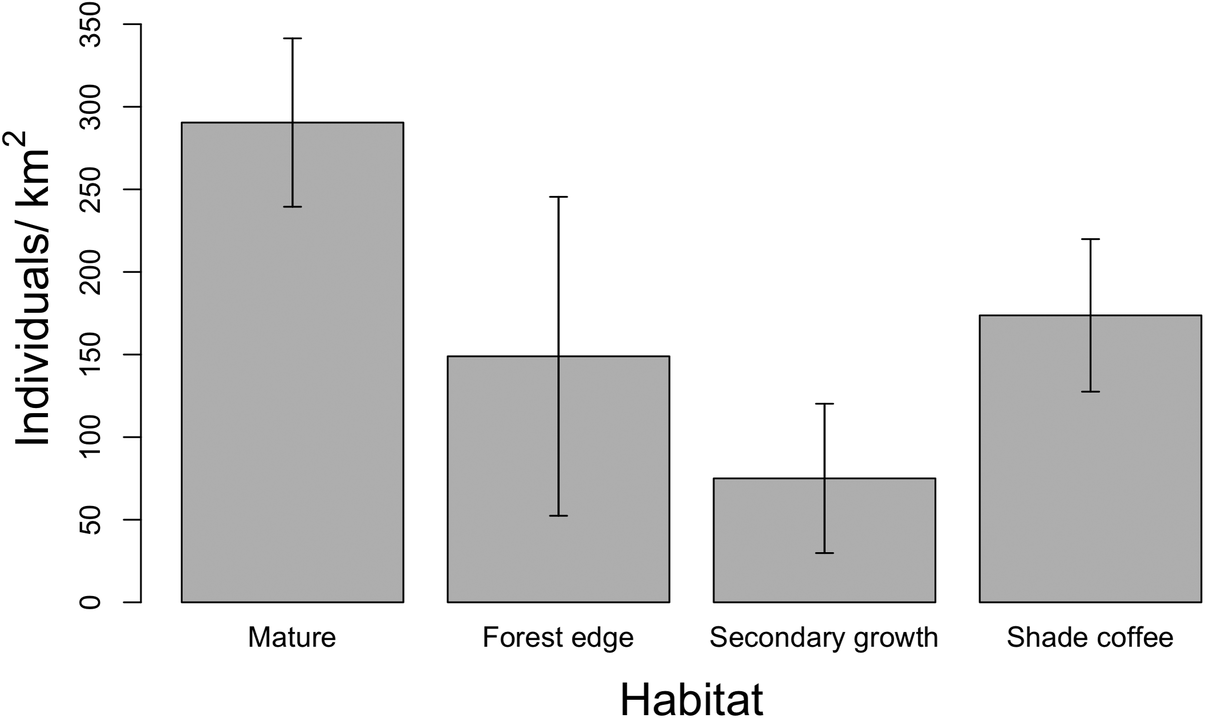
In the above article, the incorrect versions of figures 2 and 3 were published. The correct versions of these figures are shown below. The qualitative message of the paper has not changed, however, there are differences in the absolute values of densities and in the variation around predicted values (SE is higher in the original published version).

Figure 2. Relative density of Canada Warblers in forest peaked at intermediate elevations (around 1,500 m asl). A) Predicted densities across elevations obtained after averaging the four top models, two describing a quadratic and two a polynomial relationship with elevation. Dotted lines represent the standard error of predicted values (±SE). Predictions were made for mature forest in the Eastern Andes B) Percentage of points in mature forest at which Canada Warblers were detected by elevation band.

Figure 3. Mature forest held the highest relative density of Canada Warblers in contrast to secondary growth, forest edges, and shade coffee. Error bars denote standard error of predicted values (± SE). Predictions were made for the Eastern Andes and keeping elevation constant at the mean.
The authors apologise for this error.


