Total energy expenditure (TEE) consists of three components: BMR (or basal energy expenditure; BEE) ≈ 60–75 % of TEE, activity energy expenditure (AEE) ≈15–30 % of TEE and dietary thermogenesis ≈10 % of TEE(Reference Neilson, Robson and Friedenreich1,Reference Donahoo, Levine and Melanson2) . TEE, BEE and AEE change during the life course and are different between the sexes, with males usually higher than females and older individuals lower than younger ones(Reference Speakman and Westerterp3). TEE and AEE may also be affected by different disease states(Reference Li and Siegrist4). BEE as a part of TEE decreases with age and this age-related reduction is affected by sex and body composition(Reference Siervo, Oggioni and Lara5,Reference Milanović, Pantelić and Trajković6) . TEE is balanced by energy intake. When this balance is disrupted individuals become obese(Reference Hall, Heymsfield and Kemnitz7).
One of the most important means of decreasing risk of diabetes and CVD is to increase physical activity(Reference Hu, Leitzmann and Stampfer8,Reference Bassuk and Manson9) . Also, previous research demonstrated that TEE changes in some diseases, including advance pancreatic cancer, sepsis(Reference Moses, Slater and Preston10,Reference Uehara, Plank and Hill11) and resistance training(Reference Hunter, Wetzstein and Fields12). Therefore, measuring TEE and PA is essential to set up efficient strategies for prevention and treatment of these disorders. The ‘gold standard’ method for assessing TEE (and AEE by difference between TEE and BEE) is the doubly labelled water (DLW) method(Reference Speakman13). DLW can also be used to estimate food intake rates as individuals are generally in energy balance during measurements. However, this technique is relatively expensive (currently around 500–800US$ per subject) and hence is unsuitable for large-scale survey work. As an alternative, self-report questionnaires are often used in epidemiological studies to assess physical activity levels and food intake, and these may be extended to estimate AEE. In addition, since AEE is the most variable part of the TEE, they are also often used to evaluate TEE(Reference Westerterp14–Reference Fujii, Yamamoto and Takeda-Imai16). Questionnaires are advantageous because they are inexpensive, relatively easy to administer and generally well tolerated by participants(17–Reference Wendel-Vos, Schuit and Saris19). However, self-report questionnaires for food intake have come under considerable criticism recently, because people are unreliable monitors of their own behaviour and have poor recall of detailed past events. Research demonstrated that self report questionnaires were not reliable measures of not only food intake(Reference Dhurandhar, Schoeller and Brown20), but also physical activity(Reference Neilson, Robson and Friedenreich21). Previous comparisons of physical activity questionnaires (PAQ) and DLW have shown that misreporting of energy expenditure by PAQ is also common(Reference Neilson, Robson and Friedenreich21).
PAQ are being developed continuously and hence it is necessary to validate which PAQ provide valid estimates of TEE and AEE(Reference Melanson, Freedson and Blair22) by comparison to the ‘gold standard’ DLW methodology. Systematic reviews conducted a decade ago by Neilson et al.(Reference Neilson, Robson and Friedenreich1) and Prince et al.(Reference Prince, Adamo and Hamel23) examined the correlation between self-report (PAQ) and direct measures of adult physical activity. The latter study focused on the ineffectiveness of self-report assessment tools of physical activity. At present, the validity and reliability of many recently developed PAQ have not been established. Furthermore, it is unknown if these questionnaires are valid to evaluate TEE and AEE in either clinical settings or epidemiological studies(Reference Neilson, Robson and Friedenreich1). Some PAQ may be useful in epidemiological studies, and some in individual studies like clinical research. To find PAQ suitable for these two kinds of studies, we need to follow two criteria: first, at the population level, suitable PAQ must have a mean difference of <10 % in differences with a gold standard method like DLW and a Spearman correlation of >0·6(Reference Neilson, Robson and Friedenreich1). At the individual level, PAQ must have an acceptable limit of agreement which can be defined by the Bland–Altman method(Reference Neilson, Robson and Friedenreich21). Therefore, the purpose of the present work was to perform a meta-analysis of studies exploring the validity of existing PAQ to estimate TEE and/or AEE, across all age groups.
Methods
Search strategy
The following databases were searched to identify studies published up to 2 October 2019: Google Scholar, PubMed and Scopus database using the following lists and terms:
-
List A: ‘Doubly labeled water’ OR ‘doubly-labeled water’ OR ‘isotope labeled water’ OR ‘doubly labelled water’
-
List B: ‘Activity monitor*’ OR ‘physical Activity*’ OR ‘Motor Activity*’ OR ‘physical activity level’ OR ‘Activity energy expenditure’
-
List C: ‘Energy expenditure’ OR ‘TEE’
-
List D: ‘Resting metabolic rate’
-
List E:”Questionnaire*” OR ‘Survey’ OR ‘Record’ OR ‘Recall’
-
List F: valid*
Key search terms in Lists A, B, C, D, E and F were combined together.
Three independent reviewers screened the studies and extracted relevant research. When duplicate reports were removed, the full texts of studies were further assessed to extract the required data for the present study.
We included studies that (A) validated PAQ with DLW based on measurements of TEE and/or AEE and (B) included PAQ that calculated TEE or AEE. Our search was limited to studies written in English, with no constraint on publication year and with no restriction on subject age, disease status, sex and gestation and lactation status.
Data extraction
We extracted the following information from each study: publication year, country, sample size, sex, mean values and standard deviations, age, weight, BMI (kg/m2), body fat percentage (BF %) (Table 1), TEE (kJ/d) (Table 2) and AEE (kJ/d) measured by both DLW and PAQ (Table 3).
Table 1. Characteristics of the studies included into the meta-analysis (Numbers and percentages; mean values and standard deviations)
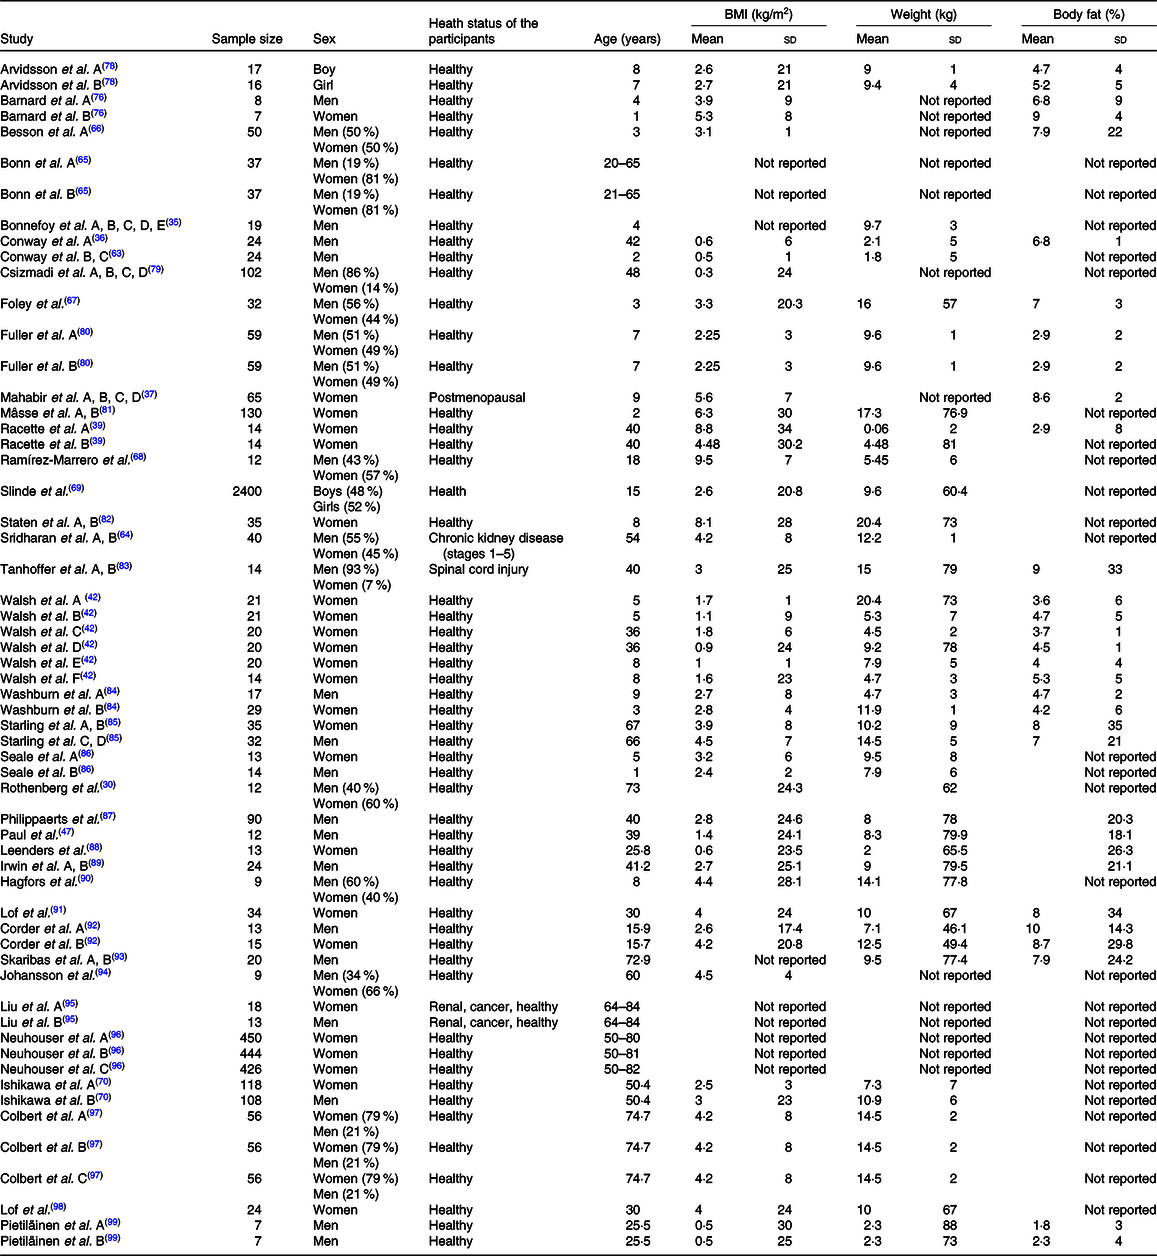
Table 2. Summary of results for the difference in total energy expenditure (TEE) means between physical activity questionnaires (PAQ) and doubly labelled water (DLW)* (Mean values and standard deviations)
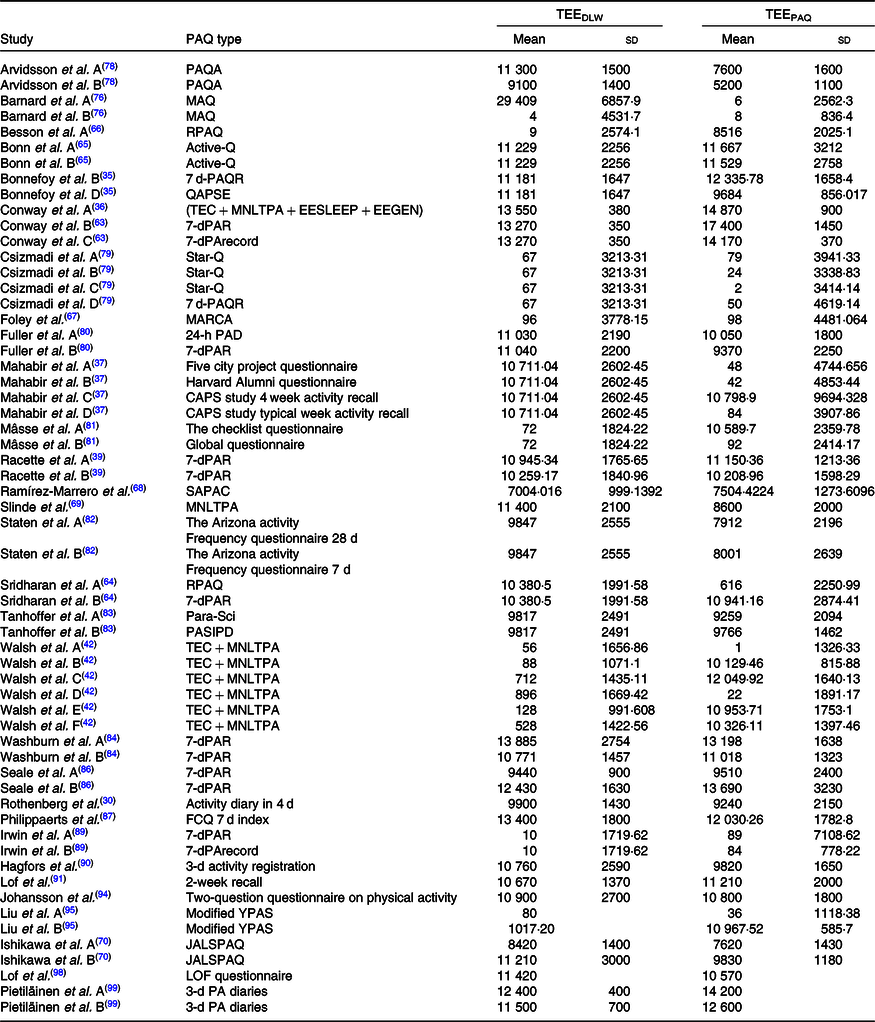
PAQA, Physical Activity Questionnaire for Adolescents; MAQ, Modifiable Activity Questionnaire; RPAQ, Recent Physical Activity Questionnaire; 7 d-PAR, 7-d Physical Activity Recall Questionnaire; QAPSE, Questionnaire d’Activité Physique Saint-Etienne; TEC + MNLTPA + EESLEEP, (TEC, Tecumseh Occupational Activity Questionnaire) + (MNLTPA, Minnesota Leisure Time Physical Activity Questionnaire) + (EE SLEEP, EE from sleep); 7-dPArecord, 7-d physical activity record questionnaire; STAR-Q, Sedentary Time and Activity Reporting Questionnaire; MARCA, Multimedia Activity Recall for Children and Adolescents; PAD, 24-h physical activity diaries; SAPAC, Self-Administered Physical Activity Checklist; PARA-SCI, physical activity recall assessment for people with spinal cord injury; PASIPD, physical activity scale for individuals with physical disabilities; FCQ, Five City Project Questionnaire; Modified YAPS, modified Yale Physical Activity Survey; JALSPAQ, the Japan Arteriosclerosis Longitudinal Study Physical Activity Questionnaire; CAPS, Cross-Cultural Activity Participation Study.
* All data in kJ/d.
Table 3. Summary of results from difference in activity energy expenditure (AEE) means between physical activity questionnaires (PAQ) and doubly labelled water (DLW)* (Mean values and standard deviations)

MNLTPA, Minnesota Leisure Time Physical Activity Questionnaire; Modified YAPS, modified Yale Physical Activity Survey; STAR-Q, Sedentary Time and Activity Reporting Questionnaire; 7-dPAR, 7-d Physical Activity Recall Questionnaire; MARCA, Multimedia Activity Recall for Children and Adolescents; SAPAC, Self-Administered Physical Activity Checklist; PARA-SCI, physical activity recall assessment for people with spinal cord injury; PASIPD, physical activity scale for individuals with physical disabilities; 7-dPArecord, 7-d physical activity record questionnaire; PASE, Physical Activity Scale for the Elderly; PHQ, Personal Habits Questionnaire; modPASE, modified Physical Activity Scale for the Elderly; CHAMPS, Community Health Activities Model Program for Seniors.
* All data in kJ/d.
Quality assessment
The quality of each eligible study was assessed using the Newcastle–Ottawa scale adapted for cross-sectional studies(Reference Herzog, Álvarez-Pasquin and Díaz24). This quality assessment was performed based on seven questions in three main domains including selection, comparability and outcome (online Supplementary Table S1).
Statistical analysis
In our meta-analysis, the means and standard deviations of the differences in TEE or AEE measured by PAQ and DLW (the study outcome) were pooled using the weighted averages of the mean differences. Between-study heterogeneity was assessed using Cochran’s Q test and I 2. According to previous research, we considered I 2 values of 25, 50 and 75 % as low, moderate and high heterogeneity, respectively(Reference Higgins, Thompson and Deeks25). Random-effects models (DerSimonian–Laird approach) were administered if heterogeneity was significant(Reference Mantel and Haenszel26). To explore potential sources of heterogeneity, we performed subgroup analysis with the following covariates: sex, age, BMI, disease and body fat. Age was categorised as <13, ≥13 and <24, ≥24 and <44, ≥44 and <64 and ≥65 years. Subgroup analysis according to type of diseases was also conducted by classifying studies based on the health status of the study population: healthy or having either chronic kidney disease or spinal cord injury. BMI (kg/m2) was classified as BMI < 18·5, 18·5 ≤ BMI < 25, 25 ≤ BMI < 30 and 30 ≤ BMI < 35 and BF % divided into the following groups 15 ≤ body fat < 25, 25 ≤ body fat < 35 and body fat ≥ 35. All statistical tests for this meta-analysis were performed using STATA software (version 14.0; Stata Corporation).
Results
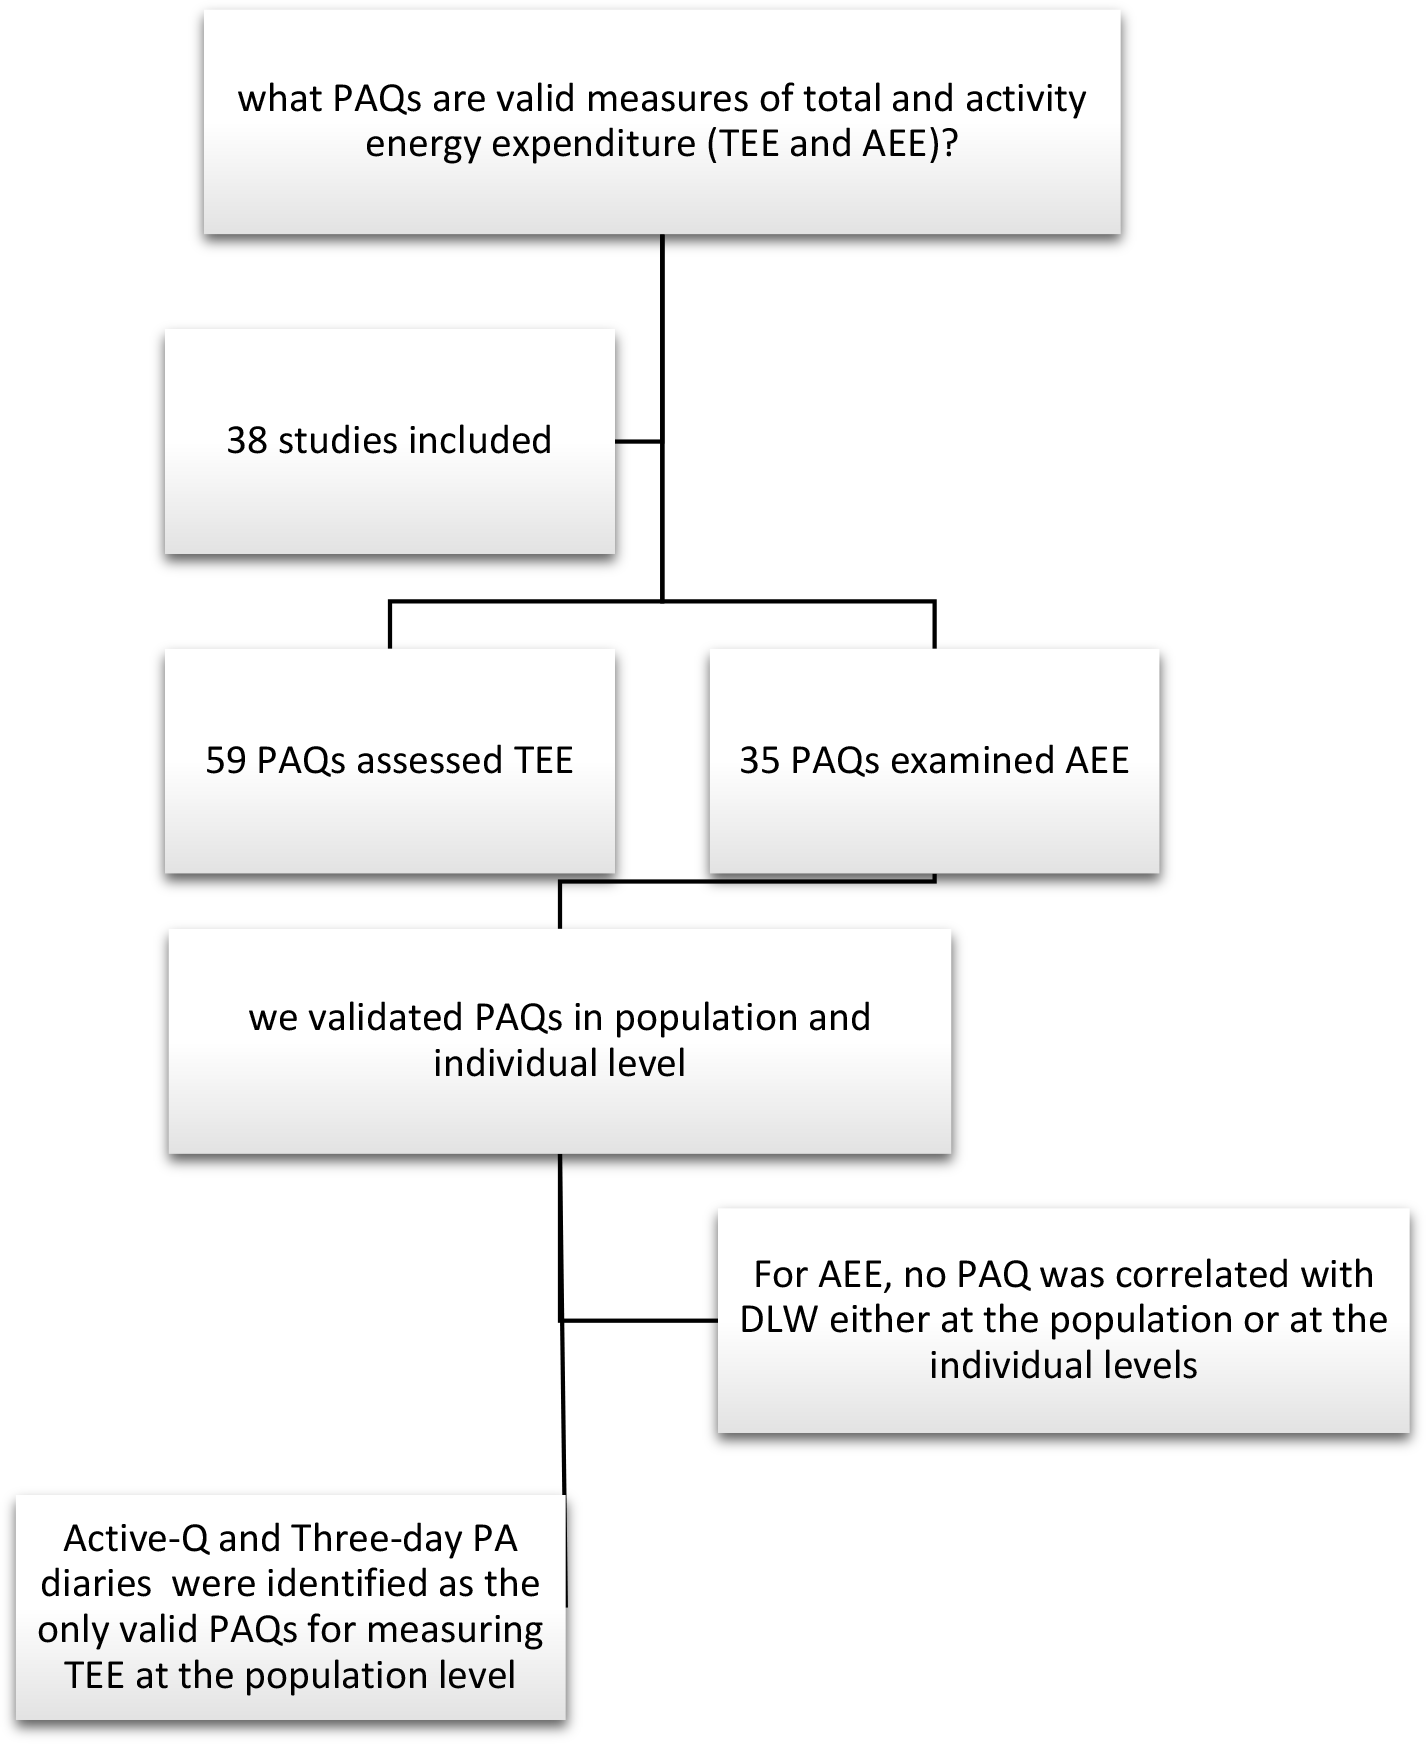
We identified 1780 studies of which sixty-nine were identified in PubMed and 1711 in Scopus and Google Scholar. A total of 113 studies remained after a preliminary title and abstract review, seventy-five records were excluded from our analysis since they did not report TEE or AEE (n 15) or did not validate self-report measures with DLW (n 31) or did not use PAQ (n 13) or reported AEE in an inappropriate way like PA score or metabolic equivalent category (n 16). In the end, thirty-eight articles met the inclusion criteria of our study and were considered for further assessment (Fig. 1).
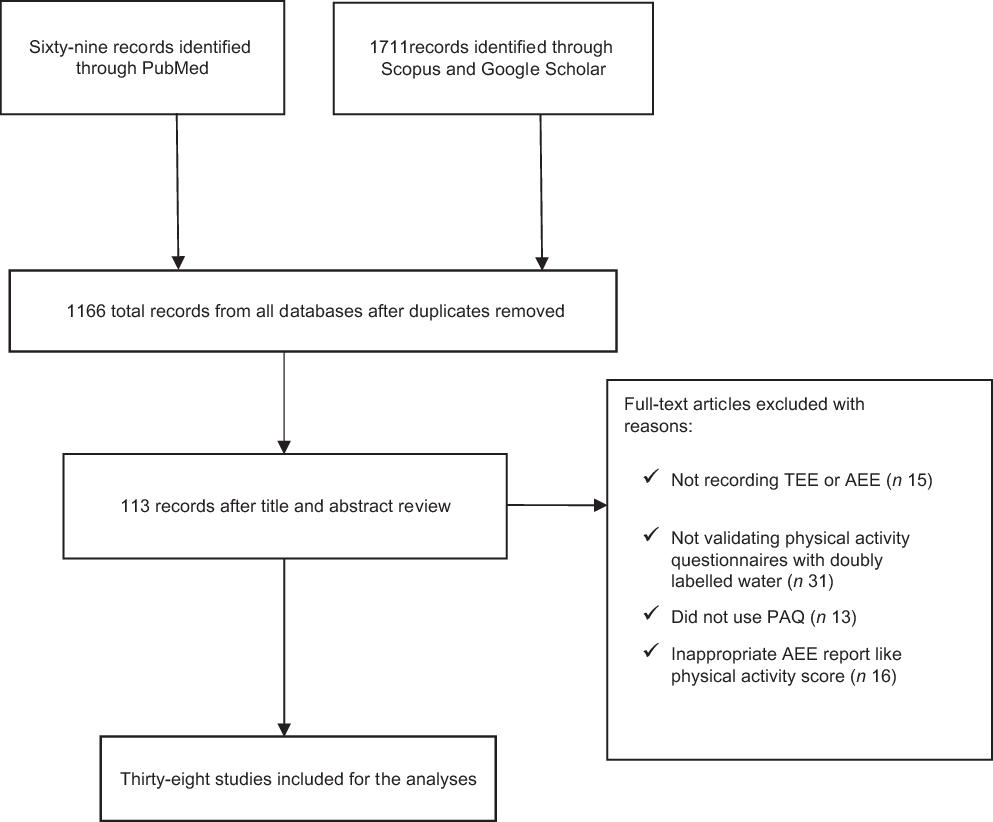
Fig. 1. Study selection process. TEE, total energy expenditure; AEE, activity energy expenditure; PAQ, physical activity questionnaire.
Study characteristics
The thirty-eight studies included 5997 individuals. There were seven studies performed in Sweden(Reference Arvidsson, Slinde and Hulthen27–Reference Hagfors, Westerterp and Skoldstam33), one in Australia(Reference Barnard, Tapsell and Davies34), one in France(Reference Bonnefoy, Normand and Pachiaudi35), seventeen in the USA(Reference Conway, Irwin and Ainsworth36–Reference Neuhouser, Di and Tinker50), one in Canada(Reference Csizmadi, Neilson and Kopciuk51), one in New Zealand(Reference Foley, Maddison and Rush52), one in Brazil(Reference Tanhoffer, Tanhoffer and Raymond53), three in the UK(Reference Besson, Brage and Jakes54–Reference Sridharan, Wong and Vilar56), one in China(Reference Liu, Woo and Tang57), one in India(Reference Corder, Brage and Wright58), two in the Netherlands(Reference Philippaerts, Westerterp and Lefevre59,Reference Johansson and Westerterp60) , one in Japan(Reference Ishikawa-Takata, Naito and Tanaka61) and one in Finland(Reference Pietilainen, Korkeila and Bogl62). For studies that included more than one PAQ, each of these PAQ was entered separately into our meta-analysis. Therefore, the total number of PAQ extracted for the analysis was seventy-eight. Of these, fifty-nine of the PAQ reported TEE and thirty-five of them reported AEE. Forty different PAQ were identified. Thirty-one PAQ included women only, twenty-five included men only and the remaining twenty-two included both sexes. The mean age of the study population that was reported in sixty-four studies using PAQ ranged from 8·2 to 73·4 years. The mean BMI that was recorded in fifty-seven studies using PAQ ranged from 16 to 34 kg/m2. The mean body fat that was recorded in forty-two studies ranged from 14 to 44 %.
Main analysis
Forest plots of the mean differences between the estimates of DLW and PAQ measures of TEE are shown in Fig. 2. The weighted mean difference (WMD) was not significant between TEEDLW − TEEPAQ (WMD –243, 95 % CI –841·4, 354·6), I 2 = 97·9 %, P < 0·0001). The mean differences between the estimates of AEEDLW and AEE PAQ are shown in Fig. 3. A significant difference was found between AEE examined by various indirect measures and the direct measures derived from DLW (WMD 414·6, 95 % CI 78·7, 750·5), I 2 = 92 %, P < 0·001) in which AEE assessed by DLW was higher than that of measured by PAQ.
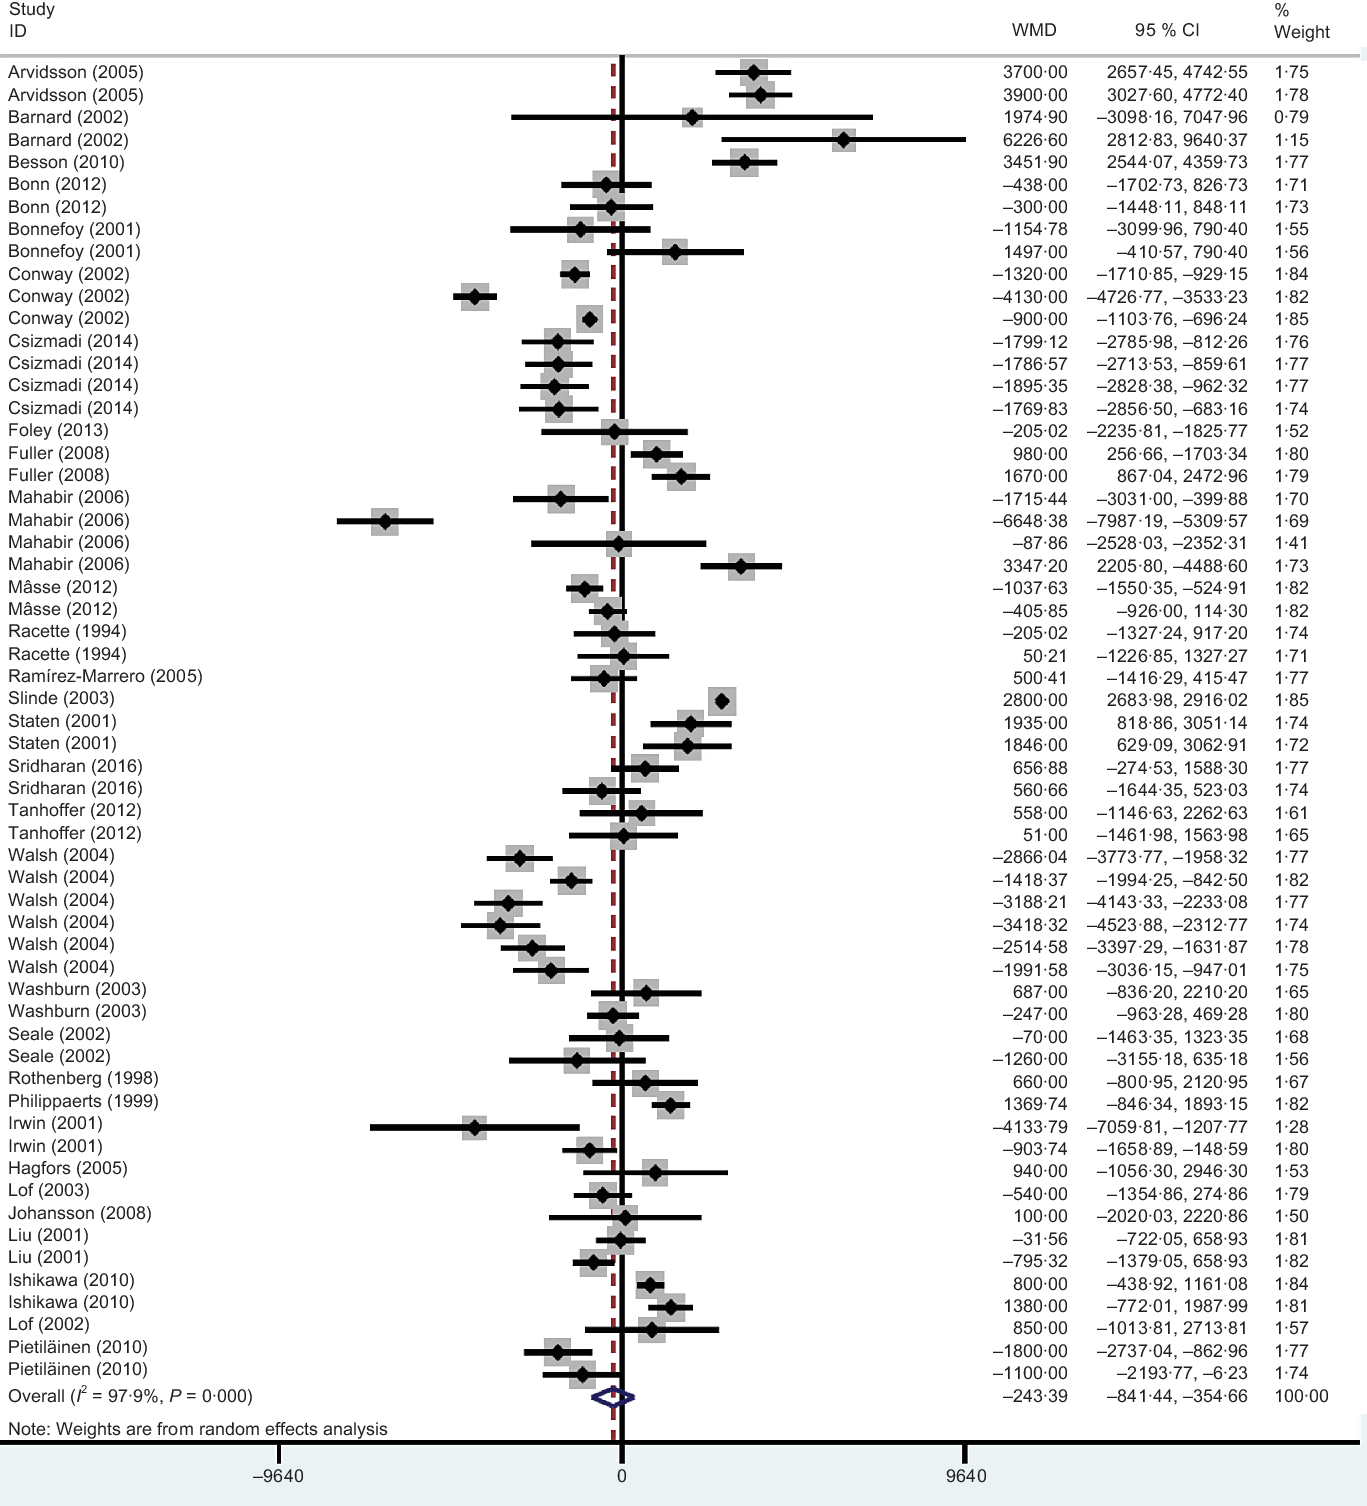
Fig. 2. Forest plot of mean differences of total energy expenditure (TEE) measured by the doubly labelled water method and TEE measured using physical activity questionnaires. WMD, weighted mean difference.
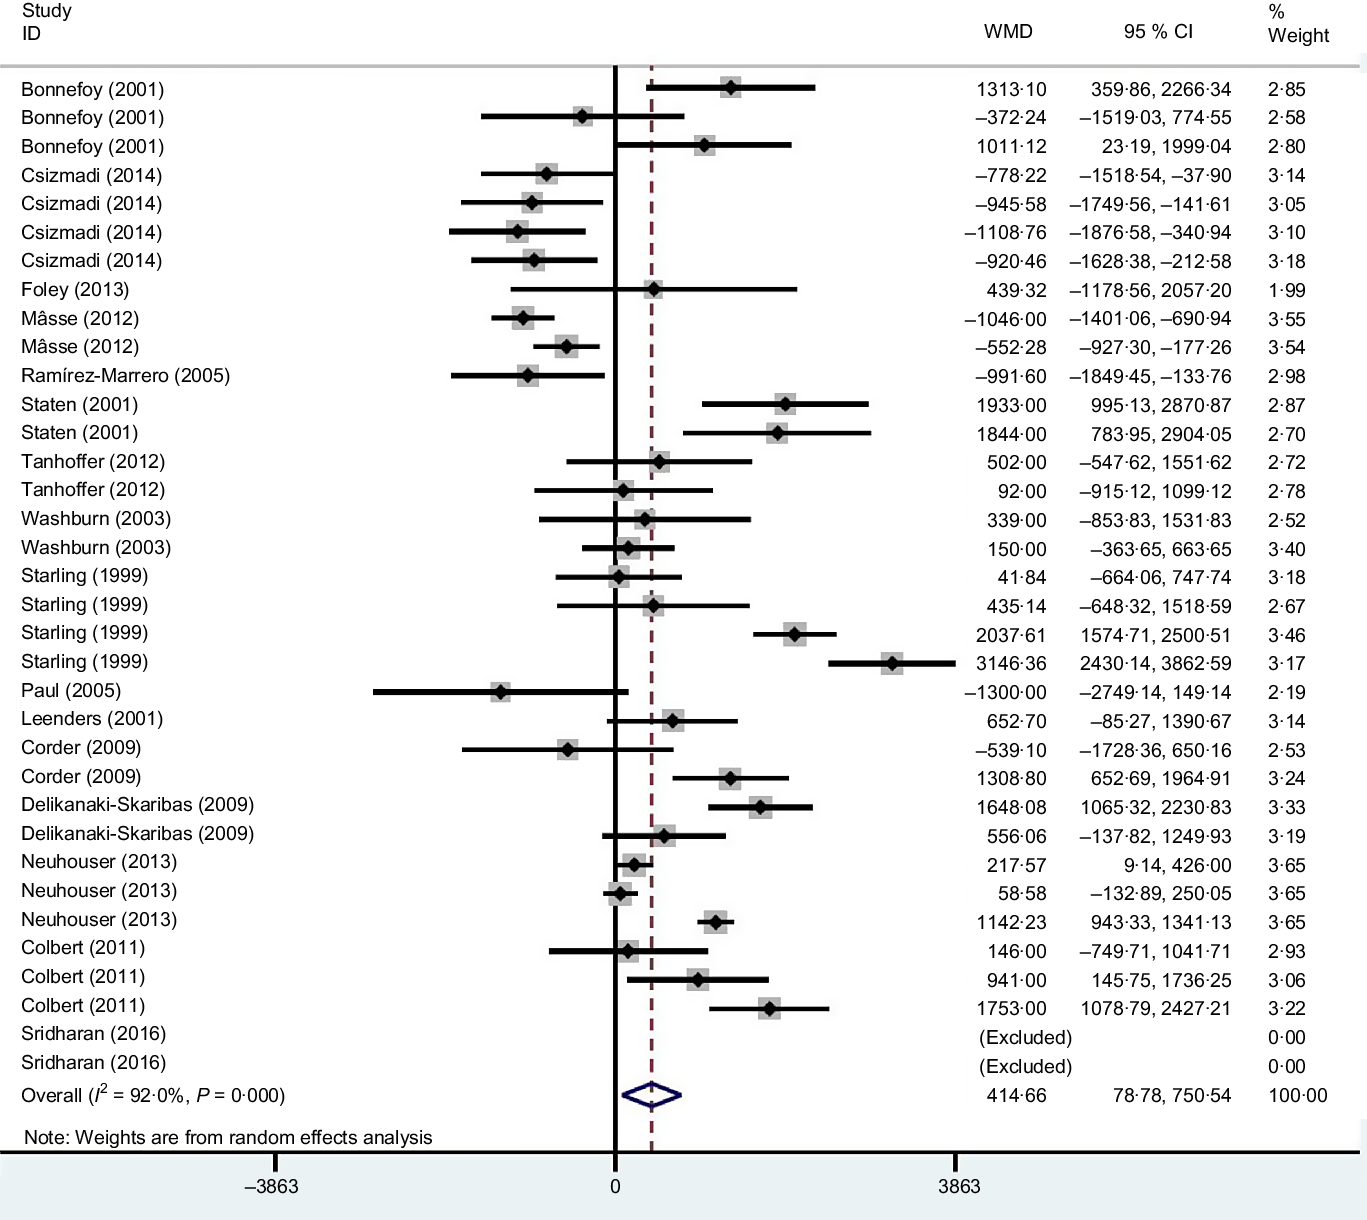
Fig. 3. Forest plot of mean differences of activity energy expenditure (AEE) measured by the doubly labelled water method and AEE measured using physical activity questionnaires. WMD, weighted mean difference.
Subgroup analysis
Since we observed significant between-study heterogeneity for both TEE and AEE, we examined possible sources of heterogeneity within the included studies using subgroup analyses. We conducted subgroup analysis to explore the effect of PAQ types on the mean difference between the estimates of TEE and AEE measured by DLW and PAQ (Tables 4 and 5). In thirteen studies that reported information at the individual level, agreement, only two of them showed good agreement. In the study that was conducted by Conway et al.(Reference Conway, Seale and Jacobs63) on twenty-four subjects, as well as in the study conducted by Sridharan et al. (Reference Sridharan, Wong and Vilar64), for ten subjects, the difference between TEEDLW and TEE 7-d physical activity record was <10 %. A Recent Physical Activity Questionnaire had a narrow limit of agreement with a mean bias of 451 kJ/d (6 %). At the group level, our findings indicated that heterogeneity disappeared in five subgroups of TEEPAQ types including Physical Activity Questionnaire for Adolescents, Active-Q, 7 d physical activity record, the Sedentary Time and Activity Reporting Questionnaire and 3-d PA diaries. Weighted mean differences of TEE were significant for Physical Activity Questionnaire for Adolescents, 7 d physical activity record, Sedentary Time and Activity Reporting Questionnaire and non-significant for Active-Q (0·403) and 3-d PA diaries (0·341). Active Q and 3-d PA diaries were the only PAQ where their estimated report of TEE was within the prespecified minimum difference with TEEDLW.
Table 4. Agreement between physical activity questionnaire (PAQ) and doubly labelled water (DLW) estimates of total energy expenditure (TEE) stratified by PAQ type (Mean values and 95 % confidence intervals)
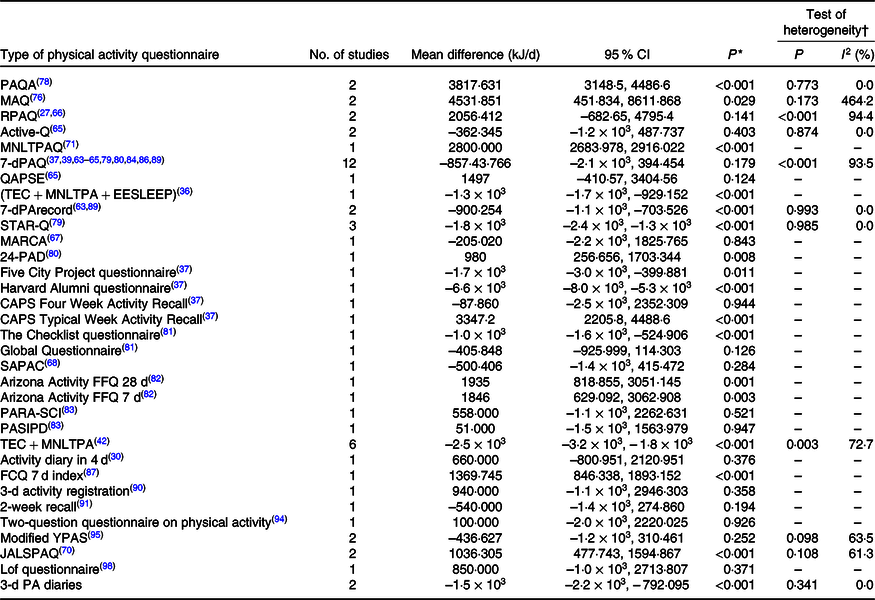
PAQA, Physical activity questionnaire for adolescents; MAQ, Modifiable Activity Questionnaire ; RPAQ, Recent Physical Activity Questionnaire ; 7-dPAQ, 7-d Physical Activity Recall Questionnaire; QAPSE, Questionnaire d’Activité Physique Saint-Etienne; TEC + MNLTPA + EESLEEP, (TEC, Tecumseh Occupational Activity Questionnaire) + (MNLTPA, Minnesota Leisure Time Physical Activity Questionnaire) + (EE SLEEP, EE from sleep); STAR-Q, Sedentary Time and Activity Reporting Questionnaire; MARCA, Multimedia Activity Recall for Children and Adolescents; 24-PAD, 24-h physical activity diaries; SAPAC, Self-Administered Physical Activity Checklist; PARA-SCI, physical activity recall assessment for people with spinal cord injury; PASIPD, physical activity scale for individuals with physical disabilities; CAPS, Cross-Cultural Activity Participation Study; JALSPAQ, the Japan Arteriosclerosis Longitudinal Study Physical Activity Questionnaire.
* P for the meta-analysis. P < 0·05 indicates a lack of agreement between PAQ and DLW estimates of TEE by using a random-effects model.
† P heterogeneity: heterogeneity was evaluated using Cochran’s test, and P < 0·5 indicates significant heterogeneity across studies.
Table 5. Agreement between physical activity questionnaire (PAQ) and doubly labelled water (DLW) estimates of activity energy expenditure (AEE) stratified by PAQ type (Mean values and 95 % confidence intervals)

MNLTPA, Minnesota Leisure Time Physical Activity Questionnaire; Modified YAPS, modified Yale Physical Activity Survey; STAR-Q, Sedentary Time and Activity Reporting Questionnaire; 7-dPAR, 7-d Physical Activity Recall Questionnaire; MARCA, Multimedia Activity Recall for Children and Adolescents; SAPAC, Self-Administered Physical Activity Checklist; PARA-SCI, physical activity recall assessment for people with spinal cord injury; PASIPD, physical activity scale for individuals with physical disabilities; 7-dPArecord, 7-d physical activity record questionnaire; PASE, Physical Activity Scale for the Elderly; PHQ, Personal Habits Questionnaire; CHAMPS, Community Health Activities Model Program for Seniors; modPASE, modified Physical Activity Scale for the Elderly.
Also, heterogeneity disappeared in one of the AEEPAQ types (Sedentary Time and Activity Reporting Questionnaire) but the WMD of AEE were significant for this questionnaire. Also, for AEE only eight studies reported information at the individual level and none of them showed acceptable agreement.
Additional subgroup analyses were also performed by comparing results grouped by sex, age, BMI, disease and body fat (Tables 6 and 7). Results showed that mean differences between PAQ and DLW to estimate TEE may be different based on age groups. Differences were significant only in those who were in the range of 13 < age < 24 years. Although BMI was not source of heterogeneity, there was significant difference between PAQ and DLW for estimating TEE in those who were overweight.
Table 6. Subgroup analysis of mean differences between physical activity questionnaire (PAQ) and doubly labelled water (DLW) estimates of total energy expenditure (TEE) stratified by identified study characteristics (Mean values and 95 % confidence intervals)
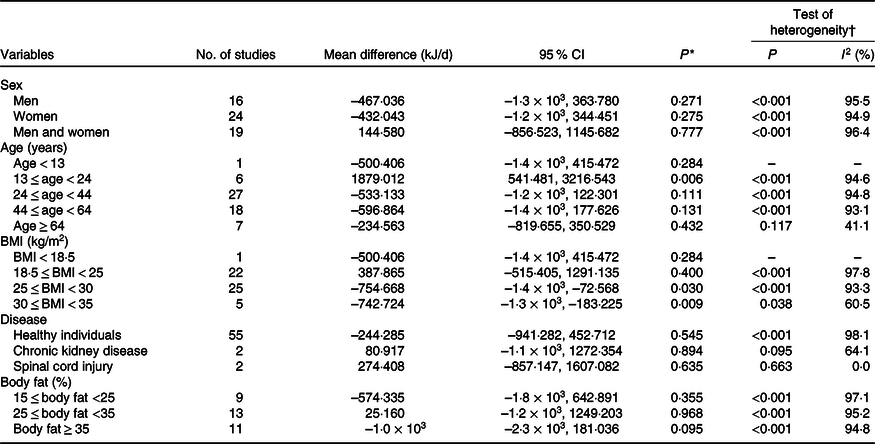
* P for the meta-analysis. P < 0·05 indicates a lack of agreement between PAQ and DLW estimates of TEE by using a random-effects model.
† P heterogeneity: heterogeneity was evaluated using Cochran’s test, and P < 0·5 indicates significant heterogeneity across studies.
Table 7. Subgroup analysis of mean differences between physical activity questionnaire (PAQ) and doubly labelled water (DLW) estimates of Activity energy expenditure (AEE) stratified by identified study characteristics (Mean values and 95 % confidence intervals)

* P for the meta-analysis. P < 0·05 indicates a lack of agreement between PAQ and DLW estimates of TEE by using a random-effects model.
† P heterogeneity: heterogeneity was evaluated using Cochran’s test, and P < 0·5 indicates significant heterogeneity across studies.
Subgroup analysis was performed to find potential sources of heterogeneity for the mean differences between PAQ and DLW estimates of AEE. Results showed that all the predefined criteria were potential sources of heterogeneity except for sex. According to the subgroup analysis, the greatest differences were observed in women, aged more than 44 years old, all categories of BMI except those who were overweight, healthy people and BF % between 25 < body fat < 35.
Discussion
In this meta-analysis, we identified Active-Q and 3-d PA diaries as indirect tools that had acceptable mean differences and heterogeneity for measuring TEE at the population level. Subgroup analyses showed that the WMD in TEE measured by PAQ and DLW was influenced by age and disease status, but not by sex and the BF %. Moreover, except for sex, all of other predefined criteria including age, disease status, BMI and BF % were potential sources of heterogeneity.
According to previous studies, a PAQ was considered useful for estimating TEE at population level for epidemiological study if the percentage difference in means between TEEDLW and TEEPAQ ((TEEDLW_TEEPAQ)/TEE_DLW) × 100 % was <10 % and correlations between these two estimations were >0·60(Reference Neilson, Robson and Friedenreich1). More precisely, there are some criteria that explain how good a PAQ is at the individual level and illustrate whether the questionnaire is good for clinical purposes. To compare two measurements methods, a Bland–Altman plot or ‘difference plot’ might be used. A wide limit of agreement in this method represents PAQ are not suitable for the clinical and individual purpose. Acceptable limit of agreement is defined as a 10 % of mean difference, for example, in the study by Bonn et al.(Reference Bonn, Lagerros and Christensen65), the Questionnaire d’Activité Physique Saint-Etienne questionnaire underestimated TEE by 1498 kJ/d (358 kcal/d) with limit of agreement –1075 to 1625 which means that the Questionnaire d’Activité Physique Saint-Etienne has wide limit of agreement for this purpose(Reference Neilson, Robson and Friedenreich1). In the small number of questionnaires validated against DLW, few studies have demonstrated Spearman correlation coefficients above 0·60 (Recent Physical Activity Questionnaire (r 0·67)(Reference Besson, Brage and Jakes66), Multimedia Activity Recall for Children and Adolescents (r 0·7)(Reference Foley, Maddison and Rush67), Self-Administered Physical Activity Checklist (r 0·6)(Reference Ramírez-Marrero, Smith and Sherman68), Minnesota Leisure Time Physical Activity Questionnaire (r 0·73)(Reference Slinde, Arvidsson and Sjoberg69), 3-d activity registration (r 0·98) and Japan Arteriosclerosis Longitudinal Study Physical Activity Questionnaire (r 0·742)(Reference Ishikawa-Takata, Naito and Tanaka70)).
To estimate AEE, we did not find any PAQ as a suitable measure. Moreover, none of the questionnaires estimating AEE showed acceptable correlation with DLW. Subgroup analyses showed that, in the AEEPAQ group, the WMD was influenced by age, disease status, BMI and BF %.
All the studies included in the review by Neilson et al.(Reference Neilson, Robson and Friedenreich1) were evaluated based on the two methods of finding a good PAQ for TEE and AEE estimation: correlation coefficient and mean difference. Also, these studies were divided into two groups: the first group included AEE and DLW, and the second group was composed of TEE and DLW. The emphasis in the review by Neilson et al.(Reference Neilson, Robson and Friedenreich1) was on the first group. Furthermore, in another study by Prince et al.(Reference Prince, Adamo and Hamel23), only AEE was compared with DLW. In our study, the difference between TEEDLW – TEEPAQ and AEEDLW – AEEPAQ was both evaluated and the included PAQ were further assessed using a classification based on their types. Previous reviews were limited by small sample sizes(Reference Neilson, Robson and Friedenreich1), sex (they included studies conducted exclusively on women) and age(Reference Neilson, Robson and Friedenreich1,Reference Prince, Adamo and Hamel23) . In our study, however, we did not have any limitation regarding these parameters.
Studies used both predicted and measured (assessed by indirect calorimetry) RMR for estimating TEE and AEE, but as PAQ are considered as feasible approaches to be used in epidemiological studies, it is more sensible to use predicted RMR (RMRp) rather than measured RMR(Reference Slinde, Arvidsson and Sjöberg71). To reduce the level of over and underestimation of TEE and AEE that are blinded to the use of PAQ in different population with diverse specifications, the best PAQ with the lowest mean differences with DLW should be identified and utilised in epidemiological studies.
There are several causes for over and underestimation of TEE and AEE that are measured with PAQ. First, most equations used to measure predicted RMR, overestimated the BMR compared with the indirect calorimetry, including Schofield(Reference Schofield72), Henry et al.(Reference Henry, Dyer and Ghusain-Choueiri73), WHO(74), Schofield BW (body weight) and ht (height)(Reference Schofield72) and WHO BW and ht(74) (in these equations, age is an essential parameter and some of them need height or weight for calculating RMR). On the other hand, Molnar’s equation(Reference Molnár, Jeges and Erhardt75) yielded a lower RMR compared with the indirect calorimetry. In fact, use of this equation is one of the important factors leading to an underestimation in TEE(Reference Prince, Adamo and Hamel23). Of the forty-six PAQ types which were assessed in our study, twenty-five underestimated and twenty-one overestimated TEE. Therefore, both underreporting and overreporting of activities were observed with respect to mean difference of (TEEDLW − TEEPAQ) and (AEEDLW − AEEPAQ). This pattern is inconsistent with self-reported food intake questionnaires in which underreporting is far more common. Second, consistent with our findings, Neilson et al.(Reference Neilson, Robson and Friedenreich1) revealed that lower body weight was associated with smaller mean differences between AEEPAQ and TEEDLW. Likewise, the study by Walsh et al.(Reference Walsh, Hunter and Sirikul42) demonstrated that the order of TEE overestimation (large mean differences between TEEPAQ and TEEDLW) in premenopausal women from highest to lowest was observed in overweight black, overweight white, lean white and lean black women. In fact, for overweight women, the TEE was overestimated 49 % more than normal weight control subjects(Reference Walsh, Hunter and Sirikul42). After weight loss, the TEE overestimation in white women was reduced by 48 %, whereas it did not significantly change in black women(Reference Walsh, Hunter and Sirikul42). Therefore, PAQ may not be a suitable tool for estimating TEE in black women. Another study conducted in obese women reported a TEE overestimation but following a 12-week weight-reducing diet, the participants underestimated TEE (the mean difference decreased from 205 kJ/d to 50 kJ/d). Third, all of the included articles used metabolic equivalent values for calculating TEE except for the studies by Barnard et al.(Reference Barnard, Tapsell and Davies76) and Bonnefoy et al.(Reference Bonnefoy, Normand and Pachiaudi35) (that used the physical activity level) and Walsh et al.(Reference Walsh, Hunter and Sirikul42) (that used the instructions described in the study by Montoye et al.)(Reference Montoye, Kemper and Saris77). In most PAQ, the use of metabolic equivalent values for estimating the energy expenditure of a particular activity is considered a limitation(Reference Walsh, Hunter and Sirikul42). When the metabolic equivalent value is administered for a specific activity, the same energy cost per kg of body weight is calculated for all participants, regardless of differences in metabolic rate and this might be the reason attributed to the decrease in TEE overestimation in obese women after weight loss(Reference Walsh, Hunter and Sirikul42).
For TEE, we observed that only two PAQ had the least mean difference with DLW and none of the PAQ showed good measure of AEE. This is because the magnitude of difference between PAQ and DLW estimates of TEE and AEE depends on some factors including the type of PAQ, the sex of the population on which the questionnaire was used and the number of activities measured by the PAQ. For instance, when the 7D-PAR was used, mean daily EE was overestimated in women while it was underestimated in men(Reference Neilson, Robson and Friedenreich1). Also, for the questionnaires Tecumseh Occupational (past year) and Minnesota Leisure Time (past month) which measured sleep and general activities, when watching television, reading and childcare activities were ignored from EE calculated by these questionnaires, an excellent agreement with DLW measure of TEE was obtained(Reference Conway, Irwin and Ainsworth36). As some PAQ do not estimate all physical activity especially in low-intensity level, an underreporting of AEE is anticipated(Reference Prince, Adamo and Hamel23). However, some PAQ like IPAQ and Physical Activity Questionnaire for Adolescents can capture low- to high-intensity level physical activities and the underreporting of TEE in these questionnaires is compensated by overreporting of vigorous physical activity(Reference Arvidsson, Slinde and Hulthén78).
In conclusion, our meta-analysis identified PAQ (Active-Q) and 3-d PA diaries that had sufficient validity for measuring TEE based on the mean correspondence in group level. However, as each of these questionnaires was used only in one study, we may conclude that this finding might be due to a chance and requires further verification. The present study provides evidence highlighting that the majority of PAQ compared with DLW might not be qualified tools for estimating TEE or AEE. Therefore, it is recommended that until further research is performed to investigate the agreement between direct and indirect measures of TEE and AEE, the use of either Active-Q and 3-d PA diaries or direct measurement methods in epidemiological studies might yield more reliable findings.
Acknowledgements
The authors would like to thank all research staff involved in the study, and Tehran University of Medical Science for financial support.
This article was financially supported by Tehran University of Medical Science.
The authors contributed equally to this work.
The authors have no conflicts of interest to disclose.
Supplementary material
For supplementary material referred to in this article, please visit https://doi.org/10.1017/S0007114520003049


