Vitamin E (VE), particularly its major congener α-tocopherol (αT), has been shown to regulate gene expression(Reference Azzi, Ricciarelli and Zingg1–Reference Brigelius-Flohe3). We have previously demonstrated that long-term dietary VE deficiency resulted in an increase in 5-α-steroid reductase type 1 (SRD5A1) mRNA levels, which was accompanied by changes in the plasma 5-dihydrotestosterone:testosterone ratio(Reference Barella, Muller and Schlachter4). Furthermore, VE deficiency significantly lowered mRNA levels of γ-glutamylcysteinyl synthetase (GCLM), which is the rate-limiting enzyme of glutathione synthesis. Rats fed the diets supplemented with αT exhibited 20 % higher hepatic GSH levels than the αT-depleted animals. Cellular GSH levels may influence epigenetic processes including DNA and histone methylation by limiting the availability of S-adenosylmethionine, which is the cofactor utilised during epigenetic control of gene expression by DNA and histone methyltransferases(Reference Hitchler and Domann5). Furthermore, demethylases require oxygen as a cofactor which links the cellular redox state to the epigenotype. DNA methylation consists of the addition of a methyl group to the 5′ position of cytosine in a cytosine-phospho-guanine (CpG) dinucleotide. Whereas most genomic DNA in mammals is deficient in CpG sites, clusters of CpG dinucleotides (CpG islands) are located in the promoter regions of >70 % of known rat genes(Reference Takai and Jones6). Thus, it seems likely that DNA methylation at CpG islands may constitute one means by which gene expression in laboratory rats is affected.
As αT influences redox-regulated gene expression, we have investigated whether diet-induced VE deficiency in rat liver is associated with alterations in global and specific DNA methylation.
Experimental methods
Experimental animal and diets
Two groups of eight male Fischer 344 rats each (mean body weight, 51 (sd 5) g, Charles River Laboratories, Sulzfeld, Germany) were randomly assigned to a VE-containing (VE+) or a VE-deficient (VE− ) semi-synthetic diet (ssniff Spezialdiaeten GmbH, Soest, Germany). All VE in the diets originated from native or antioxidant-stripped rapeseed oils, respectively, and were as follows (mg/kg diet; analysed by HPLC): VE− : αT, < 1; VE+: αT, 12. Tocopherols were quantified by HPLC with fluorescence detection(Reference Augustin, Blank and Boesch-Saadatmandi7).
The rats had free access to tap water and the experimental diets throughout the experiment, and were housed in pairs in a conditioned room (temperature, 22 ± 2°C; relative humidity, 55 %; 12 h light–12 h dark cycle). The animal experiment was conducted in accordance with the German regulations on animal care and with the permission of the responsible authority. After 6 months, the rats were fasted for 12 h before CO2 anaesthesia and decapitation. The liver was excised and dissected: one part was stored in RNAlater (Qiagen, Hilden, Germany), and the remainder was snap-frozen in liquid nitrogen and stored at − 80°C until used.
Real-time quantitative real time-PCR
Total RNA was isolated from rat liver according to the RNeasy Lipid-tissue Protocol (Qiagen) with primer pairs as described(Reference Gaedicke, Zhang and Schmelzer8). One-step quantitative real time-PCR was carried out using the QuantiTect SYBR Green RT-PCR kit (Qiagen), and measured in a Rotor-Gene 3000 thermocycler (Corbett Research, Sydney, Australia). Relative mRNA concentrations were normalised to the housekeeping gene β-actin.
Promoter DNA methylation analysis
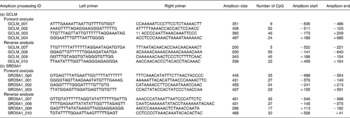
The presence of CpG islands within the SRD5A1 and GCLM genes was predicted using The European Molecular Biology Open Software Suite CpGplot. Quantitative methylation analysis of the two genes was performed with the MassARRAY® system (Sequenom, Hamburg, Germany) at BioGlobe (Hamburg, Germany). The MassCLEAVE™ biochemistry was applied after bisulphite treatment of DNA samples and matrix-assisted laser desorption ionisation time-of-flight MS for analyte detection according to the standard protocols recommended by the supplier. Genomic DNA was extracted from rat liver using the DNeasy Kit (Qiagen). One microgram of DNA was treated with sodium bisulfite (DNA Bisulfite Treatment Kit, Sequenom), and target regions of the modified nucleic acid were amplified by PCR using methylation-independent primers, which were designed by the MassARRAY platform-specific EpiDesigner software (Table 1). The PCR products were then subjected to in vitro transcription, with the RNase A cleavage being used for the T-reverse reaction (Sequenom). The generated fragments were displayed based on their molecular weight in the mass spectrum, which was acquired after sample conditioning with a MassARRAY® Analyzer Compact. The resulting methylation calls were analysed with EpiTyper software (Sequenom) to generate quantitative results for each CpG site.
Table 1 PCR primers for the analysis of the methylation status of (a) γ-glutamylcysteinyl synthetase (GCLM) and (b) 5-α-steroid reductase type 1 (SRD5A1) gene promoters*

ID, identity; CpG, cytosine-phospho-guanine.
* All positions are relative to the transcription start.
DNA global methylation analysis
Tissue DNA was extracted using the DNeasy Tissue Kit (Qiagen) including RNase treatment. The extracted DNA was quantified using Quant-iT™ PicoGreen® dsDNA kit (Invitrogen, Karlsruhe, Germany). For each sample, methylation analysis was performed in duplicate aliquots (100 ng DNA each) using anti-methylated cytosine antibody-based Methylamp™ Global DNA Methylation Quantification Kit (Epigentek, Brooklyn, NY, USA) as well as Imprint™ Methylated DNA Quantification Kit (Sigma Aldrich, Darmstadt, Germany). DNA methylation status was compared to an artificially fully methylated DNA standard supplied with each kit. The levels of methylated DNA were then proportional to the optical density intensity on a microplate reader at 450 nm (Spectra Max 190, Molecular Devices, Ismaning, Germany).
In different animal species, the spectrum of methylation levels and patterns is very broad. At the low extreme is the nematode worm Caenorhabditis elegans, whose genome lacks detectable methylated cytosine and does not encode a conventional DNA methyltransferase(Reference Bird9). Thus, DNA from C. elegans was chosen to serve as a negative control for methylation pattern. In fact, the global DNA methylation of C. elegans was low (44·1 (sd 11·0) %), which was considered as the background level. Furthermore, we could confirm differences in the relative global DNA methylation patterns between different rat tissues such as brain (152·7 (sd 5·5) %, relative to rat liver) and testes (100·3 (sd 20·1) %, relative to rat liver). This finding is in accordance with previous data reported by Wallwork & Duerre(Reference Wallwork and Duerre10).
Statistical analysis
Results are expressed as the means and standard deviations for each group of rats. Differences among groups were analysed by Student's unpaired two-tailed t test. P values < 0·05 were considered significant.
Results
Liver vitamin E content, gene expression and promoter methylation of 5-α-steroid reductase type 1 and γ-glutamylcysteinyl synthetase
Neither symptoms of ataxia nor differences in feed intake and live weight gain were observed in rats fed VE− or VE-sufficient (VE+) diets for 24 weeks (data not shown), which is in agreement with previous results(Reference Barella, Muller and Schlachter4). As anticipated, hepatic αT levels were significantly (P < 0·001, n 4 rats) reduced inthe VE− rats (0·312 (sd 0·045) nmol/g) than in the VE+ rats (27·4 (sd 1·53) nmol/g). Furthermore, plasma αT levels were significantly (P < 0·001) lower in VE− (0·355 (sd 0·011) μmol/l) v. VE+(17·8 (sd 0·93) μmol/l) rats.
Differences in αT in the liver of rats have been previously shown to modulate relative mRNA levels of several VE-sensitive genes(Reference Barella, Muller and Schlachter4, Reference Gaedicke, Zhang and Schmelzer8). Out of these, we have chosen to determine the mRNA levels of SRD5A1 and GCLM genes via quantitative real time-PCR, as they show putative CpG islands in the 5′ region, which could suggest regulatory functions through methylation in this area. In the present study, we have found a significant (P = 0·0038) twofold induction in relative mRNA concentrations of SRD5A1 gene from 0·85 (sd 0·12) in VE+ animals to 1·65 (sd 0·33) in VE− animals. Contrarily, VE deficiency significantly (P = 0·0057) reduced relative mRNA levels of GCLM from 1·58 (sd 0·35) to 0·74 (sd 0·2).
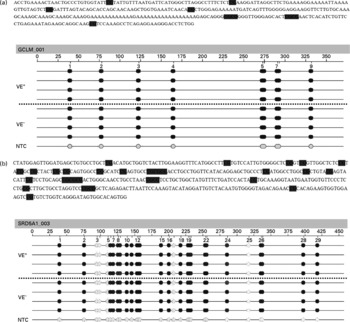
The effects of a VE− diet on the methylation of CpG islands in the promoter regions of SRD5A1 and GCLM genes in rat liver were examined by quantitative analysis of DNA methylation based on matrix-assisted laser desorption ionisation time-of-flight MS. Such an analysis at 130 (sense orientation) and 107 (antisense orientation) CpG units, spanning nucleotides − 1500 to +674 for GCLM (Fig. 1(a)) and − 1000 to +1796 for SRD5A1 (Fig. 1(b)), revealed that all samples showed a similar signal pattern. Thus, no (significant) differences in the promoter methylation of SRD5A1 and GCLM between VE+ and VE− rats could be detected.

Fig. 1 Epigram of quantitative methylation analysis of promoter region. Genomic DNA isolated from the liver of vitamin E (VE)-sufficient (VE+, n 4) and VE-deficient (VE− , n 4) rats was analysed for methylation status of 237 (sense and antisense) cytosine-phospho-guanine (CpG) sites of the (a) γ-glutamylcysteinyl synthetase (GCLM) and (b) 5-α-steroid reductase type 1 (SRD5A1) gene promoters. Exemplary data for one amplicon for each gene are shown. The grey dots indicate the software-determined methylation ratio at each analysed CpG unit for each sample. The reference sequence above the epigram corresponds to the genomic sequence of the analysed strand. The sense orientation in 5′ → 3′ direction is displayed. Base numbering in the epigram refers to the analysed amplicon. NTC, non-template control. 0 % ![]() 100 %,
100 %, ![]() , not analysed.
, not analysed.
Global DNA methylation
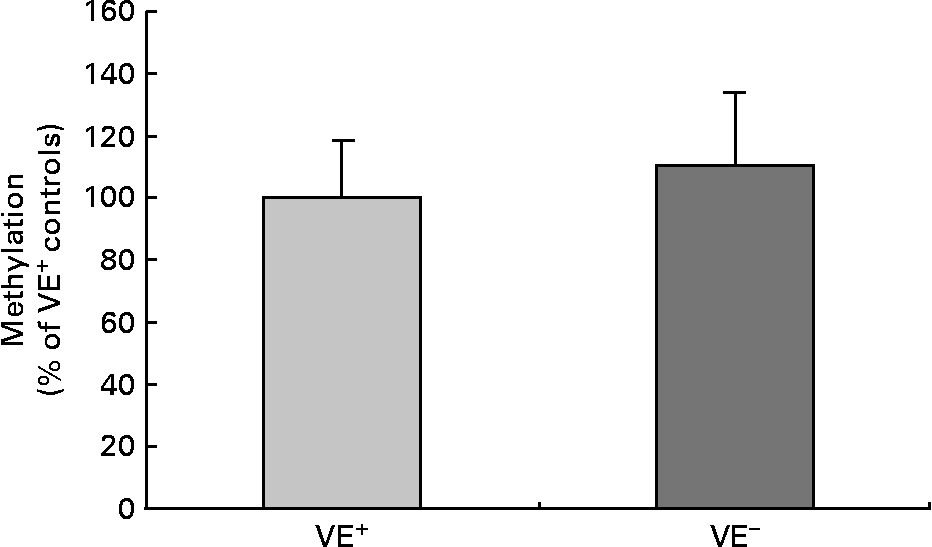
Fig. 2 shows global cytosine methylation levels in DNA samples of controls and VE− rat liver. DNA global methylation of 110·2 (sd 24·0) % was detected in VE− rat liver as compared with controls (100·0 (sd 18·4) %). DNA methylation was determined by two independent global methylation assays, which turned out similar data. No significant differences in DNA global methylation levels in VE− rat liver compared to VE+ rat liver were evident.

Fig. 2 Effects of vitamin E (VE) deficiency on global DNA methylation in rat liver. Global levels of cytosine methylation in DNA samples of controls VE-sufficient (VE+) and VE-deficient (VE− ) rat liver, each expressed as percentage relative to the methylation signal in methylated DNA standard. Values are represented as means and standard deviations (n 8).
Discussion
Research on the role of essential micronutrients in the epigenetic regulation of gene expression is an area of increasingly recognised importance. Zn deficiency has been described to reduce the utilisation of methyl groups from S-adenosylmethionine in rat liver, which resulted in genomic DNA hypomethylation as well as in histone hypomethylation(Reference Caudill, Wang and Melnyk11, Reference Dreosti12). Dietary deficiency of selenium decreased genomic DNA methylation in Caco-2 cells and in the rat liver and colon(Reference Davis, Uthus and Finley13, Reference El-Bayoumy14), and vitamin C deficiency has been associated with DNA hypermethylation in lung cancer cells(Reference Piyathilake, Bell and Johanning15, Reference Halliwell16). The role of VE in DNA methylation, however, is less clearly defined, although VE-dependent gene expression has been demonstrated(Reference Barella, Muller and Schlachter4, Reference Gaedicke, Zhang and Schmelzer8, Reference Ricciarelli, Zingg and Azzi17).
Based on previous results, we have investigated the methylation-dependent epigenetic regulation of the SRD5A1 gene and the regulatory subunit GCLM gene as well as the total DNA methylation in VE− and VE+ rat liver. SRD5A1 and GCLM represent two out of four genes which were shown to be differentially regulated in the rat liver transcriptome in response to dietary VE deficiency(Reference Barella, Muller and Schlachter4). Both the genes exhibit CpG islands, and were therefore selected for DNA methylation analysis. Since the other two VE-sensitive genes, namely coagulation factor IX and scavenger receptor CD36, exhibit no CpG islands, these transcripts were not further considered for DNA methylation analysis.
As transcriptional variation has been correlated with CpG island methylation in cells(Reference Shen, Kondo and Guo18), we analysed for promoter methylation in putative CpG island regions located at the 5′ end in these two genes using base-specific cleavage and matrix-assisted laser desorption ionisation time-of-flight MS. Overall, the present results indicate that DNA methylation does not contribute directly to the regulation of SRD5A1 and GCLM gene expression in VE− rat liver.
In VE− rats, Morante et al. (Reference Morante, Sandoval and Gomez-Cabrera19) have shown that NF-κB directly regulates transcription of γ-glutamylcysteine synthetase (both subunits) through the binding of NF-κB to the corresponding gene promoters, which was enhanced in VE deficiency. Furthermore, it has been demonstrated that VE affects steroidogenesis, which in turn may affect SRD5A1 mRNA levels(Reference Barella, Rota and Stocklin20). Thus, VE-induced changes in SRD5A1 and GCLM gene expression in hepatocytes seem to be regulated by mechanisms others than promoter DNA methylation. Furthermore, it is possible that differences in gene expression of SRD5A1 and GCLM may involve intragenic CpG islands rather than promoter CpG islands(Reference Yamada, Watanabe and Miura21, Reference Ching, Maunakea and Jun22). A recent study in human subjects(Reference Eckhardt, Lewin and Cortese23) identified a considerable number of tissue-specific differentially methylated regions in CpG islands among the 873 genes analysed, but these were preferentially located several kb away from the transcription start site of the associated genes. Therefore, it cannot be ruled out that methylation other than that in the promoter region, as investigated in the present study, has led to differences in gene expression. Having this in mind, a global DNA methylation analysis was performed in rat liver. The analysis of global DNA methylation provides information on the degree of DNA methylation that occurs primarily in the repetitive, non-coding and non-regulatory sequences(Reference Kovacheva, Mellott and Davison24). Nevertheless, we could not detect any significant differences in global methylation pattern between the two dietary groups. Thus, expression of the SRD5A1 and GCLM genes during VE deficiency does not appear to be directly regulated by DNA methylation in the promoter region. It is possible that epigenetic modification of histones by acetylation, methylation, phosphorylation, ubiquitination, sumoylation or isomerisation(Reference Shilatifard25, Reference Berger26) contributes to the regulation of the expression of genes associated with VE deficiency.
Acknowledgements
G. R. is supported by a grant (no. 528/051) from the Union zur Foerderung von Oel- und Proteinpflanzen e.V. G. R. and F. D. are supported by the Deutsche Forschungsgemeinschaft Cluster of Excellence ‘Inflammation at Interfaces’. G. R. designed the study. A. F., F. D. and G. R. wrote the manuscript. S. G. performed the feeding trail. A. F. performed the DNA methylation, and J. F. performed the VE analysis. None of the authors has a known conflict of interest.


